Use the form below to select from a collection of monthly summaries recapping climate-related occurrences on both a global and national scale.
Drought ReportMay 2023

Issued 13 June 2023
Detailed Drought Overview
The atmospheric circulation over North America during May 2023 was dominated by an upper-level high-pressure ridge. The ridge oscillated west to east throughout the month as upper-level shortwave troughs and closed lows migrated through the jet stream flow. The troughs and lows frequently got stuck in the southwestern CONUS as they ran up against the strong high-pressure ridge. This generated areas of above-normal precipitation across parts of the West, but also produced a southerly flow across the Great Plains that drew in Gulf of Mexico moisture, resulting in above-normal precipitation over western portions of the Plains. The ridge manifested itself most strongly over central Canada to northern portions of the CONUS. This allowed surface fronts and lows, and later in the month some upper-level lows, to track across southern portions of the CONUS. These weather systems generated areas of above-normal precipitation across the Gulf of Mexico Coast and Southeast. But the ridge kept most of the CONUS drier than normal. Monthly temperatures averaged warmer than normal from the Pacific Northwest to Upper Mississippi Valley, where the ridge manifested itself most strongly. Cold fronts and troughs gave parts of the Southwest, and much of the CONUS east of the Mississippi River, a cooler-than-normal month. The upper-level ridge extended over eastern and northern Alaska, giving those parts of the state a warmer-than-normal month, while an upper-level trough over the west resulted in a cooler-than-normal month for west and southwest Alaska. This pattern created wetter-than-normal conditions for most of the state, although there some stations that were drier than normal for the month. Drier-than-normal conditions dominated the U.S. Virgin Islands and much of Puerto Rico, while Hawaii had a mixed precipitation anomaly pattern.
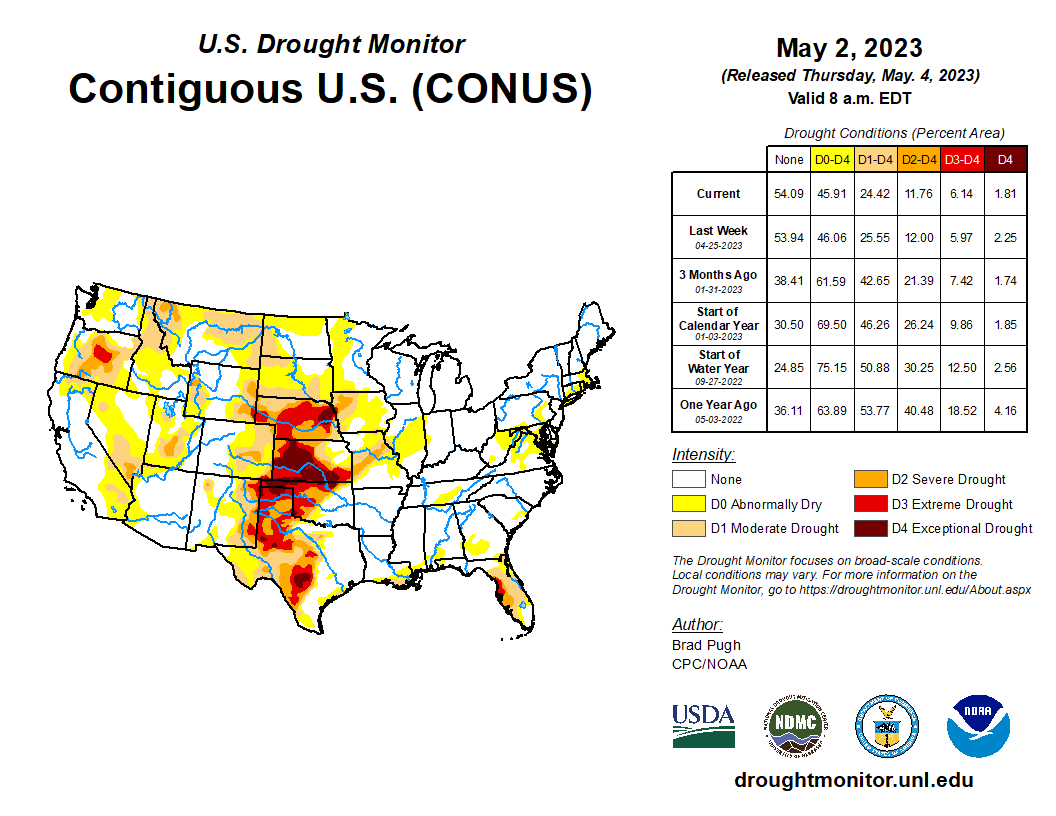
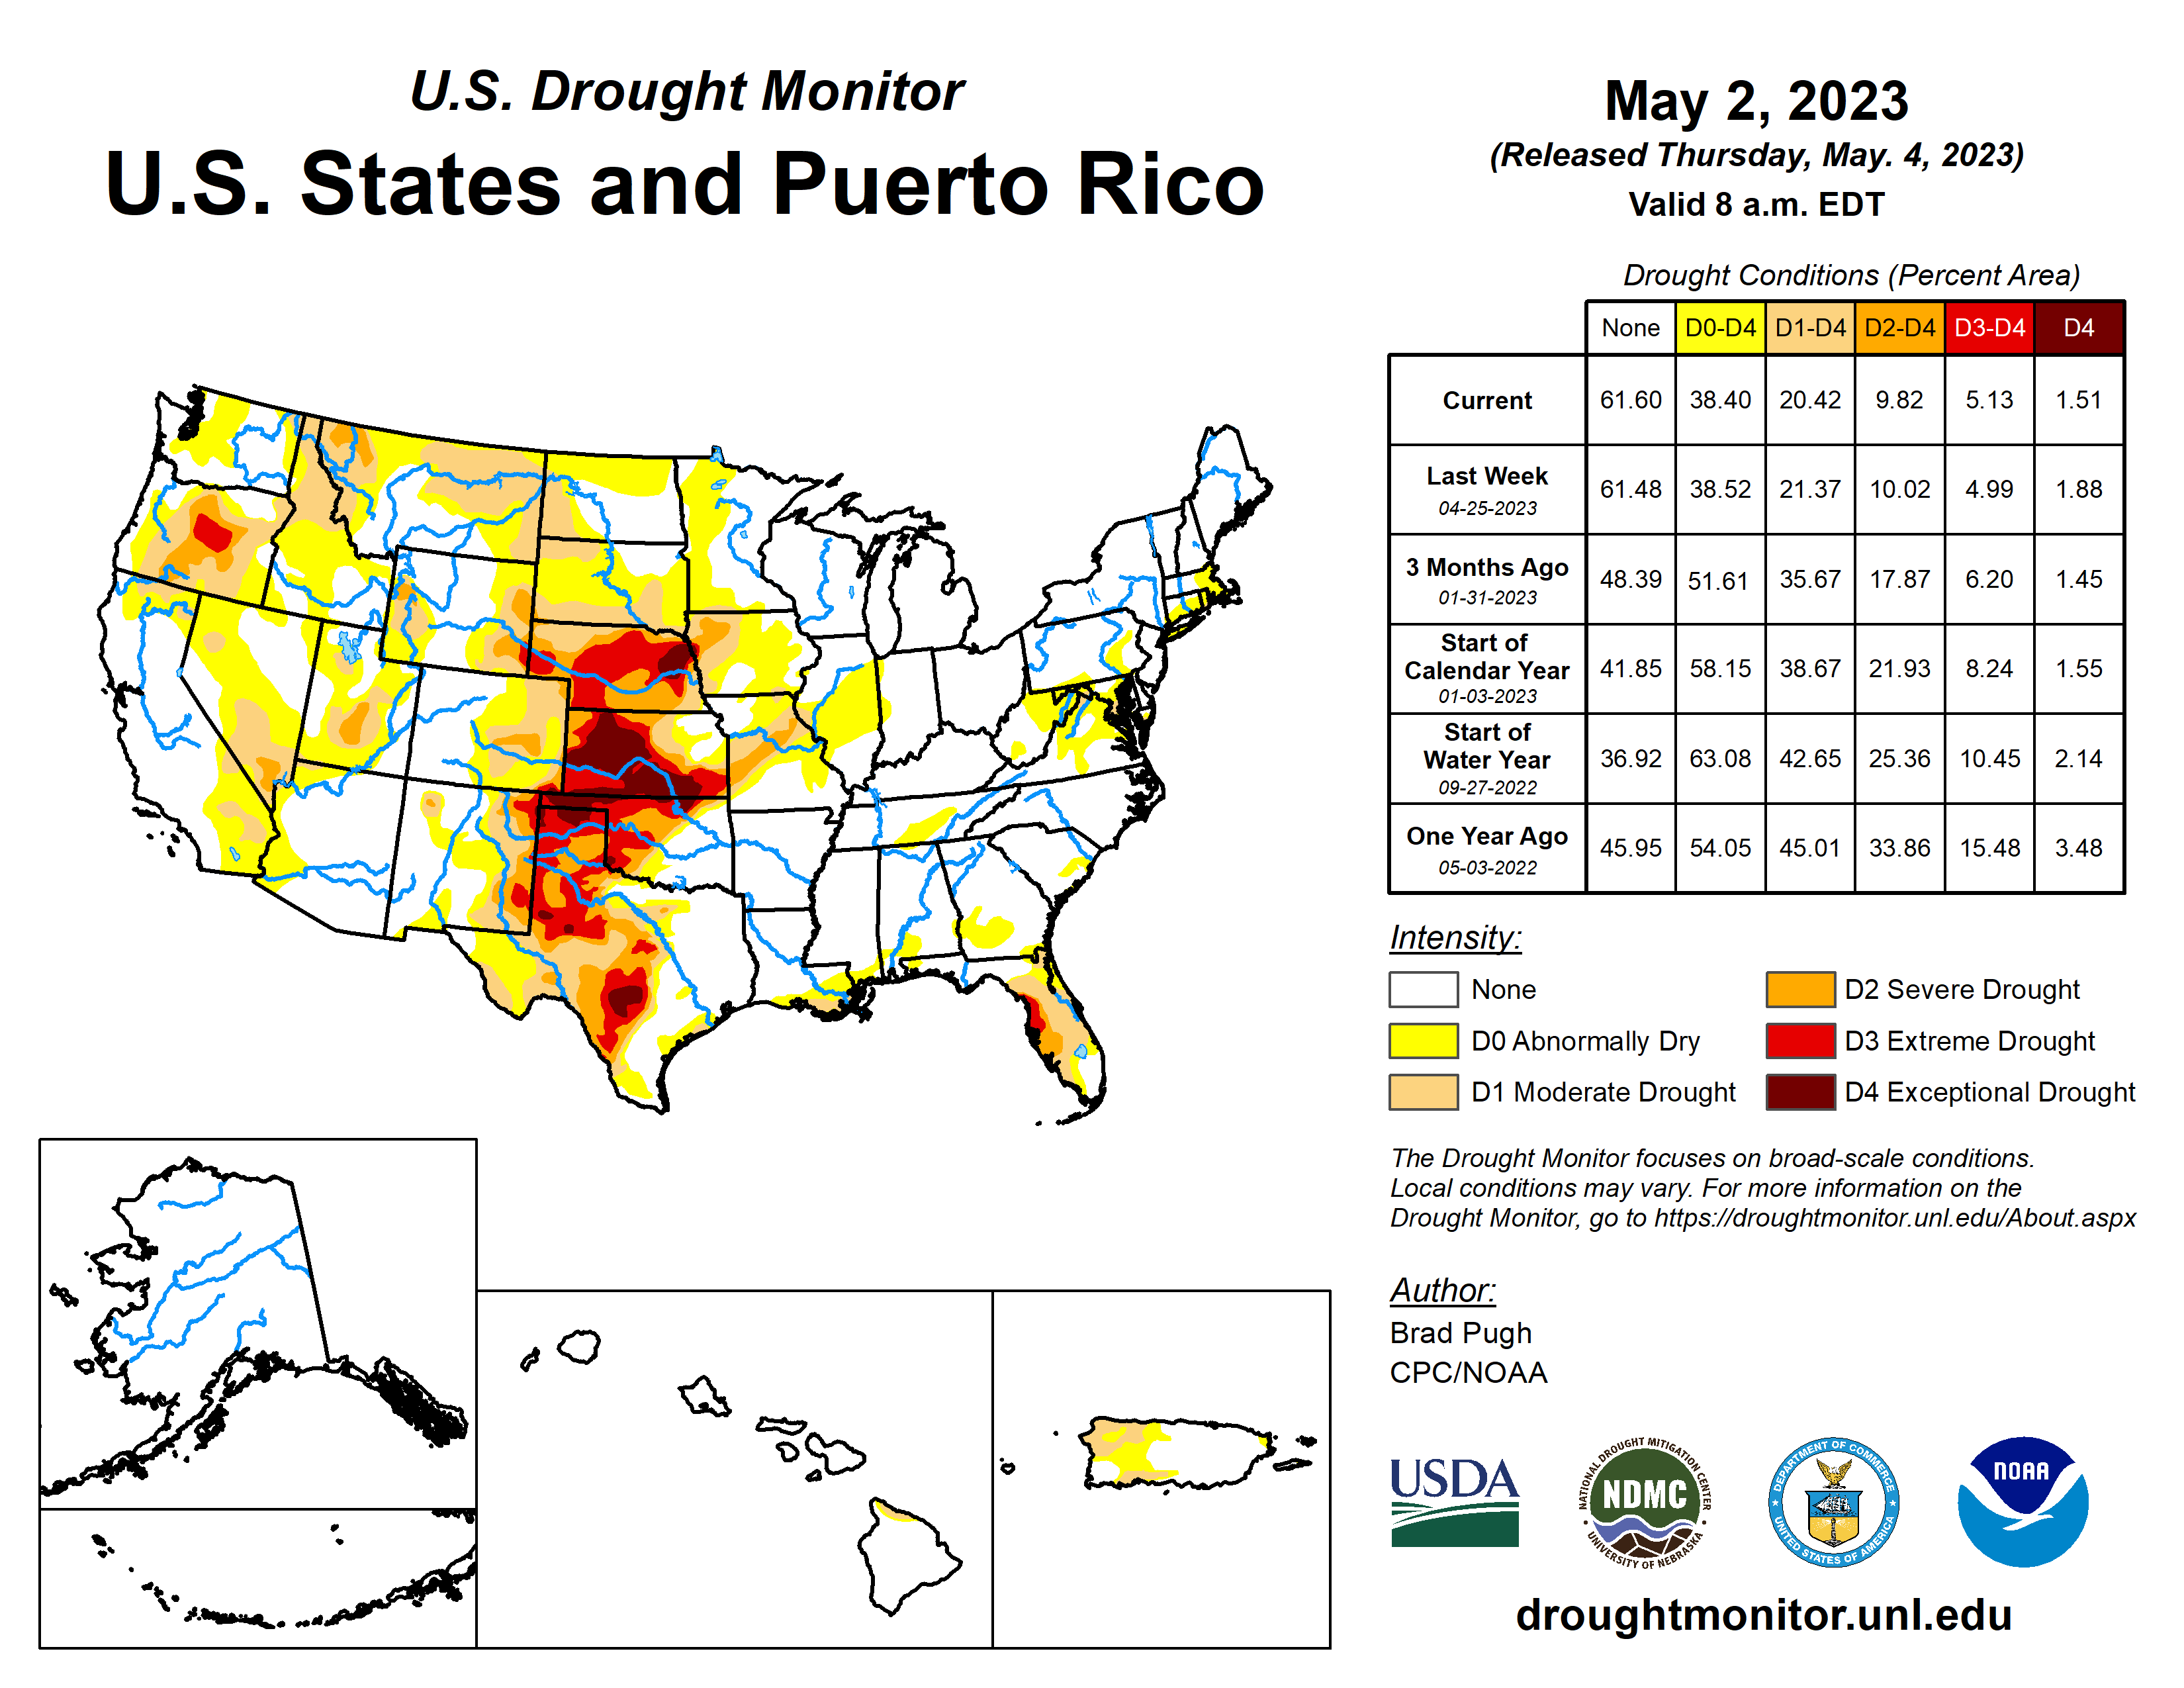
The above-normal precipitation resulted in contraction or reduction of the intensity of drought over parts of the Pacific Northwest and Great Basin, much of the Florida Peninsula, and extensive areas of the western Great Plains. Unusually hot conditions over the Pacific Northwest and northern Rockies increased evapotranspiration, resulting in expansion or intensification of drought or abnormal dryness in those areas that were drier than normal. Significant expansion or intensification of drought and abnormal dryness occurred across the Midwest and Northeast, and parts of the central Plains, where very dry conditions continued or developed. Drought or abnormal dryness expanded over parts of Hawaii and Puerto Rico and contracted over other parts of these islands. Drought contraction exceeded expansion with the USDM-based national moderate-to-exceptional drought footprint across the CONUS decreasing from 24.4% at the end of April to 19.0% at the end of May (from 20.4% to 15.8% for the 50 states and Puerto Rico).
According to the Palmer Drought Index, which goes back to the beginning of the 20th century, about 15.9% of the CONUS was in moderate to extreme drought at the end of May, which is a slight increase compared to the end of April.
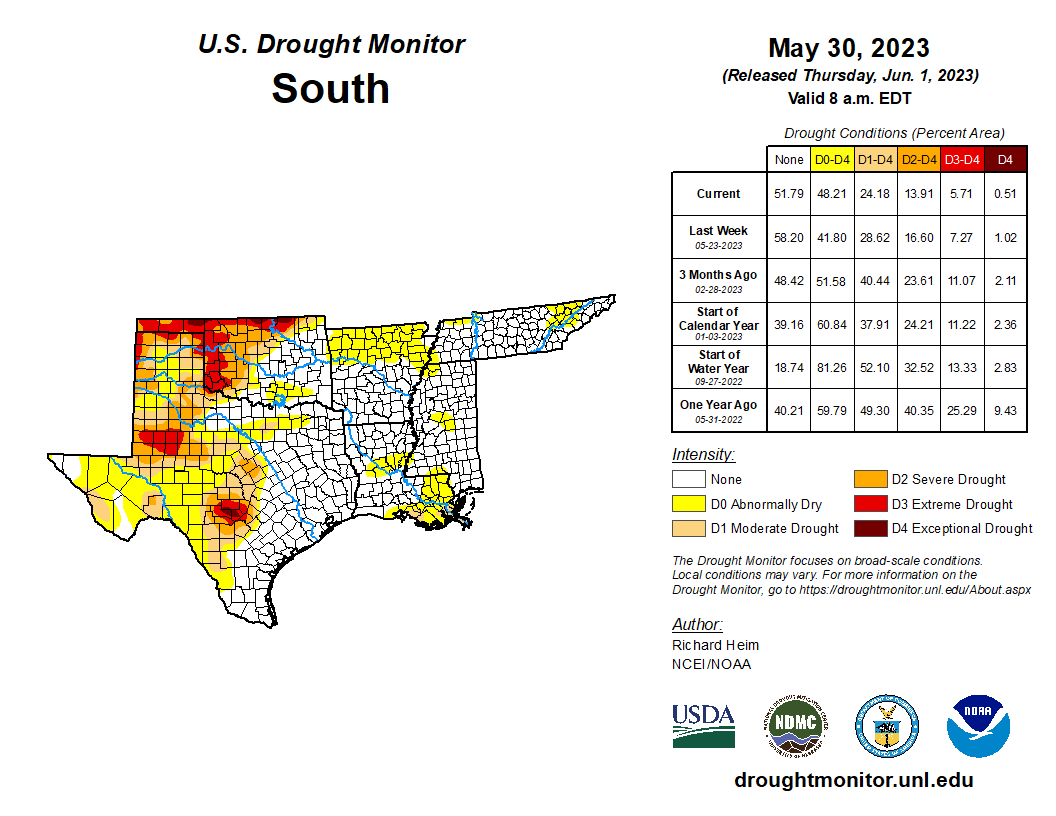
Drought conditions at the end of May, as depicted on the May 30, 2023 USDM map, included the following core drought and abnormally dry areas:
- Areas of moderate (D1) to severe (D2) drought remain across the West. The percent area of the Western U.S. experiencing moderate to exceptional drought, according to USDM statistics, fell from 25.2% at the end of April to 17.0% at the end of May.
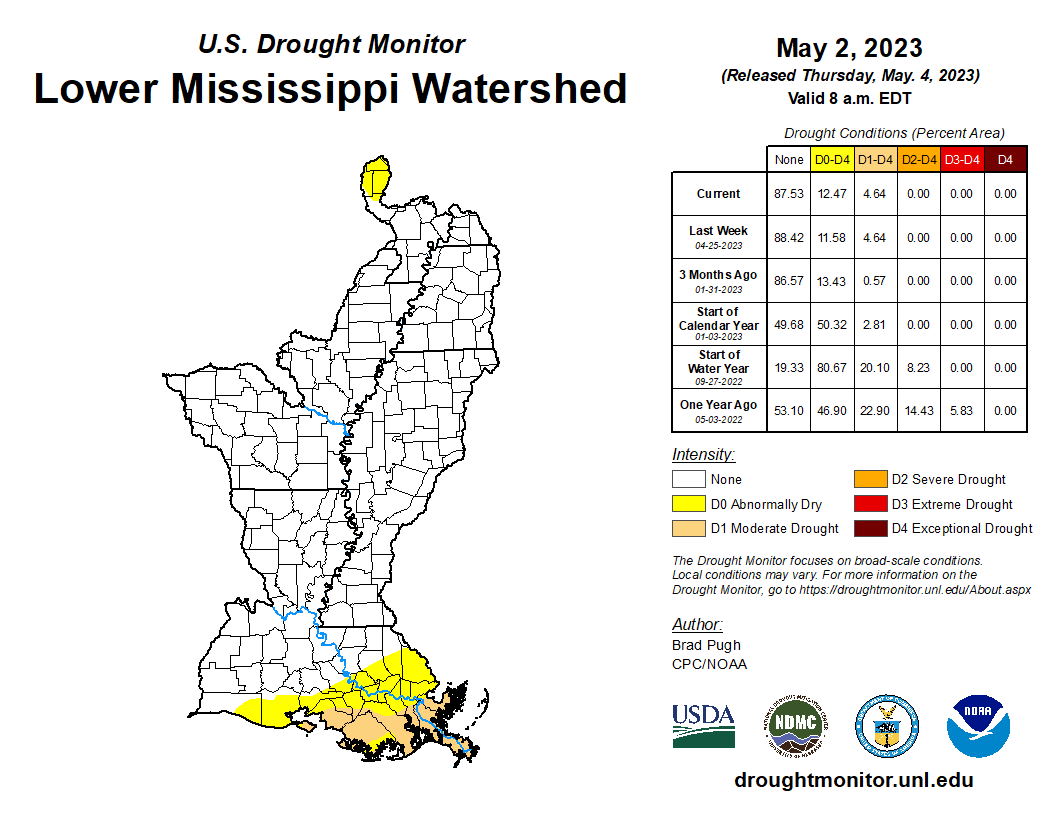
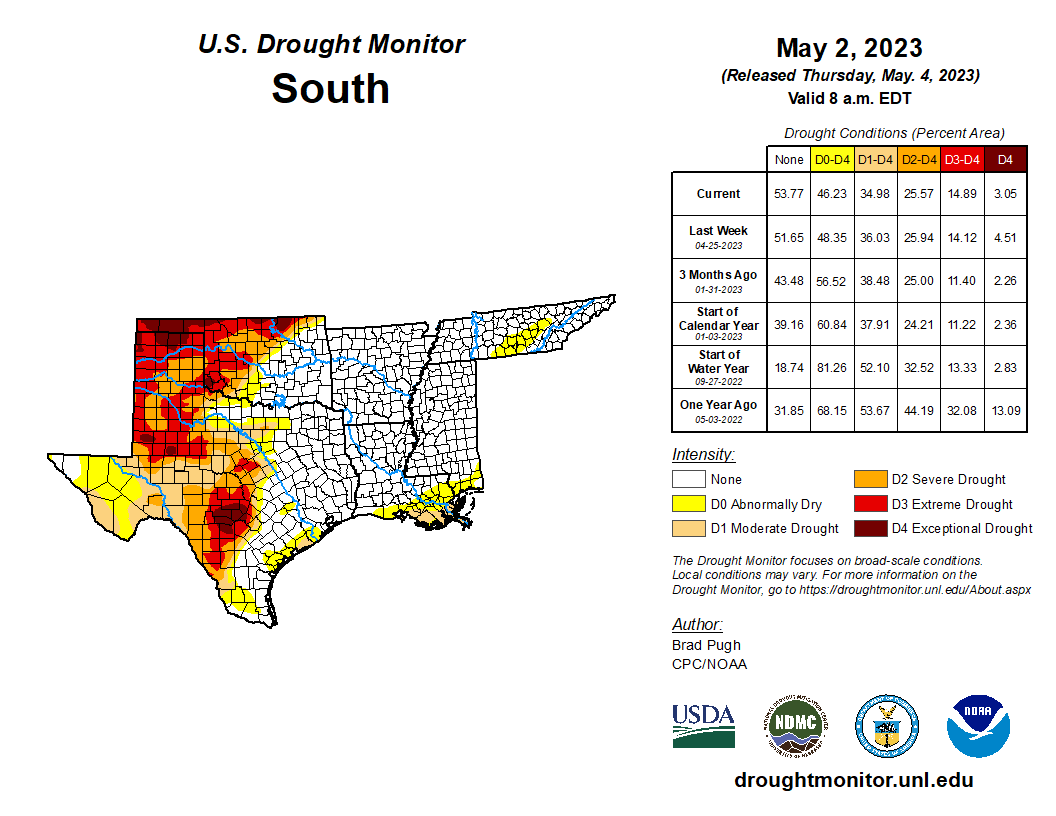
- The Great Plains is the epicenter of drought in the U.S. Moderate to exceptional (D4) drought continued, especially in the central to southern Plains. Beneficial May precipitation in western parts of the Plains contracted drought across this area, while continued dry weather intensified/expanded drought in some eastern parts of the Plains. In the central to northern Plains, the moderate to exceptional drought area fell from 47.9% of the region at the end of April to 35.7% of the region at the end of May. In the southern Plains, the moderate to exceptional drought area fell from 57.7% at the end of April to 44.6% at the end of May. In the Lower Mississippi Valley, the drought area fell slightly, going from 4.6% at the end of April to 2.8% at the end of May, with the moderate drought area limited to the Louisiana coast. Taken together, the southern Plains, Lower Mississippi Valley, and Tennessee (South Region) saw moderate to exceptional drought decrease from 35.0% at the end of April to 24.2% at the end of May, mostly due to contraction in Texas and Oklahoma.
- Drought and abnormal dryness expanded across much of the Midwest, with the drought area mostly centered in Missouri, Iowa, and Illinois. The Midwest region's drought area doubled from 7.7% at the end of April to 15.0% at the end of May. But the area experiencing drought or abnormal dryness ballooned from 28.9% to 66.2%.
- Contraction dominated in the Southeast. Extreme drought ended but moderate to severe drought continued in western portions of the Florida peninsula, with the region's drought area decreasing from 9.8% at the end of April to 3.2% at the end of May.
- Abnormal dryness and drought expanded in the Northeast this month, with the drought area growing from 0.6% at the end of April to 2.4% at the end of May and the area in drought or abnormal dryness increasing threefold from 15.8% to 49.6%.
- In Hawaii, moderate drought ended on the Big Island but abnormal dryness returned to cover most of Maui. At the end of May, abnormal dryness affected 13.8% of the state.
- Moderate drought shrank on Puerto Rico, covering 3.6% of the territory, while conditions worsened in the U.S. Virgin Islands, with severe drought intensifying to extreme drought on St. Croix, moderate drought intensifying to severe drought on St. Thomas, and abnormal dryness worsening to moderate drought on St. John.
- In the U.S.-Affiliated Pacific Islands (USAPI), compared to last month, abnormal dryness ended at Jaluit and Wotje in the RMI and Ulithi in the FSM. This leaves the USAPI region free of drought and abnormal dryness at the end of May.
Palmer Drought Index
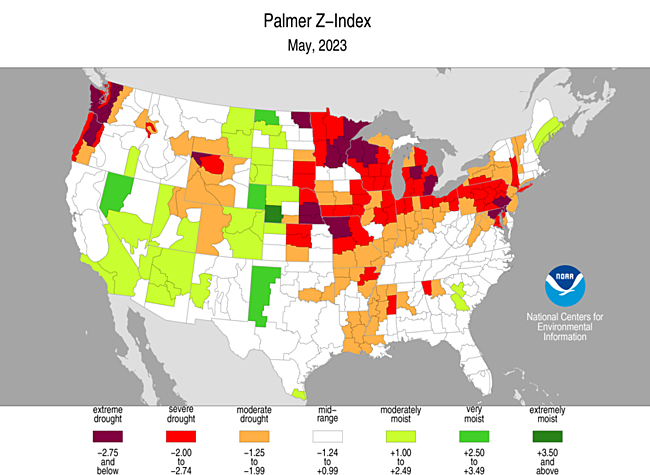
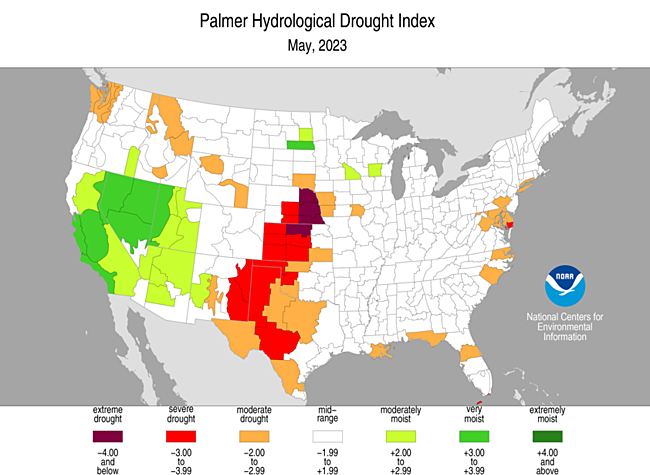
The Palmer drought indices measure the balance between moisture demand (evapotranspiration driven by temperature) and moisture supply (precipitation). The Palmer Z Index depicts moisture conditions for the current month, while the Palmer Hydrological Drought Index (PHDI) and Palmer Drought Severity Index (PDSI) depict the current month's cumulative moisture conditions integrated over the last several months.
While both the PDSI and PHDI indices show long-term moisture conditions, the PDSI depicts meteorological drought while the PHDI depicts hydrological drought. The PDSI map may show less severe and extensive drought (as well as wet spell conditions) in some parts of the country than the PHDI map because the meteorological conditions that produce drought and wet spell conditions are not as long-lasting as the hydrological impacts.
Used together, the Palmer Z Index and PHDI maps show that short-term drought occurred in the Pacific Northwest Coast, northern Rockies, eastern sections of the central Plains, and Mid-Atlantic region, expanding or intensifying long-term drought (PHDI maps for May compared to April), and in the central Rockies, across the Midwest, and in most of the Northeast, eliminating or reducing the intensity of long-term wet conditions. Short-term wet conditions occurred in western parts of the Great Plains, contracting or reducing the intensity of long-term drought, and in the Southwest, intensifying long-term wet conditions.
The SPI maps illustrate how moisture conditions have varied considerably through time and space over the last two years. Dryness is evident across the Great Lakes, much of the Mississippi and Ohio Valleys and Northeast, and eastern parts of the Great Plains at the 1-month time scale; from eastern parts of the Great Plains to Mid-Atlantic region at the 2-, 3-, and 9-month time scales; and over eastern parts of the Great Plains to Middle Mississippi Valley, and Mid-Atlantic region, at the 6- and 12-month time scales. Much of the Great Plains is dry at 12 and 24 months. Parts of the Pacific Northwest are dry at the 1- and 6- to 24-month time scales. Dryness covers the Southwest at 2 months. Parts of the Gulf of Mexico coast has dry conditions at 1- and 3- to 12-month time scales. The Carolina coast has dry areas at 1 and 9 to 24 months. Much of the West, especially the Southwest, is wet at 3 to 24 months, with the interior Southeast to interior Northeast wet at 24 months. These wet areas bracket the current epicenter of drought in the CONUS at 24 months, which is the Plains.
For the Northern Hemisphere, May marks the end of climatological spring, which is the season when evapotranspiration is increasing with rising sun angle and longer days. During May 2023, temperatures were warmer than normal for much of the CONUS west of the Mississippi River, especially across the Pacific Northwest to northern Plains, and cooler than normal across much of the East Coast. The above-normal temperatures increased evapotranspiration over the areas in the Pacific Northwest that were drier than normal, resulting in more extreme SPEI values than SPI values for May. With temperatures near to below normal over the drier-than-normal areas of the Midwest, Northeast, and central Plains, temperature-driven evapotranspiration was not greater than normal and the SPEI values were not greater than the SPI values. For most of the time periods from the last 3 to 12 months, for most of the CONUS, the SPEI values were not greater than the SPI values because the temperatures were not excessively above normal (temperature anomaly maps for the last 1, 3, 5, 6, 12 months) where and when precipitation (precipitation anomaly maps for the last 1, 3, 5, 6, 12 months) was excessively below normal (SPEI maps for the last 1, 3, 4, 6, 10, 12 months) (SPI maps for the last 1, 3, 4, 6, 10, 12 months).
The last ten to 20 years have been a period of unusually warm temperatures across the West. There have also been periods of extreme dryness westwide during this period (this year being an exception). The combination of excessive heat and dryness has resulted in more extreme SPEI values than SPI values for the last two to six years (SPEI maps for last 24, 30, 36, 48, 60, 72 months) (SPI maps for last 24, 30, 36, 48, 60, 72 months).
The excessive heat in the West for the last several years gave California and Oregon more extreme SPEI values than SPI values at the 72-month time scale:
- California 72-month May SPEI vs. 72-month May SPI.
- Oregon 72-month May SPEI vs. 72-month May SPI.
Regional Discussion
Western United States
The precipitation anomaly pattern for May 2023 was a mixed pattern of below-normal precipitation along the Washington and Oregon coasts and from the Great Basin to central Rockies, with above-normal precipitation in other parts of the West. The dry conditions combined with record and near-record May heat to give the Oregon and Washington coasts excessively dry Palmer Z Index and SPEI values. For the West Olympic Coast of Washington (climate division 1), May 2023 had the driest May SPEI and second driest May Z Index and SPI.
For the West as a whole, May 2023 ranked as the 54th driest and 15th warmest May in the 1895-2023 record. The last 12 months were the 27th wettest and 34th warmest June-May in the 129-year record. Conditions are drier and hotter at longer time scales: the last 24 months ranked as the 69th driest and 12th warmest such 24-month June-May period, and the last 36 months ranked as the 14th driest and seventh warmest such 36-month June-May period.
Based on the USDM, the percent area of the western U.S. in moderate to exceptional drought fell to 17.0% at the end of May. Based on the Palmer Drought Index, about 6.8% of the western U.S. was experiencing moderate to extreme drought at the end of May. This is an increase compared to the end of April, is based on the Palmer Drought Severity Index (PDSI), and reflects the impact of the very dry conditions in parts of the Pacific Northwest. The PDSI is a meteorological drought index. The Palmer Hydrological Drought Index (PHDI) is a hydrological drought index that reflects hydrological conditions instead of changes in atmospheric circulation. The PHDI shows a little more drought remaining across the West than does the PDSI. Since the Palmer data go back to the beginning of the 20th century, they show that the last two decades have had a greater spatial extent of persistent drought in the West than any other decades in the last 123 years.
Great Plains
Western parts of the Great Plains received above-normal precipitation during May 2023 while eastern portions were drier than normal. These short-term wet conditions helped lessen precipitation deficits, but long-term deficits still remain. Regionwide, the Great Plains had the 30th wettest and sixth warmest May in the 1895-2023 record, the 17th driest and 24th warmest June-May 12-month period, the 12th driest and 12th warmest June-May 24-month period, and the 12th driest and tenth warmest June-May 36-month period.
As of the end of May, 38.5% of the Great Plains region was affected by moderate to extreme drought, based on the PDSI. This is a little less than the end of April. The recent drought, at its peak last year, was as expansive as the drought of the 1950s.
With the May rains occurring in parts of the Great Plains, eastern Nebraska and much of Kansas are now the epicenter of the Plains drought. The following areas have had record dry conditions as measured by the SPI:
- East Central Nebraska (Climate Division 6) had the driest June-May 12-month period, June-May 24-month period, and 30-month period in the 1895-2023 record;
- Northeast Nebraska (Climate Division 3) had the driest 24-month period and second driest 30-month period;
- Southwest Kansas (Climate Division 7) had the driest 30-month period; and
- West Central Kansas (Climate Division 4) tied with 1956 for the driest 30-month period.
Hawaii
May 2023 had a mixed precipitation anomaly pattern across the Hawaiian Islands, except for Maui where drier-than-normal conditions dominated. It was mostly wetter than normal, except for windward parts of Maui and the Big Island, for the last 2 to 3 months. Wetter-than-normal conditions dominated at the 4- to 9-month time scales. Drier-than-normal conditions were more extensive on the Big Island and Oahu at 12-48 months. A mixed pattern was evident at 60 months (precipitation anomaly maps for the last 1, 2, 3, 4, 5, 6, 8, 9, 11, 12, 24, 36, 48, 60 months) (climate engine model percent of normal precipitation map for the last month).
Monthly streamflow was below normal on Maui and the Big Island but near to above normal on Molokai, Oahu, and Kauai. Based on satellite analyses (stressed vegetation, drought stress, VHI), there were a few areas of vegetative stress this month on Maui and the Big Island, but little to no stress elsewhere.
Moderate drought ended in Hawaii during May, but abnormal dryness covered 13.8% of the state on the May 30, 2023 USDM map.
Alaska
May 2023 had a mixed precipitation anomaly pattern based on station data, but the wet stations dominated when precipitation is integrated across climate divisions. Drier-than-normal conditions were evident in the south-central area (Cook Inlet and Northwest Gulf) and parts of the Aleutian Chain and southern Panhandle at the 3- to 9-month time scales, while wetter-than-normal conditions dominated elsewhere. It was wetter than normal across most of Alaska at longer time scales, except for some drier-than-normal stations in the east central area at 12 months and mostly centered around the Northwest Gulf-Cook Inlet area at 12 months and longer (low elevation station precipitation anomaly maps for the last 1, 2, 3, 4, 5, 6, 8, 9, 11, 12, 24, 36, 48, 60 months) (high elevation SNOTEL basin percent of normal precipitation maps for the last 8 months) (high elevation SNOTEL station precipitation percentile maps for the last 1, 5, and 12 months) (SNOTEL basin and station percent of normal precipitation maps for the last 1, 5, and 12 months) (climate division precipitation rank maps for the last 1, 3, 5, 6, and 12 months) (climate engine model percent of normal precipitation map for the last month) (Leaky Bucket model precipitation percentile map) (1- and 3-month precipitation anomaly maps provided by the ACCAP).
May temperatures were warmer than normal in the north and east and cooler than normal in the west and south. Cooler-than-normal temperatures dominated at the 2- to 4-month time scales. Warmer-than-normal temperatures were evident in the north coastal and south coastal areas at 5 to 6 months. Warmer-than-average temperatures dominated at longer time scales, when compared to the long-term (1926-2022) average. But when compared to more recent (1991-2020) normals, near to cooler-than-normal temperatures were evident at some western to central stations because of a pronounced warming trend in recent decades (low elevation station temperature anomaly maps for the last 1, 2, 3, 4, 5, 8, 12 months) (climate division temperature rank maps for the last 1, 3, 5, 6, and 12 months) (gridded temperature percentile maps for the last 1, 3, and 5 months) (Leaky Bucket model temperature percentile map).
SNOTEL data indicate that the snowpack was melted out at most stations and snow water content (SWE) was near to above normal in south central and panhandle basins but below normal in eastern interior basins. For those streams that were not frozen, monthly streamflow was mostly near to above normal. Satellite observations of vegetative health (stressed vegetation, drought stress, VHI) did not reveal any significant drought-related stress.
Alaska was free of drought and abnormal dryness on the May 30, 2023 USDM map.
Puerto Rico and U.S. Virgin Islands
May 2023 was drier and warmer than normal across the U.S. Virgin Islands (USVI) and most of Puerto Rico (PR). The last 2 to 8 months were drier than normal across the USVI and parts of PR, mostly in the northwestern part of the island but also parts in the south and east. PR was mostly wetter than normal at 9 to 11 months while the USVI were mostly drier than normal. The USVI were drier than normal at 12 to 24 months with a mixed anomaly pattern over PR. Drier-than-normal conditions dominated both at longer time scales (radar-based precipitation anomaly estimates for the last 1, 2, 3, 5, and 6 months) (low elevation station precipitation maps for the last 1, 2, 3, 4, 5, 6, 8, 9, 11, 12, 24, 36, 48, 60 months) (climate engine model percent of normal precipitation map for the last month: PR and USVI, Caribbean and Gulf of Mexico region). The Rohlsen Airport station on St. Croix had the driest December-May in the 1972-2023 record, second driest January-May, and third driest May.
Root zone analyses indicated that soil conditions were moist across eastern coastal and interior portions of western to central PR, but dry along the southern and northwest coasts and a strip over eastern PR (root zone soil saturation fraction). Monthly streamflow on PR showed some below-normal streams in the western and eastern ends of the island with near to above-normal streams in other areas. In the USVI, for the most part, groundwater steadily declined during May at St. Croix and St. John, and rose then declined at St. Thomas. The end-of-May groundwater level was in mid-range (below previous peaks and above recent low levels) on all three islands (St. Thomas, St. Croix, St. John), although the St. Croix value is on its way into the bottom third of the historical record. Significant drought impacts have been received from the USVI through the National Integrated Drought Information System (NIDIS). These include: Lack of rainfall, high winds and high temperatures have reduced the moisture in the soil, and ponds are drying out. Farmers and ranchers have reported distress in vegetation, a decrease in egg production, and that some animals succumbed to a combination of heat, lack of water and access to grazing.
Drought intensified in the USVI, with extreme drought developing on St. Croix, severe drought developing on St. Thomas, and moderate drought developing on St. John. Moderate drought shrank to cover about 3.6% of PR on the May 30, 2023 USDM map.
CONUS State Precipitation Ranks
May 2023 was drier than normal across much of the region from the eastern Great Plains to the East Coast, the interior West, and coastal Pacific Northwest, with record dryness occurring in parts of the Mid-Atlantic. Twenty-three states had a precipitation rank in the driest third of the 129-year historical record for May, including four that ranked in the top ten driest category — Wisconsin (fourth driest), Pennsylvania (fifth driest), Maryland (eighth driest), and Michigan (ninth driest).
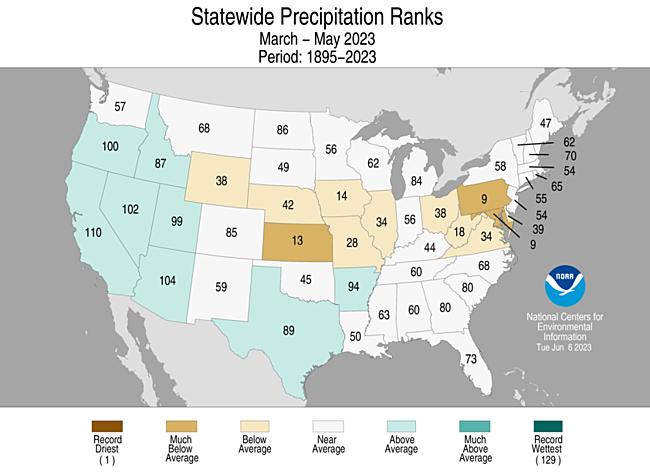
Spring (March-May) 2023 was drier than normal from the central Plains to Mid-Atlantic Coast and over parts of the West, New England, and Gulf of Mexico Coast, with record dryness occurring locally in Kansas. Eleven states had a precipitation rank in the driest third of the 1895-2023 record for March-May, including two that ranked in the top ten driest category — Pennsylvania and Maryland (both ninth driest) — and two that were close: Kansas (13th driest) and Iowa (14th driest).
The year to date (January-May 2023) was drier than normal across parts of the Plains to Mid-Mississippi Valley, along the Mid-Atlantic Coast and Gulf of Mexico Coast, and in the Pacific Northwest, with record dryness occurring locally in Maryland. Nine states had a precipitation rank in the driest third of the historical record for January-May, including one that ranked in the top ten driest category — Maryland (fifth driest) — and one that was close: Pennsylvania (12th driest).
The last six months (December-May) 2023 had a precipitation anomaly pattern similar to that of the year to date, although the dry anomalies were not as extreme. Seven states had a precipitation rank in the driest third of the historical record for December-May, but none ranked in the top ten driest category.
The last 12 months (June 2022-May 2023) were drier than normal across the Great Plains and much of the Pacific Northwest, Midwest, East Coast, and Gulf of Mexico Coast, with record dryness occurring locally in Nebraska. Seventeen states had a precipitation rank in the driest third of the historical record for December-May, including two that ranked in the top ten driest category — Kansas (sixth driest) and Nebraska (eighth driest).
Agricultural Belts
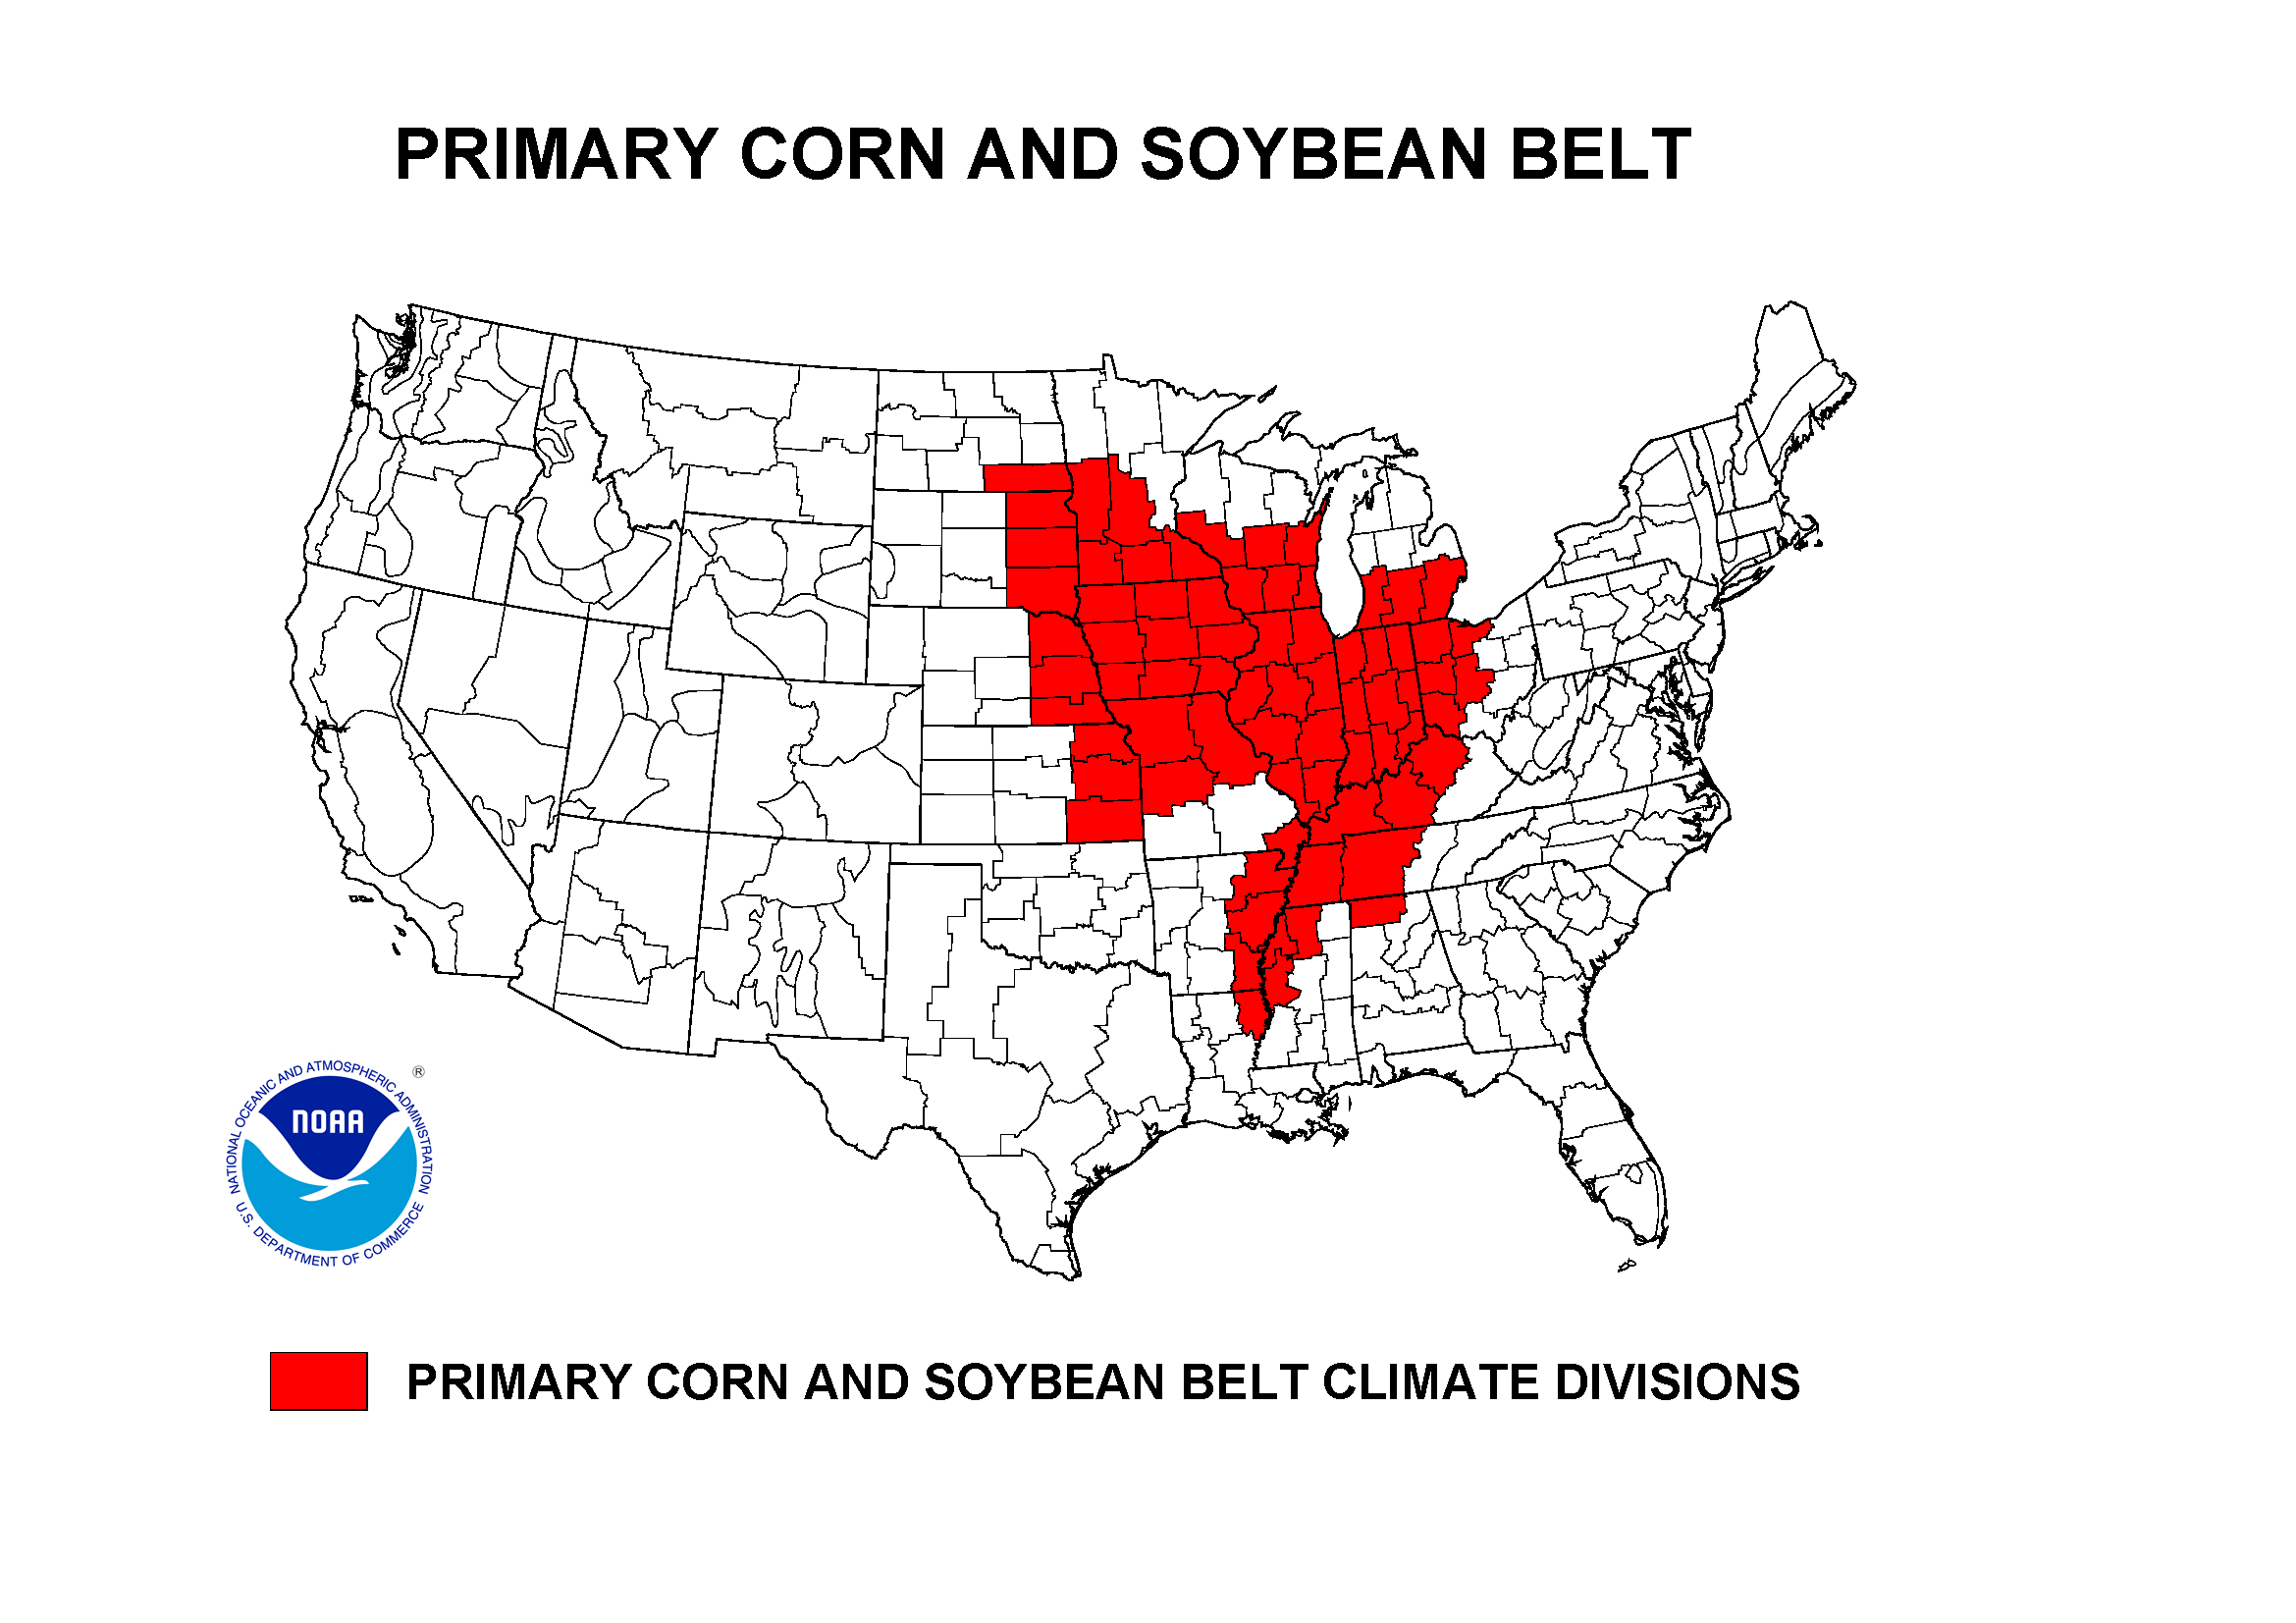
During May 2023, the Primary Corn and Soybean agricultural belt was drier than normal and near to warmer than normal. The month ranked as the tenth driest and 33rd warmest May, regionwide, in the 1895-2023 record.
March marks the beginning of the growing season for the Primary Corn and Soybean agricultural belt. March-May 2023 was mostly drier than normal and near to warmer than normal. The period ranked as the 26th driest and 48th warmest March-May, regionwide, in the 1895-2023 record.
According to the U.S. Department of Agriculture (USDA), as of May 30, 2023, drought affected approximately 8% of barley production, 34% of corn production, 28% of cotton production, 71% of sorghum production, 28% of soybean production, 6% of spring wheat production, 46% of winter wheat production, 20% of hay acreage, 36% of the cattle inventory, 13% of the milk cow inventory, and 15% of the sheep inventory. Based on May 28 USDA statistics, 35% of the nation's winter wheat crop, 5% of the corn crop, and 22% of the nation's pasture and rangeland were in poor to very poor condition, and 36% of the nation's topsoil and 37% of the subsoil were short or very short of moisture (dry or very dry). The USDA noted that the rapid rate of drying of soils in the Midwest, Northeast, and Mid-South contributed to the biggest 1-week jump in topsoil moisture rated short or very short since the week ending June 19, 2022. The table below lists the soil moisture, pasture and rangeland, corn, and winter wheat condition by state, with those states having 30 percent or more of topsoil or subsoil moisture short or very short, or 30 percent or more of the winter wheat, corn crop, or pasture and rangeland in poor or very poor condition, highlighted in yellow:

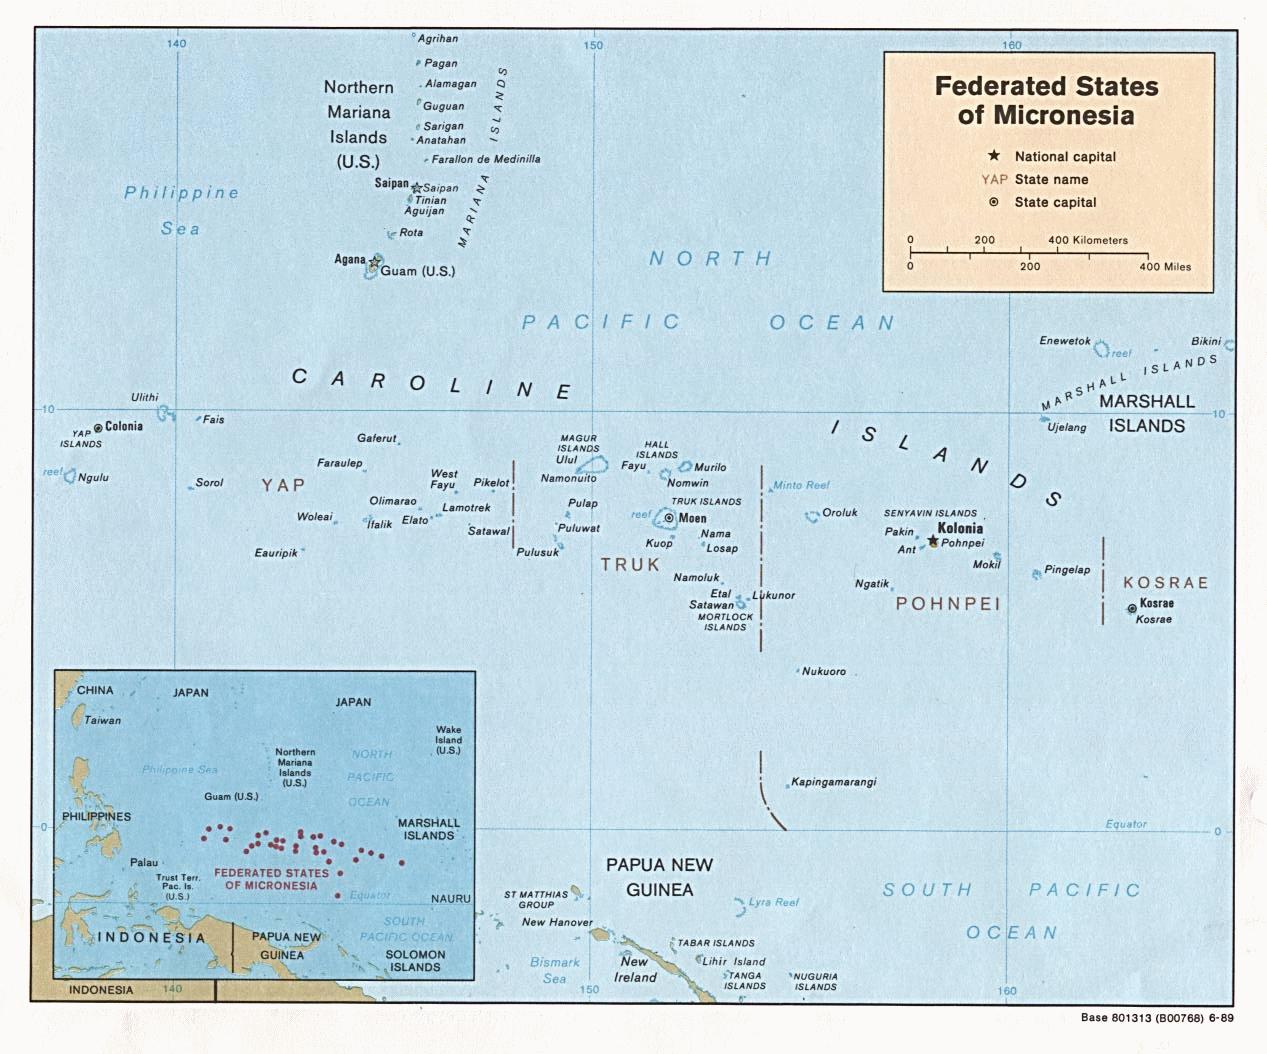
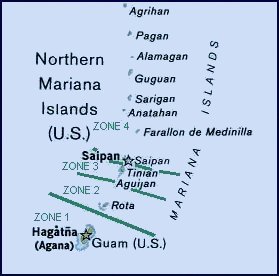
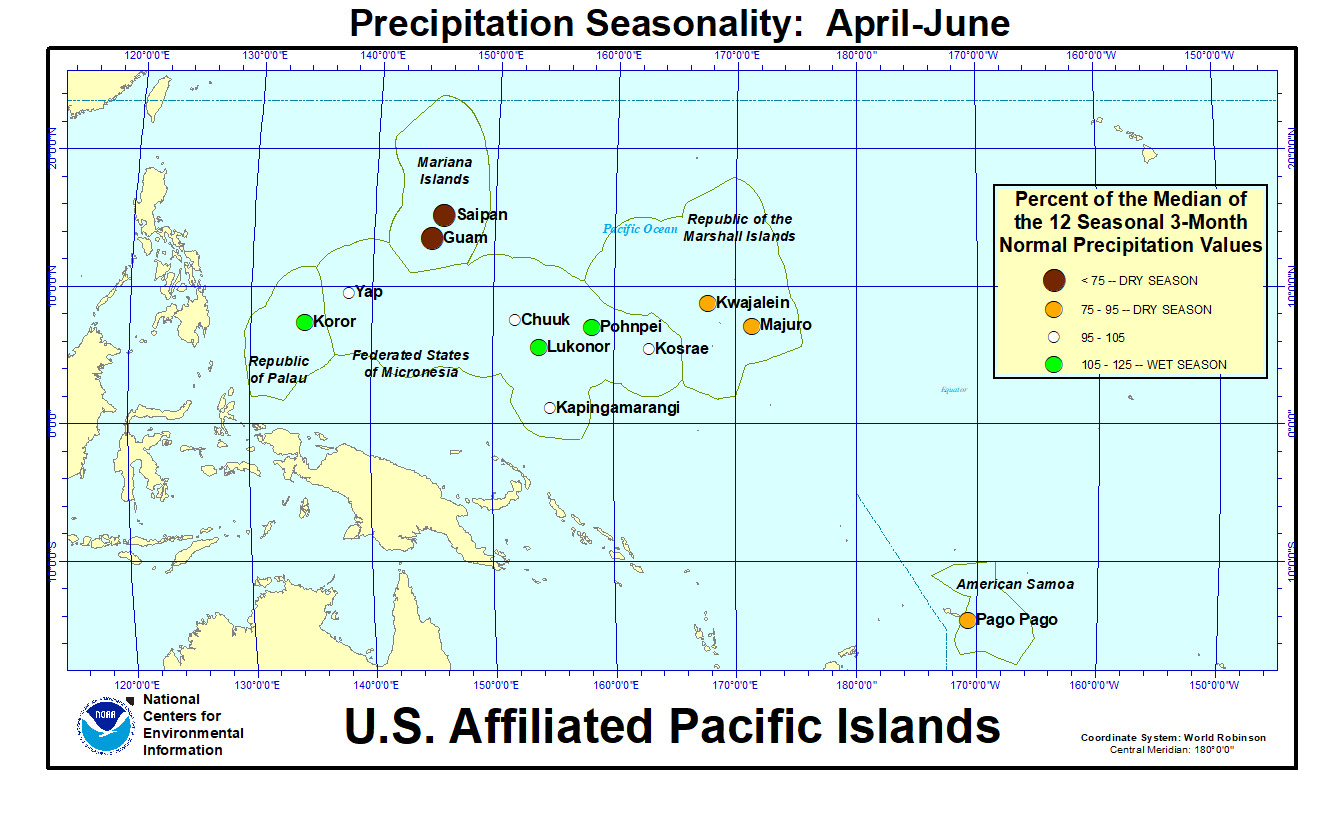
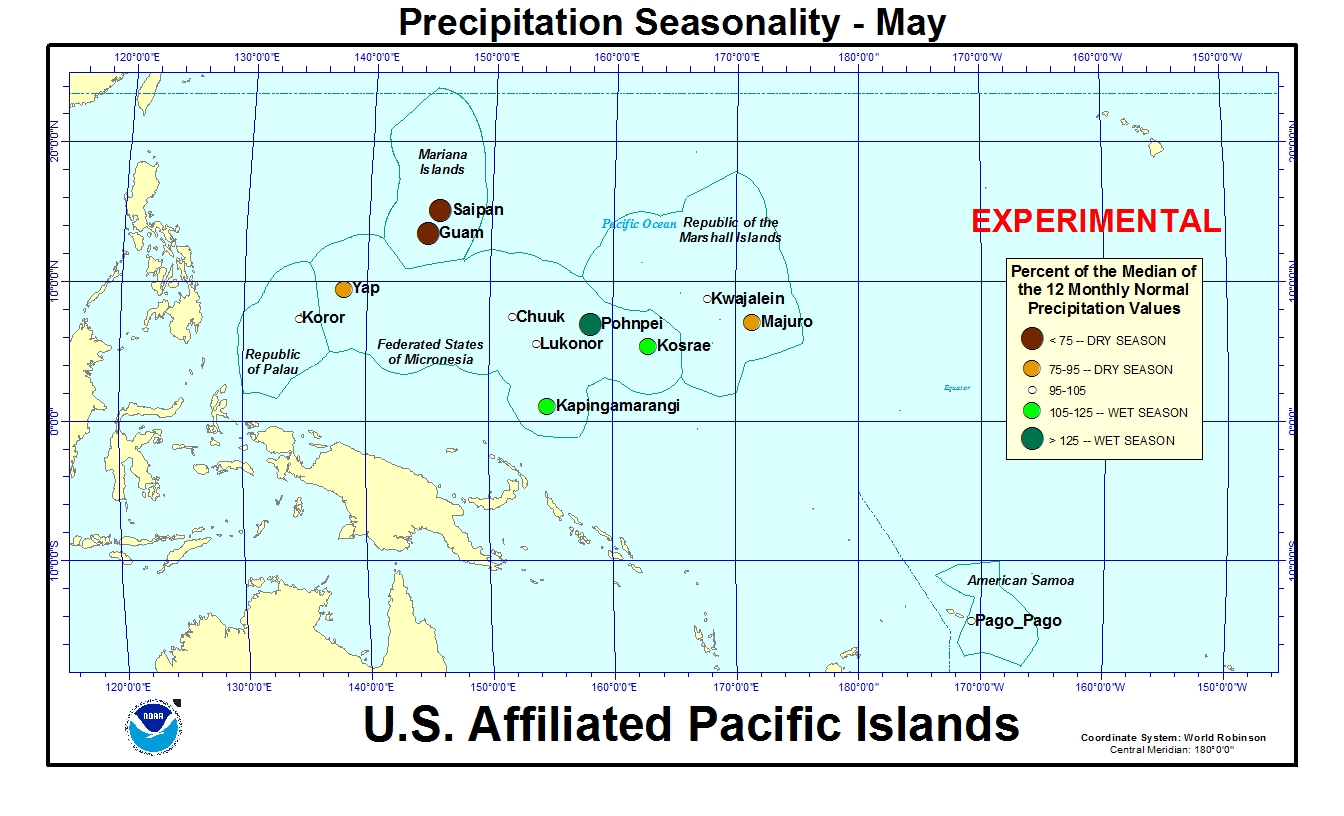
In the U.S. Affiliated Pacific Islands (USAPI) (maps — Federated States of Micronesia [FSM], Northern Mariana Islands, Marshall Islands [RMI], Republic of Palau [ROP], American Samoa, basinwide), May 2023 was drier than normal in the RMI and eastern parts of the FSM, and near to wetter than normal everywhere else.
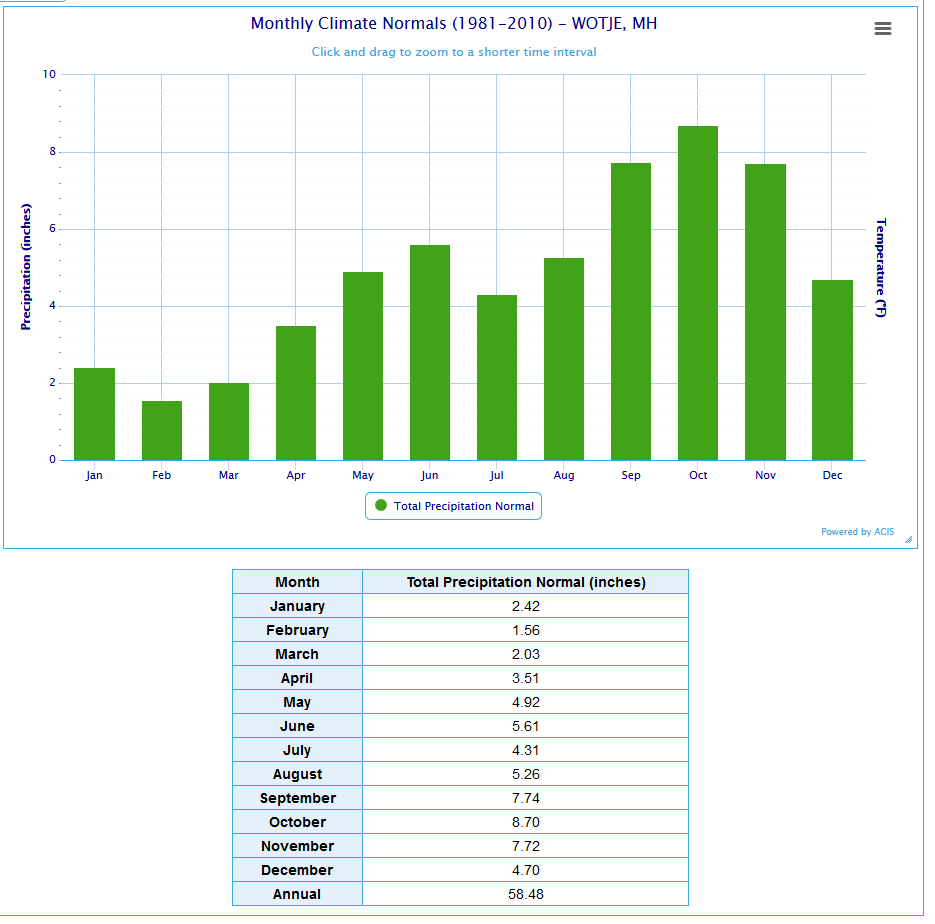
Monthly precipitation amounts were below the monthly minimum needed to meet most water needs (4 inches in the Marianas and Pago Pago, and 8 inches elsewhere) at Wotje (RMI) and Lukunor (FSM). May precipitation was above the monthly minimums at the rest of the stations across the USAPI. The 4- and 8-inch thresholds are important because, if monthly precipitation falls below the threshold, then water shortages or drought become a concern.
The tropical Pacific climatology can experience extremes in precipitation, from very low precipitation during the dry season to very high precipitation during the wet season. This can result in monthly normal precipitation values that are different from the monthly minimum needed to meet most water needs, and this can lead to percent of normal values that seem odd. This was the case during May 2023, which is in the wet season for the eastern and southern FSM and Palau and dry season for the rest of Micronesia. Precipitation was below the monthly minimum but above normal (1981-2010 normal), because the normals are low, at:
- Wotje: May 2023 precipitation 6.56 inches, May normal mean 4.92 inches.
Precipitation was above the monthly minimum but below normal (1981-2010 normal), because the normals are high, at:
- Kosrae: May 2023 precipitation 15.41 inches, May normal mean 18.48 inches, May normal median 17.75 inches.
In the table below, the station identified as Koror is Palau International Airport (Airai).
As measured by percent of normal precipitation, Lukunor was drier than normal in the short term (May, the last 3 months [March-May], and the year-to-date [January-May]) and long term (last 12 months [June 2022-May 2023]). Kosrae was drier than normal at the 1- and 3-month time scales, but near normal at the 5- and 12-month time scales. Kapingamarangi was drier than normal at the 12-month time scale, but wetter than normal for the other 3 time scales. Airai, Pago Pago, Chuuk, Guam, Kwajalein, Majuro, Pohnpei, Saipan, and Yap were near to wetter than normal for all 4 time periods.
Based on percent of normal average (instead of normal median values), in the Marianas Islands, precipitation during May and the last 2 to 24 months was above normal across the main islands. Longer time periods had a mixed anomaly pattern but were mostly above normal (percent of normal precipitation maps for the last 1, 2, 3, 4, 5, 6, 8, 9, 11, 12, 24, 36, 48, 60 months).
Based on percent of normal average (instead of normal median values), in the Marshall Islands, the last 1 to 2 months were drier than normal in the southern islands, with wetter-than-normal conditions across the rest of the RMI stations. Wetter-than-normal conditions dominated the RMI except of the southwest (Jaluit) at longer time scales (percent of normal precipitation maps for the last 1, 2, 3, 4, 5, 6, 8, 9, 11, 12, 24, 36, 48, 60 months).
According to the May 31 USDM produced for the USAPI, abnormal dryness ended at Jaluit, Ulithi, and Wotje, leaving all of the USAPI stations free of drought and abnormal dryness. The reservoir level on Majuro experienced a bump (increase) with rains early in the month, but generally held steady with minor fluctuations throughout most of the month. It began the month at 25.8 million gallons, reached a low of 23.5 million gallons on the 4th and a maximum of 26.8 million gallons on the 7th, and ended the month at 24.3 million gallons. This is below the threshold of concern for drought of 28.8 million gallons. But in this particular case, the low water level is due to one sector of the reservoir being serviced. This portion of the reservoir system typically holds 8 million gallons, so the low reservoir level is not due to drought conditions.
May 2023 precipitation ranks were mostly on the median to wet side of the historical distribution, based on data available at the time of this report. Record to near-record dryness was still occurring at Kapingamarangi, Lukunor, and Jaluit at longer time scales:
- Lukunor: 5th driest May (in a 39-year record), and driest July-May and June-May.
- Jaluit: 13th driest May (40 years) and 6th driest June-May.
- Kapingamarangi: 5th wettest May (29 years), but 5th driest rank for June-May.
At the wet end of the scale:
- Guam had the wettest May (67 years), April-May through December-May, and October-May. Super Typhoon Mawar was responsible for Guam's wettest May, contributing a storm total of 24.71 inches of rain over 3 days (May 23-25), or more than three-fourths of the monthly total.
- Mili had the wettest rank for January-May (39 years), and October-May through June-May.
- Saipan had the wettest January-May (42 years) through October-May.
The following analysis of historical data for the USAPI stations in the Global Historical Climatology Network-Daily (GHCN-D) dataset, augmented with fill-in data from the 1981-2010 Normals, helps put the current data into historical perspective by computing ranks based on the period of record. The table below lists the precipitation ranks for May 2023, December 2022-May 2023 (last 6 months), and June 2022-May 2023 (the last 12 months). Some stations have a long period of record and their dataset is fairly complete, while other stations have a shorter period of record and the dataset has some missing data.
SPI values for seven time periods for Pacific Islands, computed by the Honolulu NWS office.

Southeast
As noted by the Southeast Regional Climate Center, mean temperatures in May were below average across much of the Southeast region and precipitation was variable across the region. Generally above-average precipitation (125 to 150 percent of normal) was observed along the tracks of a few low pressure systems and where frontal boundaries stalled across the region. In contrast, monthly precipitation was below average (less than 75 percent of normal) across northern and interior sections of the region, as well as much of South Florida, Puerto Rico, and the U.S. Virgin Islands.
Drought conditions improved across much of the region in May. Overall, less than 10 percent of the region was in abnormally dry (D0) conditions by the end of the month (down by about 5 percent from April), while moderate (D1) to severe (D2) drought covered about 3 percent of the region (down by about 14 percent from April). Improvements of one to two drought categories were noted across northern Virginia and the Florida Peninsula, including an improvement from extreme (D3) to severe (D2) drought in west-central Florida and removal of moderate (D1) drought along the Space Coast. Abnormally dry (D0) conditions were eliminated across Alabama, while just a few pockets remained across Georgia and the Carolinas. Drought conditions also improved across western portions of Puerto Rico, while abnormally dry (D0) conditions emerged to the east and along some of the outlying islands. The continued dryness, warm temperatures, and high winds contributed to further intensification of drought in the U.S. Virgin Islands. All three islands observed a one-category degradation in May, with moderate (D1) drought on Saint John, severe (D2) drought on Saint Thomas, and extreme (D3) drought on Saint Croix by the end of the month. This marks the first time that extreme (D3) drought has been observed in the Caribbean region since February 2016 (for Puerto Rico; since August 2022 for the U.S. Virgin Islands).
Generally dry weather allowed farmers ample time for fieldwork, though progress was slowed in areas that experienced higher precipitation totals. The planting and emergence of cotton, peanuts, and soybeans was delayed in many places due to cool temperatures and reduced soil moisture, though conditions became more favorable during the latter half of the month. Hay production was also slowed by cool and dry weather, particularly in Georgia and South Carolina. Below-average precipitation, warm temperatures, and high winds have contributed to dry pastures across western Puerto Rico and the U.S. Virgin Islands.
South
As explained by the Southern Regional Climate Center, substantial improvement in drought conditions occurred across the western portions of the Southern region. Precipitation was below normal for the much of the eastern and central portions of the region in addition to far west Texas. Precipitation was well above normal across central Texas, the Texas and Oklahoma panhandles, and in deep south Texas. Temperatures were near to above normal for much of the Southern region for the month of May.
During May, the spatial extent and intensity of drought improved in many areas across the Southern region, particularly in the Texas Panhandle, central Texas, and western and central Oklahoma. Some areas in the Texas Panhandle saw as many as three categories of improvement, according to the USDM. The percentage of the region experiencing moderate drought (D1) or worse decreased from 35 percent on May 2nd to 24 percent on May 30th. As of May 30th, western and north central Oklahoma, and isolated areas of central Texas were still experiencing extreme (D3) or exceptional (D4) drought conditions. The eastern portions of the region largely remained drought free, with two isolated areas of moderate drought along the southeast Louisiana coast being the exception. In Oklahoma and Texas, the drought conditions over time have impacted and continue to negatively impact agriculture, with only 28 percent of Texas cotton rating as good to excellent and winter wheat in Texas rated 23 percent good to excellent in and Oklahoma rated 30 percent as good to excellent. Despite overall poor conditions, improvements in crop and pasture conditions have been noted in recent weeks in these areas.
Midwest
As described by the Midwest Regional Climate Center, the average May temperature for the Midwest was 60.7 degrees F (15.9 degrees C), which was 1 degree F (0.6 degrees C) above the 1991-2020 normal. May precipitation totaled 2.56 inches (65 mm) for the Midwest, which was 1.82 inches (46 mm) below normal, or 59 percent of normal. Based on preliminary rankings, the Midwest was tied for the 11th driest May since 1895. Most of the region had precipitation ranging from 10-75 percent of normal for May, and many stations ranked in the top ten driest for the month. Murry, Kentucky, had the driest May in 94 years, with 0.41 inch (10.4 mm) of precipitation. Ashland, Wisconsin, had the driest May in 113 years with 0.31 inch (7.9 mm). Still, localized thunderstorms produced isolated areas with near- to above-normal precipitation. The driest area in the region spanned from central Missouri northward through Iowa, where precipitation departures were 4-9 inches (101.6-228.6 mm) below normal for spring.
Rapid drying occurred across much of the Midwest throughout May due to the combined effects of below-normal precipitation and an unusually dry atmosphere (low humidity). By month's end, abnormal dryness and drought spread across two-thirds of the Midwest and affected all nine states in the region. Drought was widespread in Missouri, with 50 percent of the state in moderate to extreme drought and an additional 30 percent depicted as abnormally dry. Missouri's Governor declared a Drought Alert on May 31 as farmers and ranchers reported high demand for hay and low forage quality. Persistent drought conditions prompted water restrictions in western Iowa. Low atmospheric humidity, low rainfall, and a delayed spring green-up increased fire risk, prompting the National Weather Service to issue two dozen Red Flag warnings throughout the month in northern Minnesota and northwest Wisconsin.
Historically large wildfires in Alberta, Canada, brought smoky and hazy conditions to the Midwest starting in early May that persisted throughout the month. As the smoke settled in, repeated air quality alerts were issued across multiple Midwestern states, with the greatest number of alerts issued in Minnesota and Wisconsin.
Northeast
As summarized by the Northeast Regional Climate Center, May was spring's only cooler-than-normal month and featured record or near-record dryness in several locations. The Northeast saw 2.70 inches of precipitation during May, which was 68 percent of normal. This May ranked among the 20 driest on record for three states: Pennsylvania, fifth driest; Maryland, eighth driest; and New York, 18th driest. May 2023 was the driest May since recordkeeping began for five major climate sites: Wilmington, Delaware; Binghamton, New York; and Philadelphia, Harrisburg, and Williamsport, Pennsylvania, with each seeing less than 0.75 inch of precipitation. Three major climate sites also had their greatest number of May days with no measurable precipitation, with 28 days at Harrisburg and 26 days at Williamsport and Binghamton. During spring, the Northeast received 9.19 inches of precipitation, 81 percent of normal. Not only did this May rank as the driest or among the driest Mays on record for several sites, it also ranked among the 10 all-time driest months on record at six major climate sites: Wilmington, Delaware; Binghamton, New York; and Philadelphia, Harrisburg, Williamsport, and Allentown, Pennsylvania.
The USDM from May 2 showed 1 percent of the Northeast in moderate drought and 9 percent as abnormally dry. During May, much of the Northeast saw below-normal precipitation, leading to little soil moisture, low streamflow, and declining groundwater levels. Moderate drought expanded in Maryland and eastern Pennsylvania, while there was a widespread expansion of abnormal dryness across the Northeast. The main exception was southern New England, which saw some improvement during the month. The USDM from May 30 showed 2 percent of the Northeast in moderate drought and 47 percent as abnormally dry. During May, particularly at month's end, record low 7-day streamflow was noted in multiple parts of Maryland, Delaware, New Jersey, Pennsylvania, and New York. Similarly, record low groundwater levels were measured in several areas including southern/eastern Pennsylvania, central Maryland, and central New York. Warm, dry conditions contributed to an increased risk of wildfires, with multiple fires in states such as Pennsylvania, New York, and New Jersey. Due to dry conditions, Pennsylvania farmers began irrigating crops, with some growers concerned about crop losses.
On nearly half of all May days, smoke from wildfires burning in western Canada, transported by the jet stream, created hazy skies in parts of the Northeast. On May 30 and 31, smoke from wildfires in eastern Canada and New Jersey led to reduced air quality in parts of the Mid-Atlantic.
High Plains
As summarized by the High Plains Regional Climate Center, May temperatures were above to well-above normal for the region, with departures over 8 degrees F (4.4 degrees C) above normal in parts of the Dakotas. May precipitation was above normal for eastern Colorado, western Kansas and Nebraska, and parts of the Dakotas. The eastern part of the region was bone dry, with places 25 percent below normal. The phrase, "when it rains, it pours" would describe the month of May for northwestern Kansas and southwestern Nebraska. Parts of the area had gone nearly 290 days without over 0.5 inch (12.7 mm) of precipitation in a day, to nearly 7.5 inches (19.05 cm) in a single day. Other places in the region, like eastern Nebraska, have not been as fortunate, with near-record dryness this month and the entire spring.
The town of Culbertson in southwestern Nebraska recorded its driest year on record in 2022, with a meager 10.87 inches of precipitation (27.61 cm). In the month of May, they recorded nearly the same amount as the whole year of 2022, with 10.65 inches of precipitation (27.05 cm). While the complete reversal has greatly improved drought conditions, long-term drought impacts still plague the area. These rains are also too late to improve winter wheat yields for the year, with yields projected to be among the worst in the past 60 years. This spring was incredibly dry across eastern Nebraska, with corn struggling to emerge. Widespread irrigation is taking place rather early in the season, due to insufficient precipitation. This dryness is not short-term, with multiple locations recording their driest past 12 months.
Eastern Nebraska was dry not only this past month but the entire Spring. For the month of May, Omaha was the driest on record with only 0.17 inch (4.06 mm) of precipitation. This has broken the previous low of 0.55 inch (13.97 mm) set in 1989 and 1925 by a large margin. Lincoln was 0.02 inch (0.51 mm) from ranking driest, with only 0.51 inch this past month. Looking further back, Norfolk observed their driest spring with 2.41 inches (6.12 cm) of precipitation. Hastings and Lincoln were not far behind, ranking 3rd. The dryness plaguing the area also stretches much further back, with Hastings, Lincoln, and Norfolk all having their driest past 12 months.
The region, for the most part, experienced drought improvements up to 3 classes this month thanks to constant precipitation. The areas that were dry, such as eastern Nebraska and Kansas, observed up to a 2-class degradation. Overall, moderate to exceptional drought (D1-D4) was reduced by 12 percent for the High Plains. Southwestern Nebraska experienced the most improvement this month, with some areas going from extreme drought (D3) to abnormally dry (D0). The eastern part of the state observed a large increase to both D3 and D4, in response to the dryness since the beginning of the year.
West
As summarized by the Western Regional Climate Center, strong high pressure persisted for much of May centered over central and southwest Canada, bringing much-above-normal temperatures to all the Pacific Northwest and dry conditions to western Oregon and Washington. Several cutoff low-pressure systems moved through the Southwest bringing near-to-below-normal temperatures and scattered areas of well-above-normal precipitation due to thunderstorm activity. Several heat waves impacted the Pacific Northwest and northern Rockies in May driving record high monthly temperatures (4-8 degrees Fahrenheit above normal) for several major cities.
May was much drier than normal across western Oregon, western Washington, and southeast Washington where precipitation totals were less than 50 percent of normal. Some locations saw record dryness such as Forks, Washington, on the Olympic Peninsula, where 0.59 inch of precipitation fell, just 11 percent of normal, for the driest May since records started in 1908. Portland, Oregon saw its 11th driest May with 0.91 inch of precipitation (36 percent of normal) and Eugene, Oregon saw its fifth driest May with 0.34 inch of precipitation (14 percent of normal). Drier-than-normal conditions also prevailed across northern Utah and northern Idaho. Several cutoff low-pressure systems produced widespread convective precipitation across the northern Great Basin and portions of southern California, Arizona, and New Mexico with wetter-than-normal conditions. Reno, Nevada recorded 2.44 inches of precipitation (444 percent of normal) for the second wettest May on record and Prescott, Arizona logged 1.72 inches of precipitation (337 percent of normal) for the fourth wettest May since records began in 1898.
According to the USDM at the end of May, 17 percent of the West was in drought. One tiny sliver of extreme drought (D3) remains in northeast New Mexico and no exceptional drought (D4) was present. One-category drought improvements were found across Montana, far northern Idaho, and northeast New Mexico with expansion of drought or introduction of abnormal dryness (D0) in parts of Oregon and Washington. Drought and early season heat waves have increased fire danger across Alberta, Canada and dozens of wildfires broke out in early May that have burned more than two million acres. Dense wildfire smoke has been drifting in and out of the West and primarily impacting Montana, Wyoming, and Colorado.
Alaska summary: Wetter-than-normal conditions prevailed across most of Alaska except for some isolated portions of the Interior, southern Panhandle, and northwest North Slope where conditions were drier than normal. May precipitation was 150-250 percent of normal for much of southwest Alaska. McGrath received 0.29 inch of precipitation (32 percent of normal) for the eighth driest May on record. May temperatures were below normal (1-2 degrees Fahrenheit) across western Alaska and above normal (1-3 degrees Fahrenheit) across the southern Panhandle and North Slope.
Hawaii summary: Precipitation anomalies were mixed with mostly wetter-than-normal conditions across Kauai, O'ahu, and the Big Island and drier-than-normal conditions on Molokai, Maui, and the eastern shores of the Big Island. Hilo, on the Big Island, recorded 5.46 inches of precipitation in May at 78 percent of normal. The USDM at the end of May showed 14 percent of the state in abnormally dry conditions (D0) and this was restricted to the islands of Maui and the Big Island. There were no areas of drought (D1-D4) present across the state.