Issued 12 January 2024
Please note that the values presented in this report are based on preliminary data. They will change when the final data are processed, but will not be replaced on these pages.
National Drought Highlights
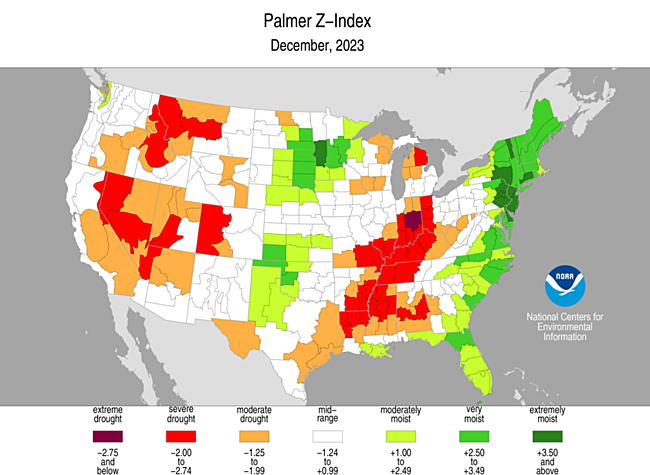
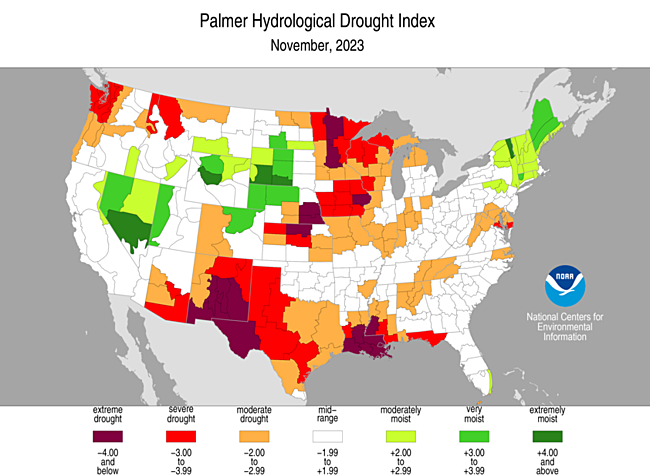
- Based on the Palmer Drought Index, severe to extreme drought affected about 14% of the contiguous United States as of the end of December 2023, a decrease of about 4% from last month. About 6% of the contiguous U.S. fell in the severely to extremely wet categories.
- About 37% of the contiguous U.S. fell in the moderate to extreme drought categories (based on the Palmer Drought Index) at the end of December.
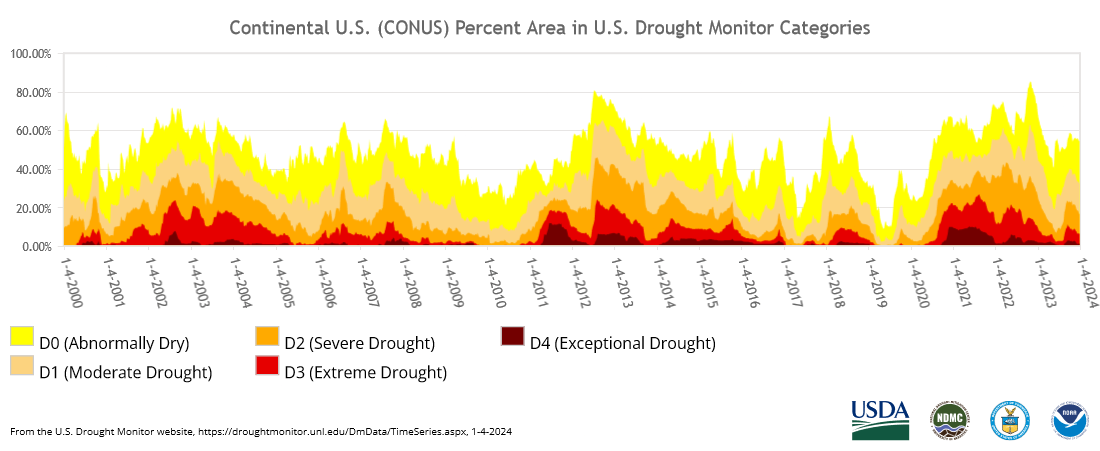
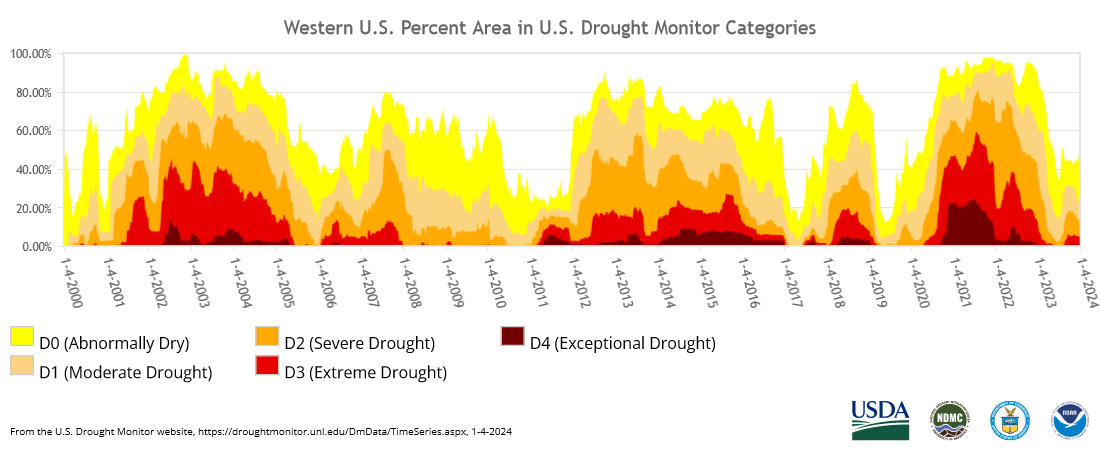
- On a broad scale, the 1980s and 1990s were characterized by unusual wetness with short periods of extensive droughts, the 1930s and 1950s were characterized by prolonged periods of extensive droughts with little wetness, and the first two decades of the 2000s saw extensive drought and extensive wetness (moderate to extreme drought graphic, severe to extreme drought graphic).
- A file containing the national monthly percent area severely dry and wet from 1900 to present is available for the severe to extreme and moderate to extreme categories.
- Historical temperature, precipitation, and Palmer drought data from 1895 to present for climate divisions, states, and regions in the contiguous U.S. are available at the Climate Division: Temperature-Precipitation-Drought Data page. These filenames begin with "climdiv".
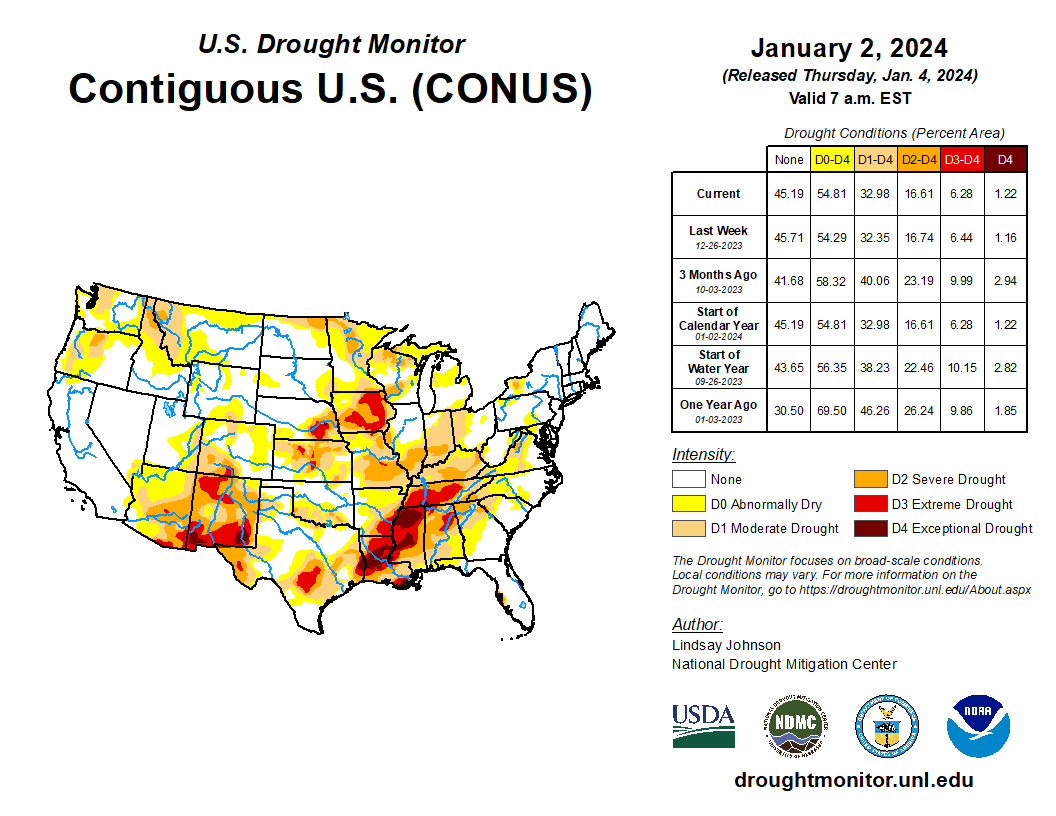
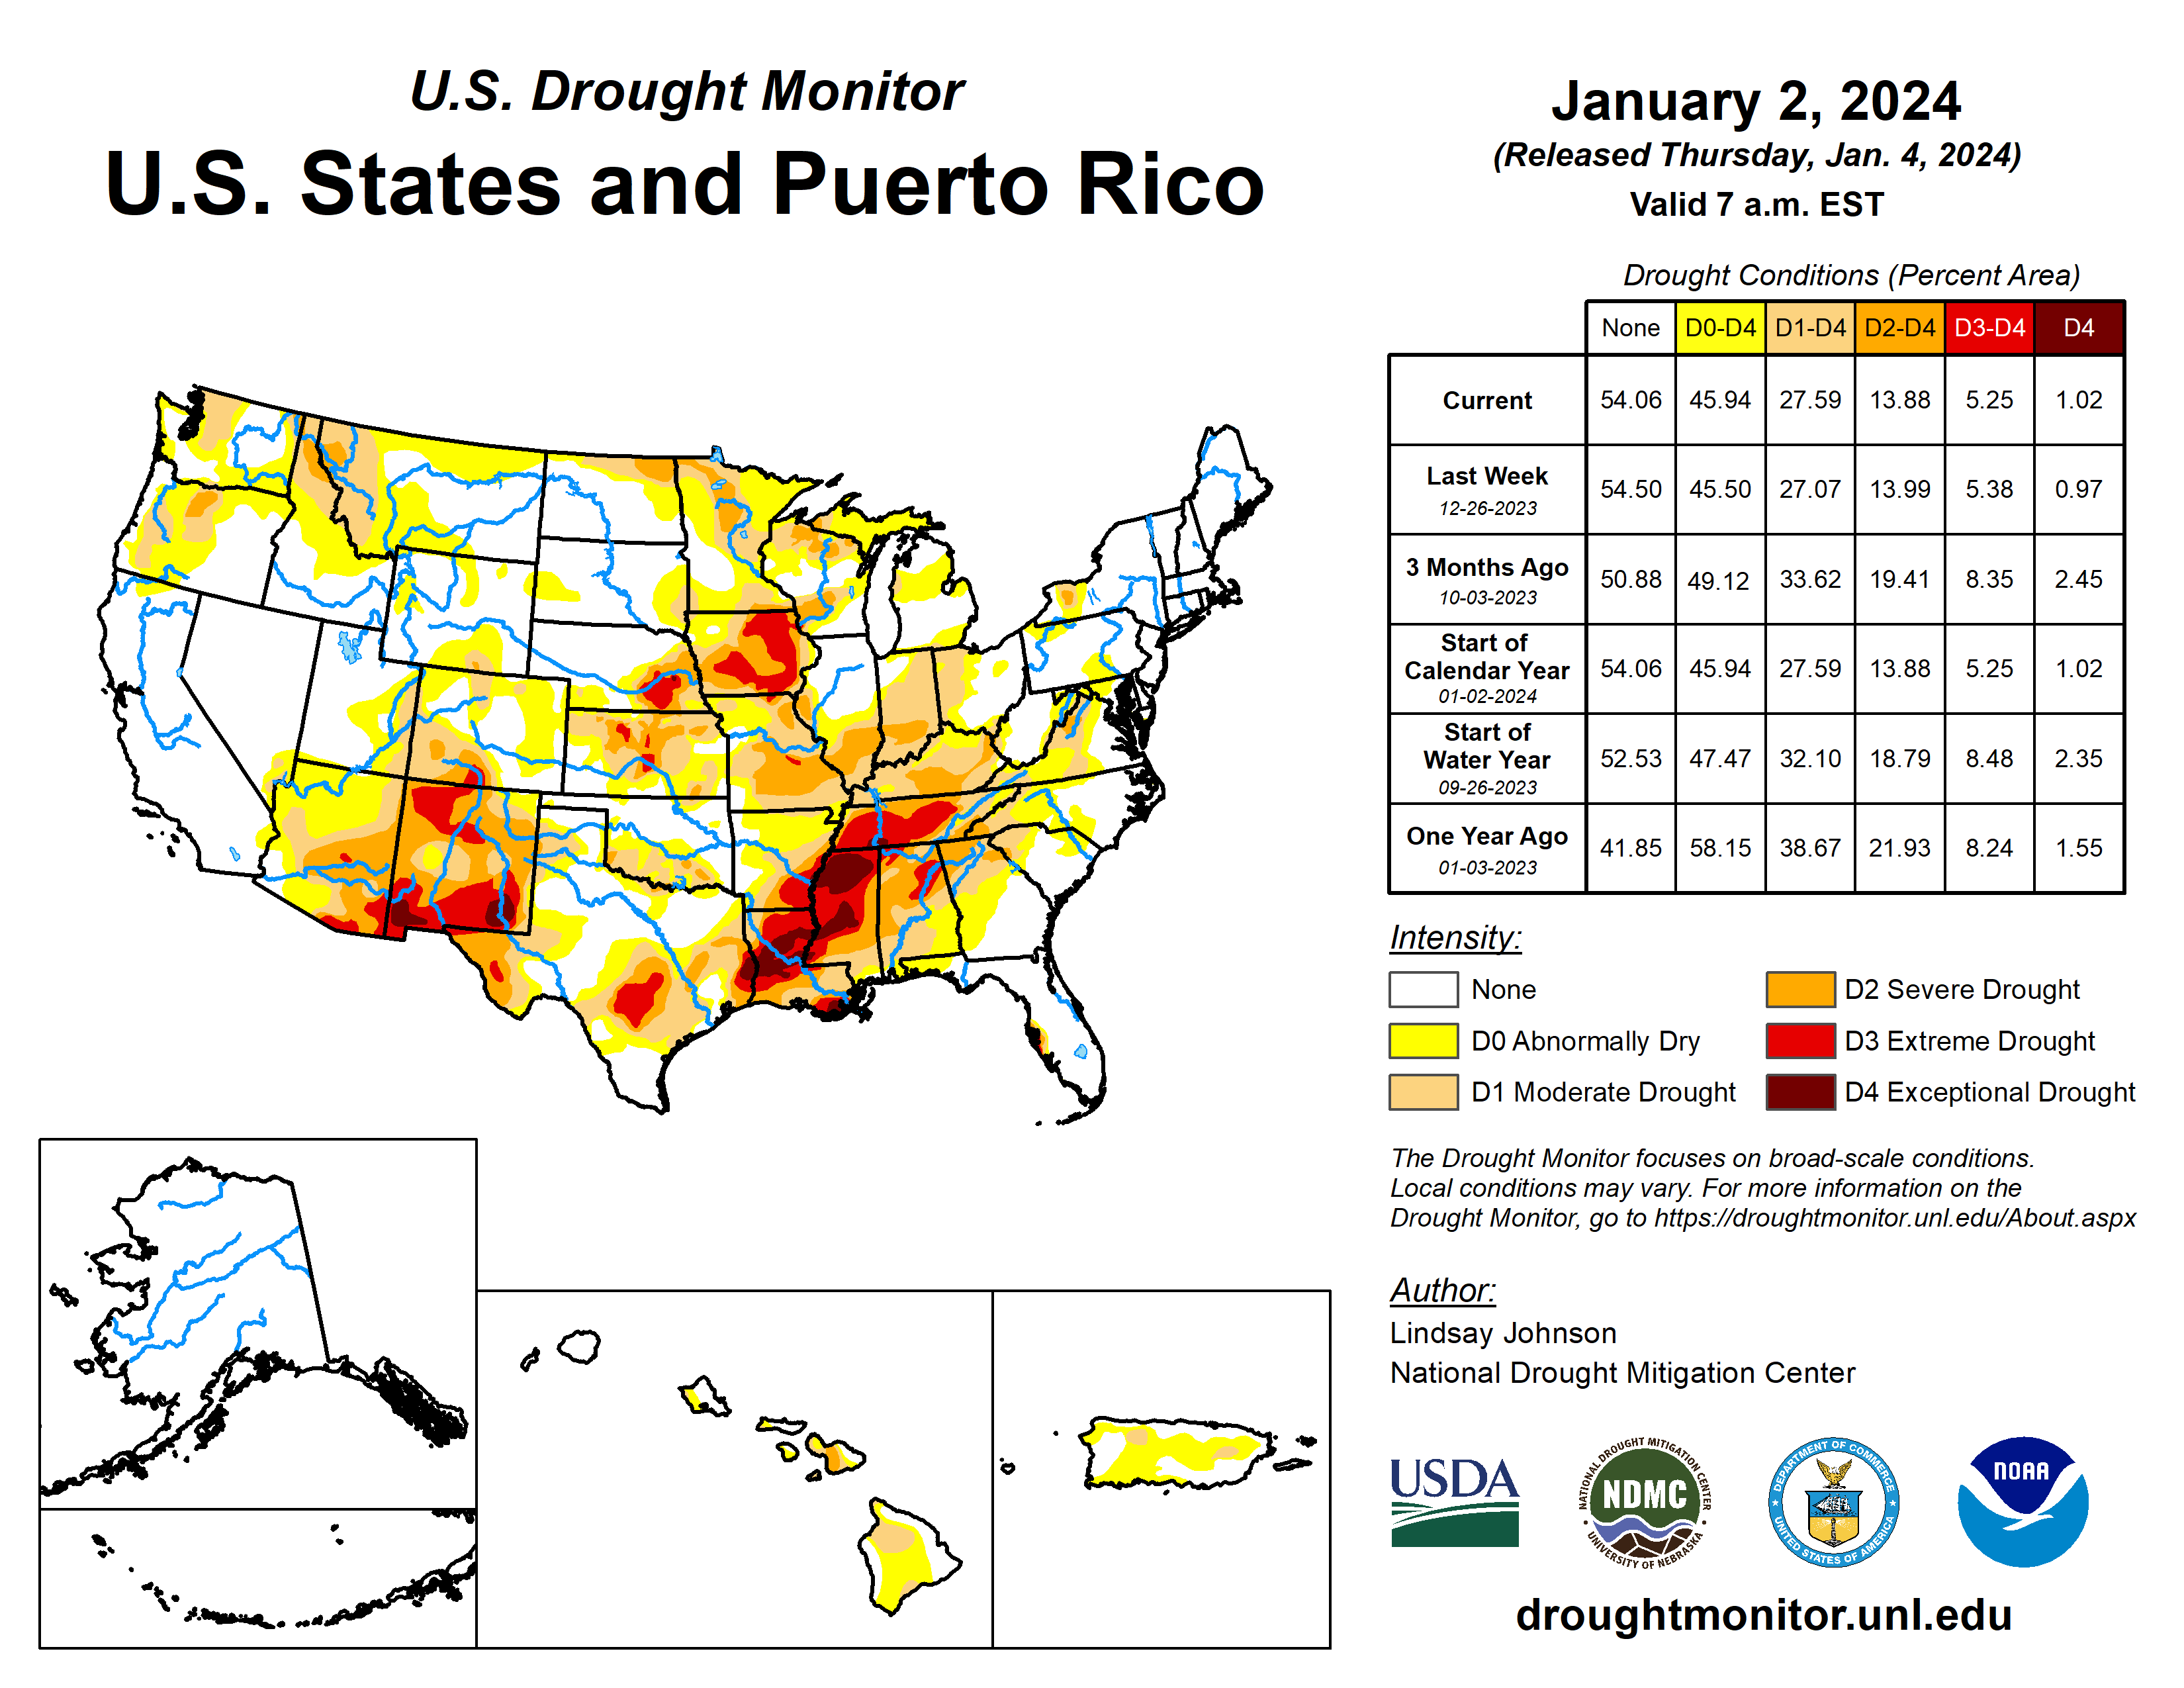
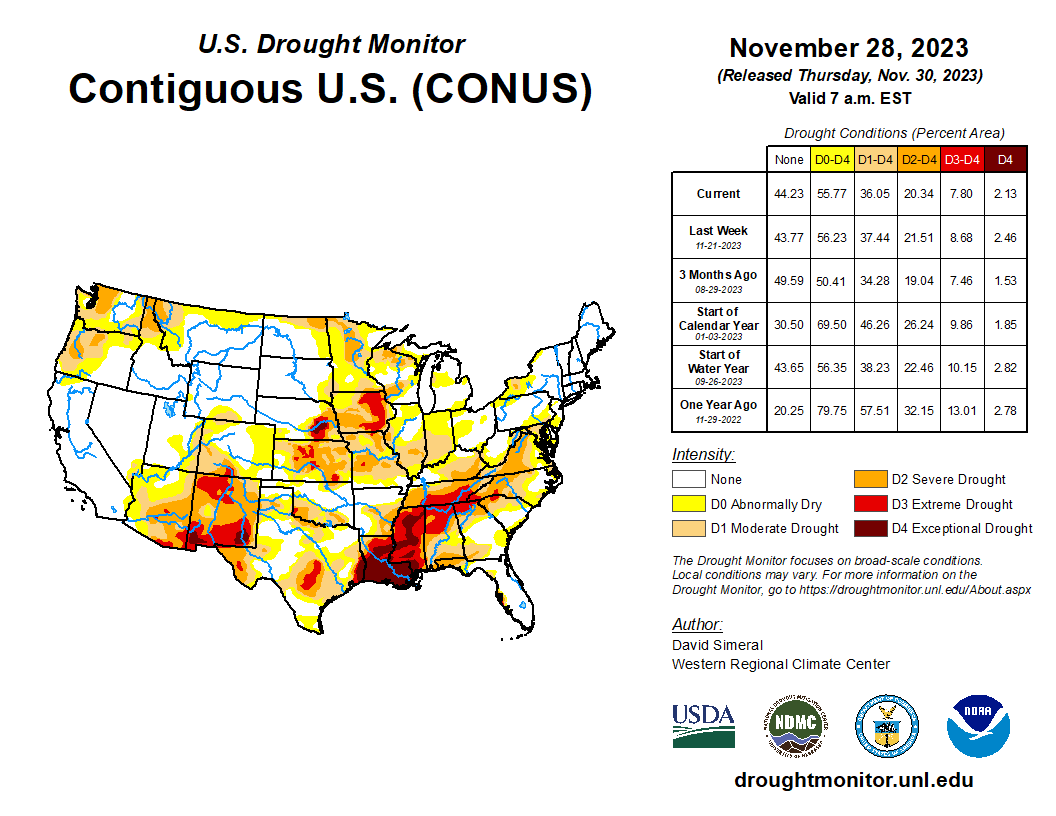
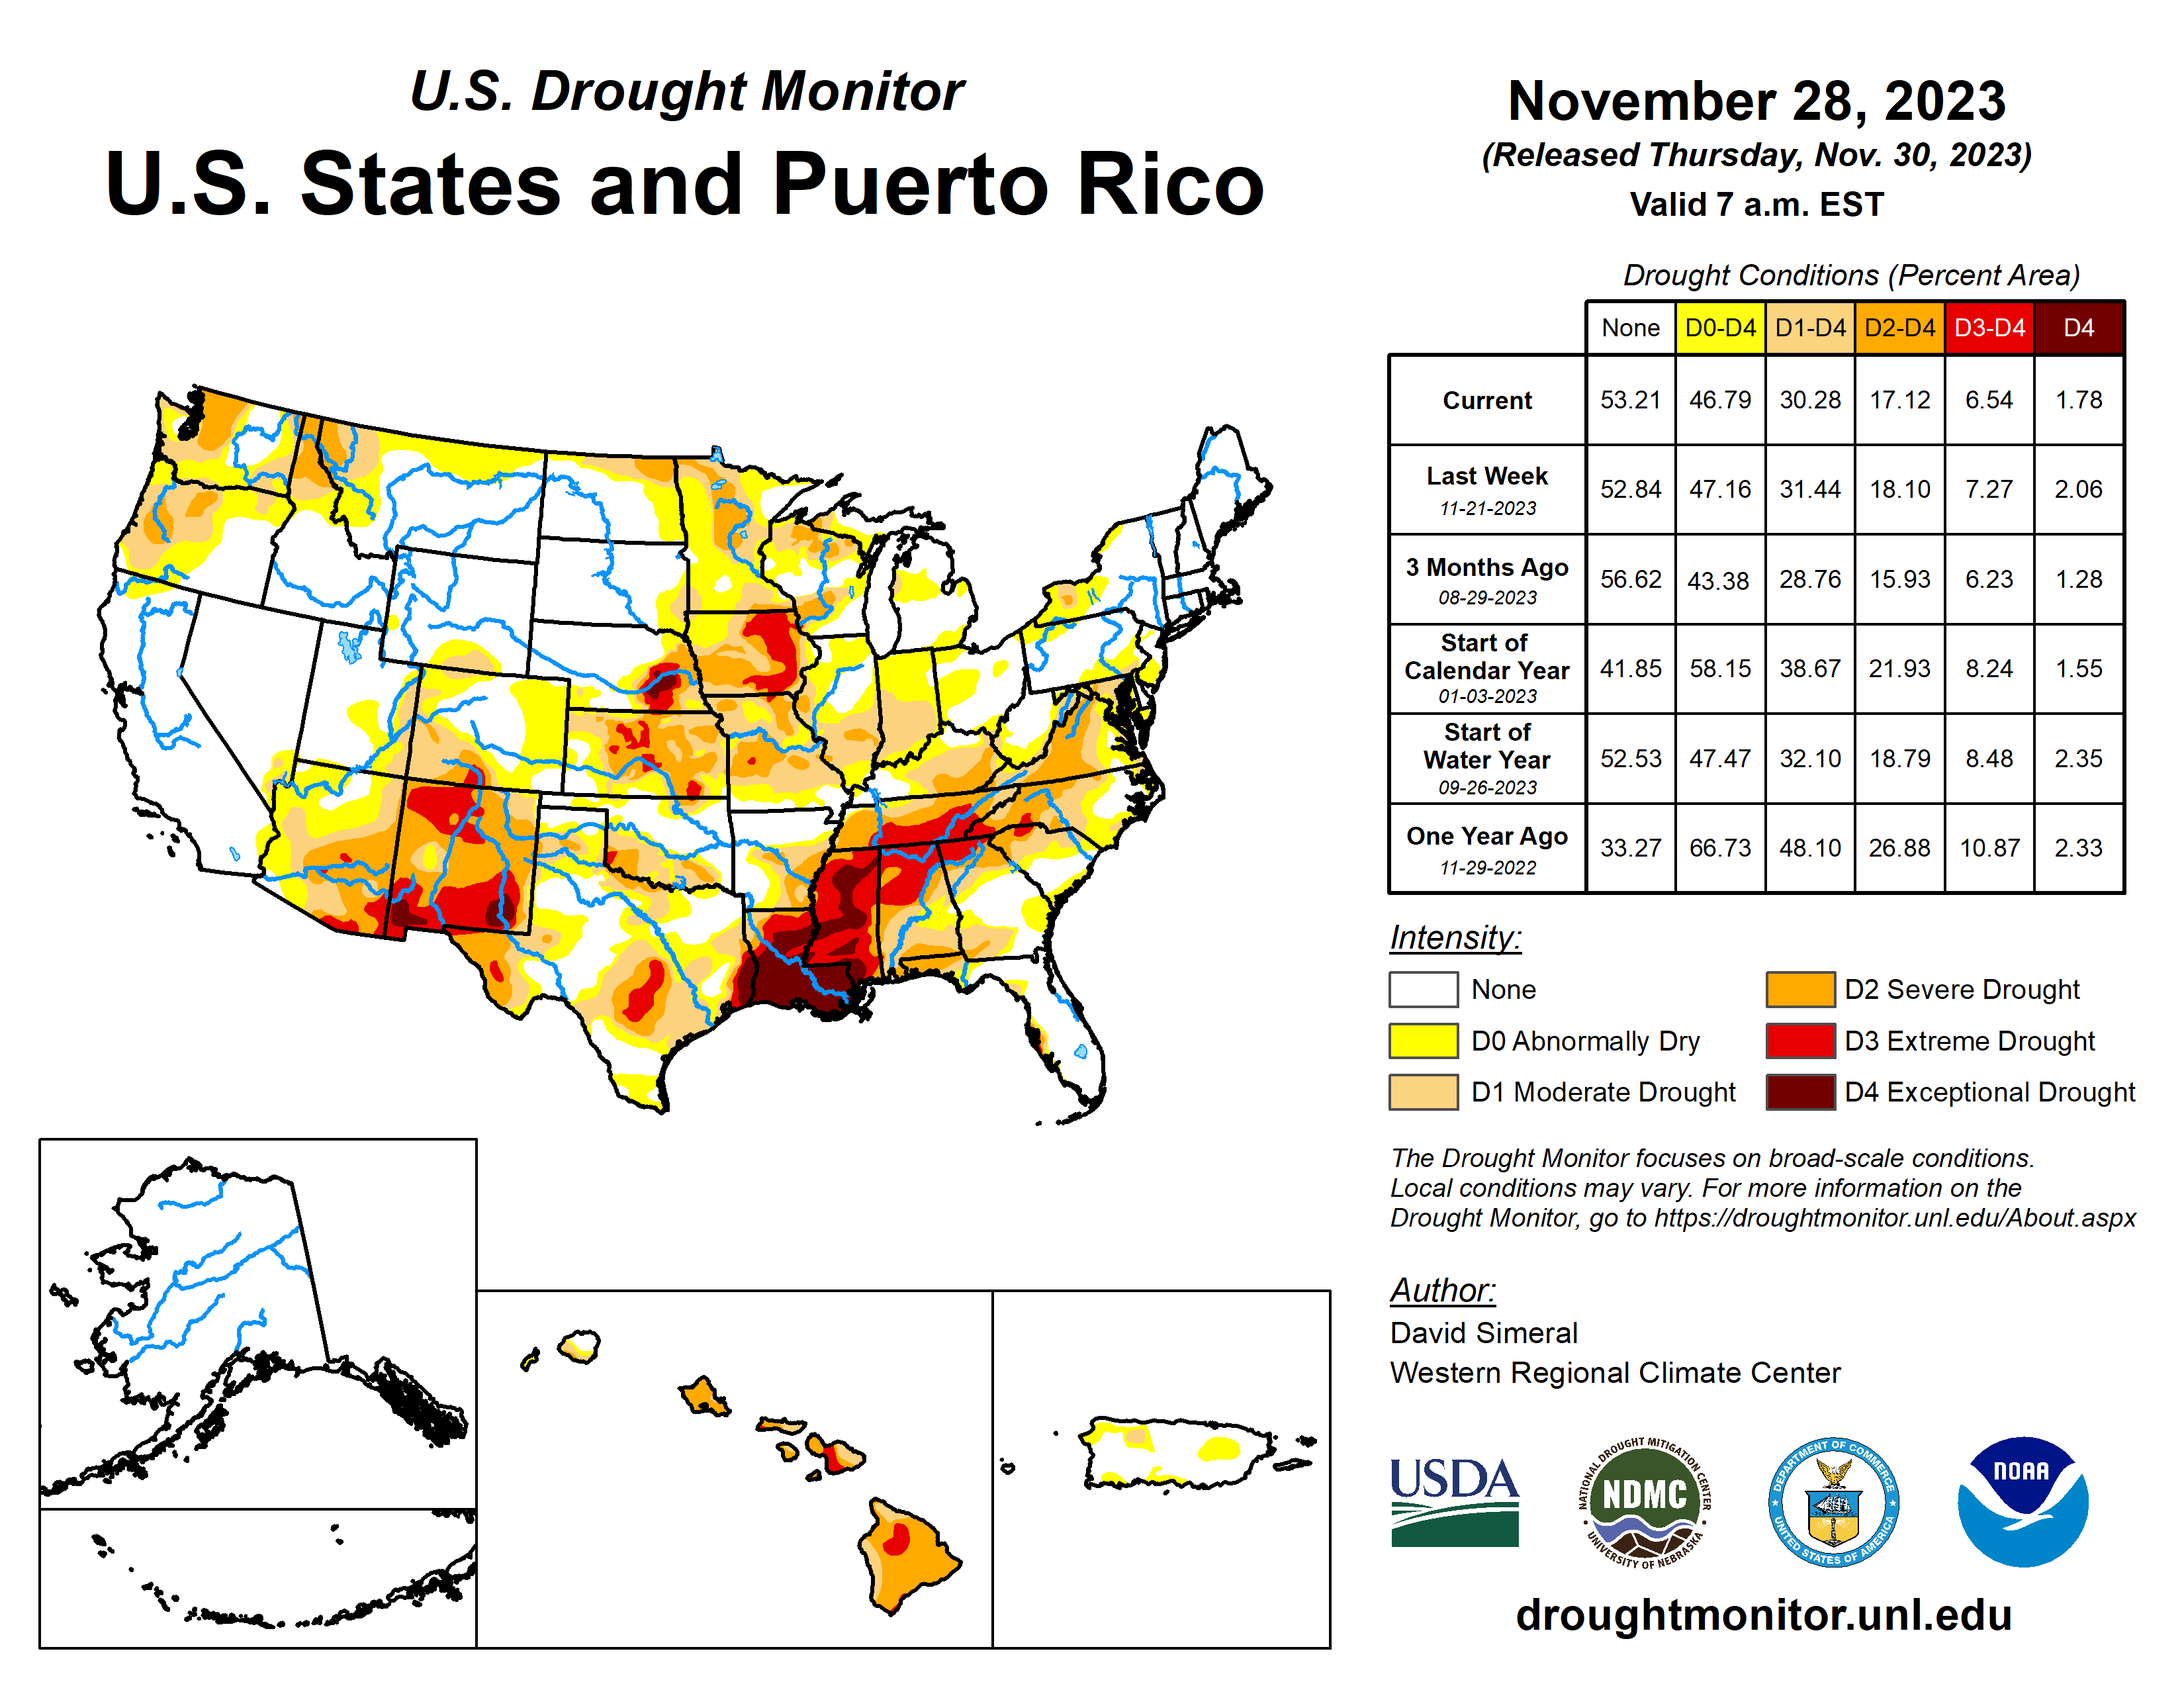
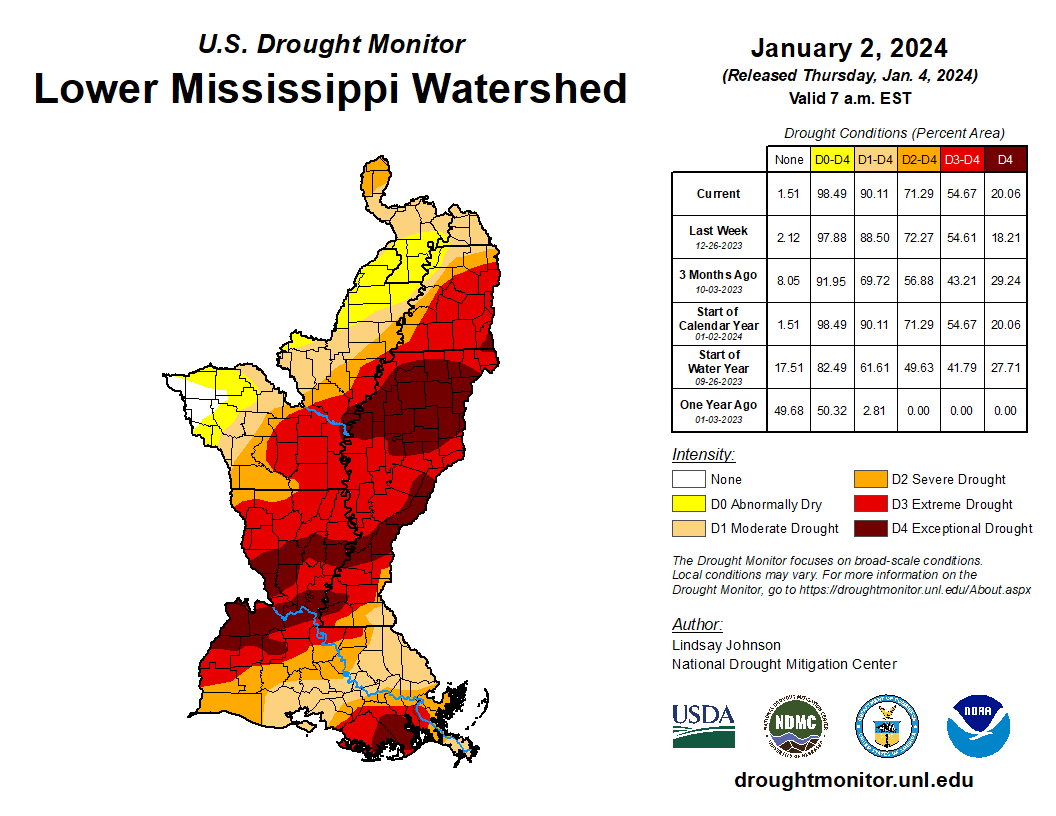
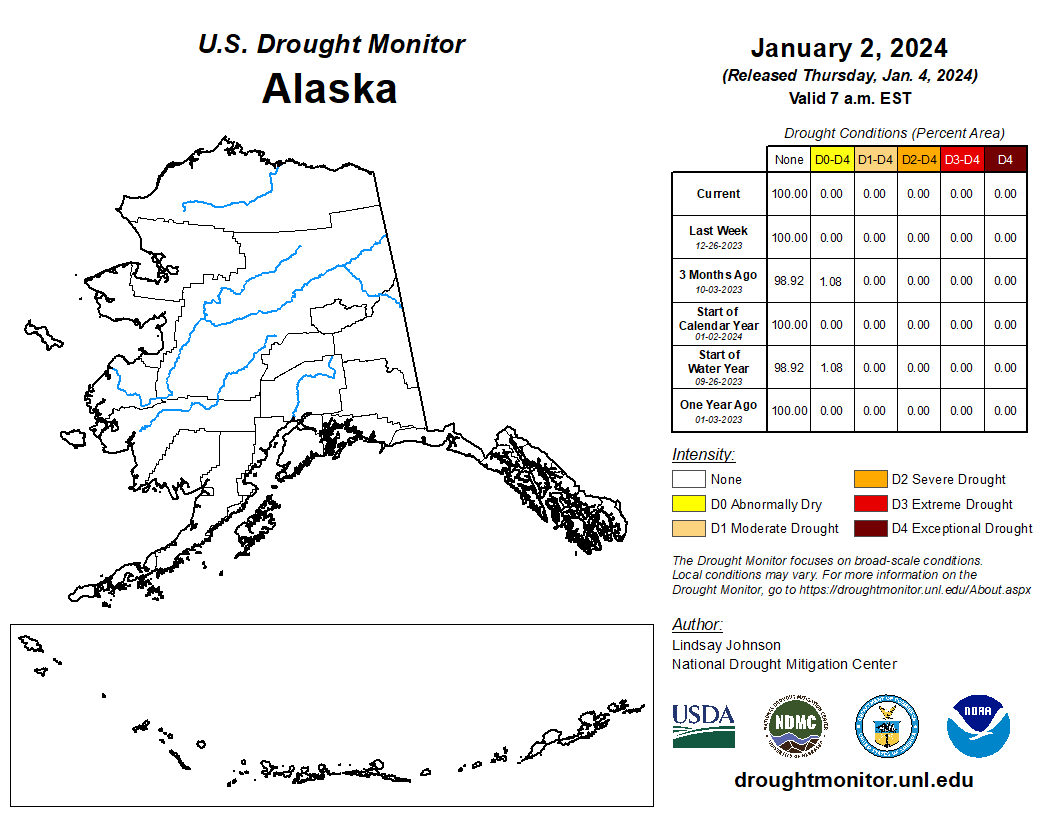
- According to the weekly U.S. Drought Monitor (USDM), as of January 2, 2024, 32.98% of the contiguous U.S. (CONUS) (27.59% of the U.S. including Alaska, Hawaii, and Puerto Rico) was classified as experiencing moderate to exceptional (D1-D4) drought.
Detailed Drought Overview
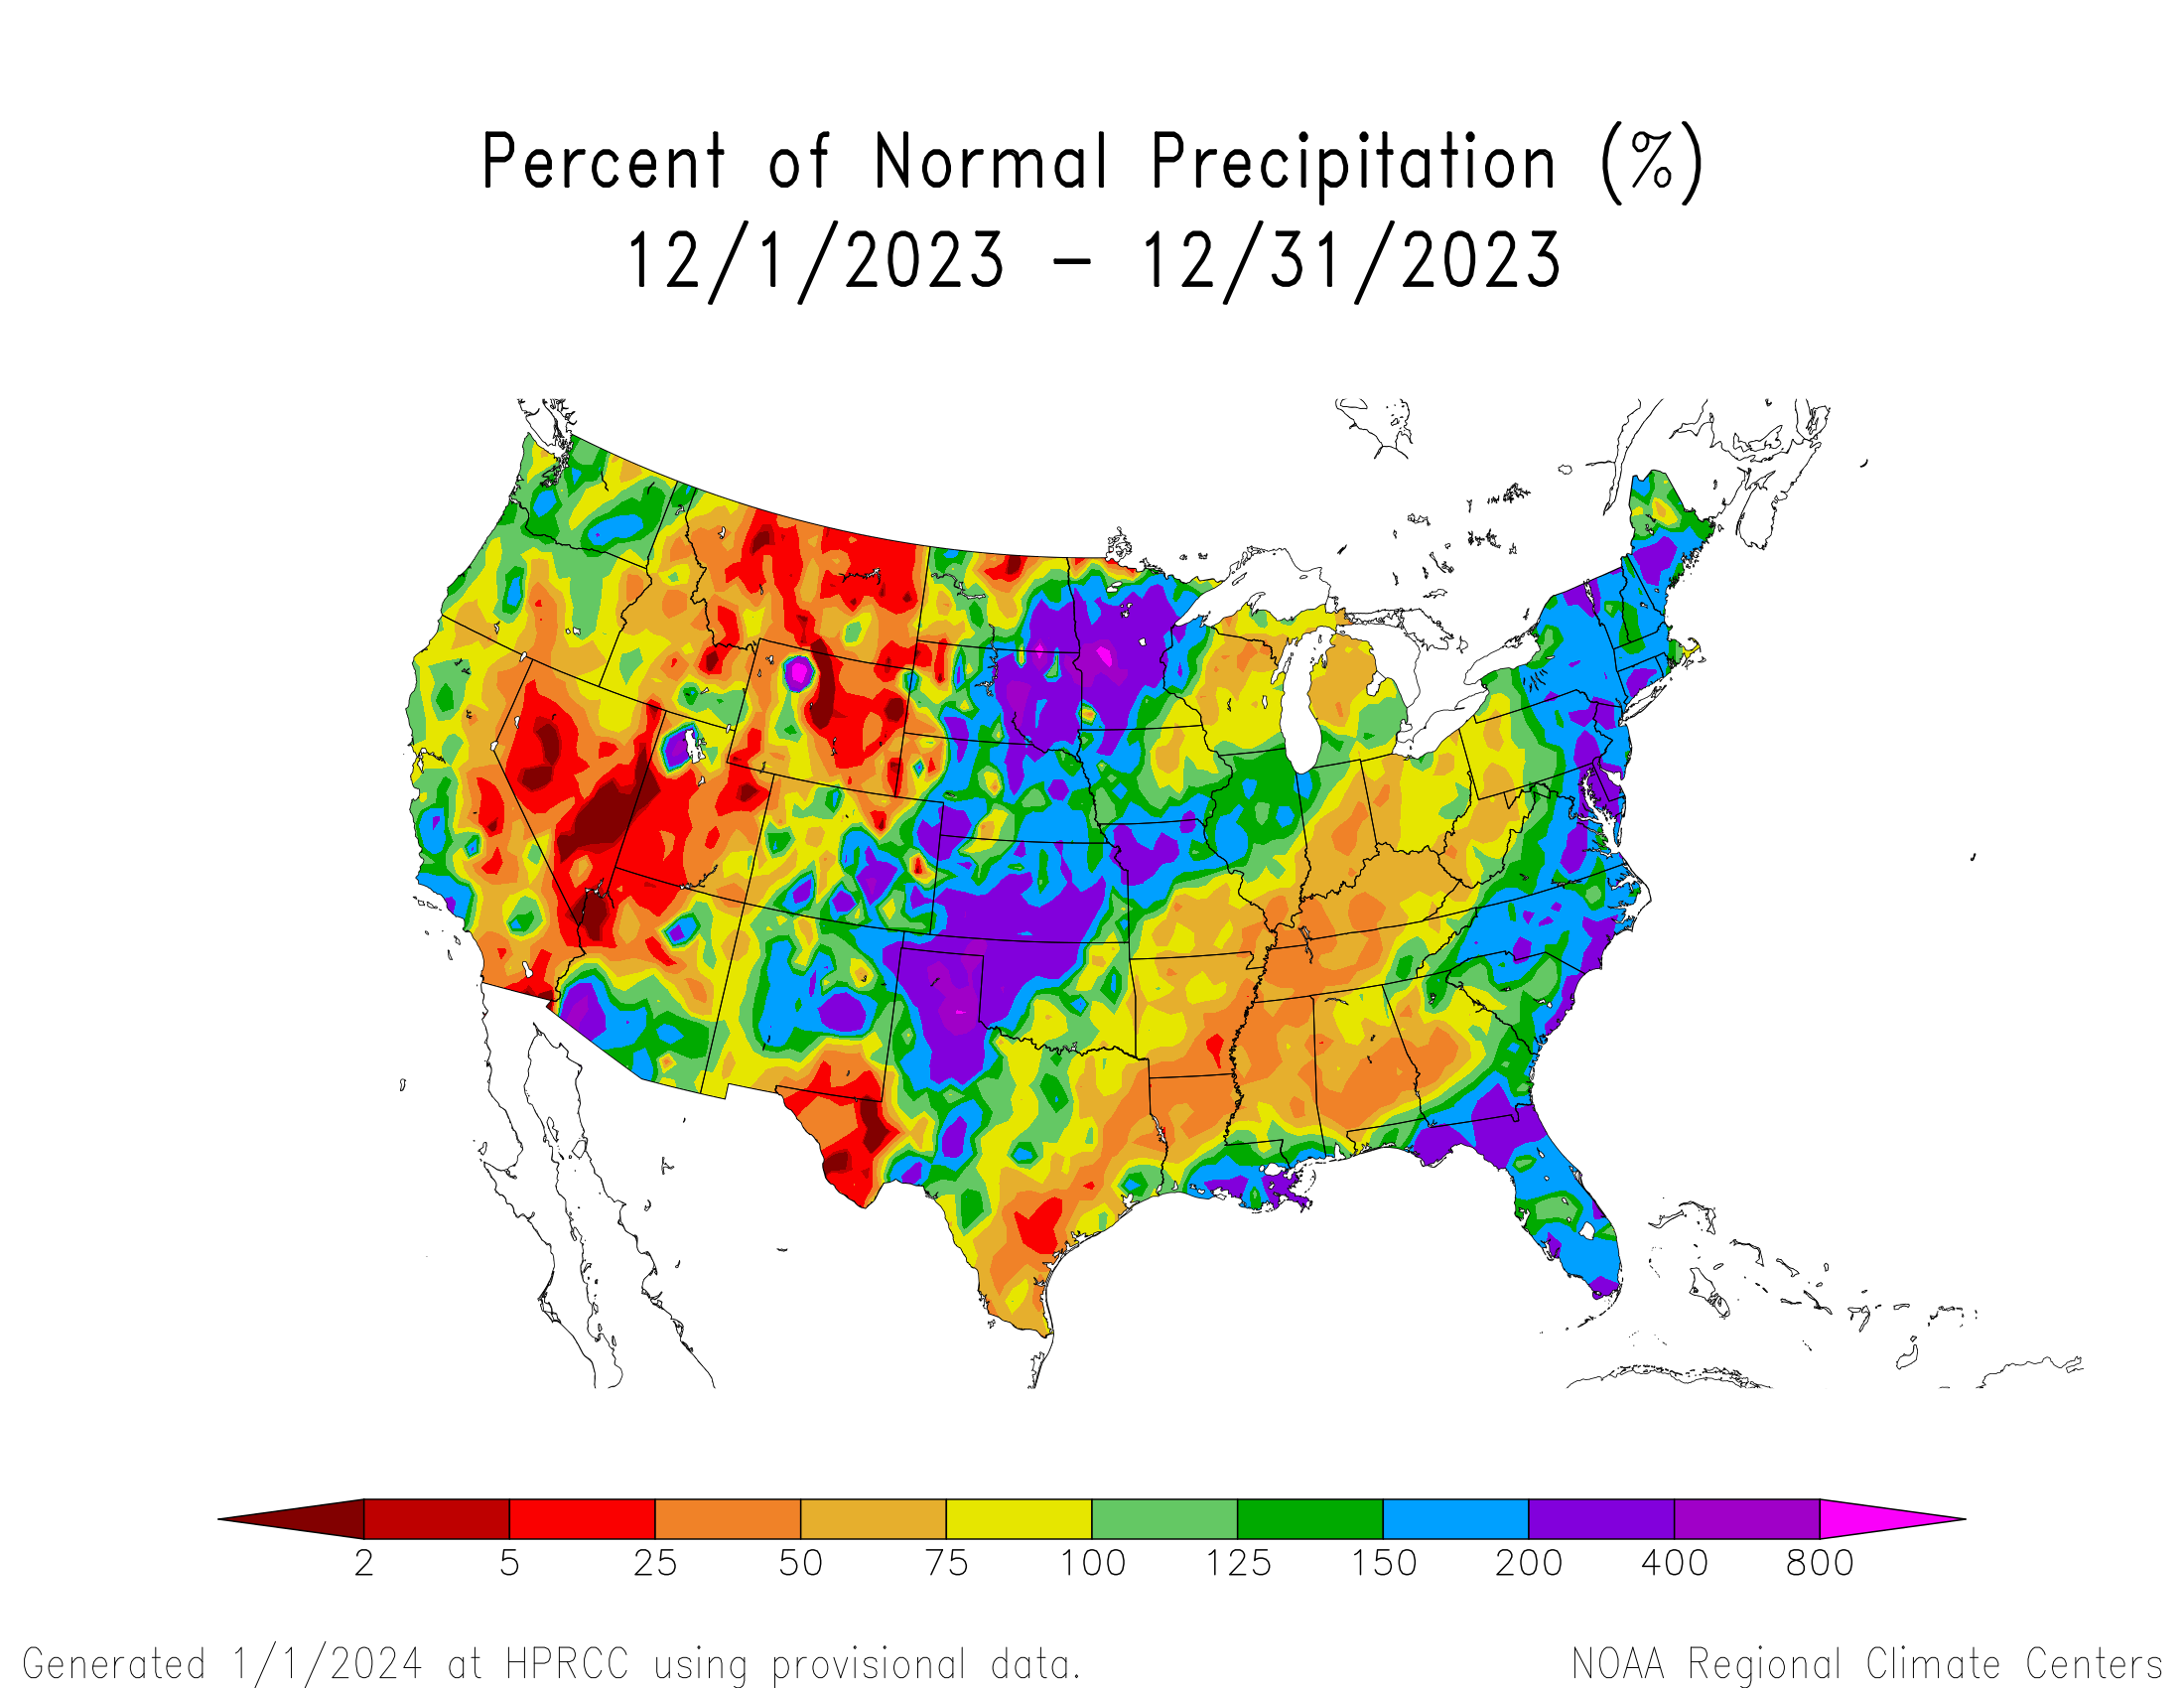
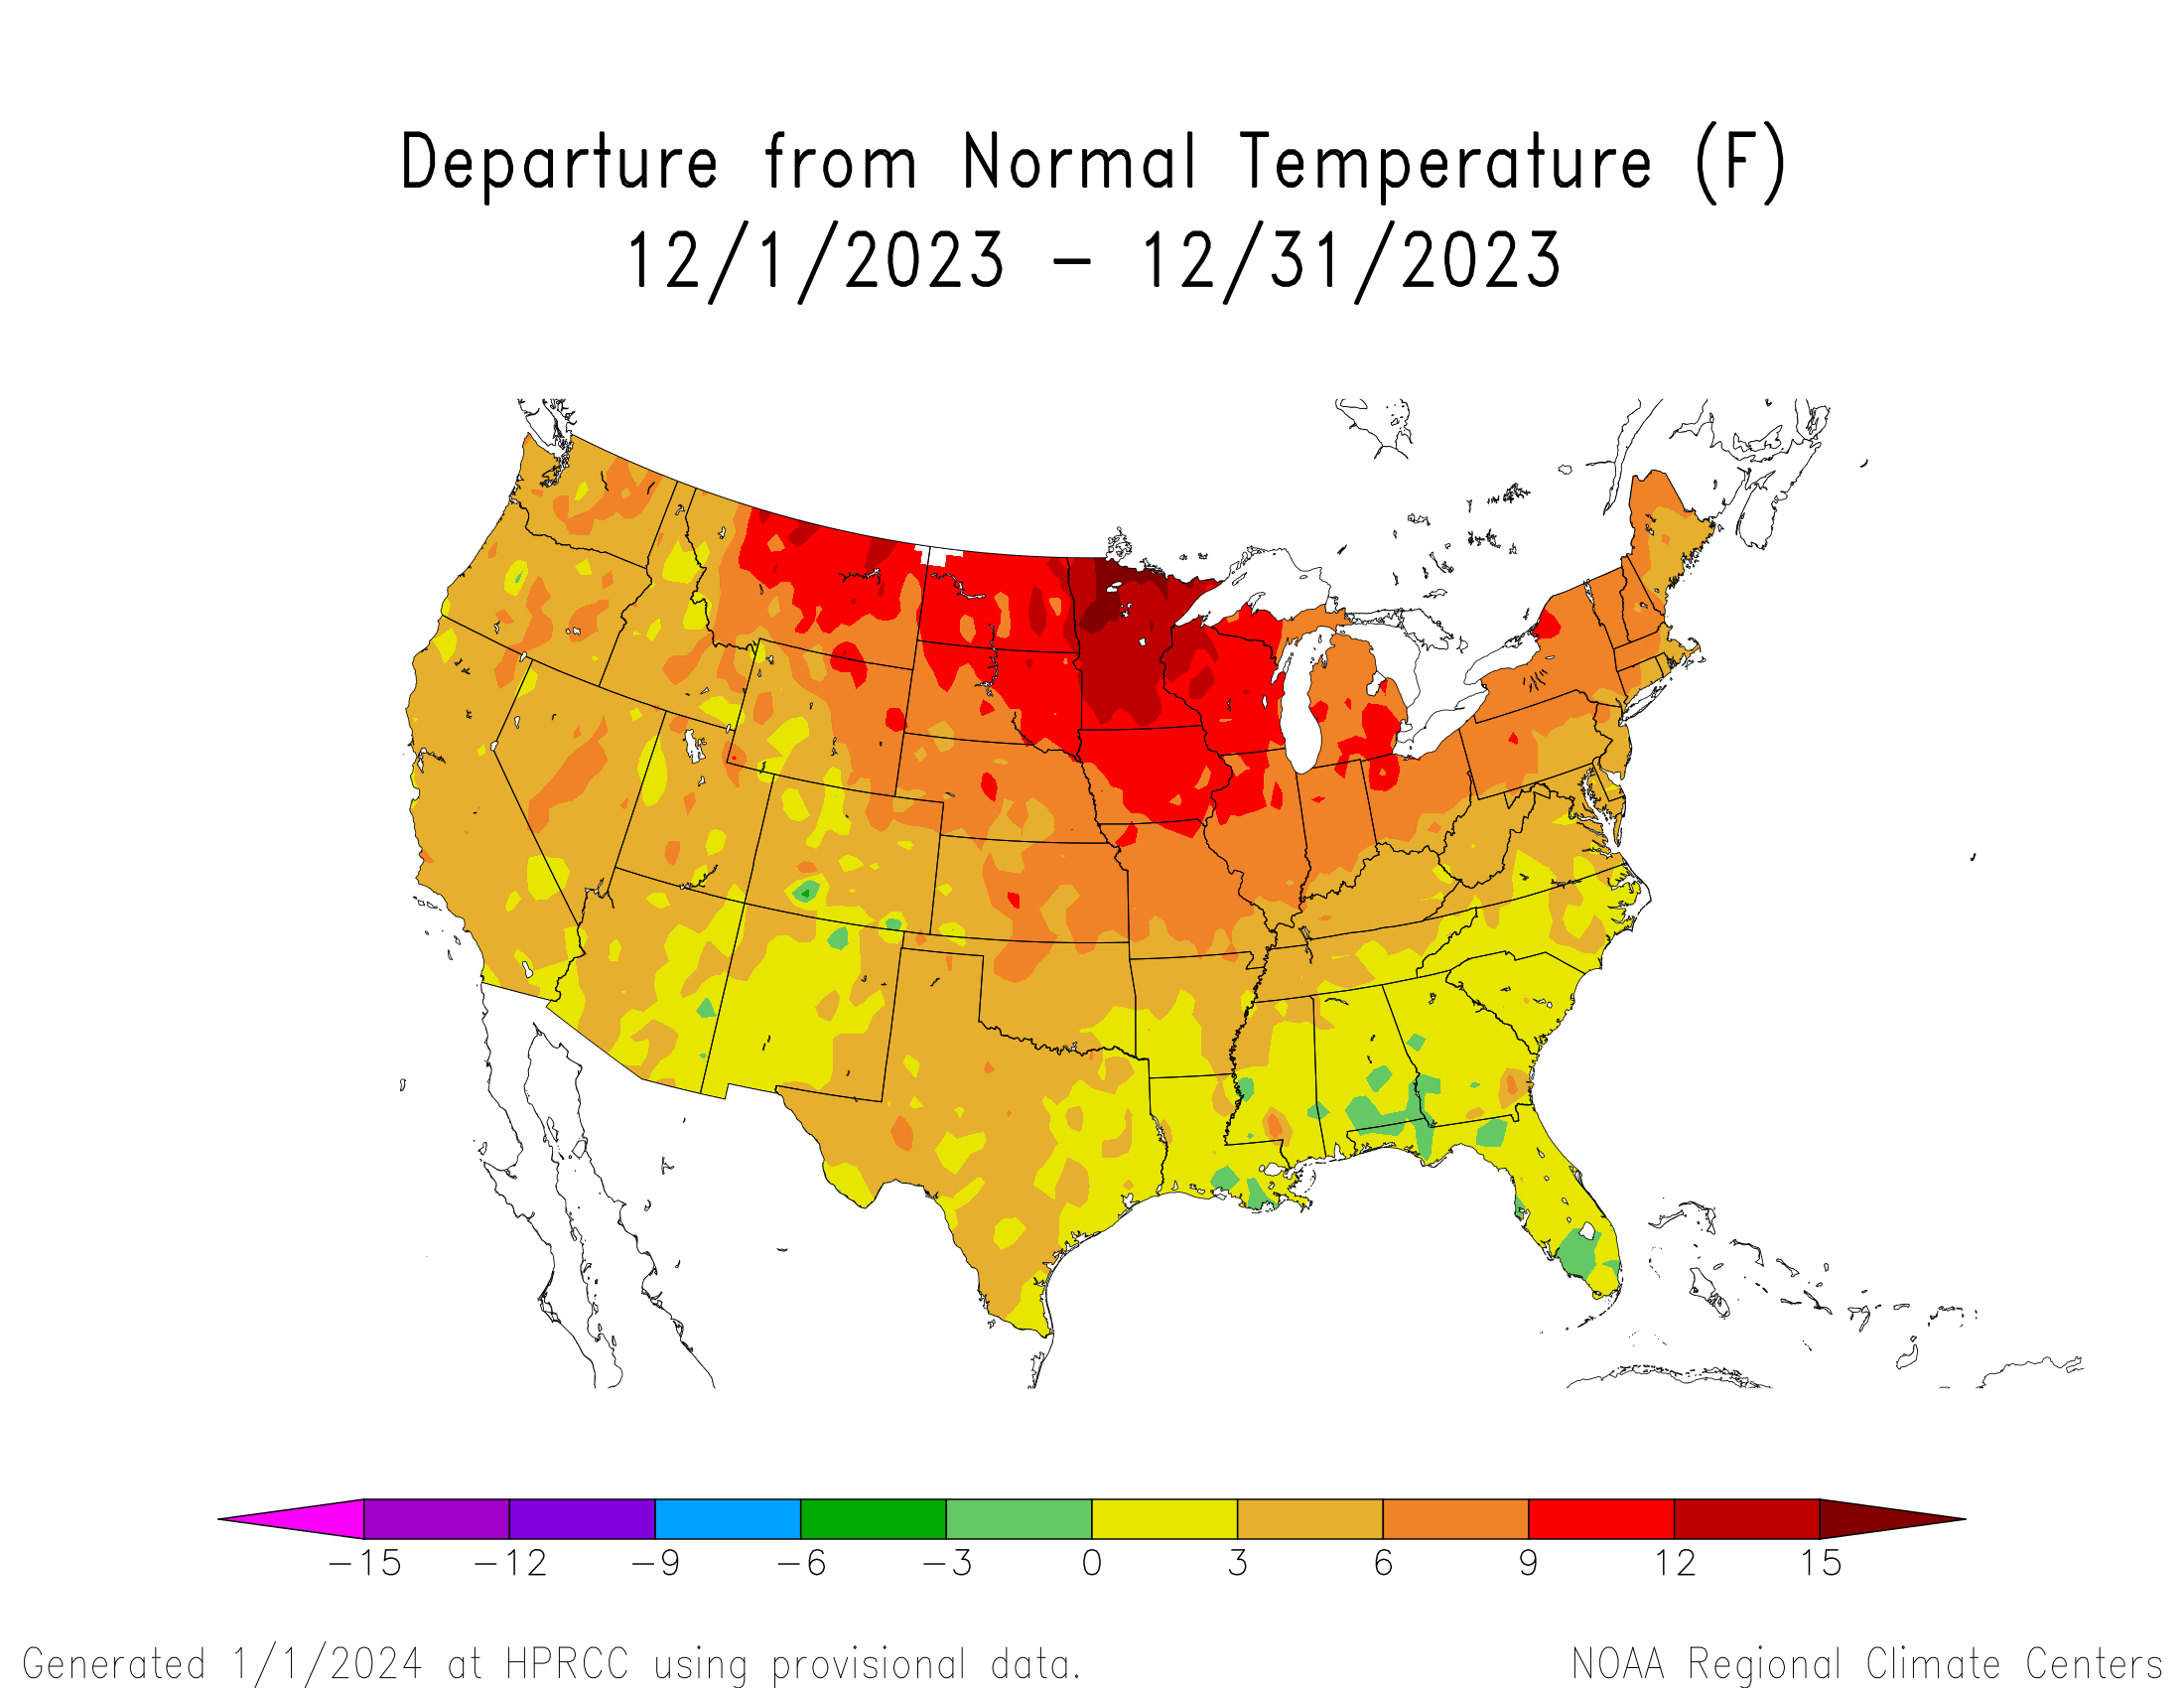
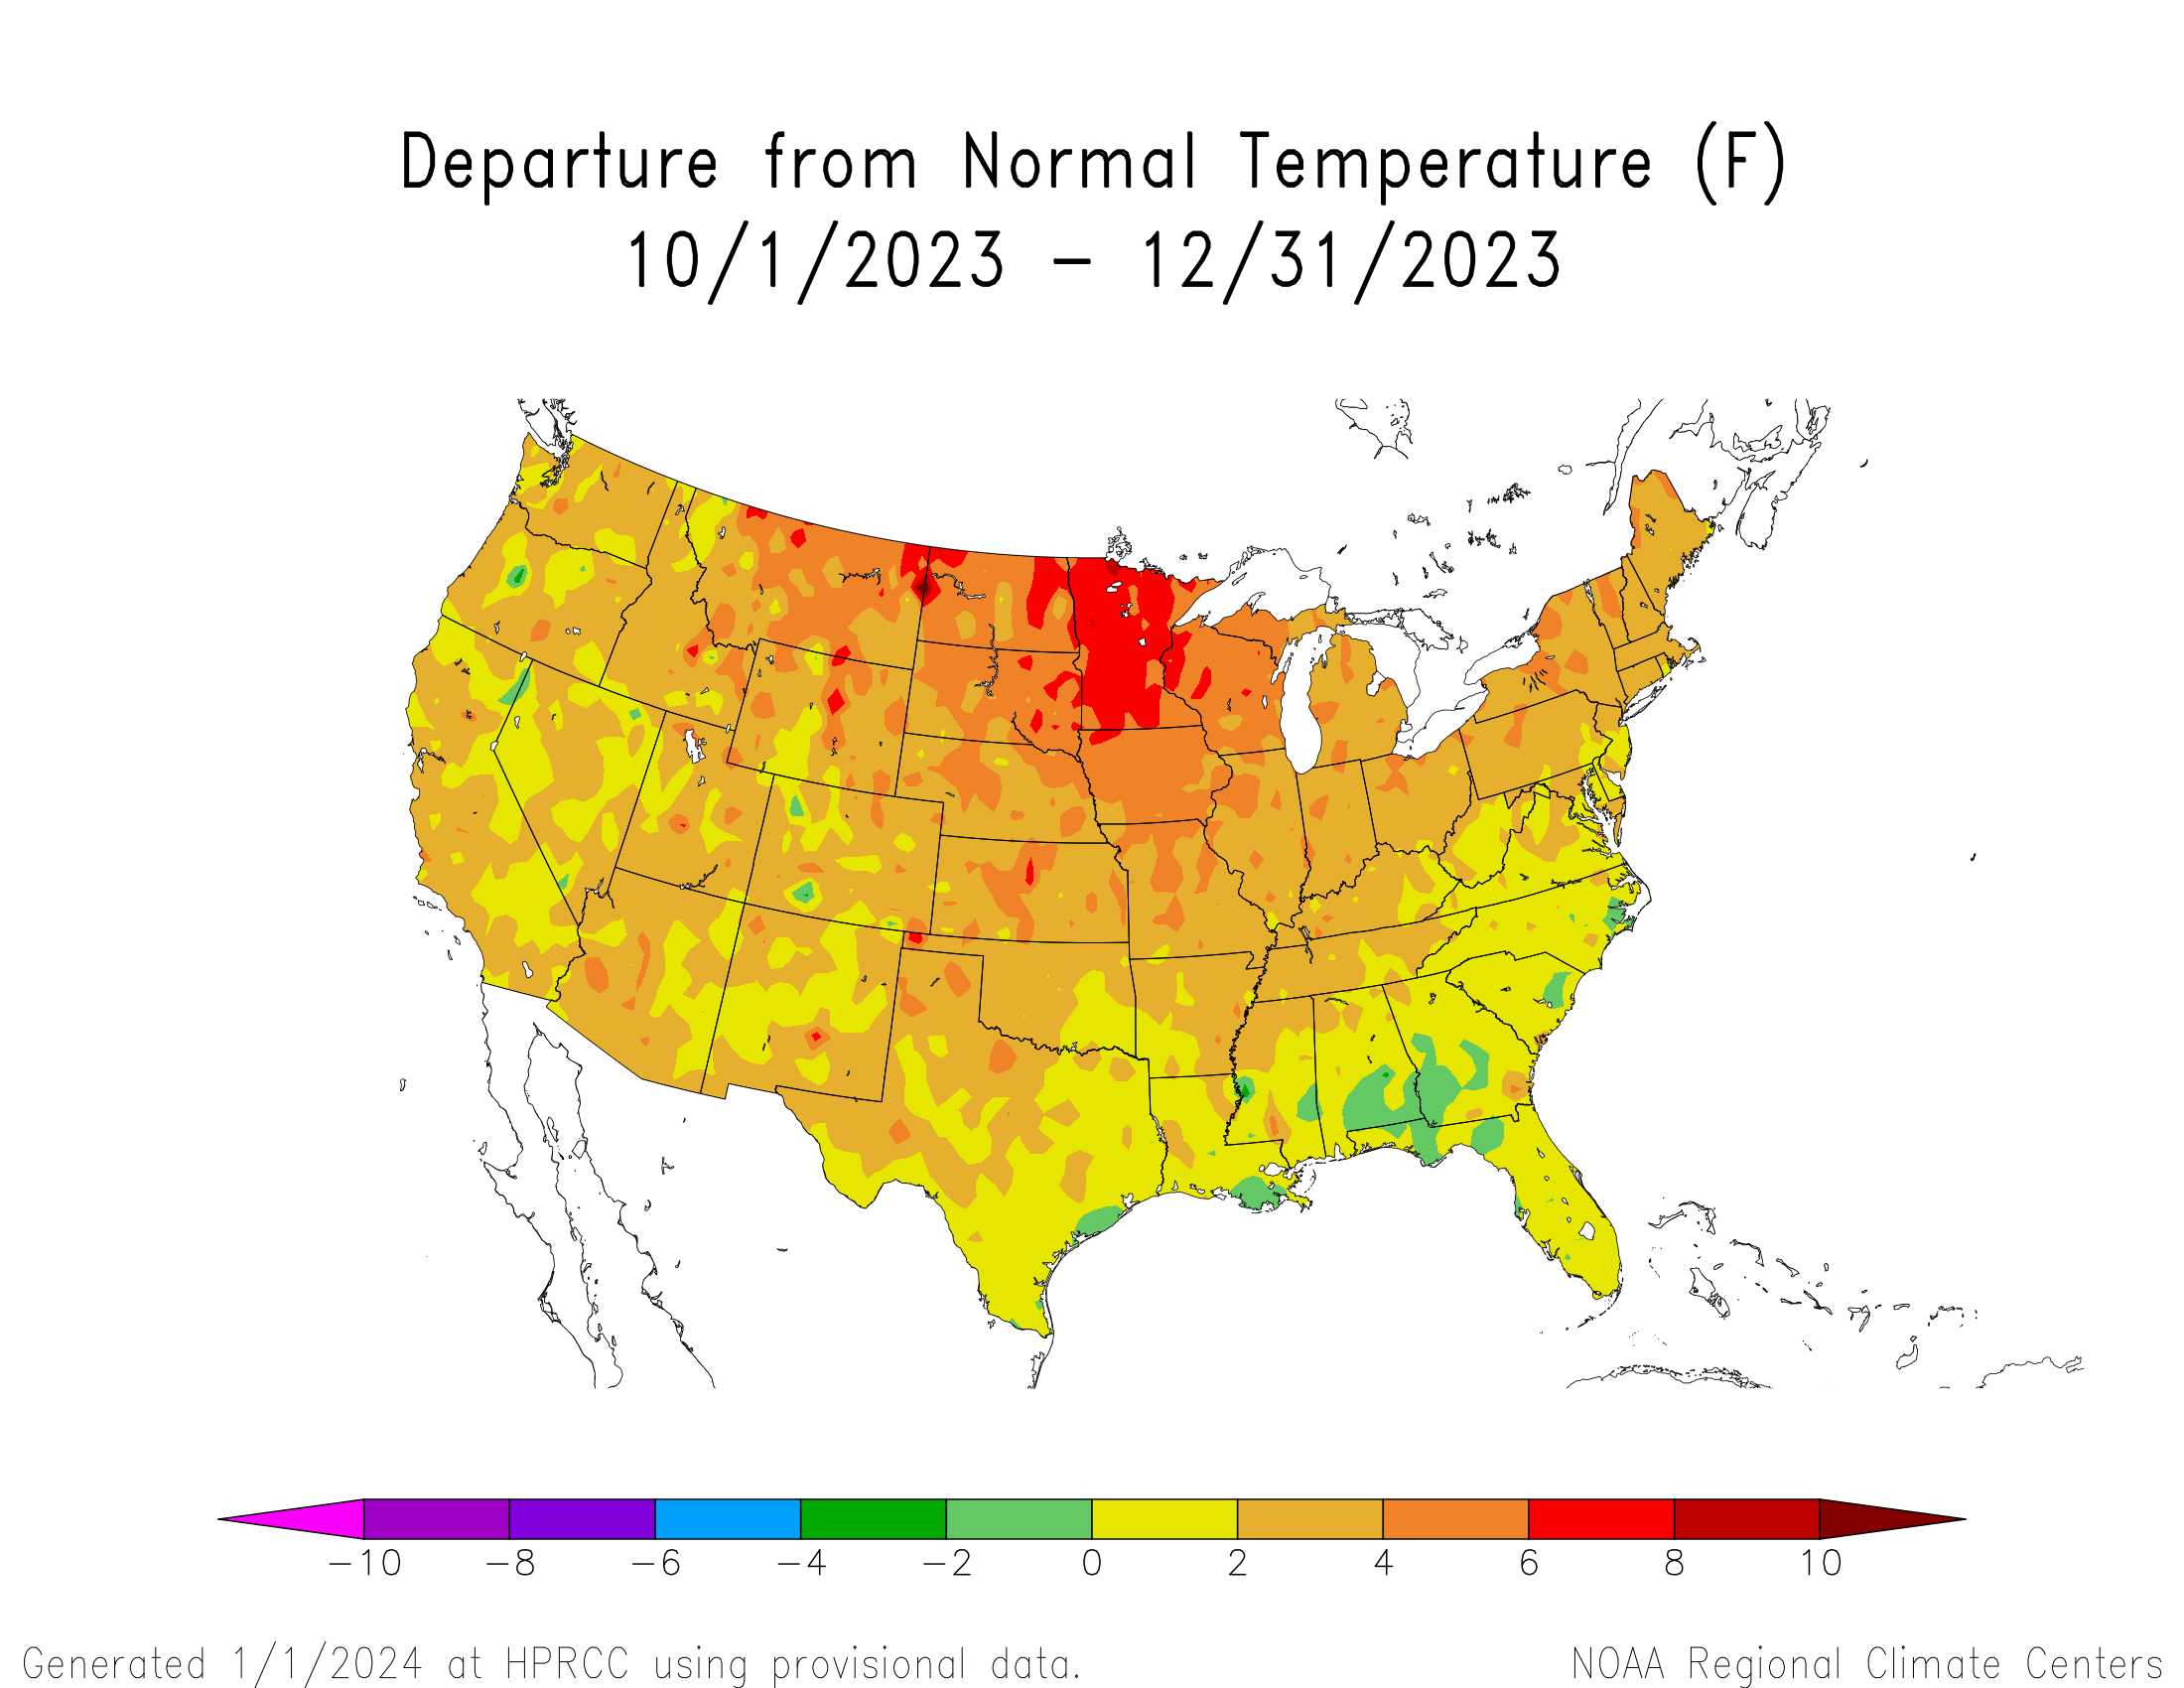
The upper-level atmospheric circulation over North America during December 2023 was very active with several Pacific weather systems moving in a vigorous westerly flow. The surface lows and cold fronts, that were associated with the Pacific systems, tapped Gulf of Mexico and Atlantic moisture to bring above-normal precipitation to a large area stretching from the central Plains to the Upper Mississippi Valley, and across the Eastern Seaboard, as well as parts of the Gulf of Mexico coast and Far West. The the weather systems moved in a flow pattern that was dominated by a high pressure ridge over western North America. The ridge inhibited precipitation over the West and produced a predominantly dry northwesterly flow over the eastern CONUS, so most of the West and large parts of the region from the southern Plains to Ohio Valley had a drier-than-normal month. The main area of the ridge shifted as the Pacific weather systems moved across the CONUS so that, when averaged over the month, the anomaly center was entrenched over the North America interior from southern Canada to the northern CONUS. The ridge was responsible for a warmer-than-normal month across almost the entire CONUS, with the greatest temperature anomalies located over the northern Plains to Great Lakes.
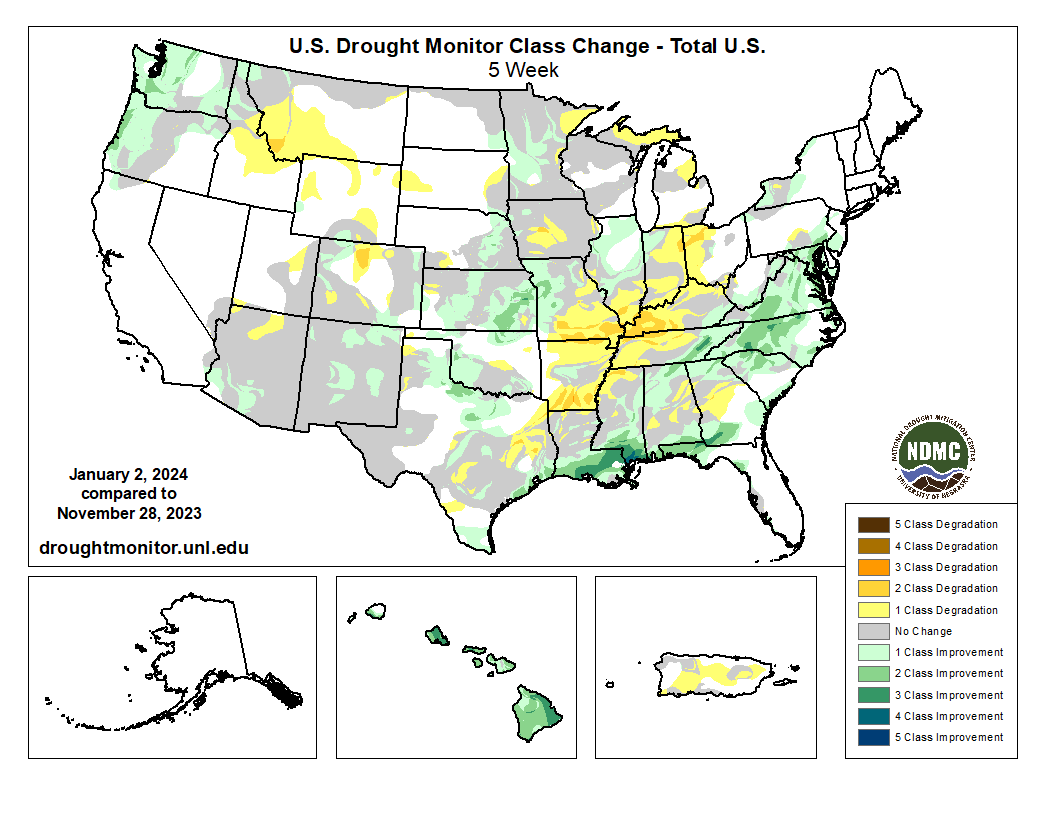
The below-normal precipitation in December led to expansion or intensification of drought or abnormal dryness over parts of the central to northern Rockies and from northeast Texas to the Ohio Valley. Above-normal precipitation or a re-evaluation of conditions resulted in contraction or reduction in the intensity of drought in the Pacific Northwest, Southwest to Upper Mississippi Valley, and central Gulf of Mexico coast to Mid-Atlantic, as well as much of Hawaii. Drought contraction exceeded expansion with the USDM-based national moderate-to-exceptional drought footprint across the CONUS decreasing from 36.1% at the end of November to 33.0% at the end of December (from 30.3% to 27.6% for the 50 states and Puerto Rico).
According to the Palmer Drought Index, which goes back to the beginning of the 20th century, about 37.1% of the CONUS was in moderate to extreme drought at the end of December, which is an increase compared to revised values for the end of November.
Drought conditions at the end of December, as depicted on the January 2, 2024 USDM map, included the following core drought and abnormally dry areas:

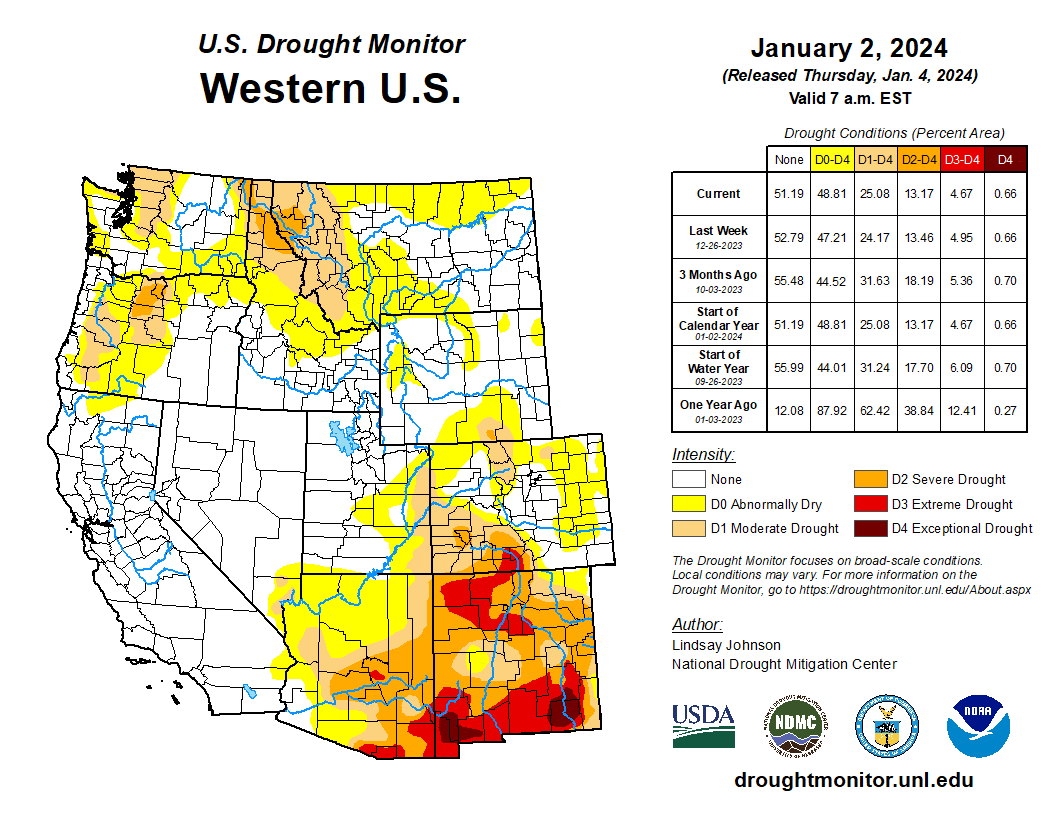
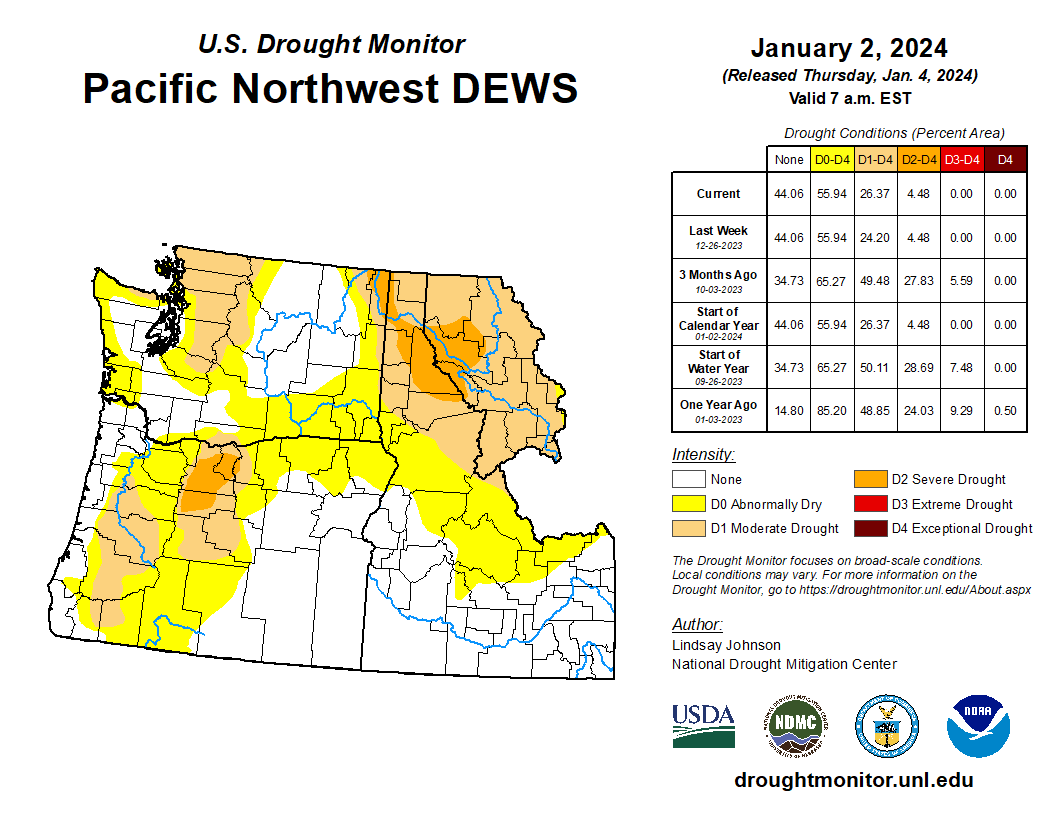
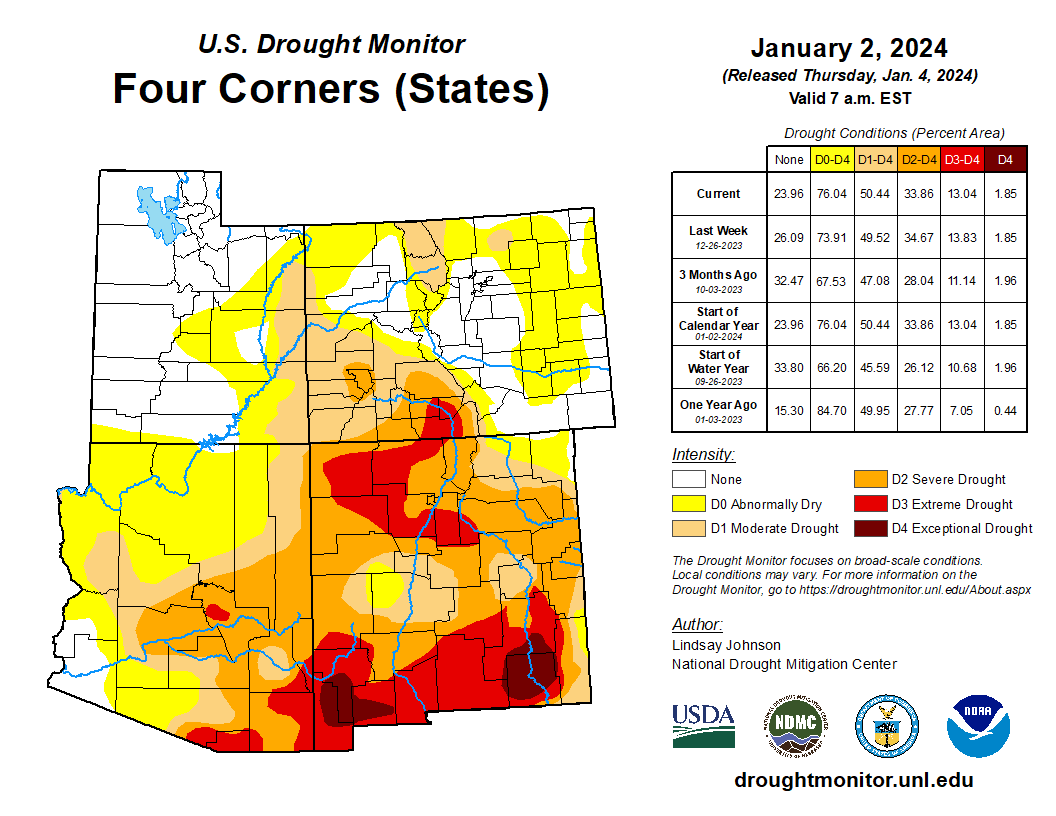
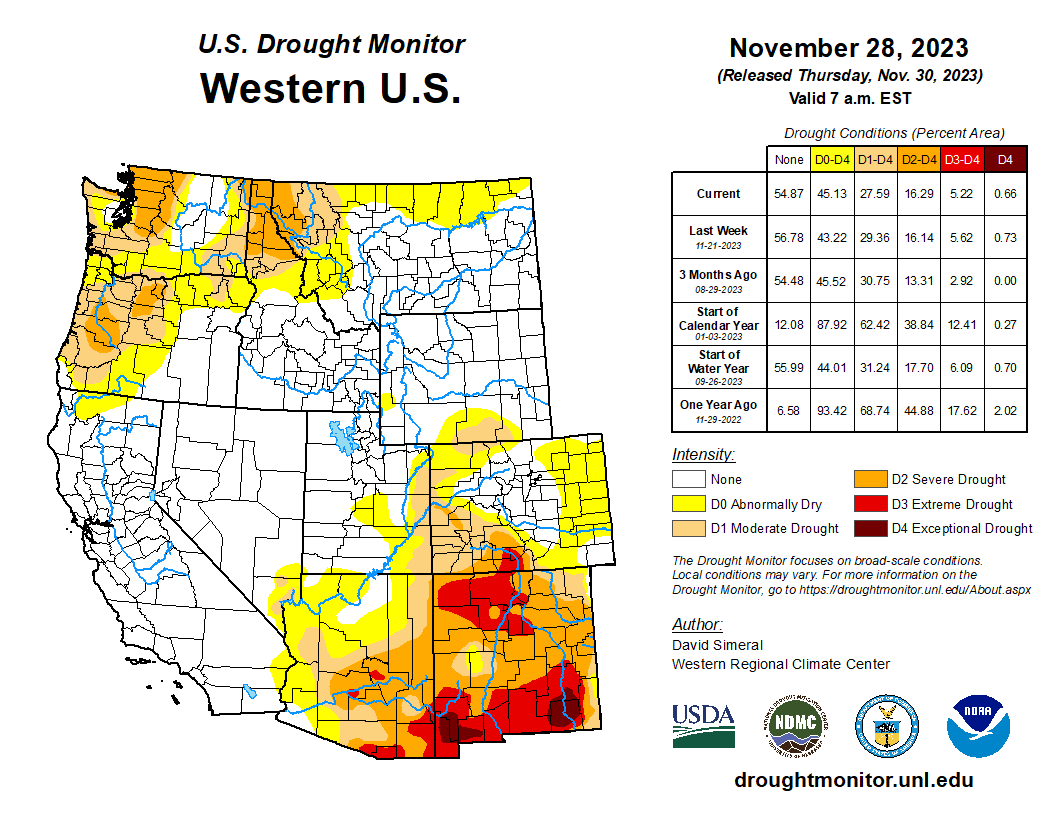
- In the West, moderate (D1) to severe (D2) drought covered about 26.4% of the Pacific Northwest, which is less than last month, and moderate to exceptional (D4) drought affected about 50.4% of the Southwest (Four Corners states), which is about the same as last month. For the West as a whole, the percent area experiencing moderate to exceptional drought, according to USDM statistics, shrank from 27.6% at the end of November to 25.1% at the end of December. Based on the Palmer Drought Index, the drought area across the West as a whole increased from 30.1% at the end of November to 40.8% at the end of December.
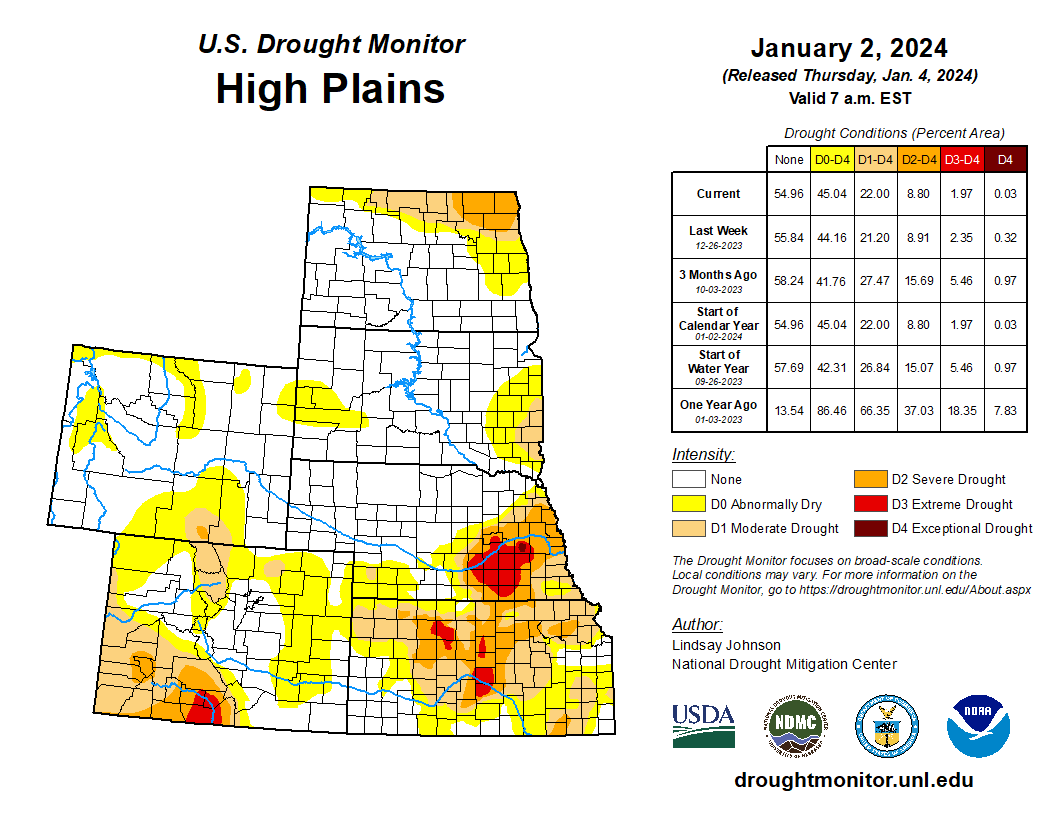
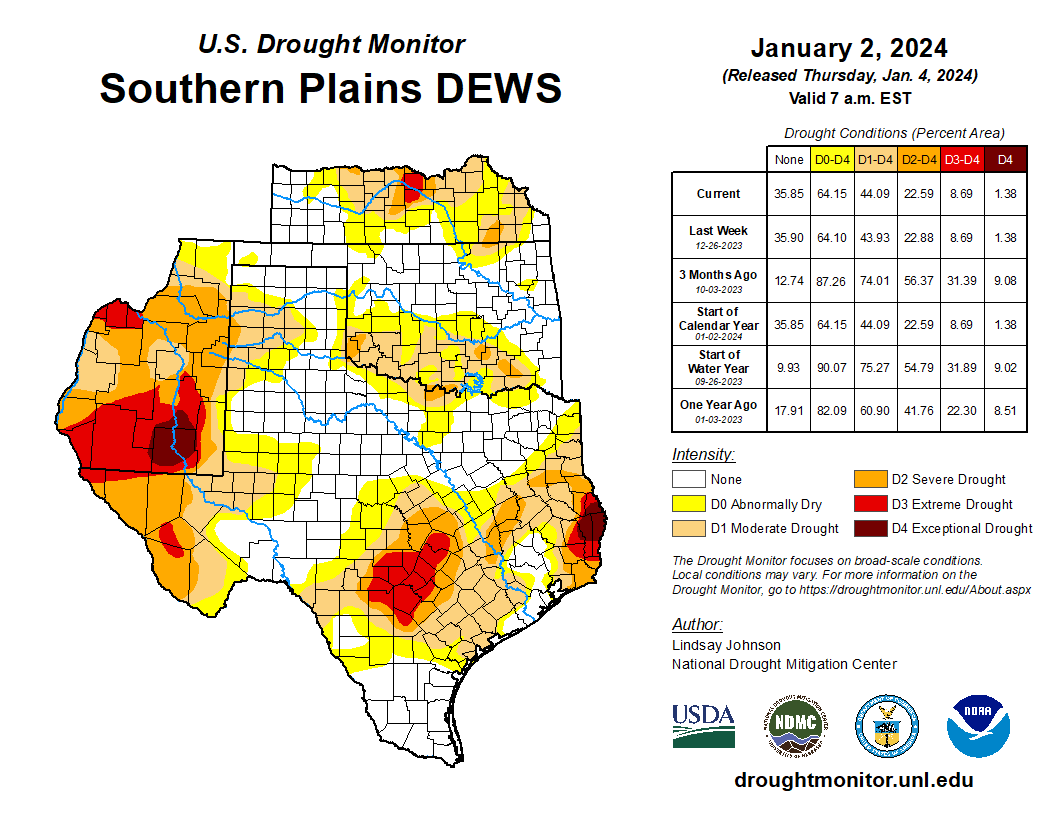
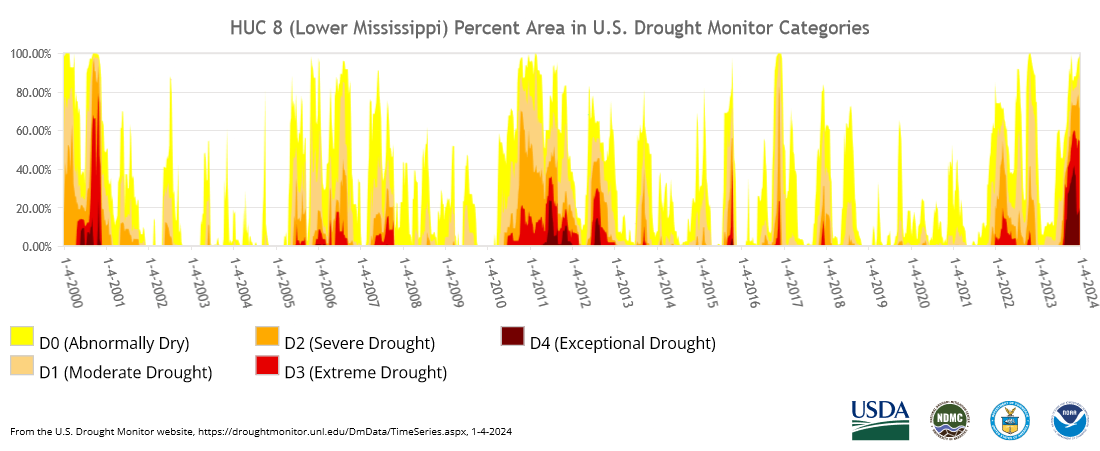
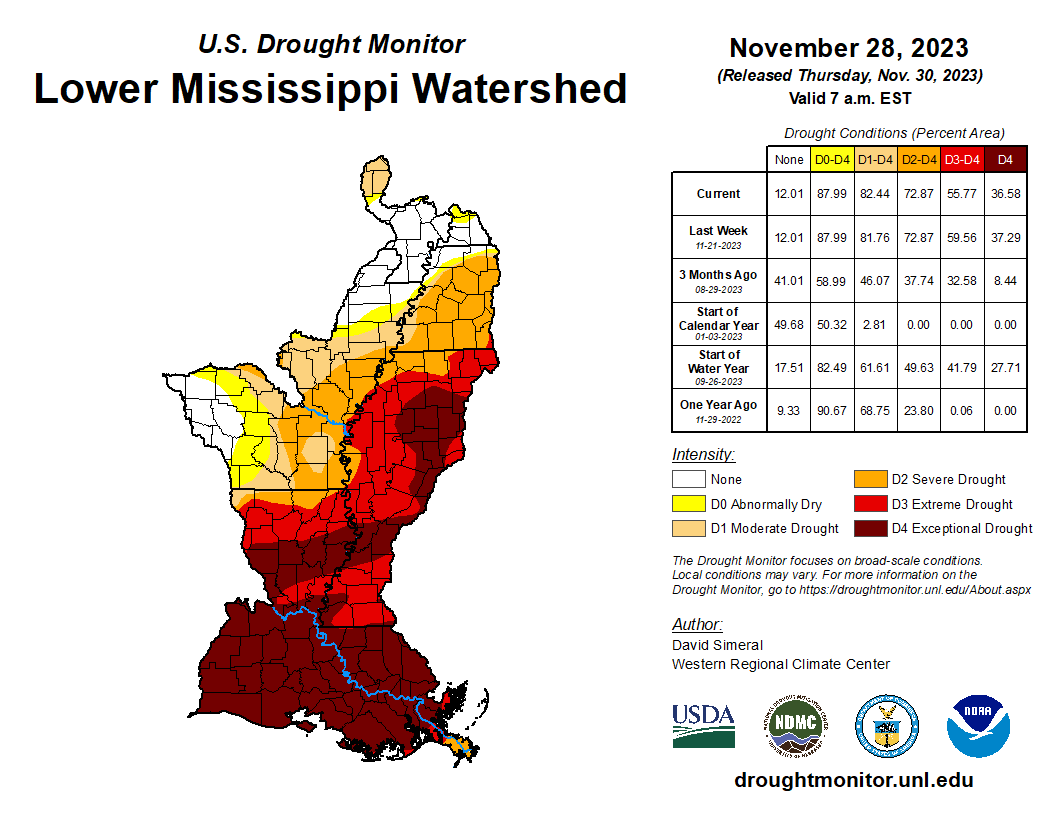
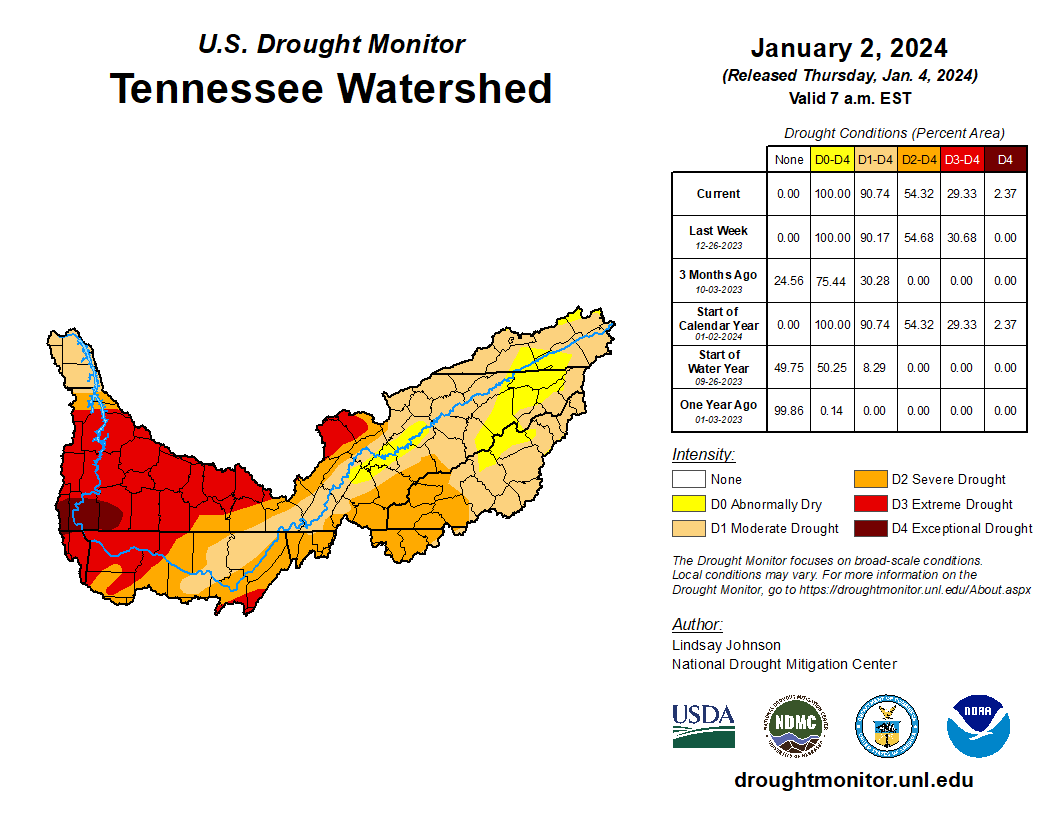
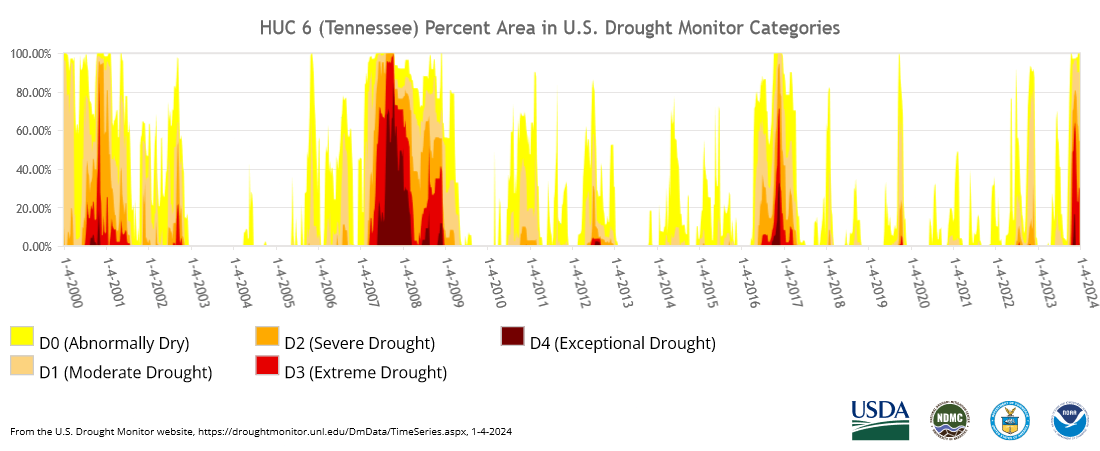
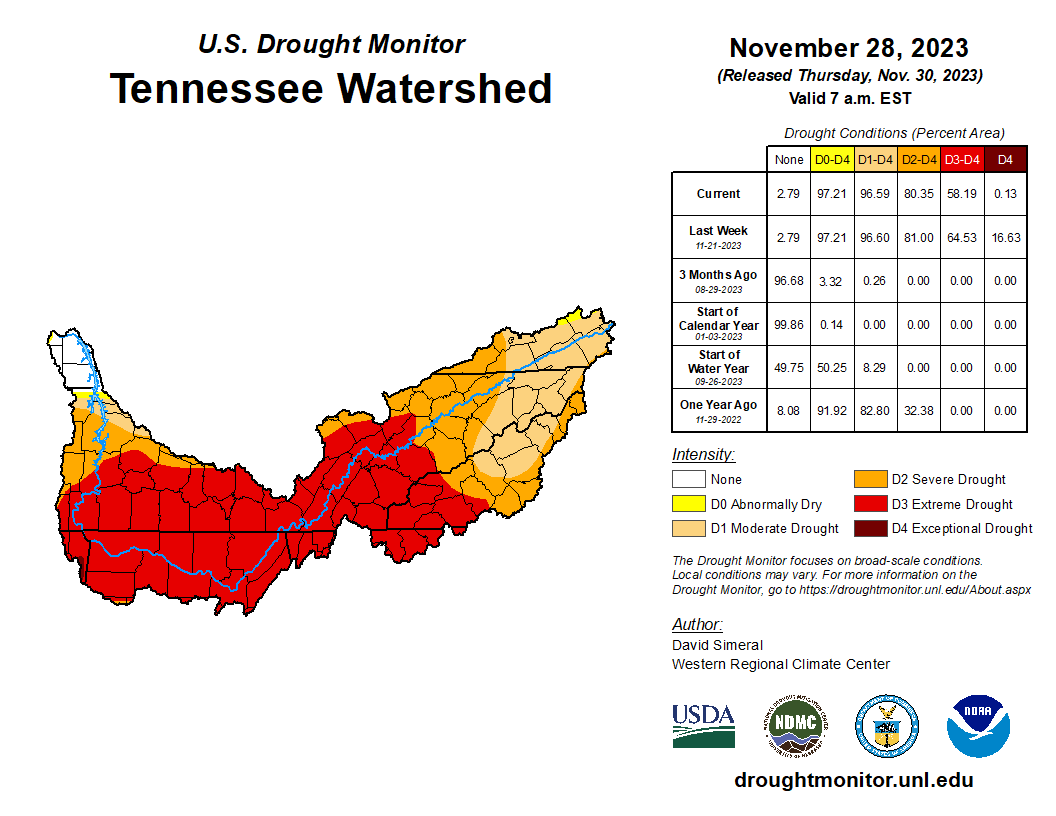
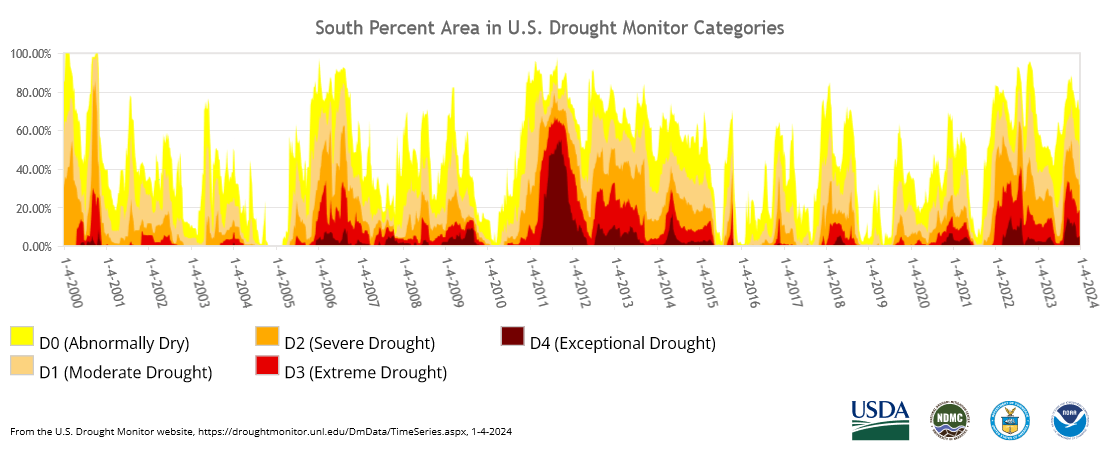
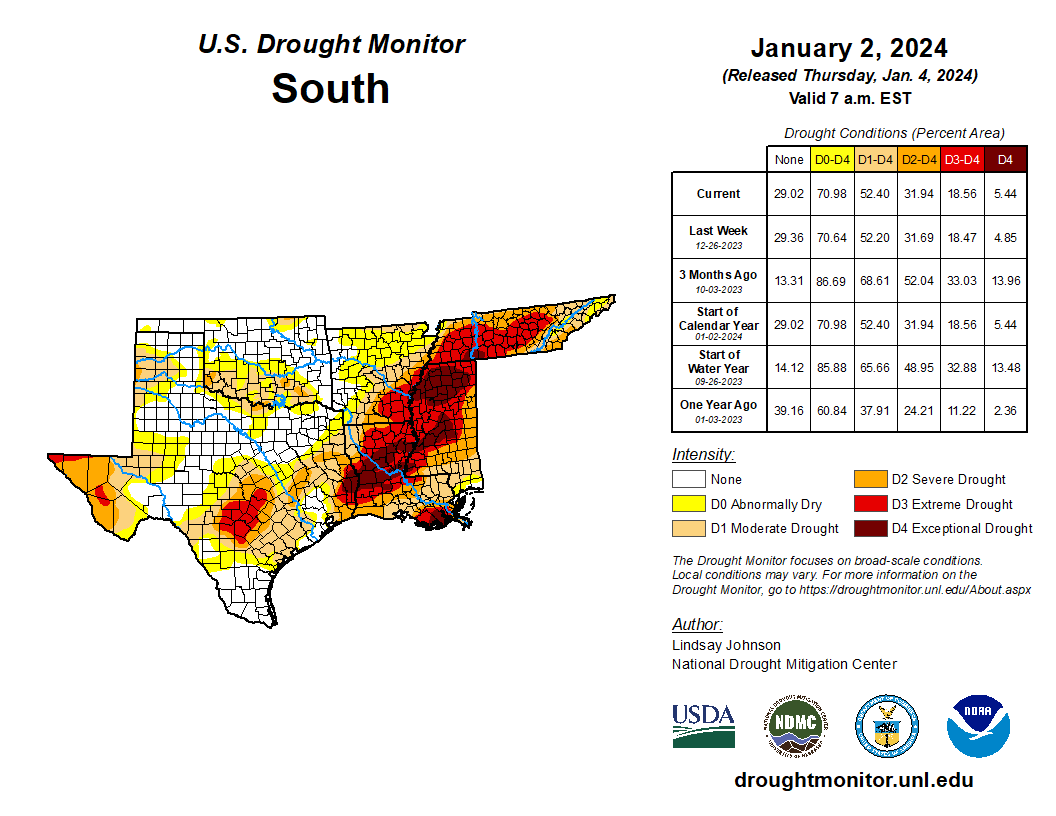
- In the Great Plains, moderate to exceptional drought covered about 22.0% of the central to northern Plains, which is less than last month, and 44.1% of the southern Plains, which is also less than last month. However, in the Lower Mississippi River Valley, the moderate to exceptional drought area continued its upward rise, going from 82.4% at the end of November to 90.1% at the end of December. In the Tennessee River Valley, moderate to exceptional drought shrank from 96.6% at the end of November to 90.7% at the end of December. Taken together, the southern Plains, Lower Mississippi Valley, and Tennessee (South Region) saw moderate to exceptional drought contract from 55.1% at the end of November to 52.4% at the end of December.
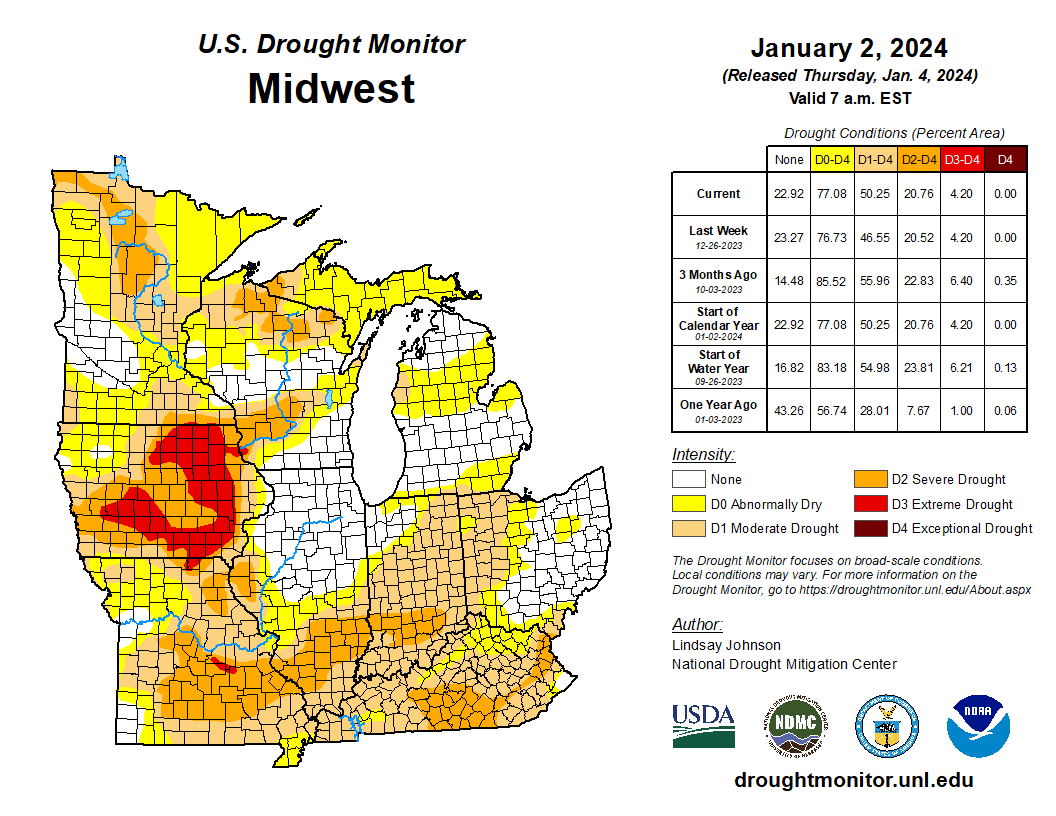
- Moderate to extreme (D3) drought covered 50.3% of the Midwest, which is more than last month.
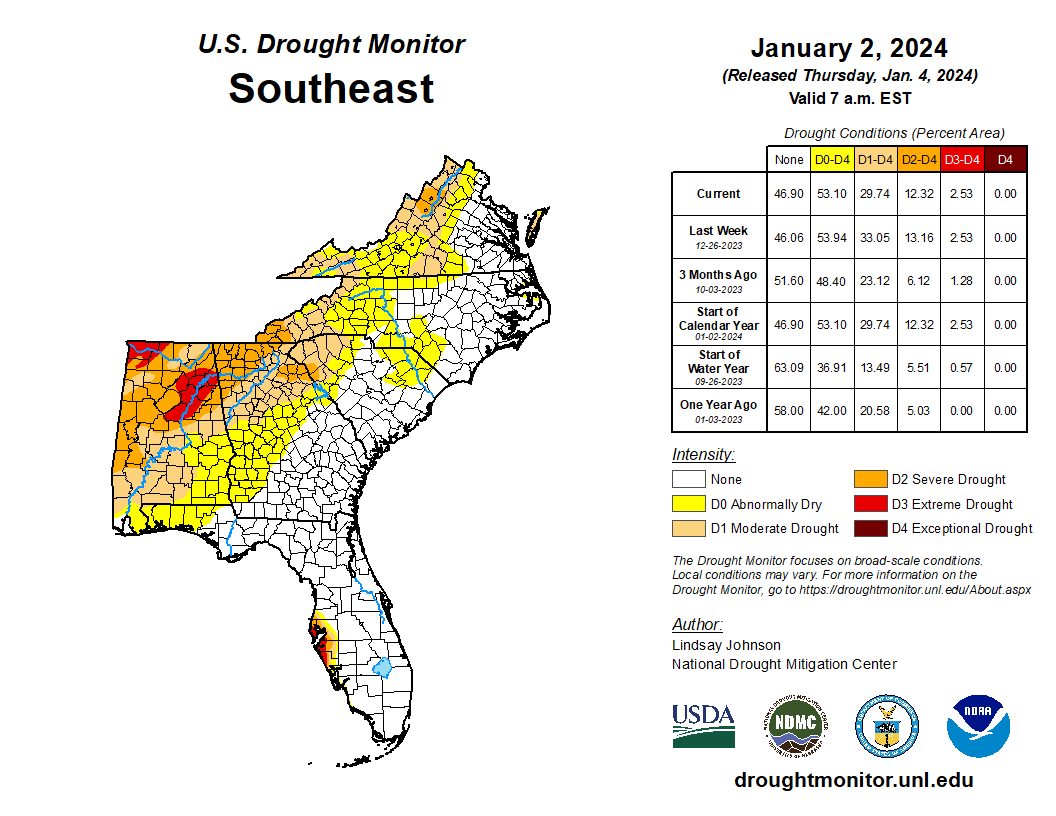
- Moderate to extreme drought covered 29.7% of the Southeast, which is less than last month.
- Patches of moderate to severe drought shrank to cover 2.5% of the Northeast.
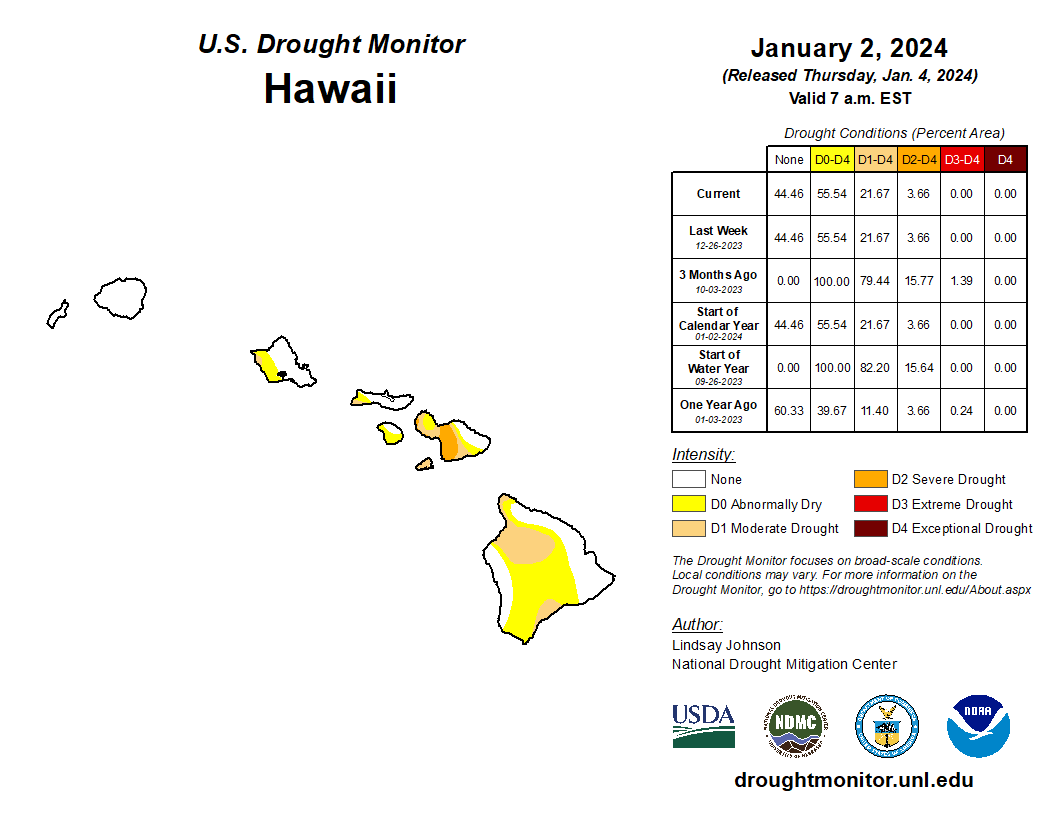
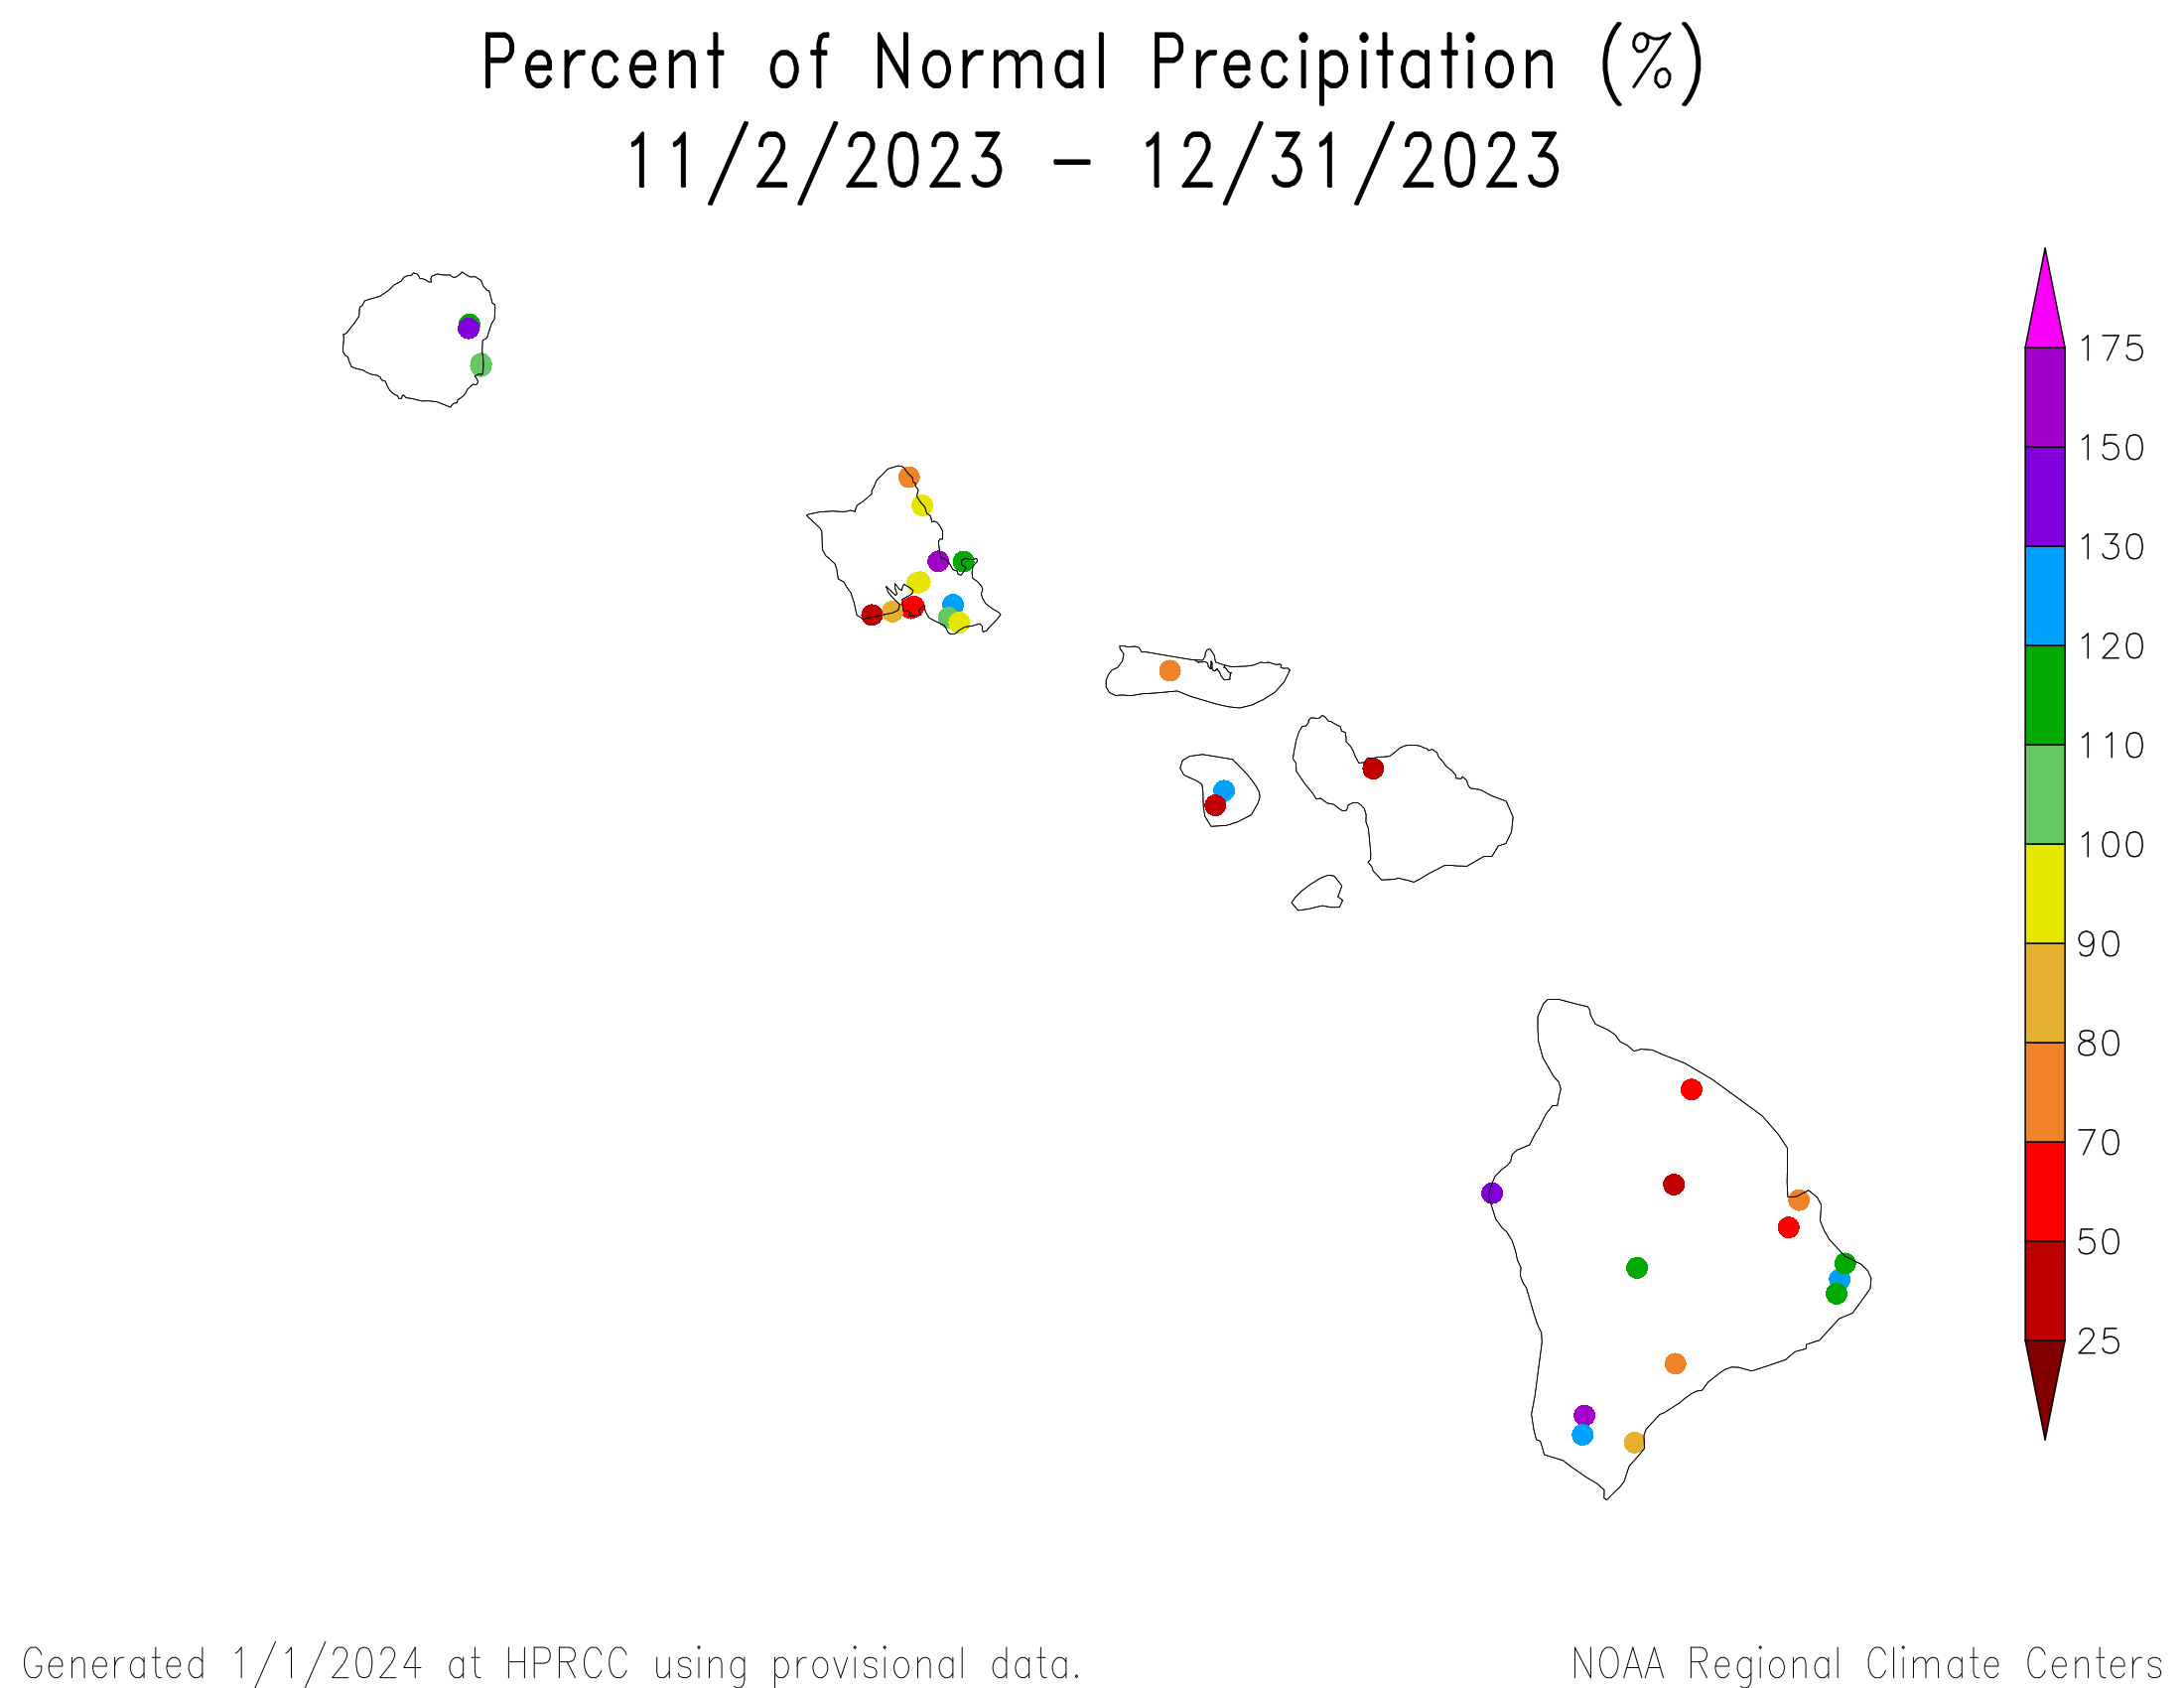
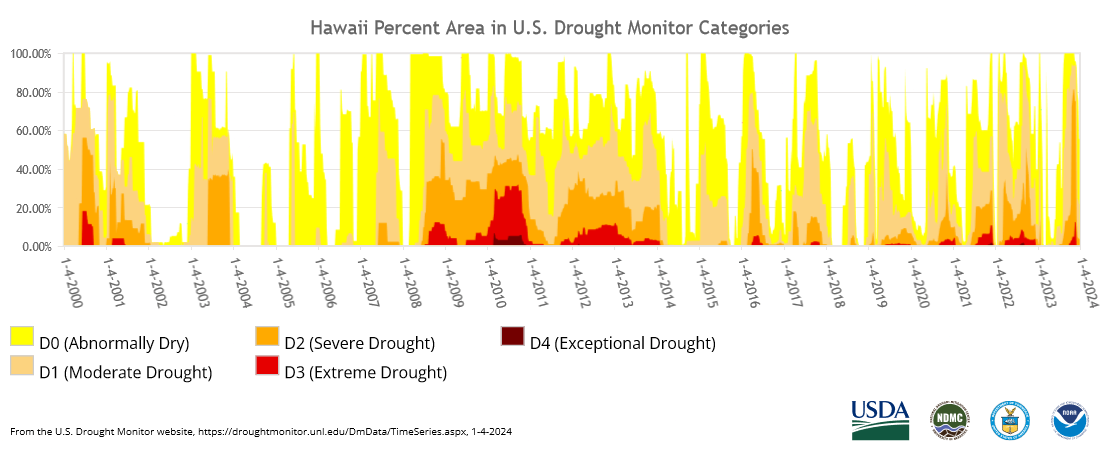
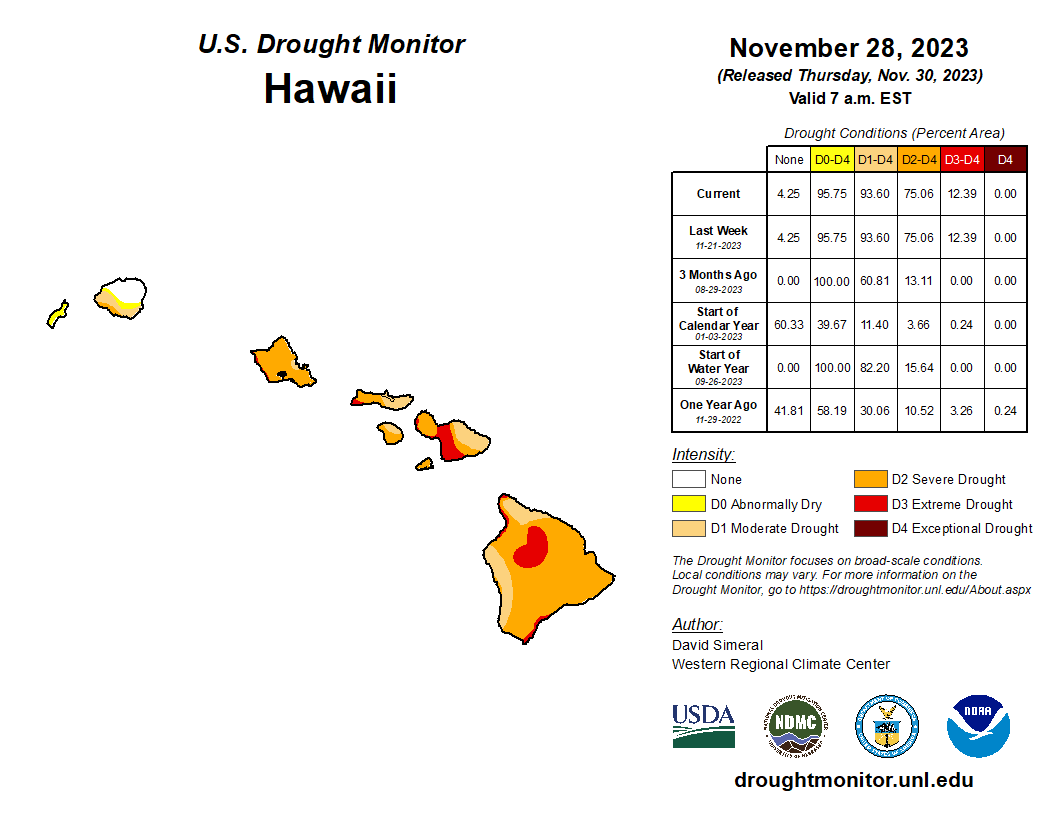
- Drought shrank considerably in Hawaii, where moderate to severe drought covered 21.7% of the state.
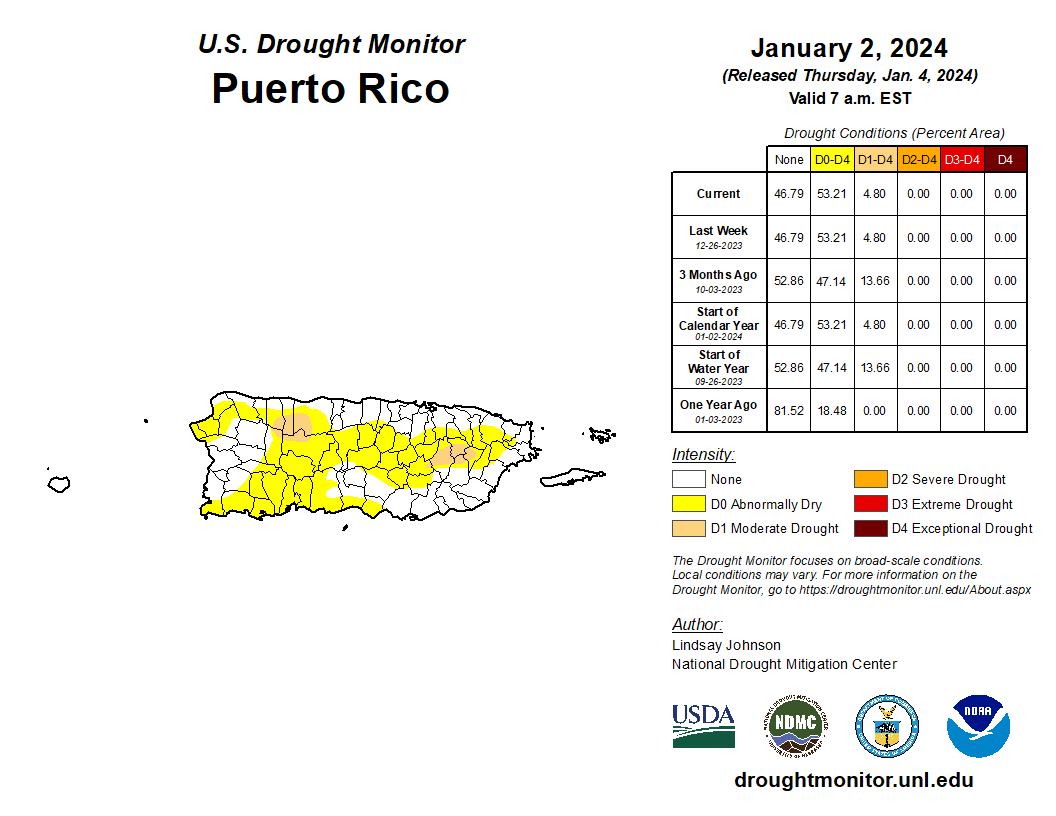
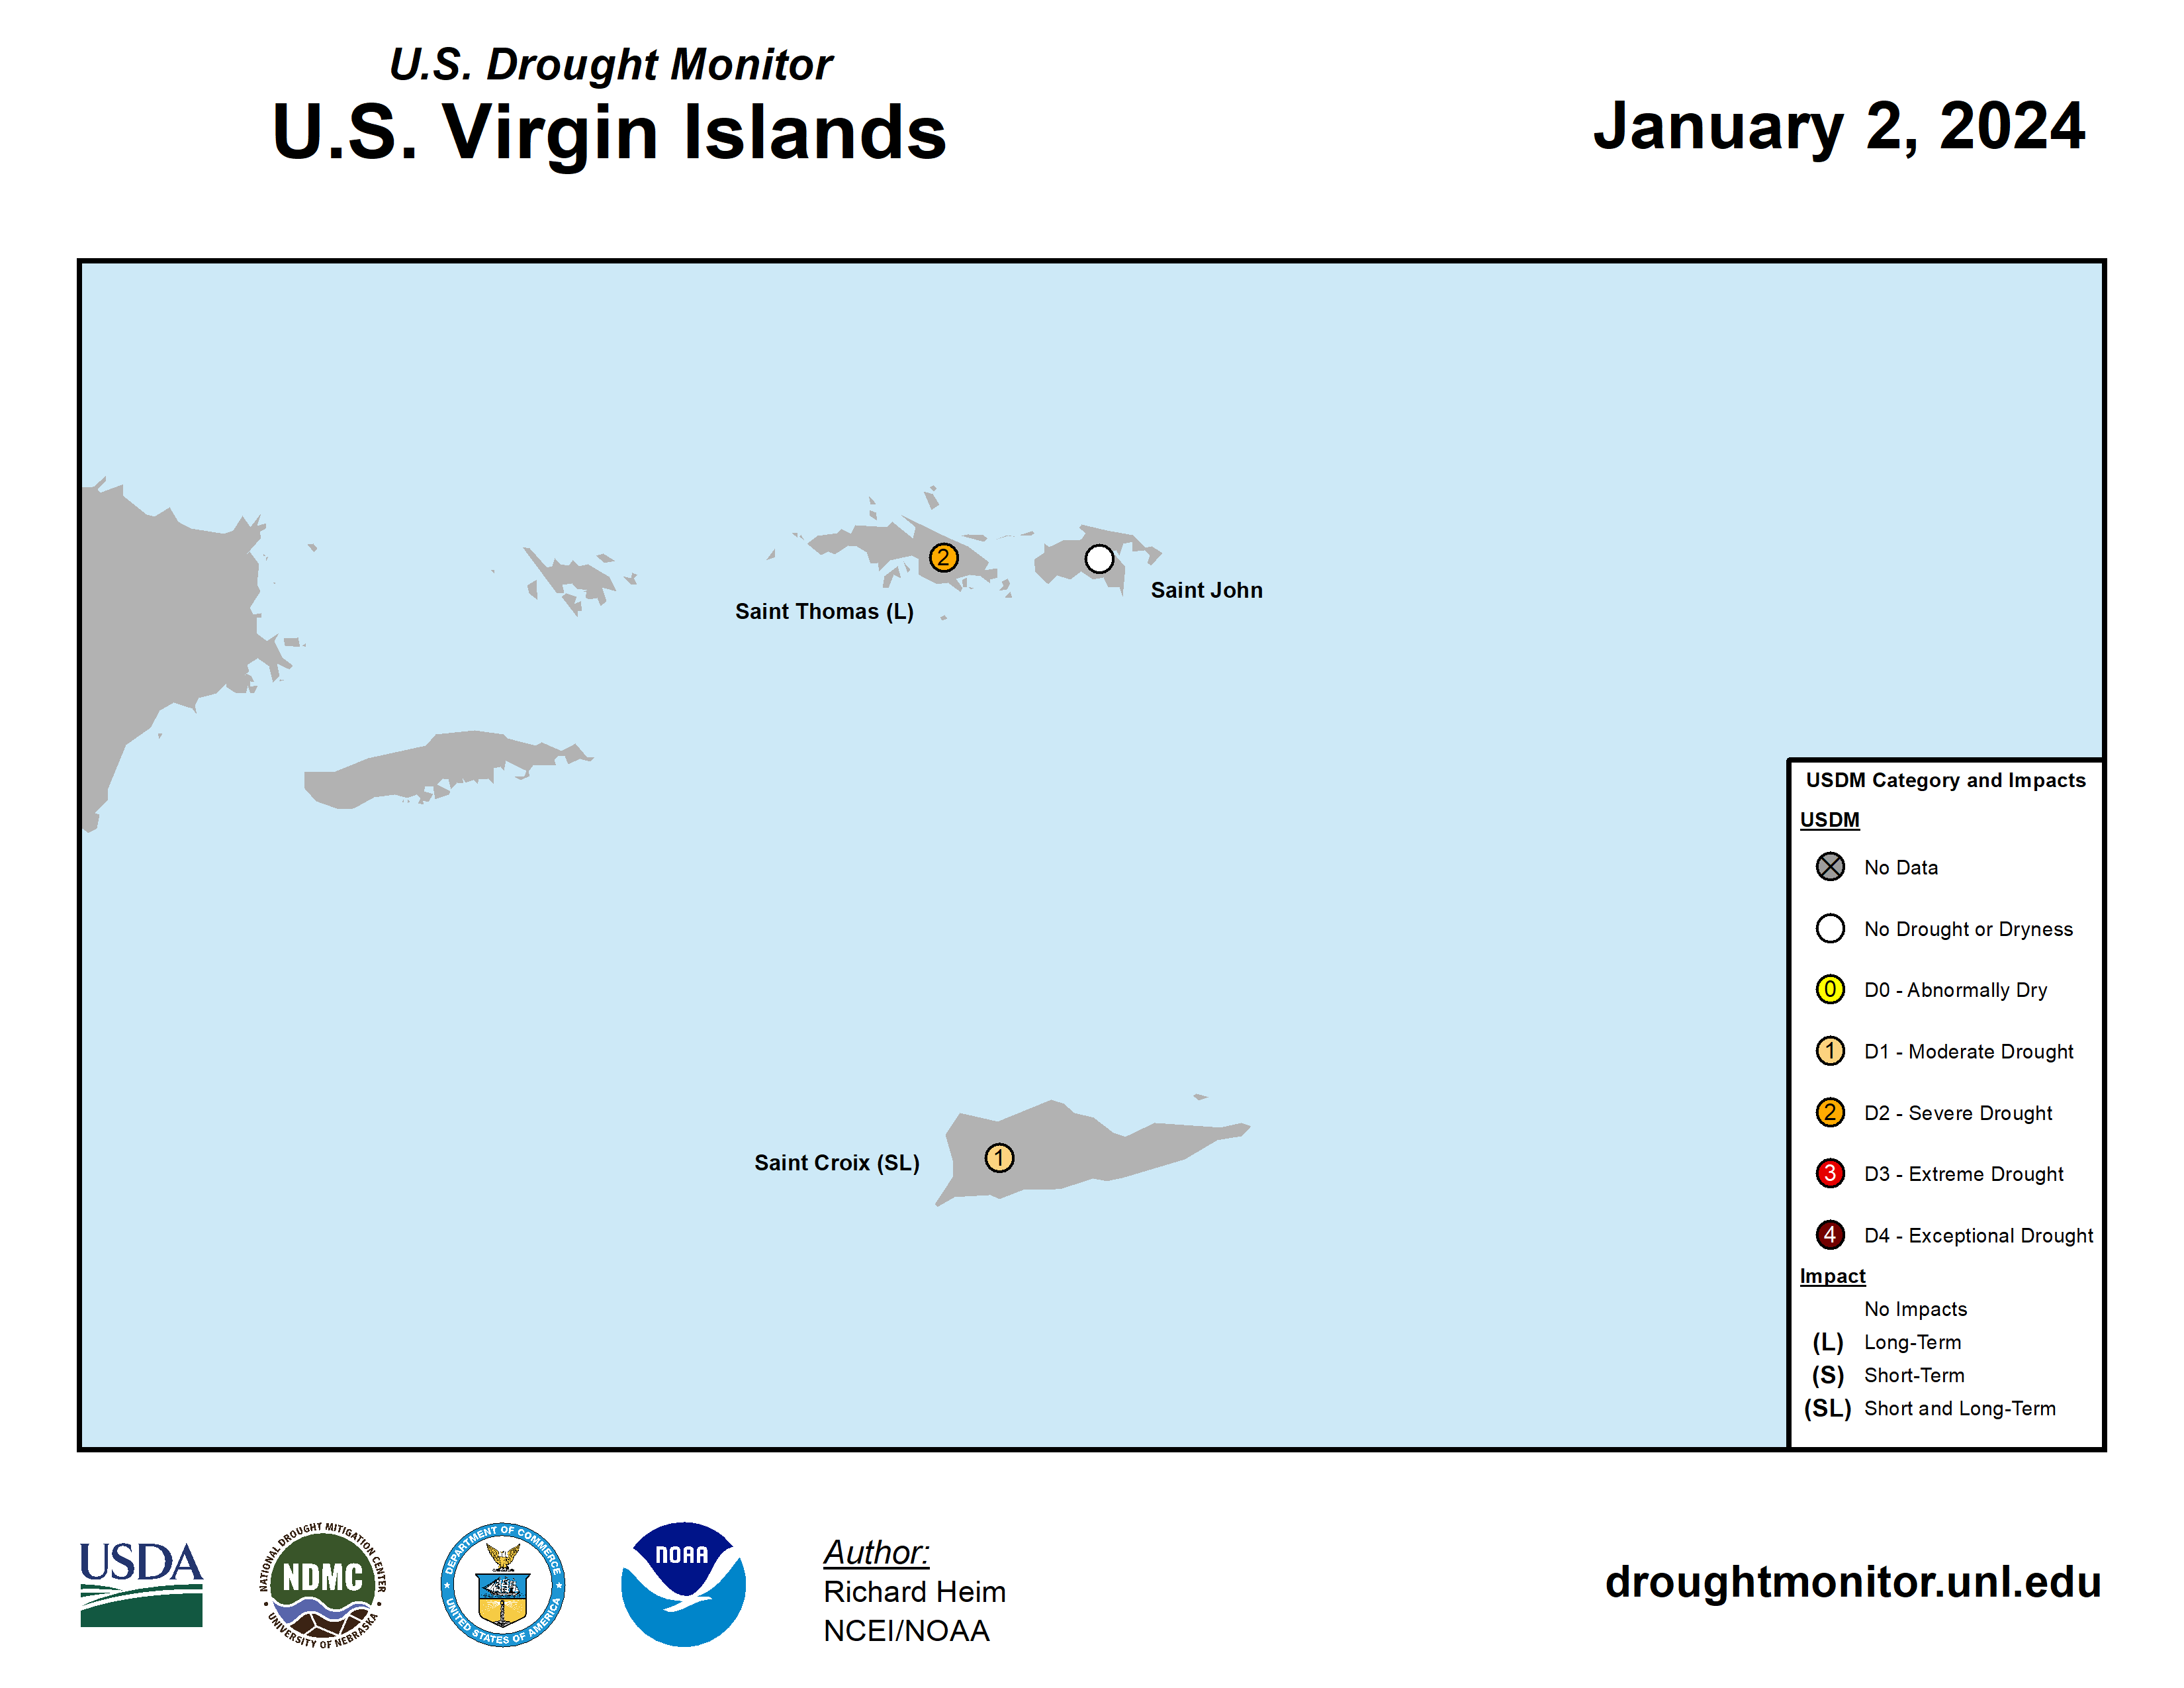
- Moderate drought expanded slightly to cover 4.8% of Puerto Rico while, in the U.S. Virgin Islands, severe drought continued on St. Thomas, moderate drought continued on St. Croix, and no drought and abnormal dryness continued on St. John.
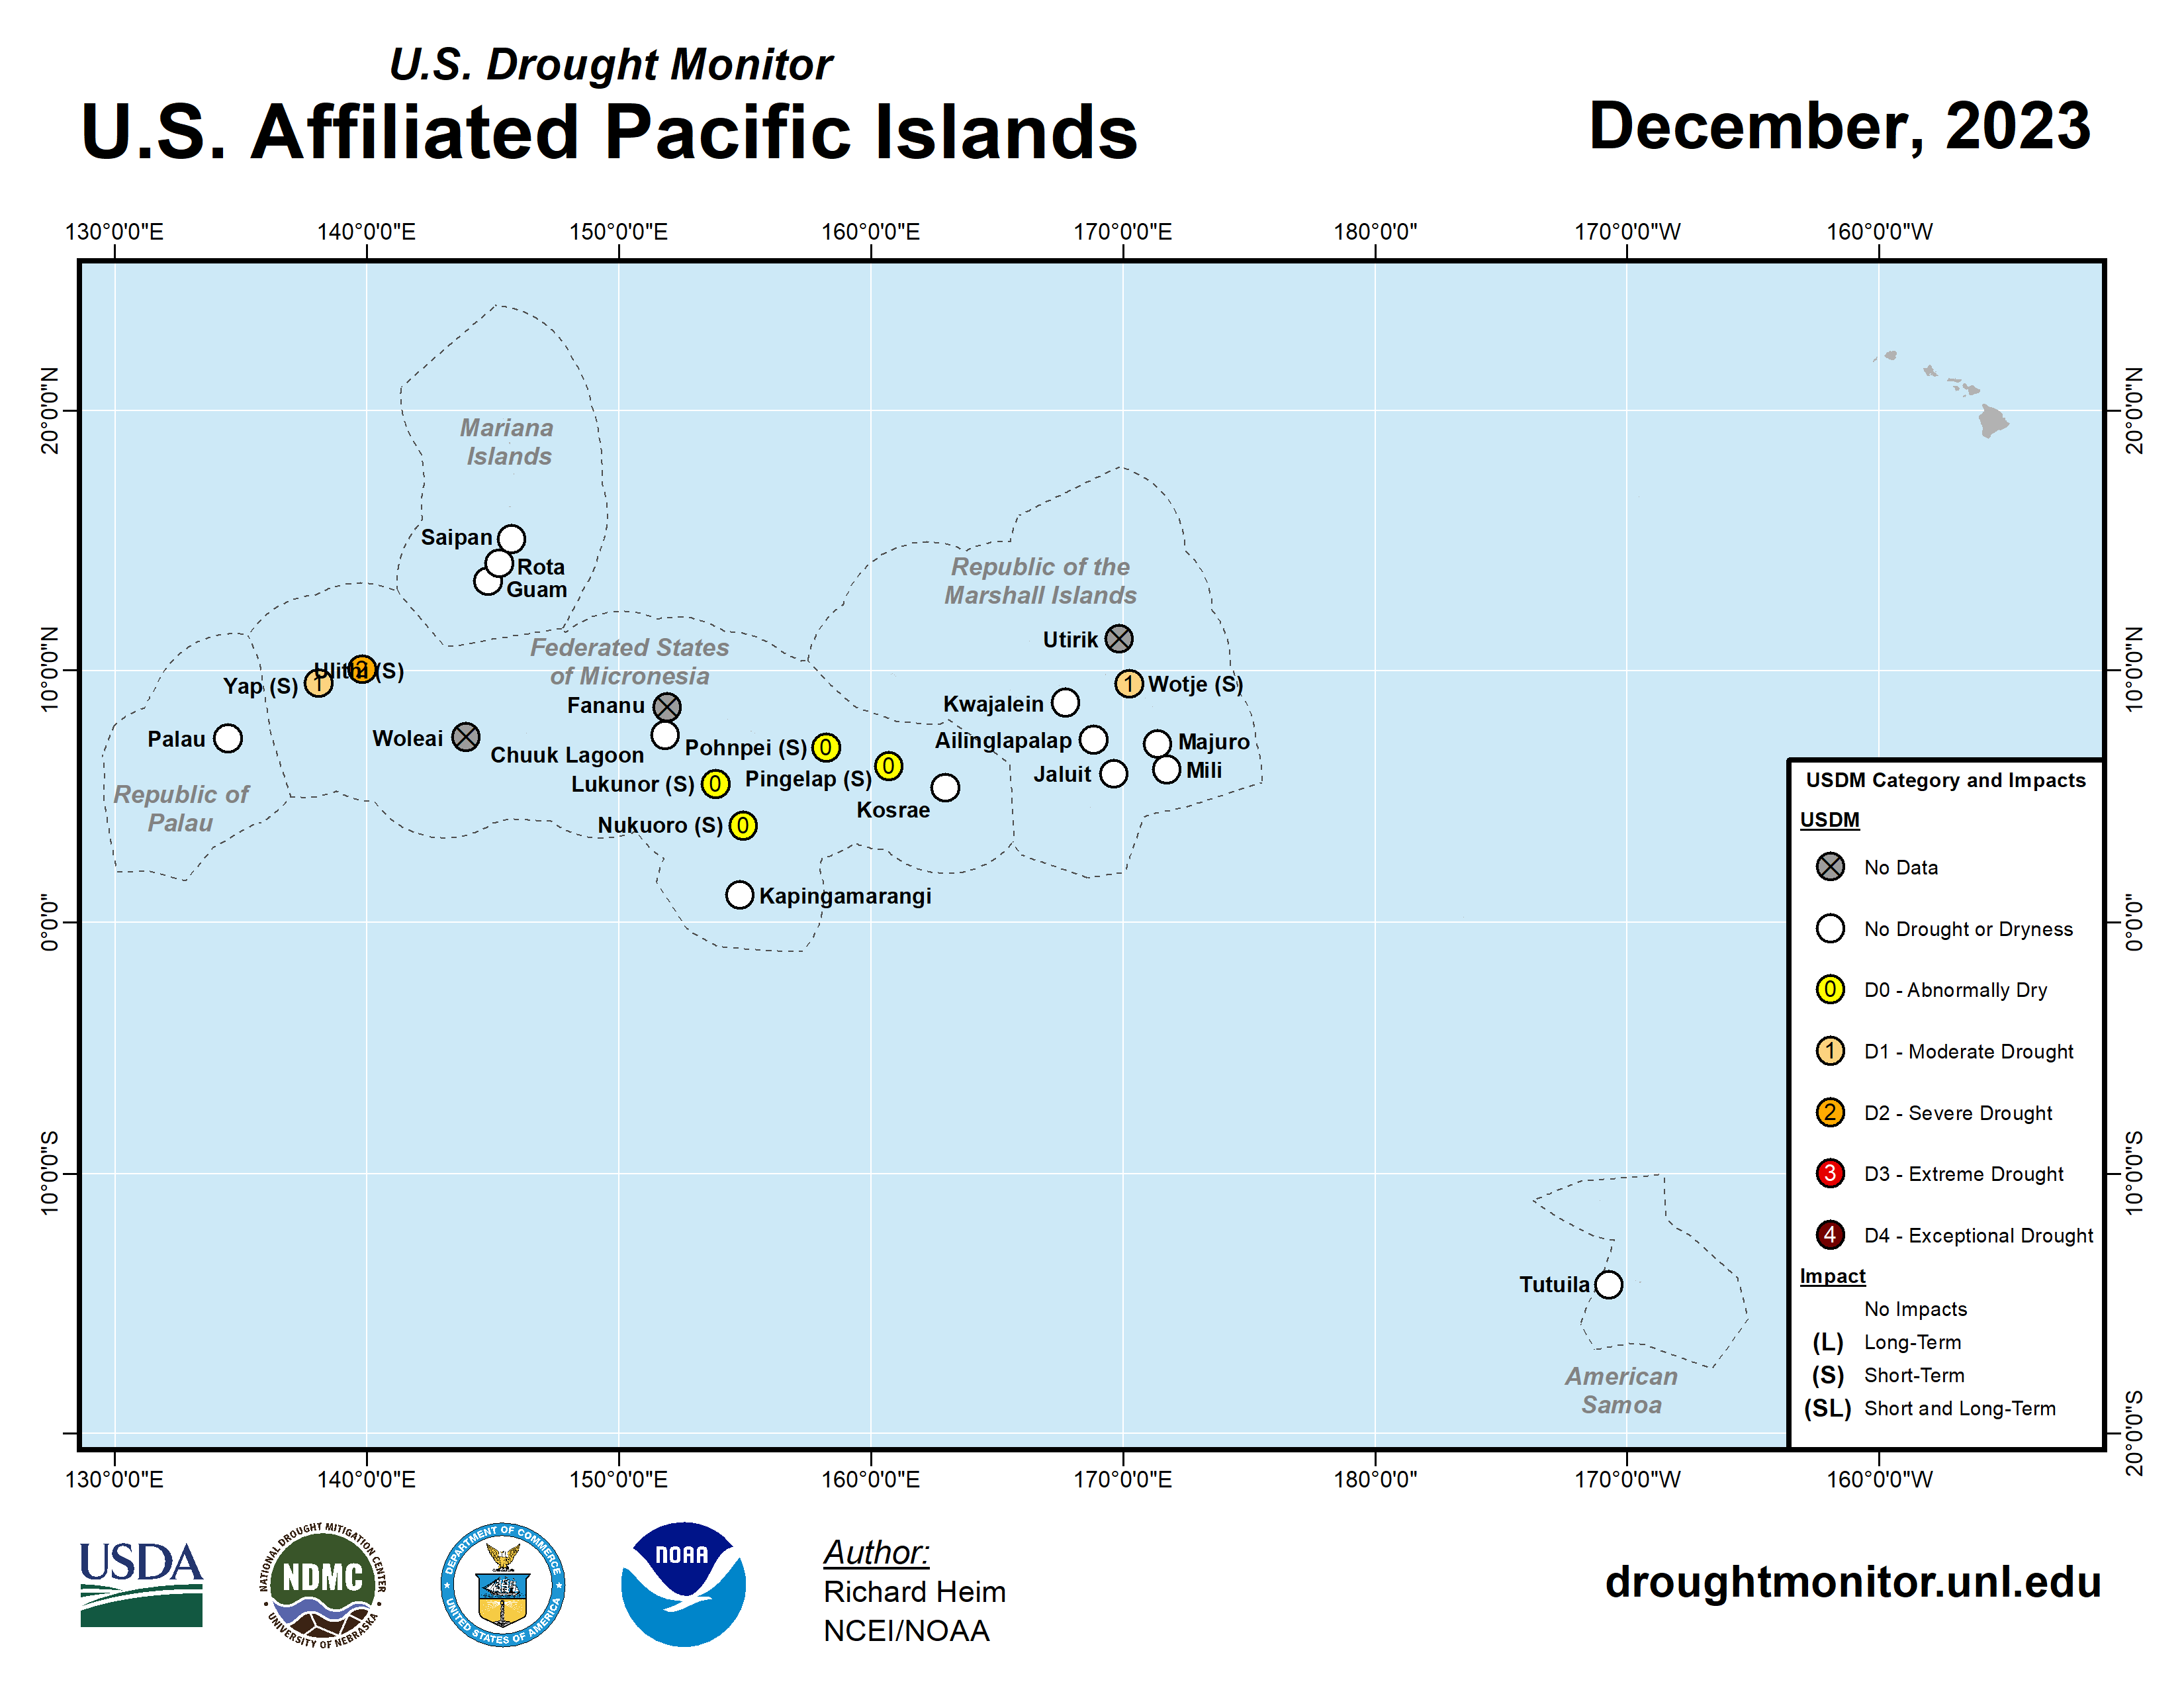
- In the U.S.-Affiliated Pacific Islands (USAPI), moderate drought developed in the Marshall Islands at Wotje and in the Federated States of Micronesia (FSM) at Yap, and severe drought developed in the western FSM at Ulithi.
Palmer Drought Index
The Palmer drought indices measure the balance between moisture demand (evapotranspiration driven by temperature) and moisture supply (precipitation). The Palmer Z Index depicts moisture conditions for the current month, while the Palmer Hydrological Drought Index (PHDI) and Palmer Drought Severity Index (PDSI) depict the current month's cumulative moisture conditions integrated over the last several months.
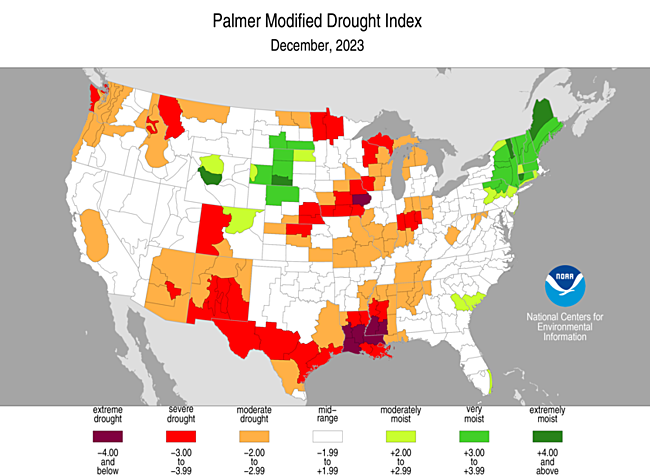
While both the PDSI and PHDI indices show long-term moisture conditions, the PDSI depicts meteorological drought while the PHDI depicts hydrological drought. The PDSI map may show less severe and extensive drought (as well as wet spell conditions) in some parts of the country than the PHDI map because the meteorological conditions that produce drought and wet spell conditions are not as long-lasting as the hydrological impacts.
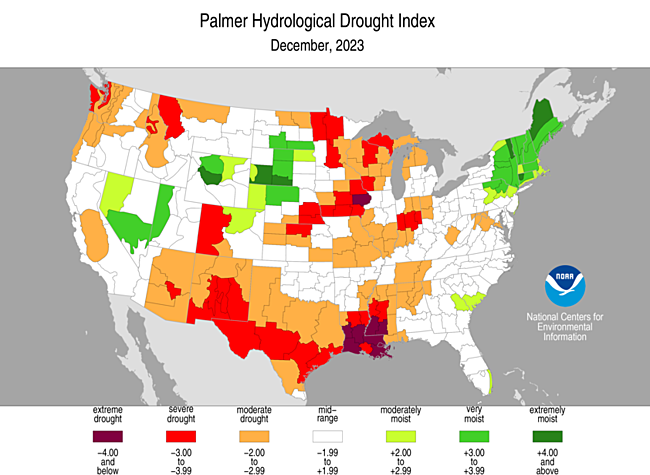
Used together, the Palmer Z Index and PHDI maps show that short-term drought occurred across much of the West and from eastern Texas to the Great Lakes, expanding or intensifying long-term drought and reducing areas of long-term wet conditions (PHDI maps for December compared to November). Short-term wet conditions occurred in parts of the Plains, Upper Mississippi Valley, and eastern seaboard, contracting or reducing the intensity of long-term drought and expanding or increasing the magnitude of long-term wet spell conditions.
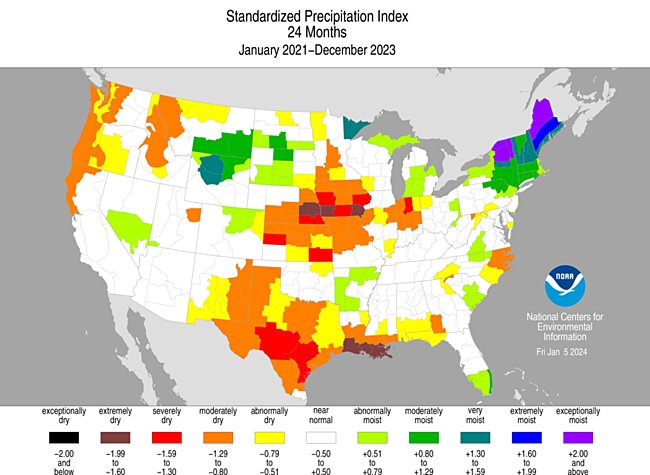
Standardized Precipitation Index
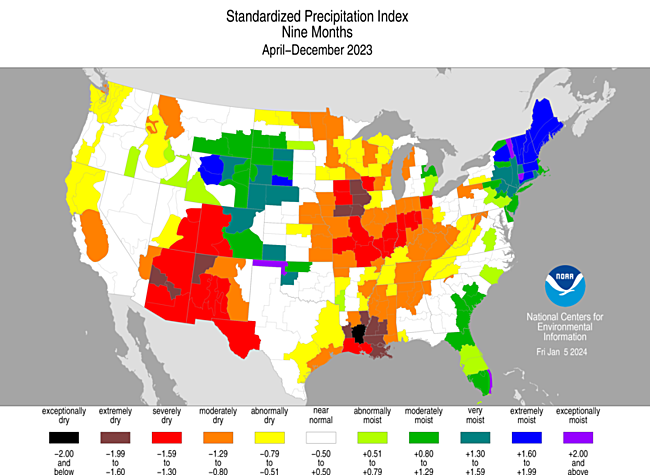
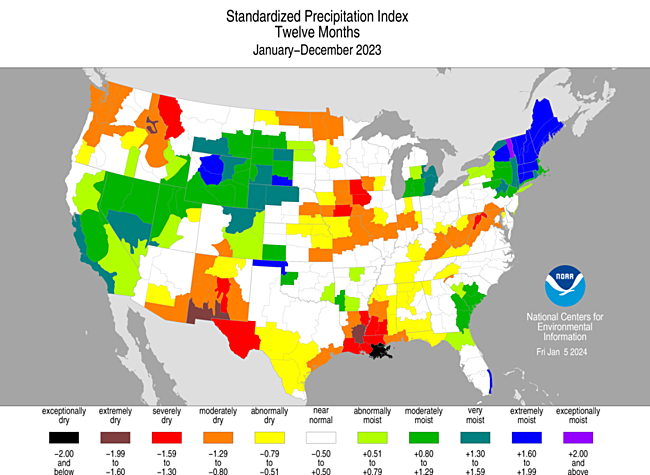
The Standardized Precipitation Index (SPI) measures moisture supply. The SPI maps here show the spatial extent of anomalously wet and dry areas at time scales ranging from 1 month to 24 months.
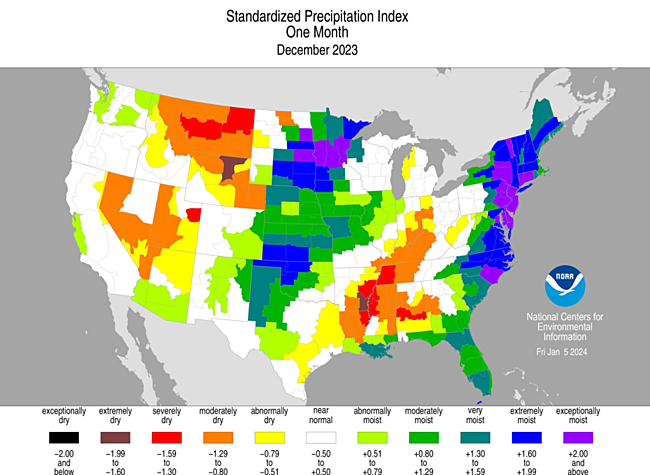
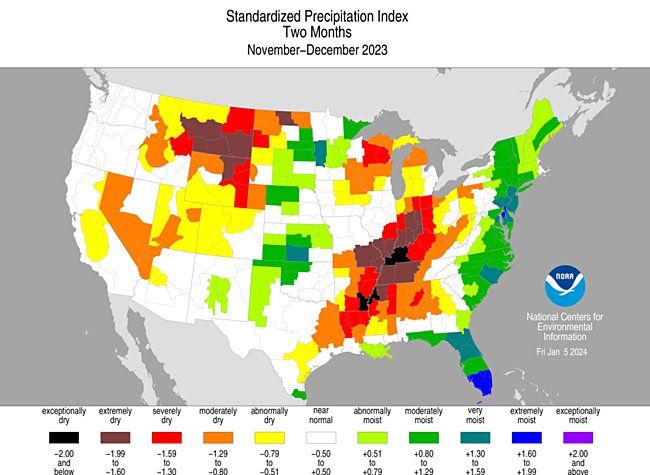
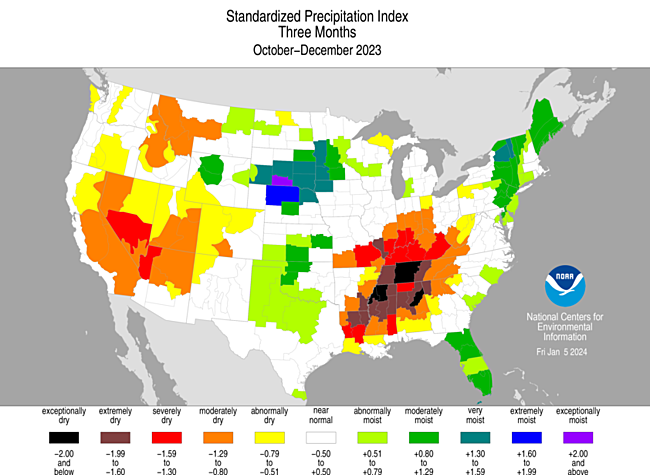
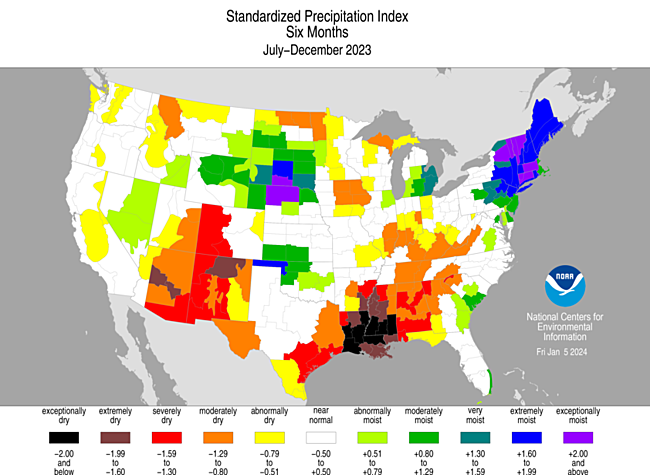
The SPI maps illustrate how moisture conditions have varied considerably through time and space over the last two years. Dryness is evident across the Lower Mississippi to Ohio Valleys solidly at 1- to 9-month time scales and partially at 12 to 24 months. Parts of the Great Lakes and Upper Mississippi Valley are dry at 2 and 6 to 9 months, with large parts of the Midwest along the Mississippi and Ohio Rivers dry at 9 to 24 months. Dryness extends across the southern Appalachians at 3- to 12-month time scales and into parts of the Mid-Atlantic at 9 to 24 months. Parts of the southern Plains (Texas) are dry at 1, 2, and 6-24 months; parts of the central Plains have dry conditions at 9-24 months; and parts of the northern Plains are dry at 1, 2, and 6-12 months. In the West, dry conditions are evident across much of Montana to California at 1- to 3-month time scales, in parts of California at 6 to 9 months, in parts to most of the Pacific Northwest at 2 to 24 months, and across parts to most of the Southwest (Four Corners states) at 3- to 24-month time scales. Wet conditions are evident across much of the Great Plains at the 1-month time scale, in parts of the Plains (mainly central to north) at 2 to 9 months, and in the northern Plains at 12-24 months; across the eastern seaboard at 1 to 2 months; across much of the Northeast at all time scales; and from the northern Plains to California at 12 months.
Regional Discussion
Hawaii
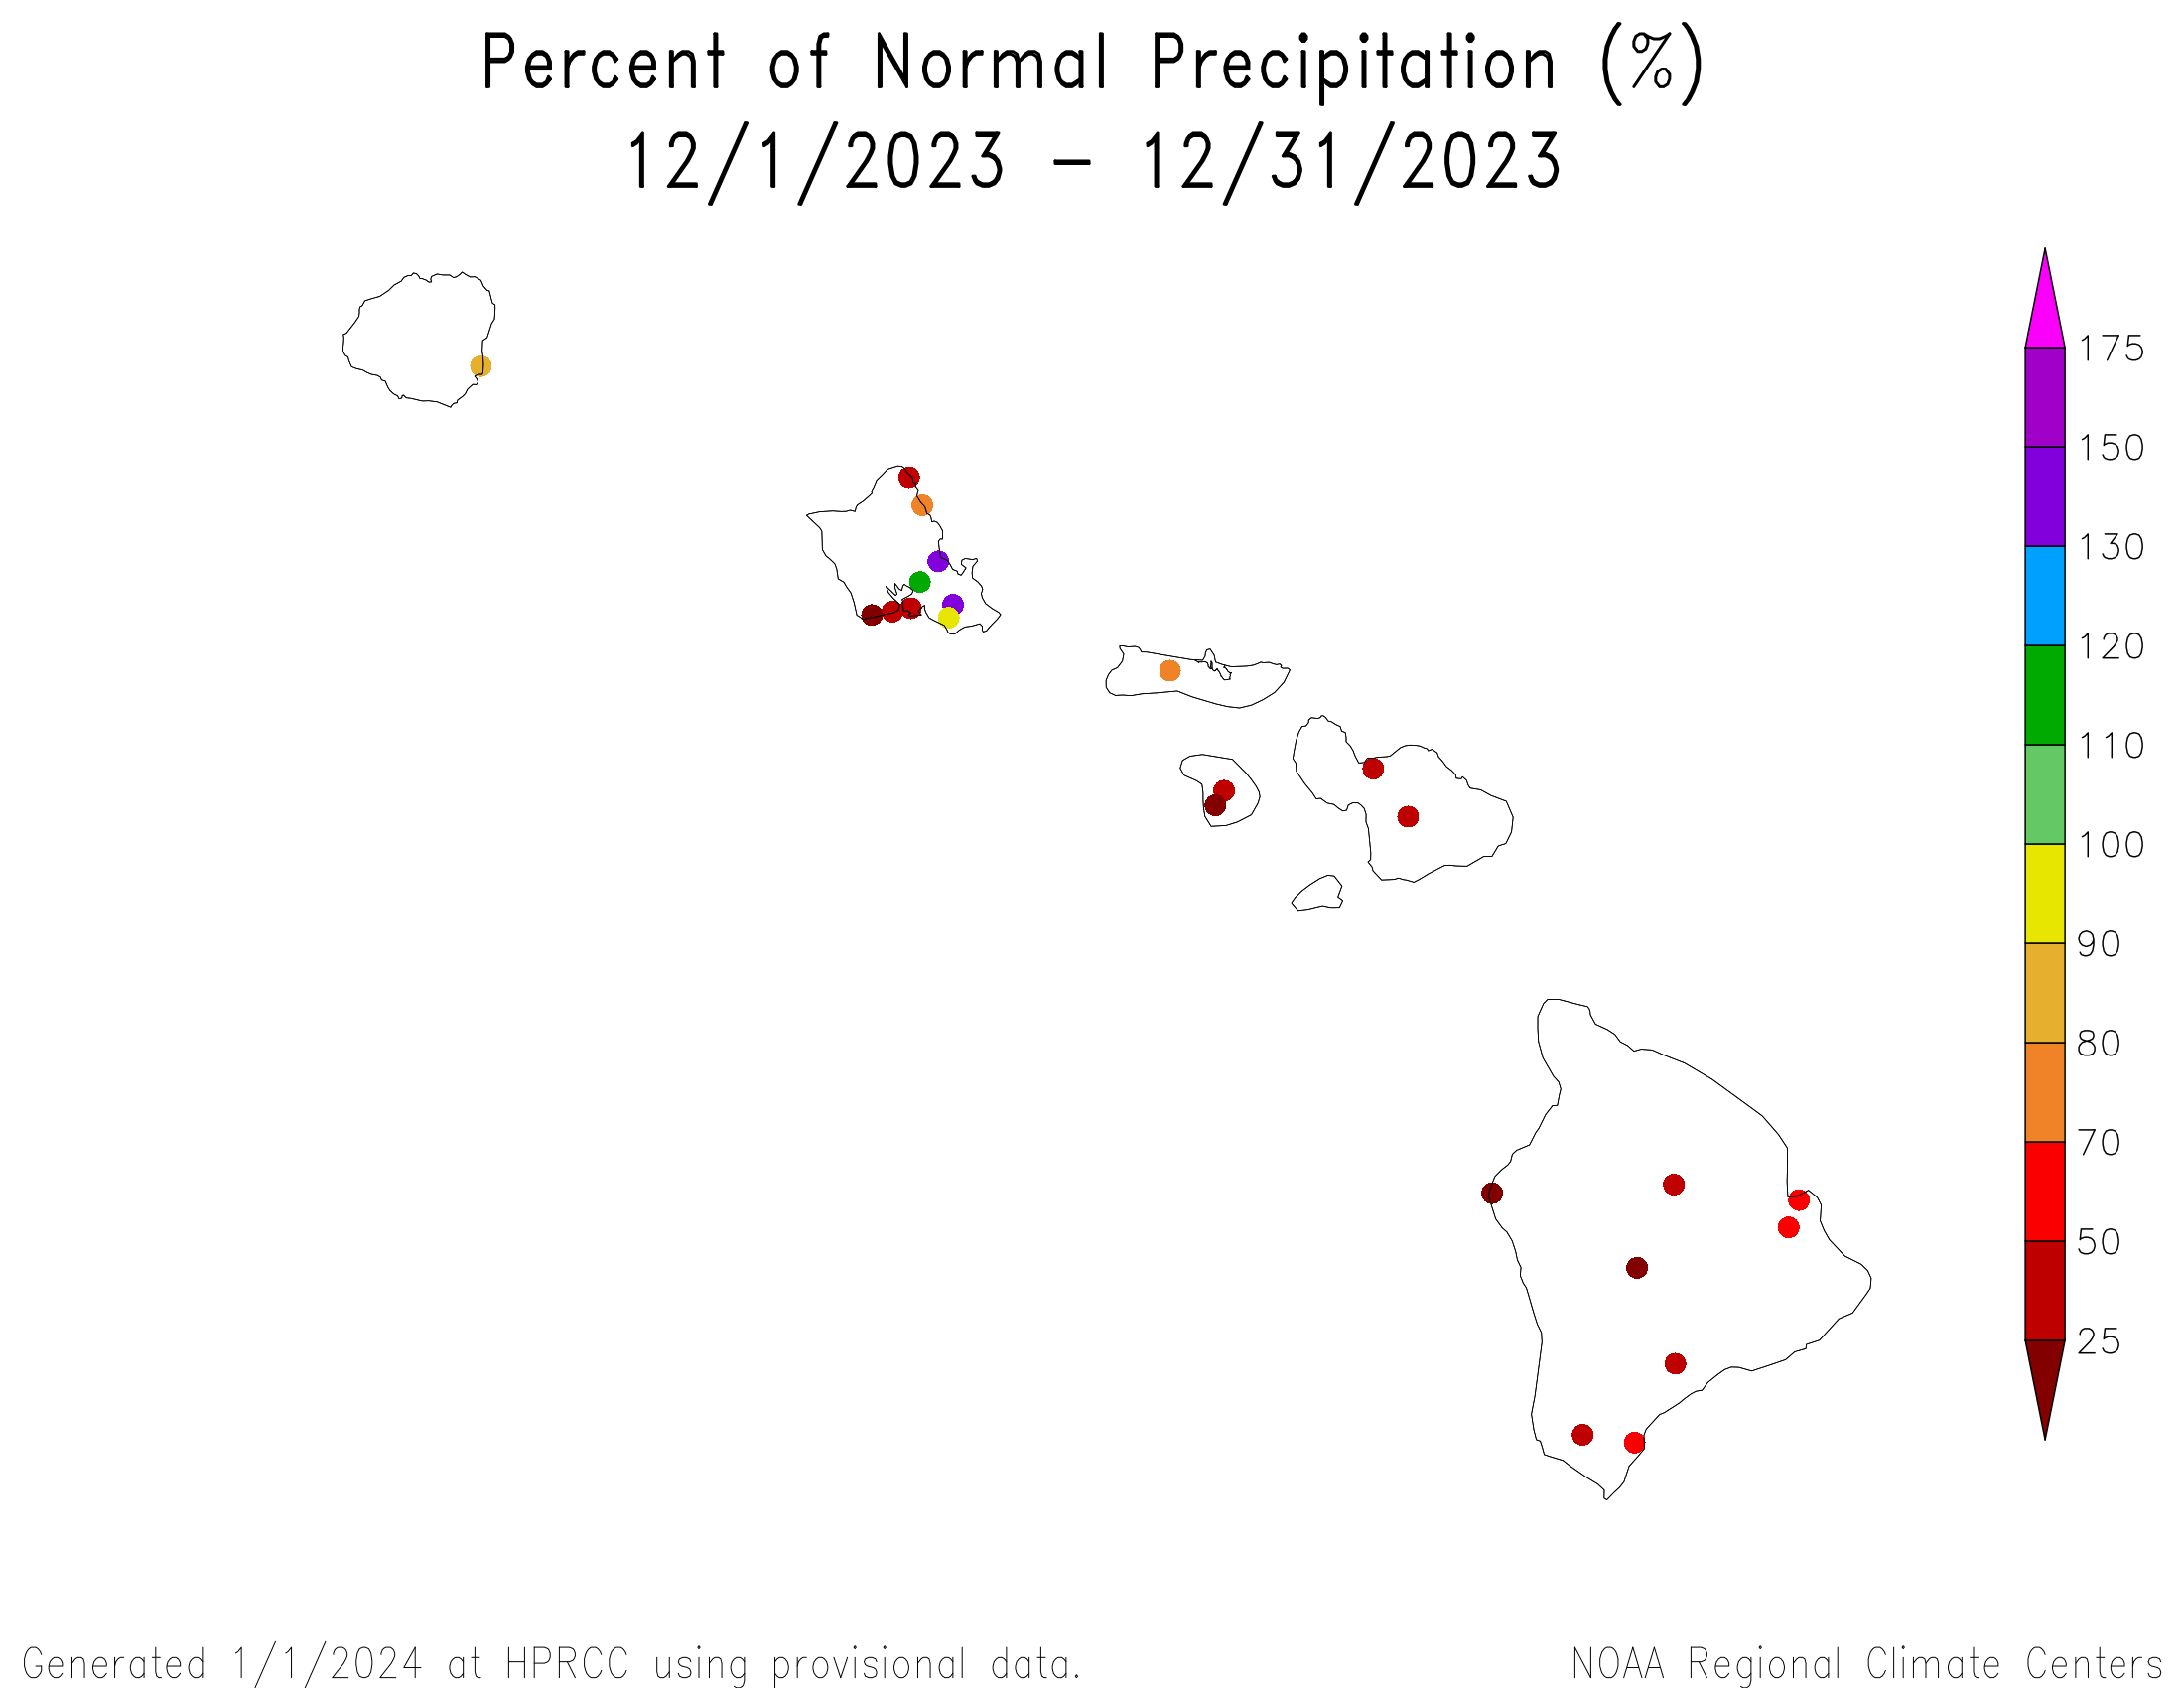
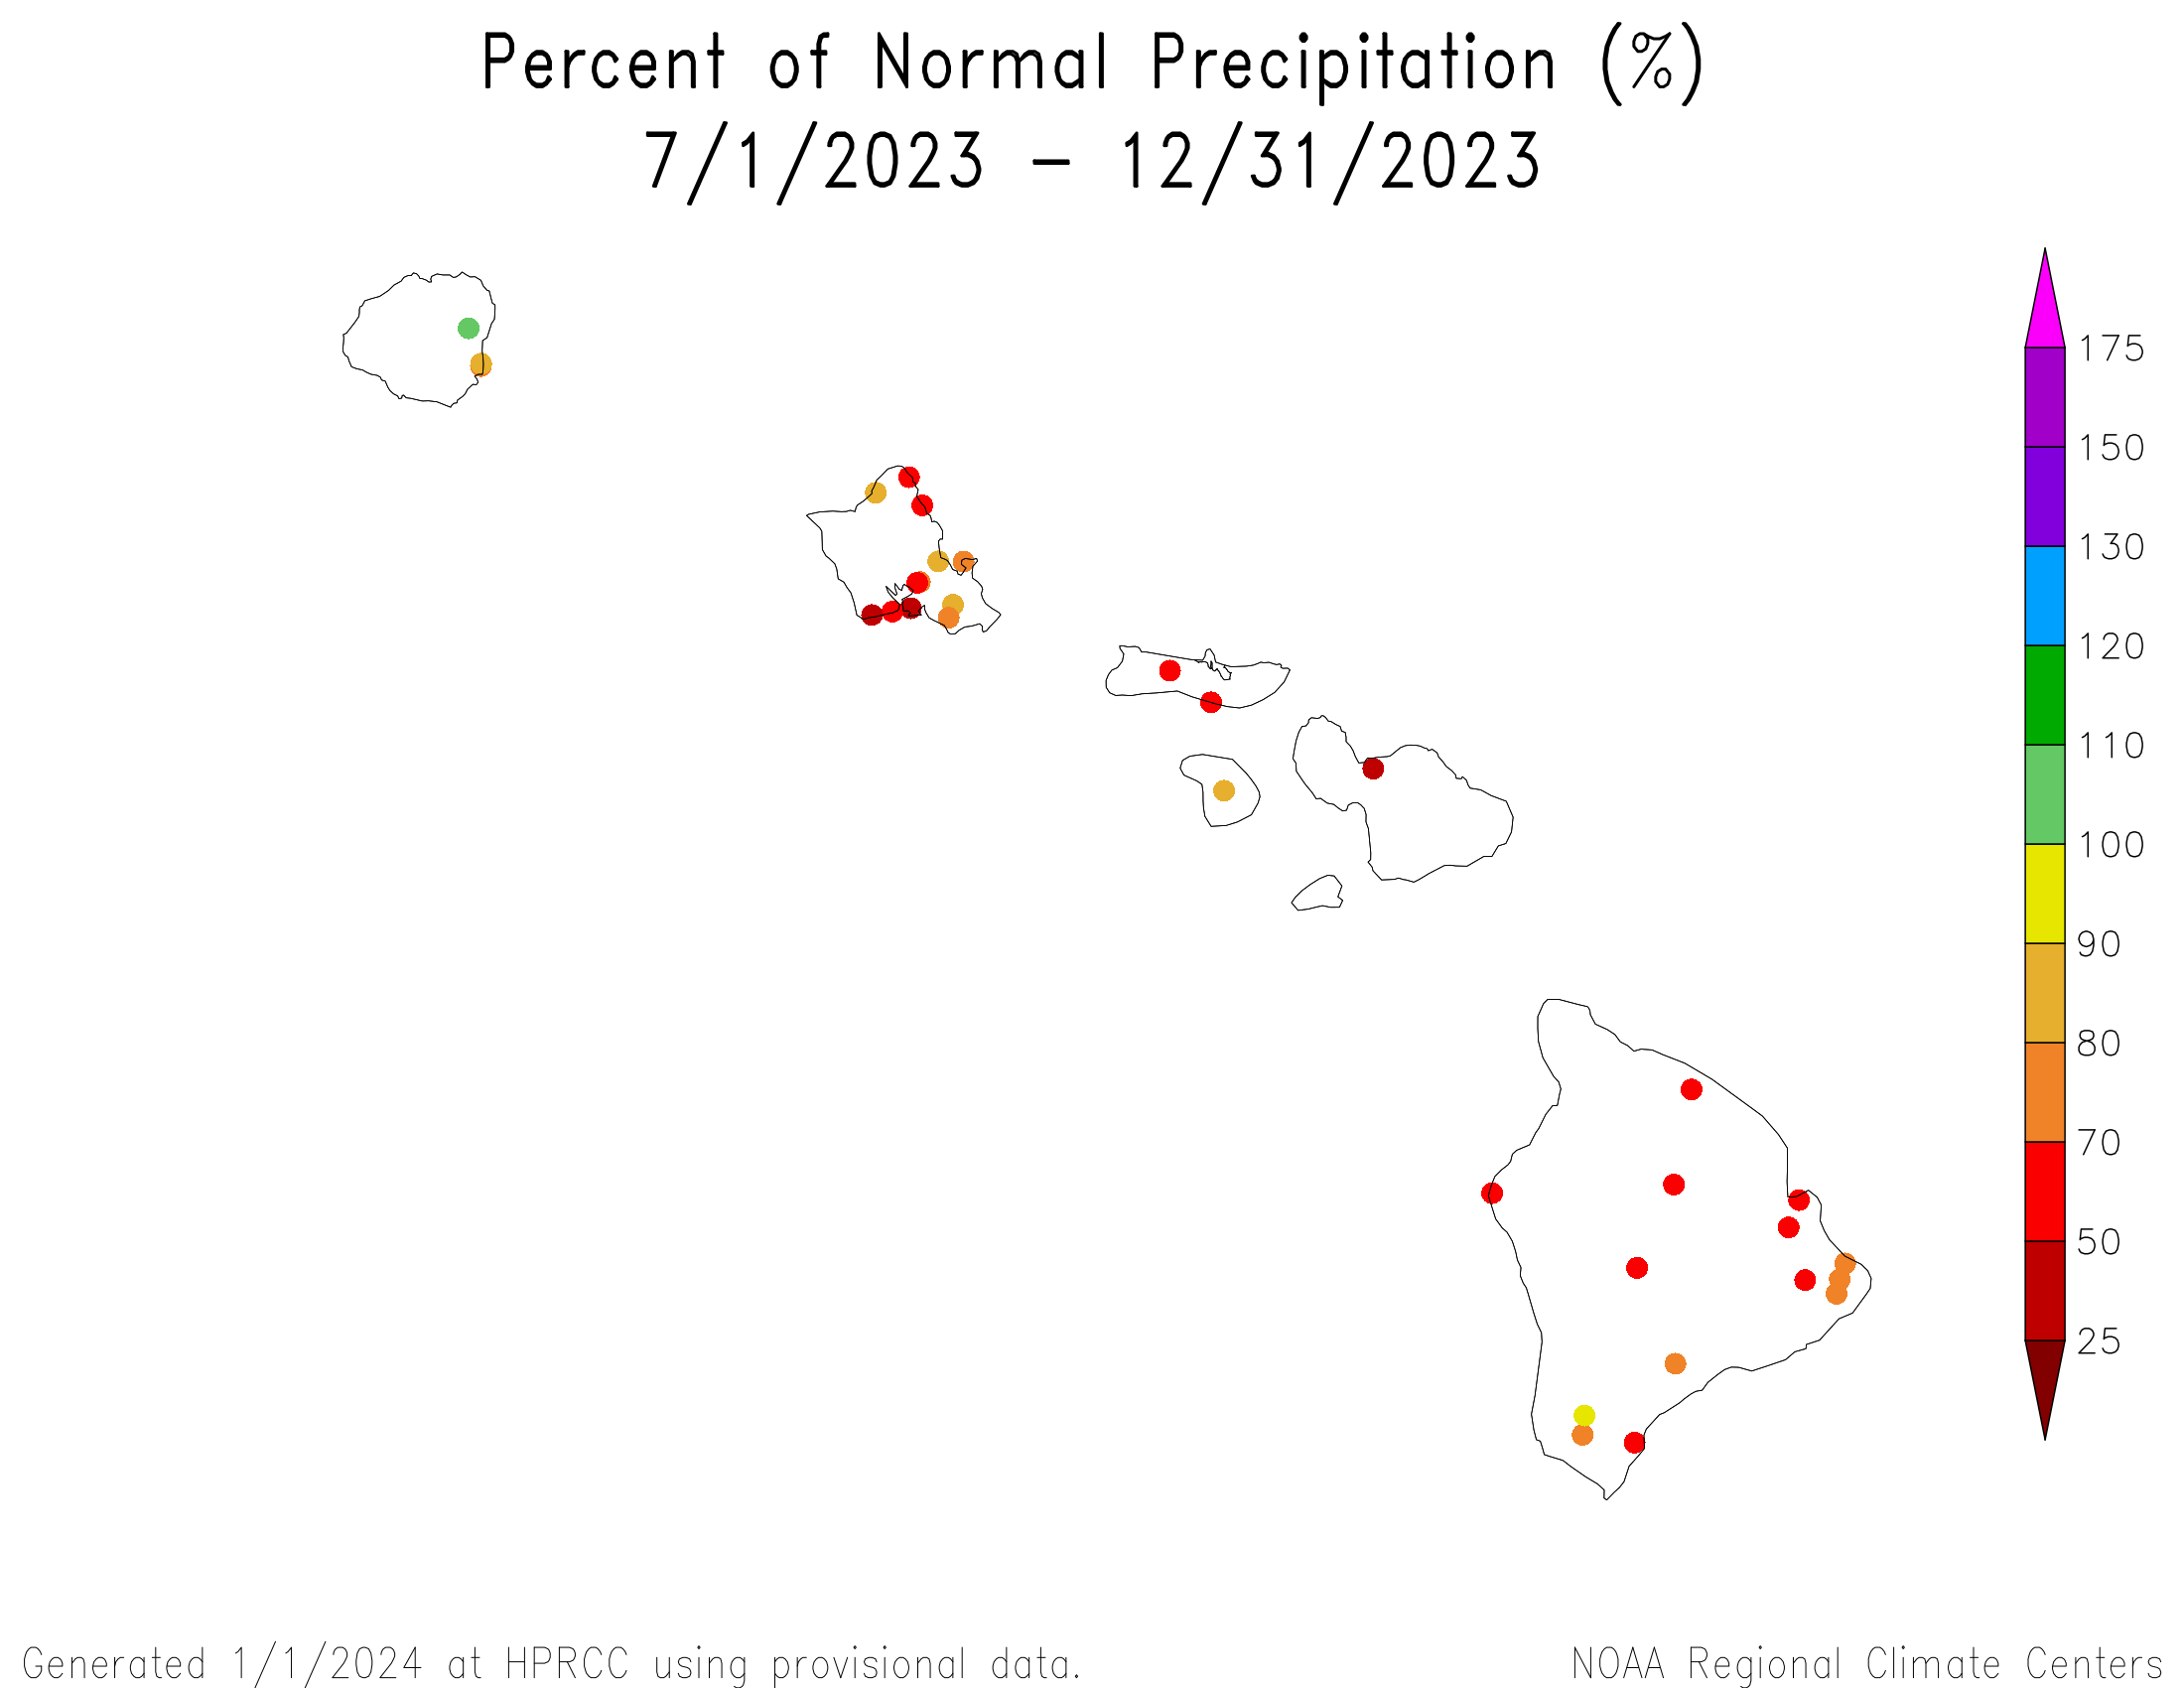

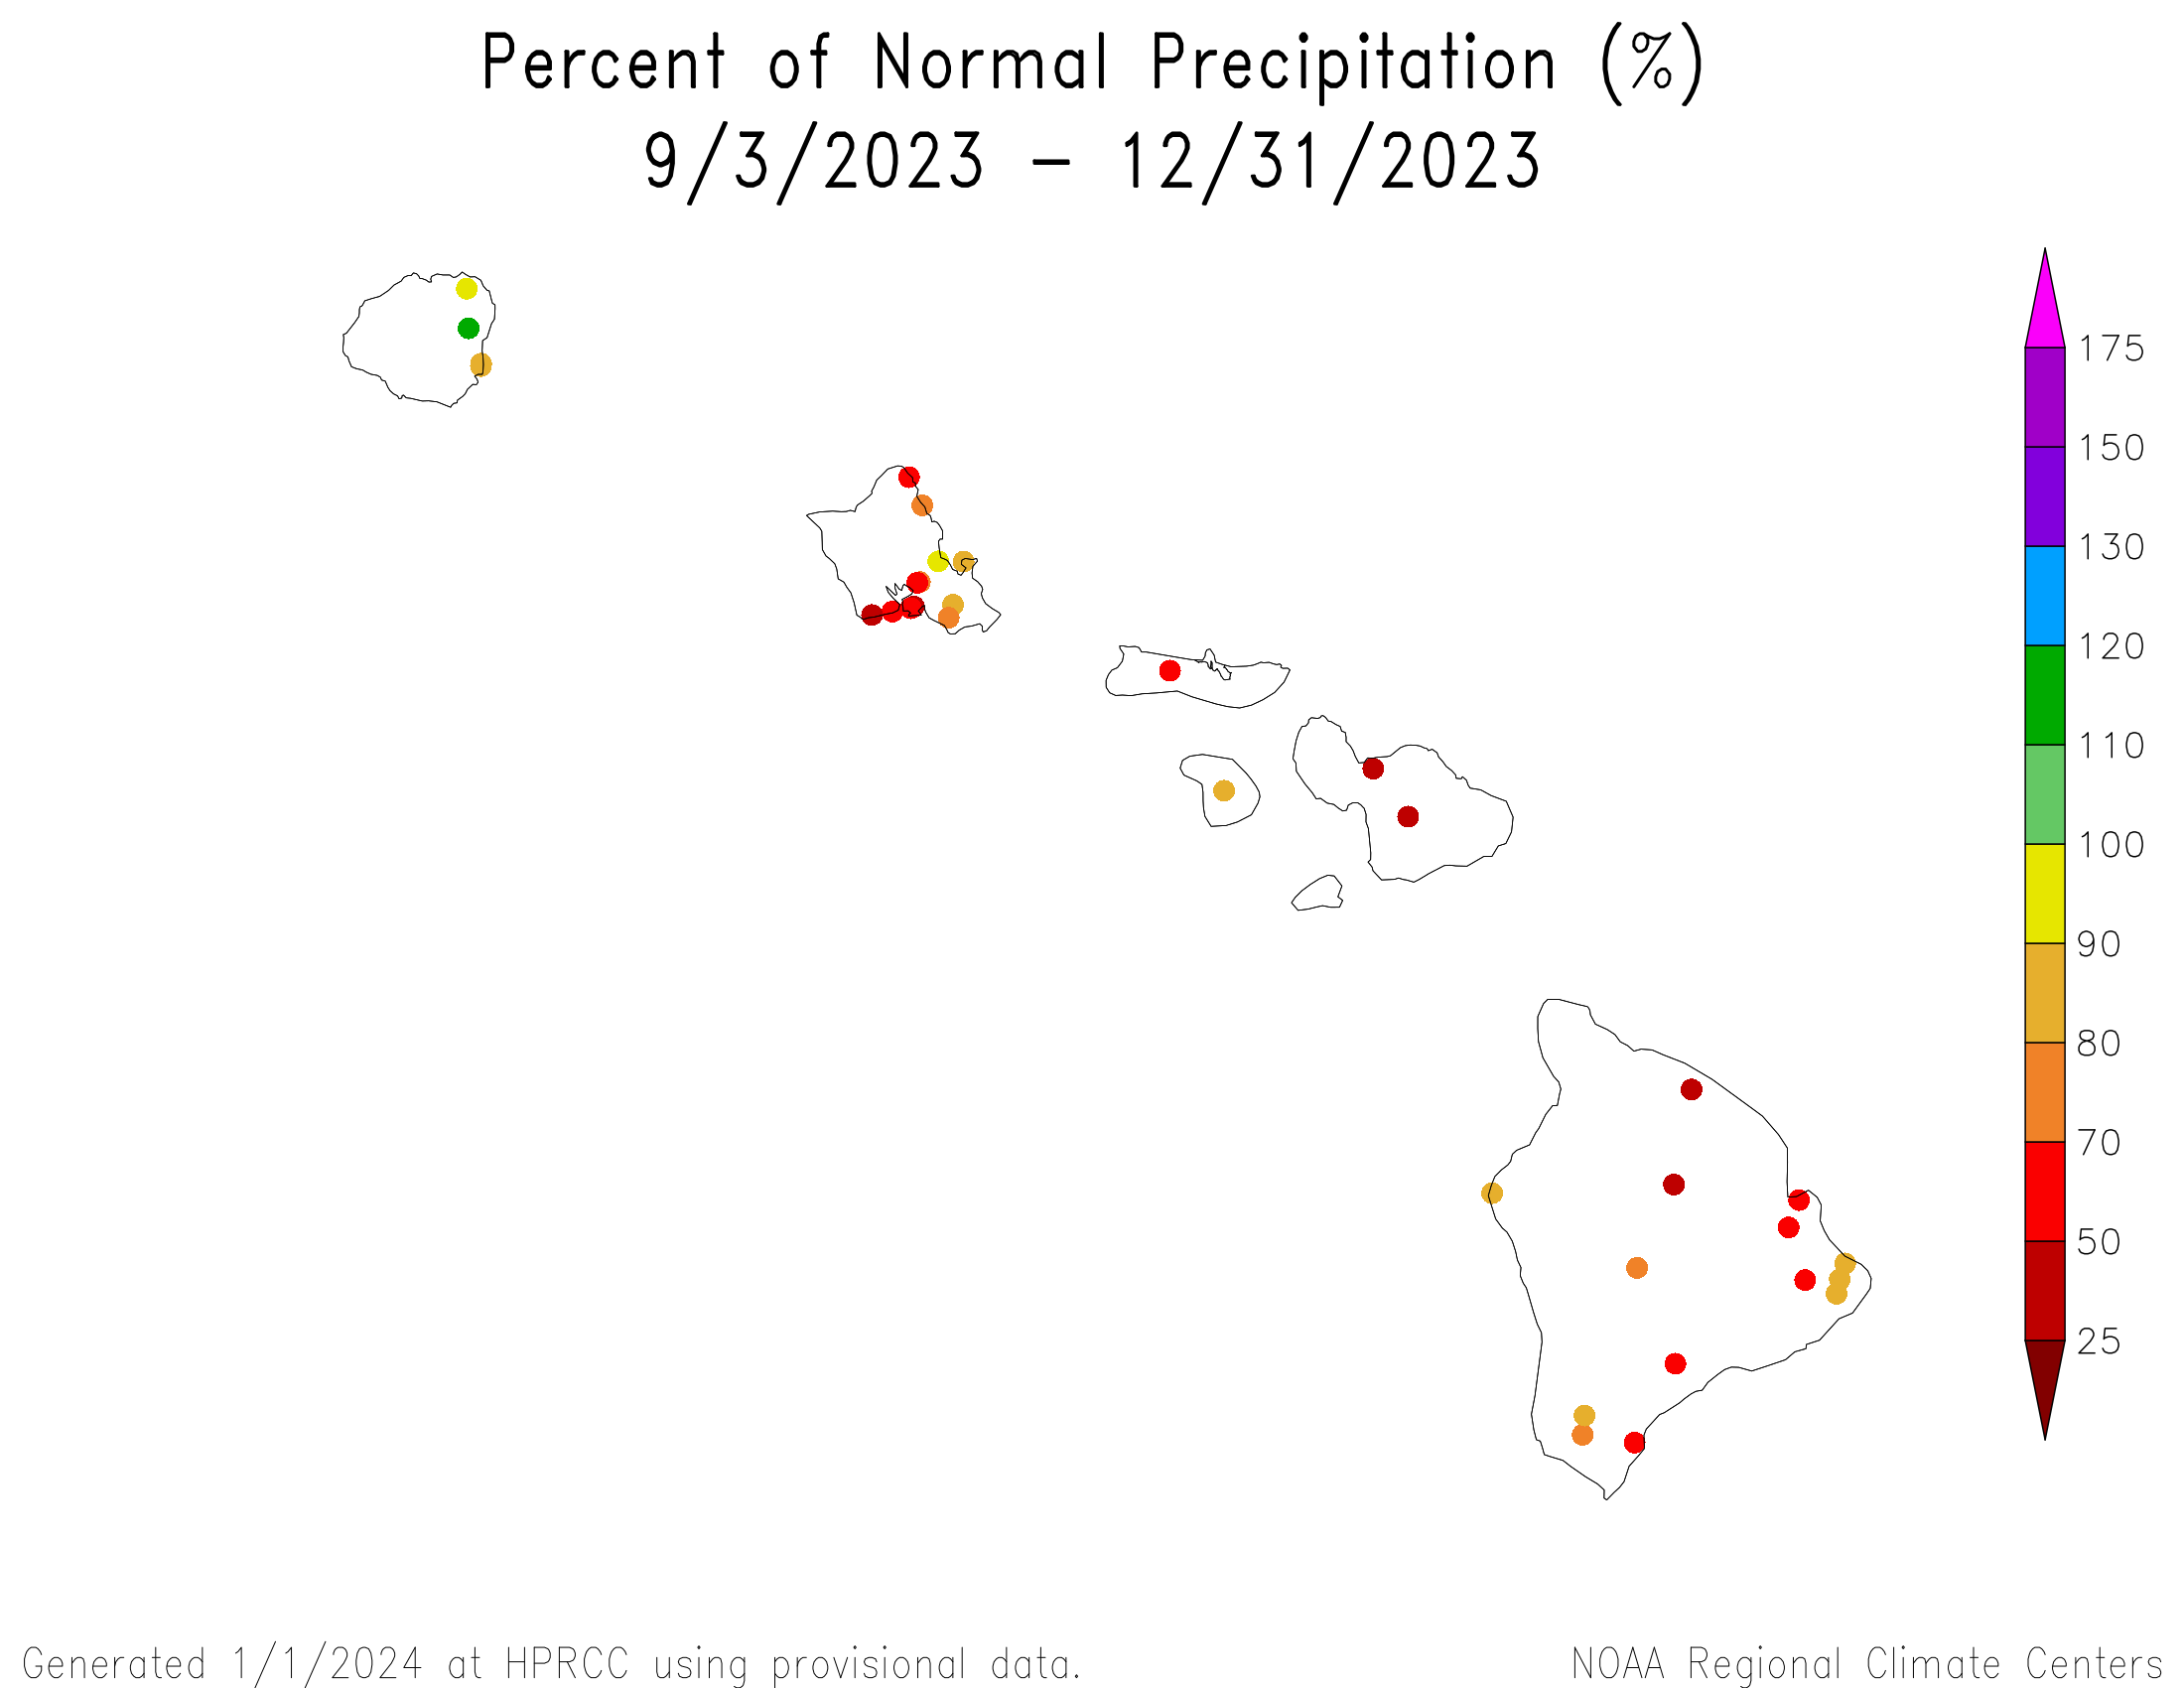
December 2023 was mostly drier than normal over the Hawaiian Islands. A mixed precipitation anomaly pattern was evident at the 2-month time scale, but drier-than-normal conditions dominated at 3 to 6 months. Oahu to Maui were mostly drier than normal, with the other main islands having a mixed precipitation anomaly pattern, at 8- to 9-month time scales. A mixed anomaly pattern returned at longer time scales, except for the 24-month time scale when it was mostly drier than normal in the central main islands (precipitation anomaly maps for the last 1, 2, 3, 4, 6, 9, 12, 24, 36, 48, 60 months).
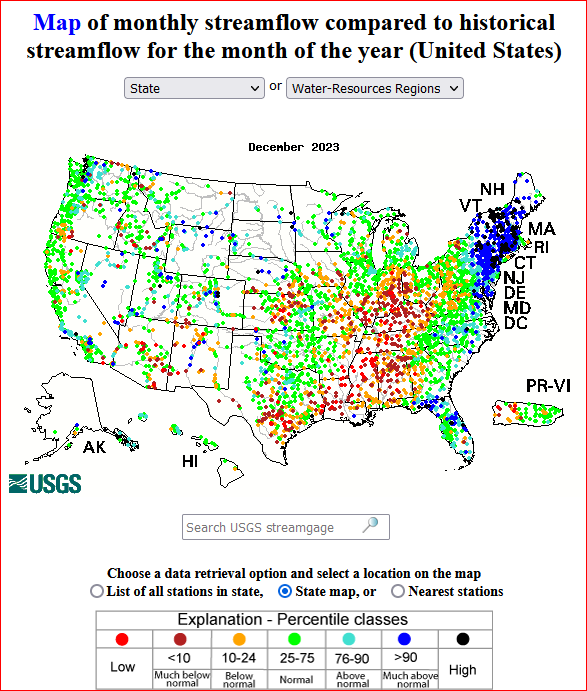
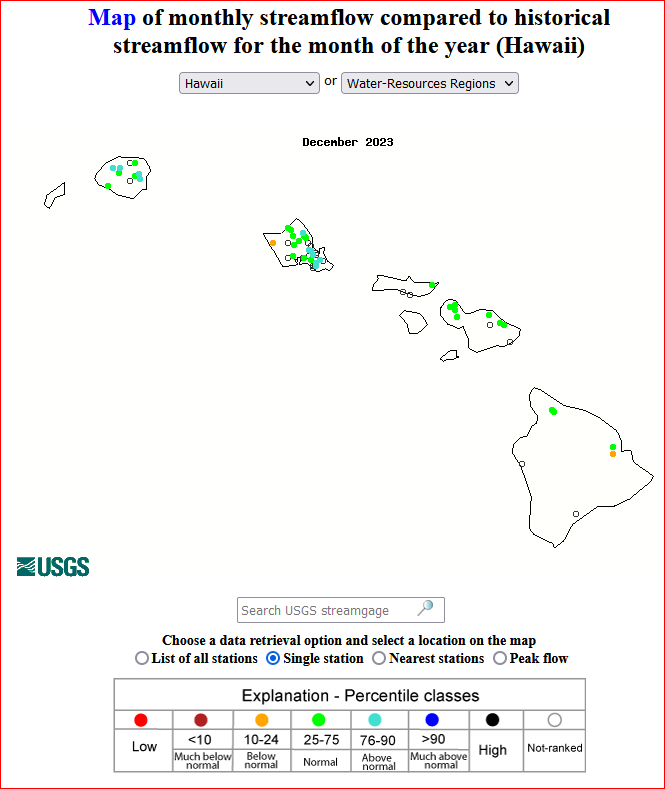
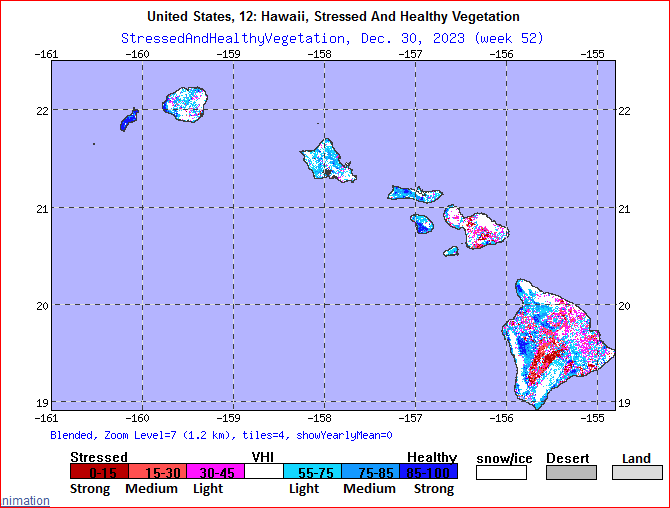
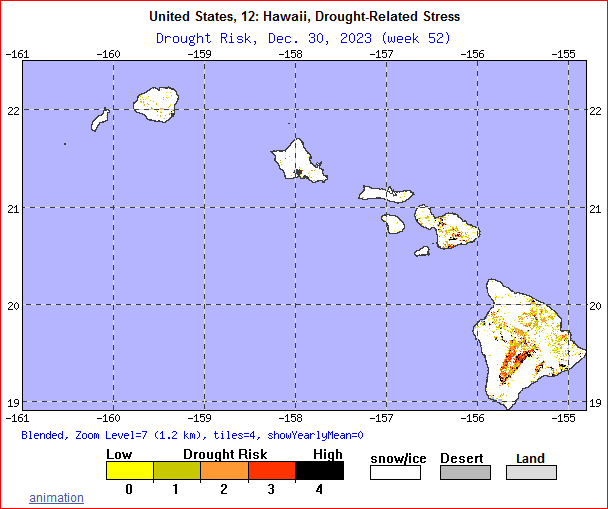
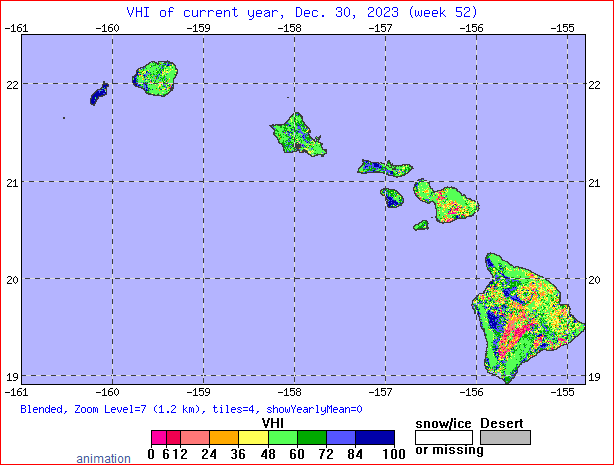
Monthly streamflow was near normal across most of the main islands. Based on satellite analyses (stressed vegetation, drought stress, VHI), the area of stressed vegetation was reduced compared to last month.
Extreme drought ended and moderate to severe drought continued across Hawaii during December, with the drought area significantly contracting from 93.6% at the end of November to about 21.7% of the state on the January 2, 2024 USDM map.
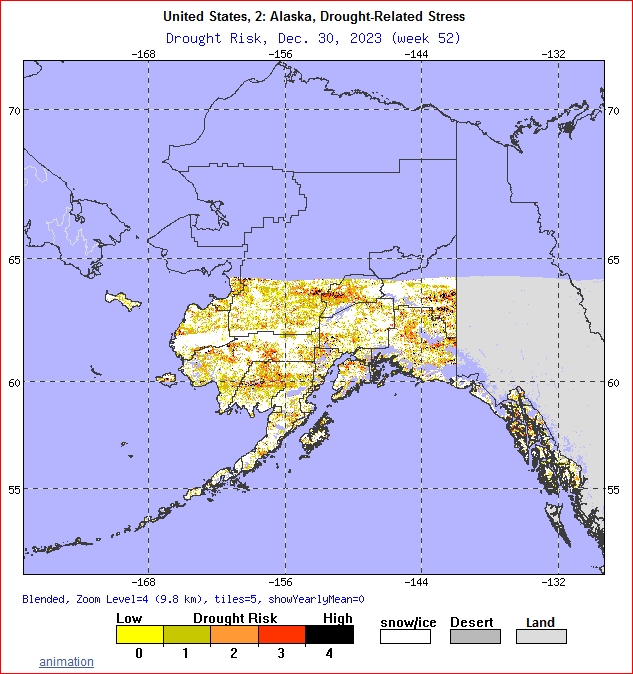
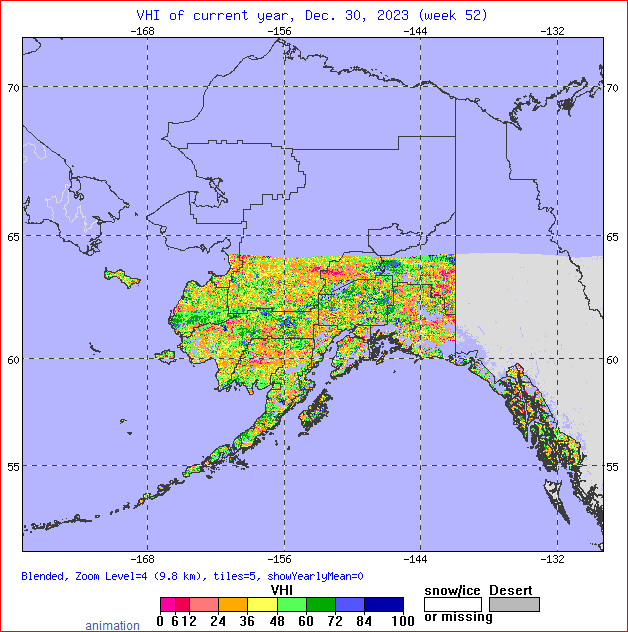
Alaska

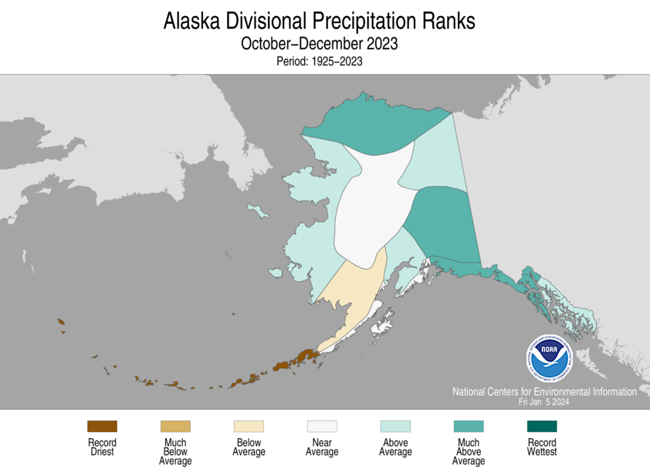

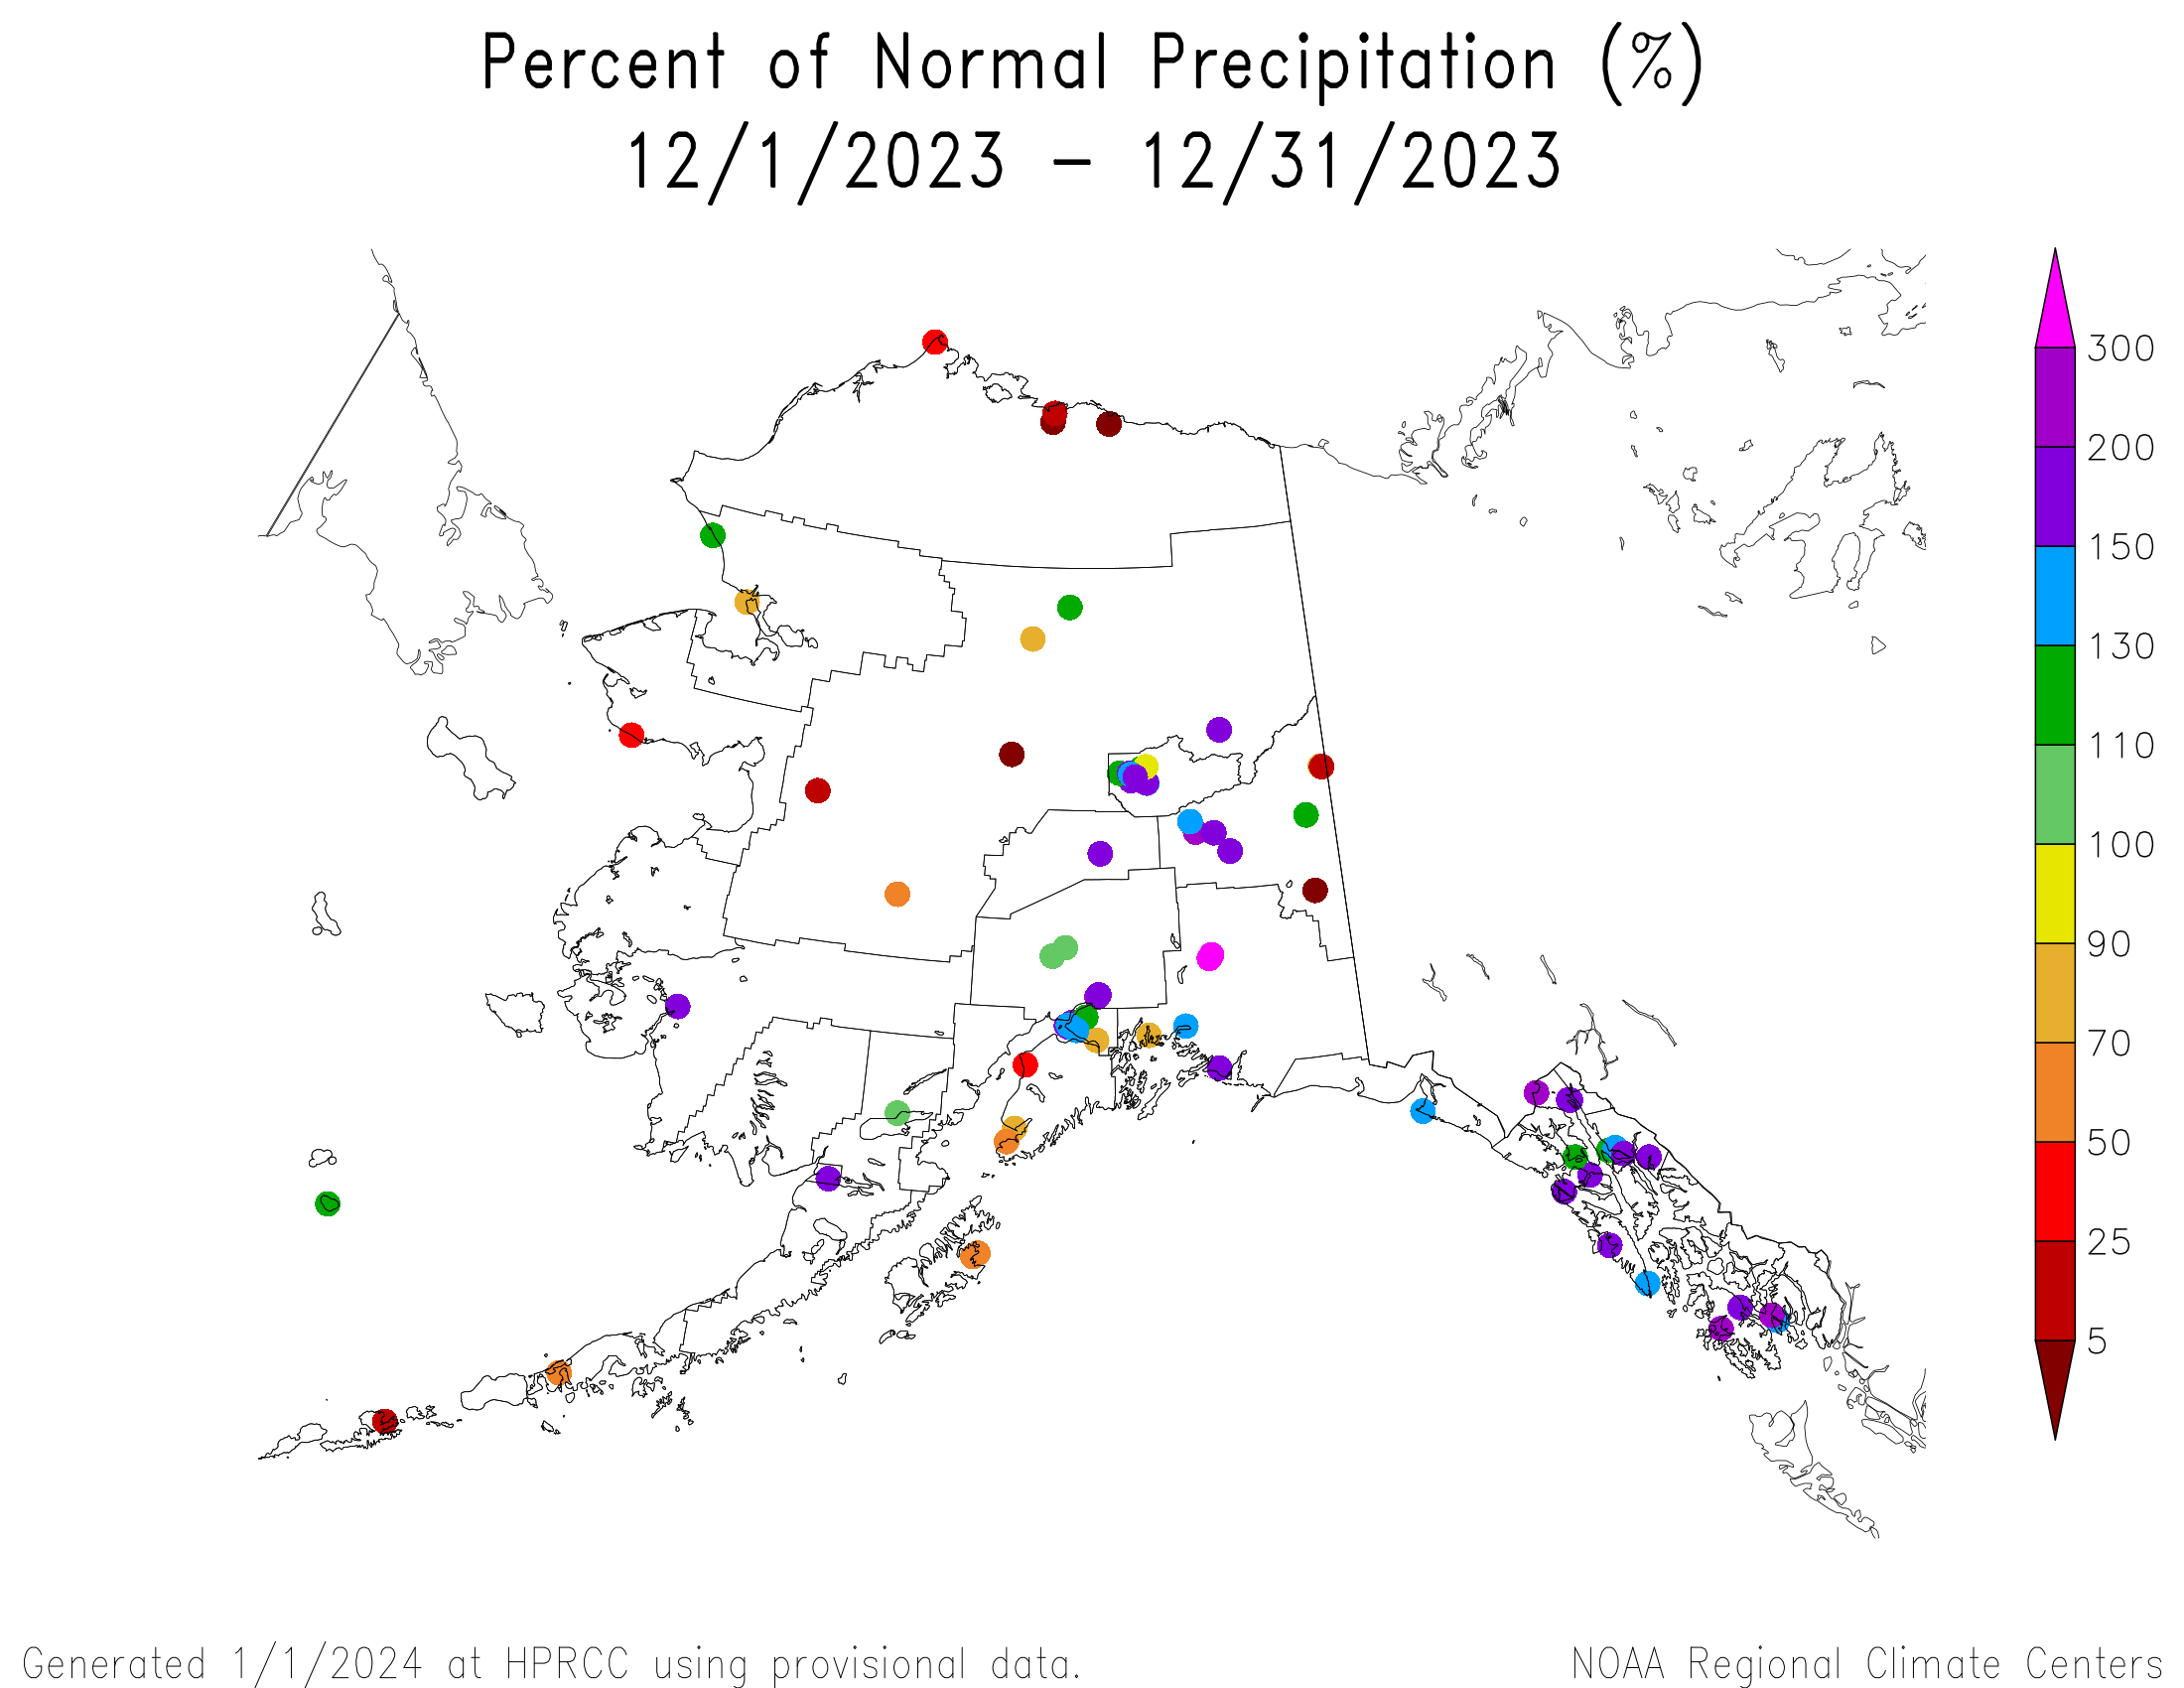
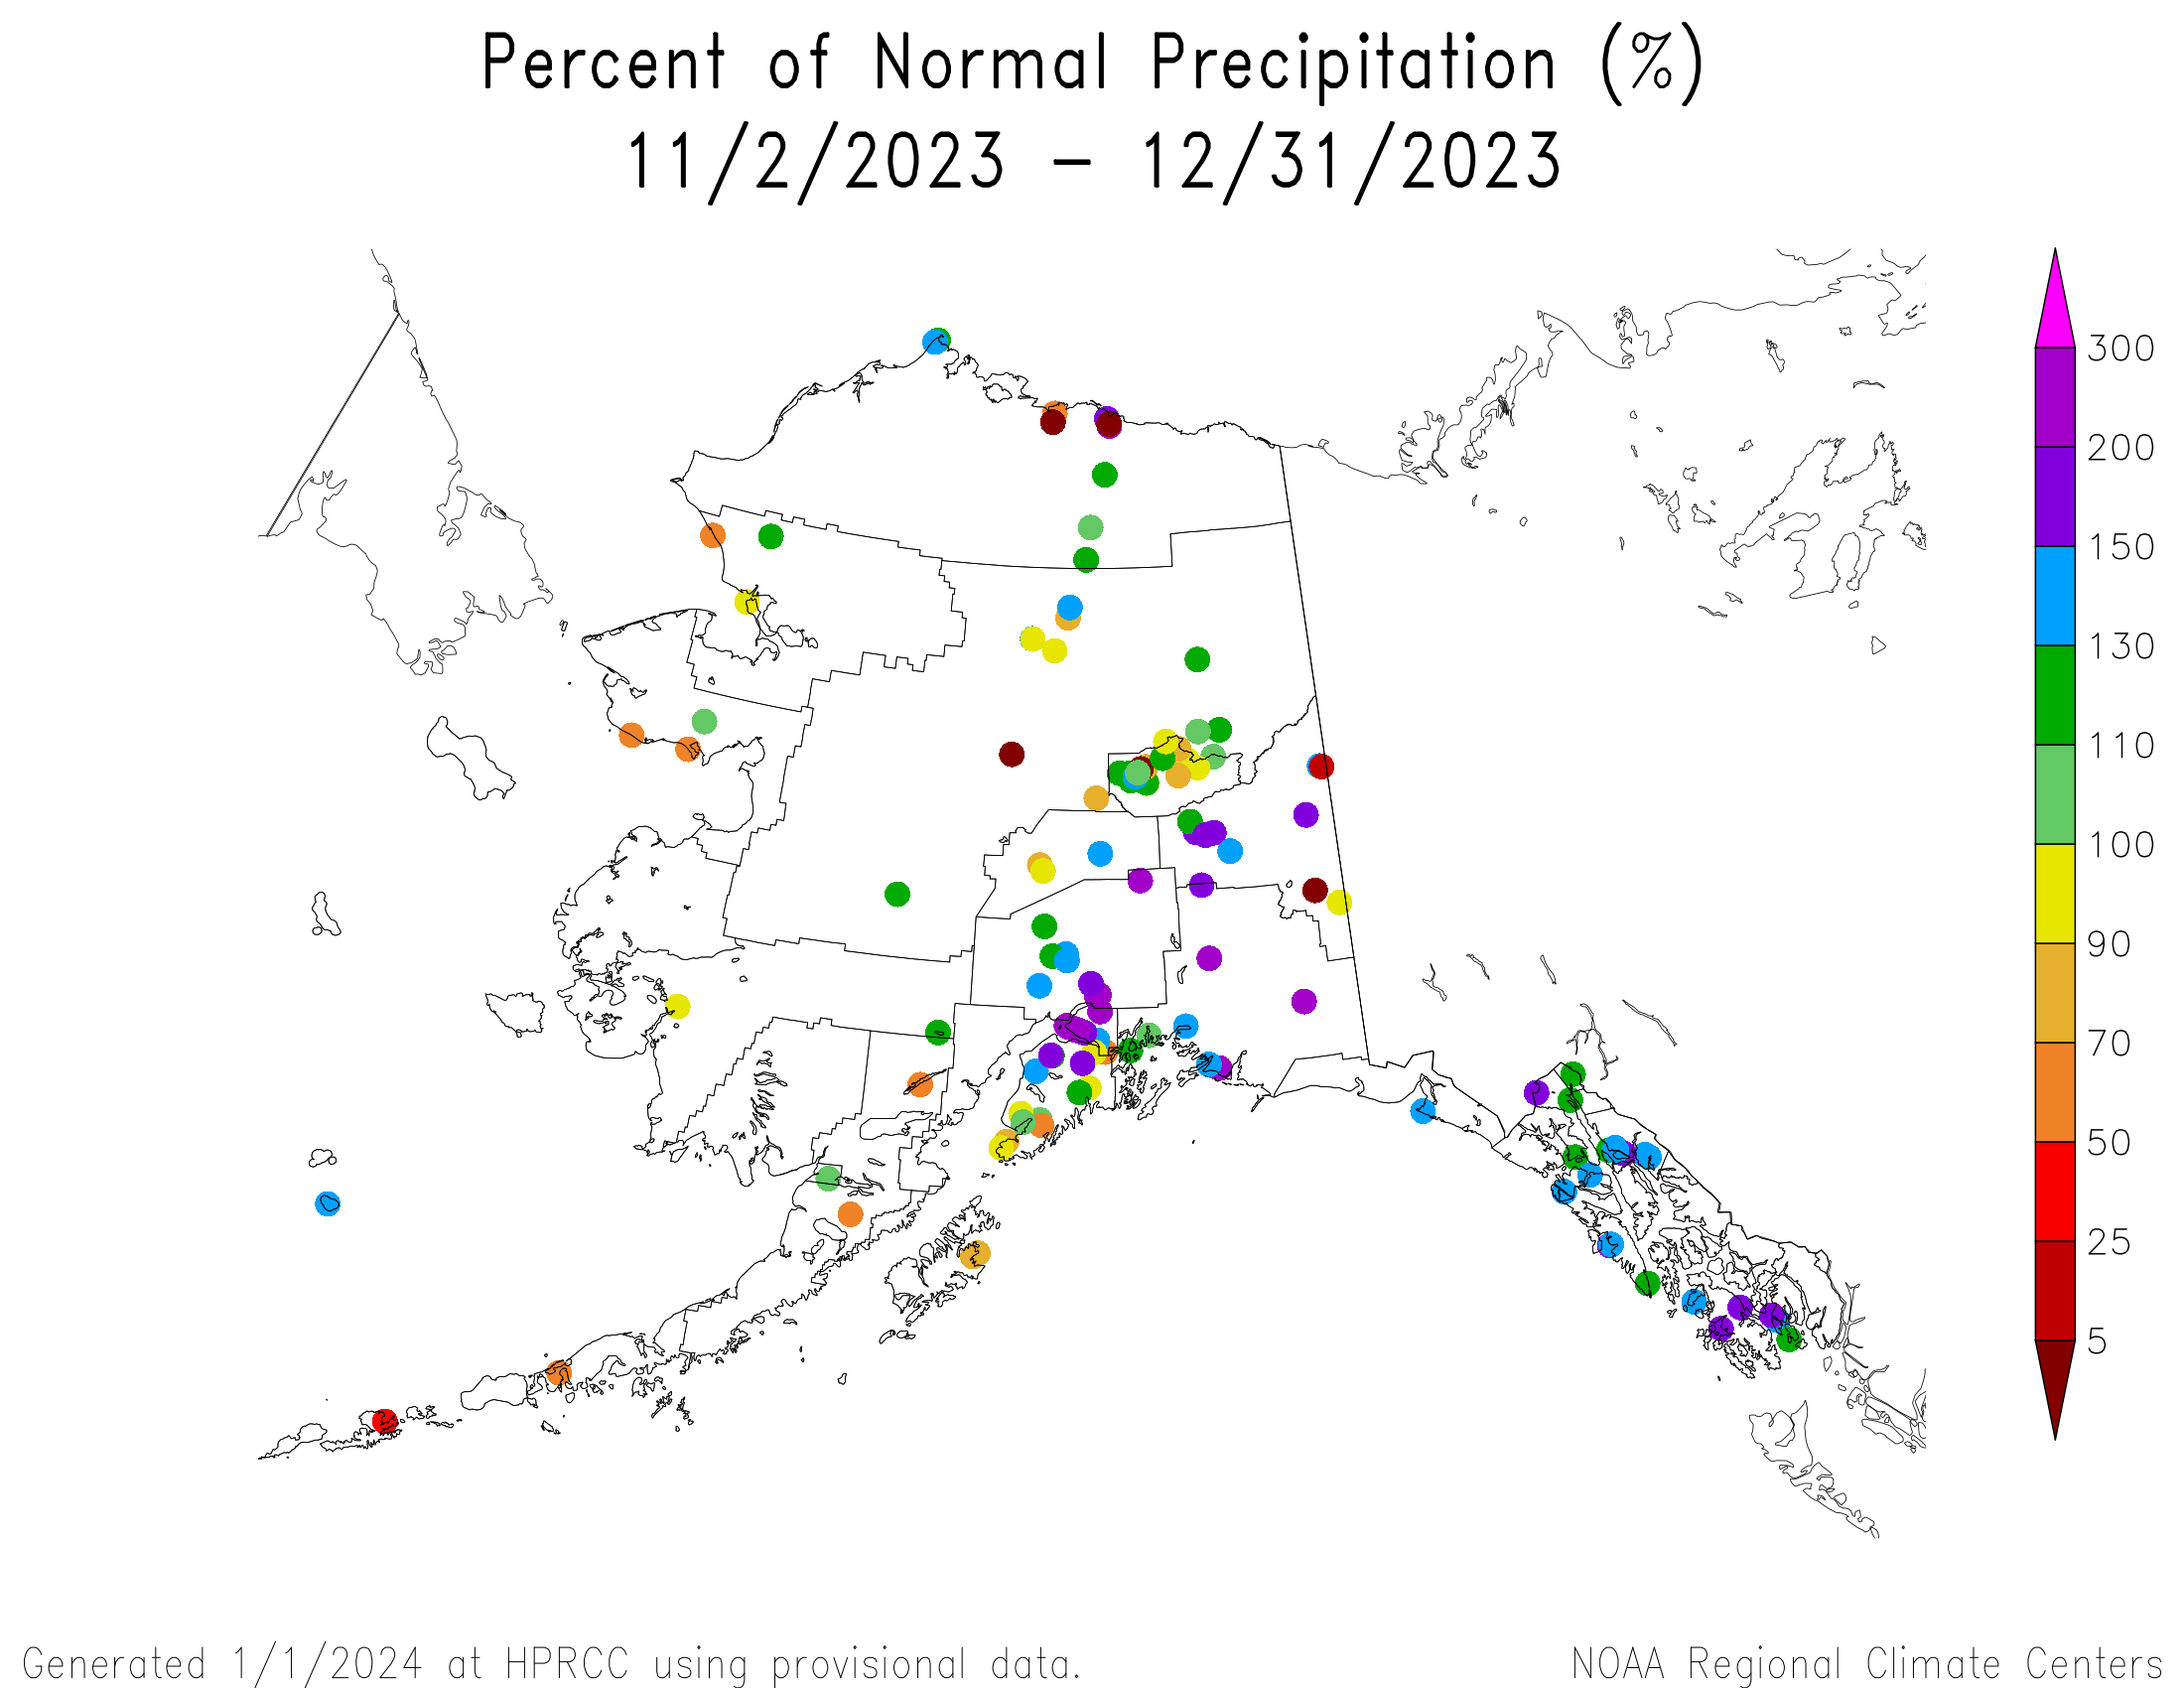
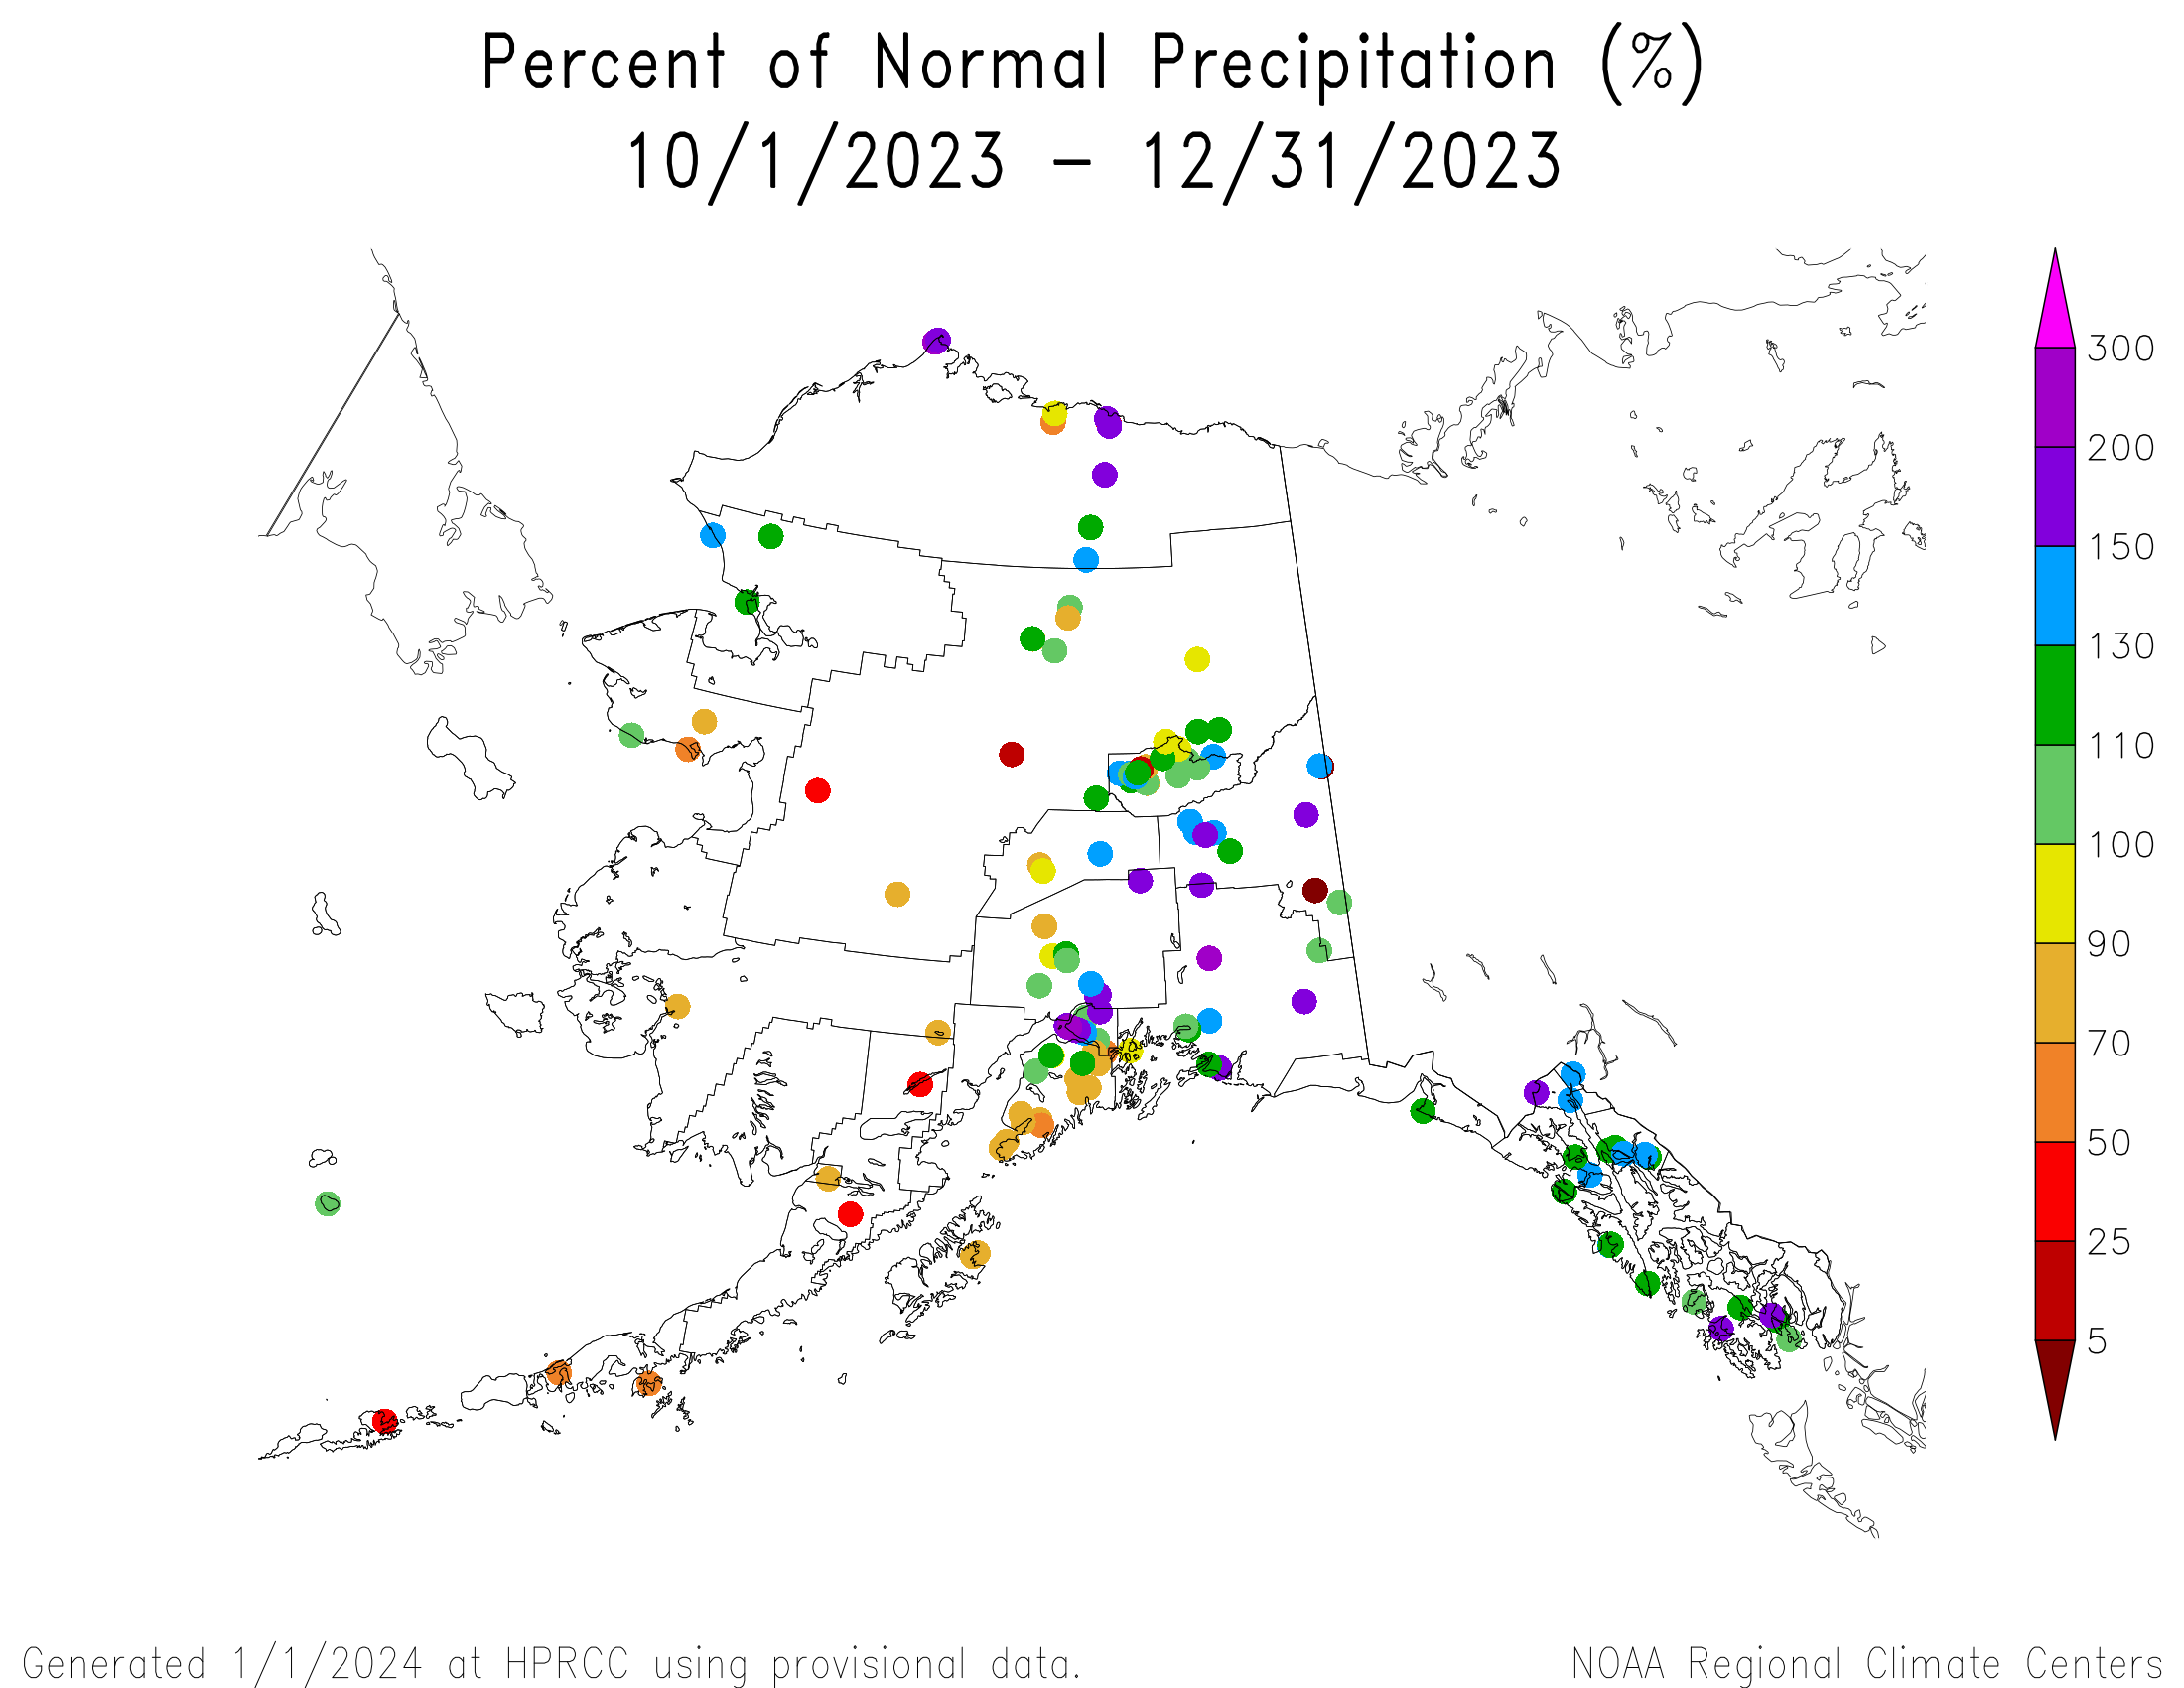
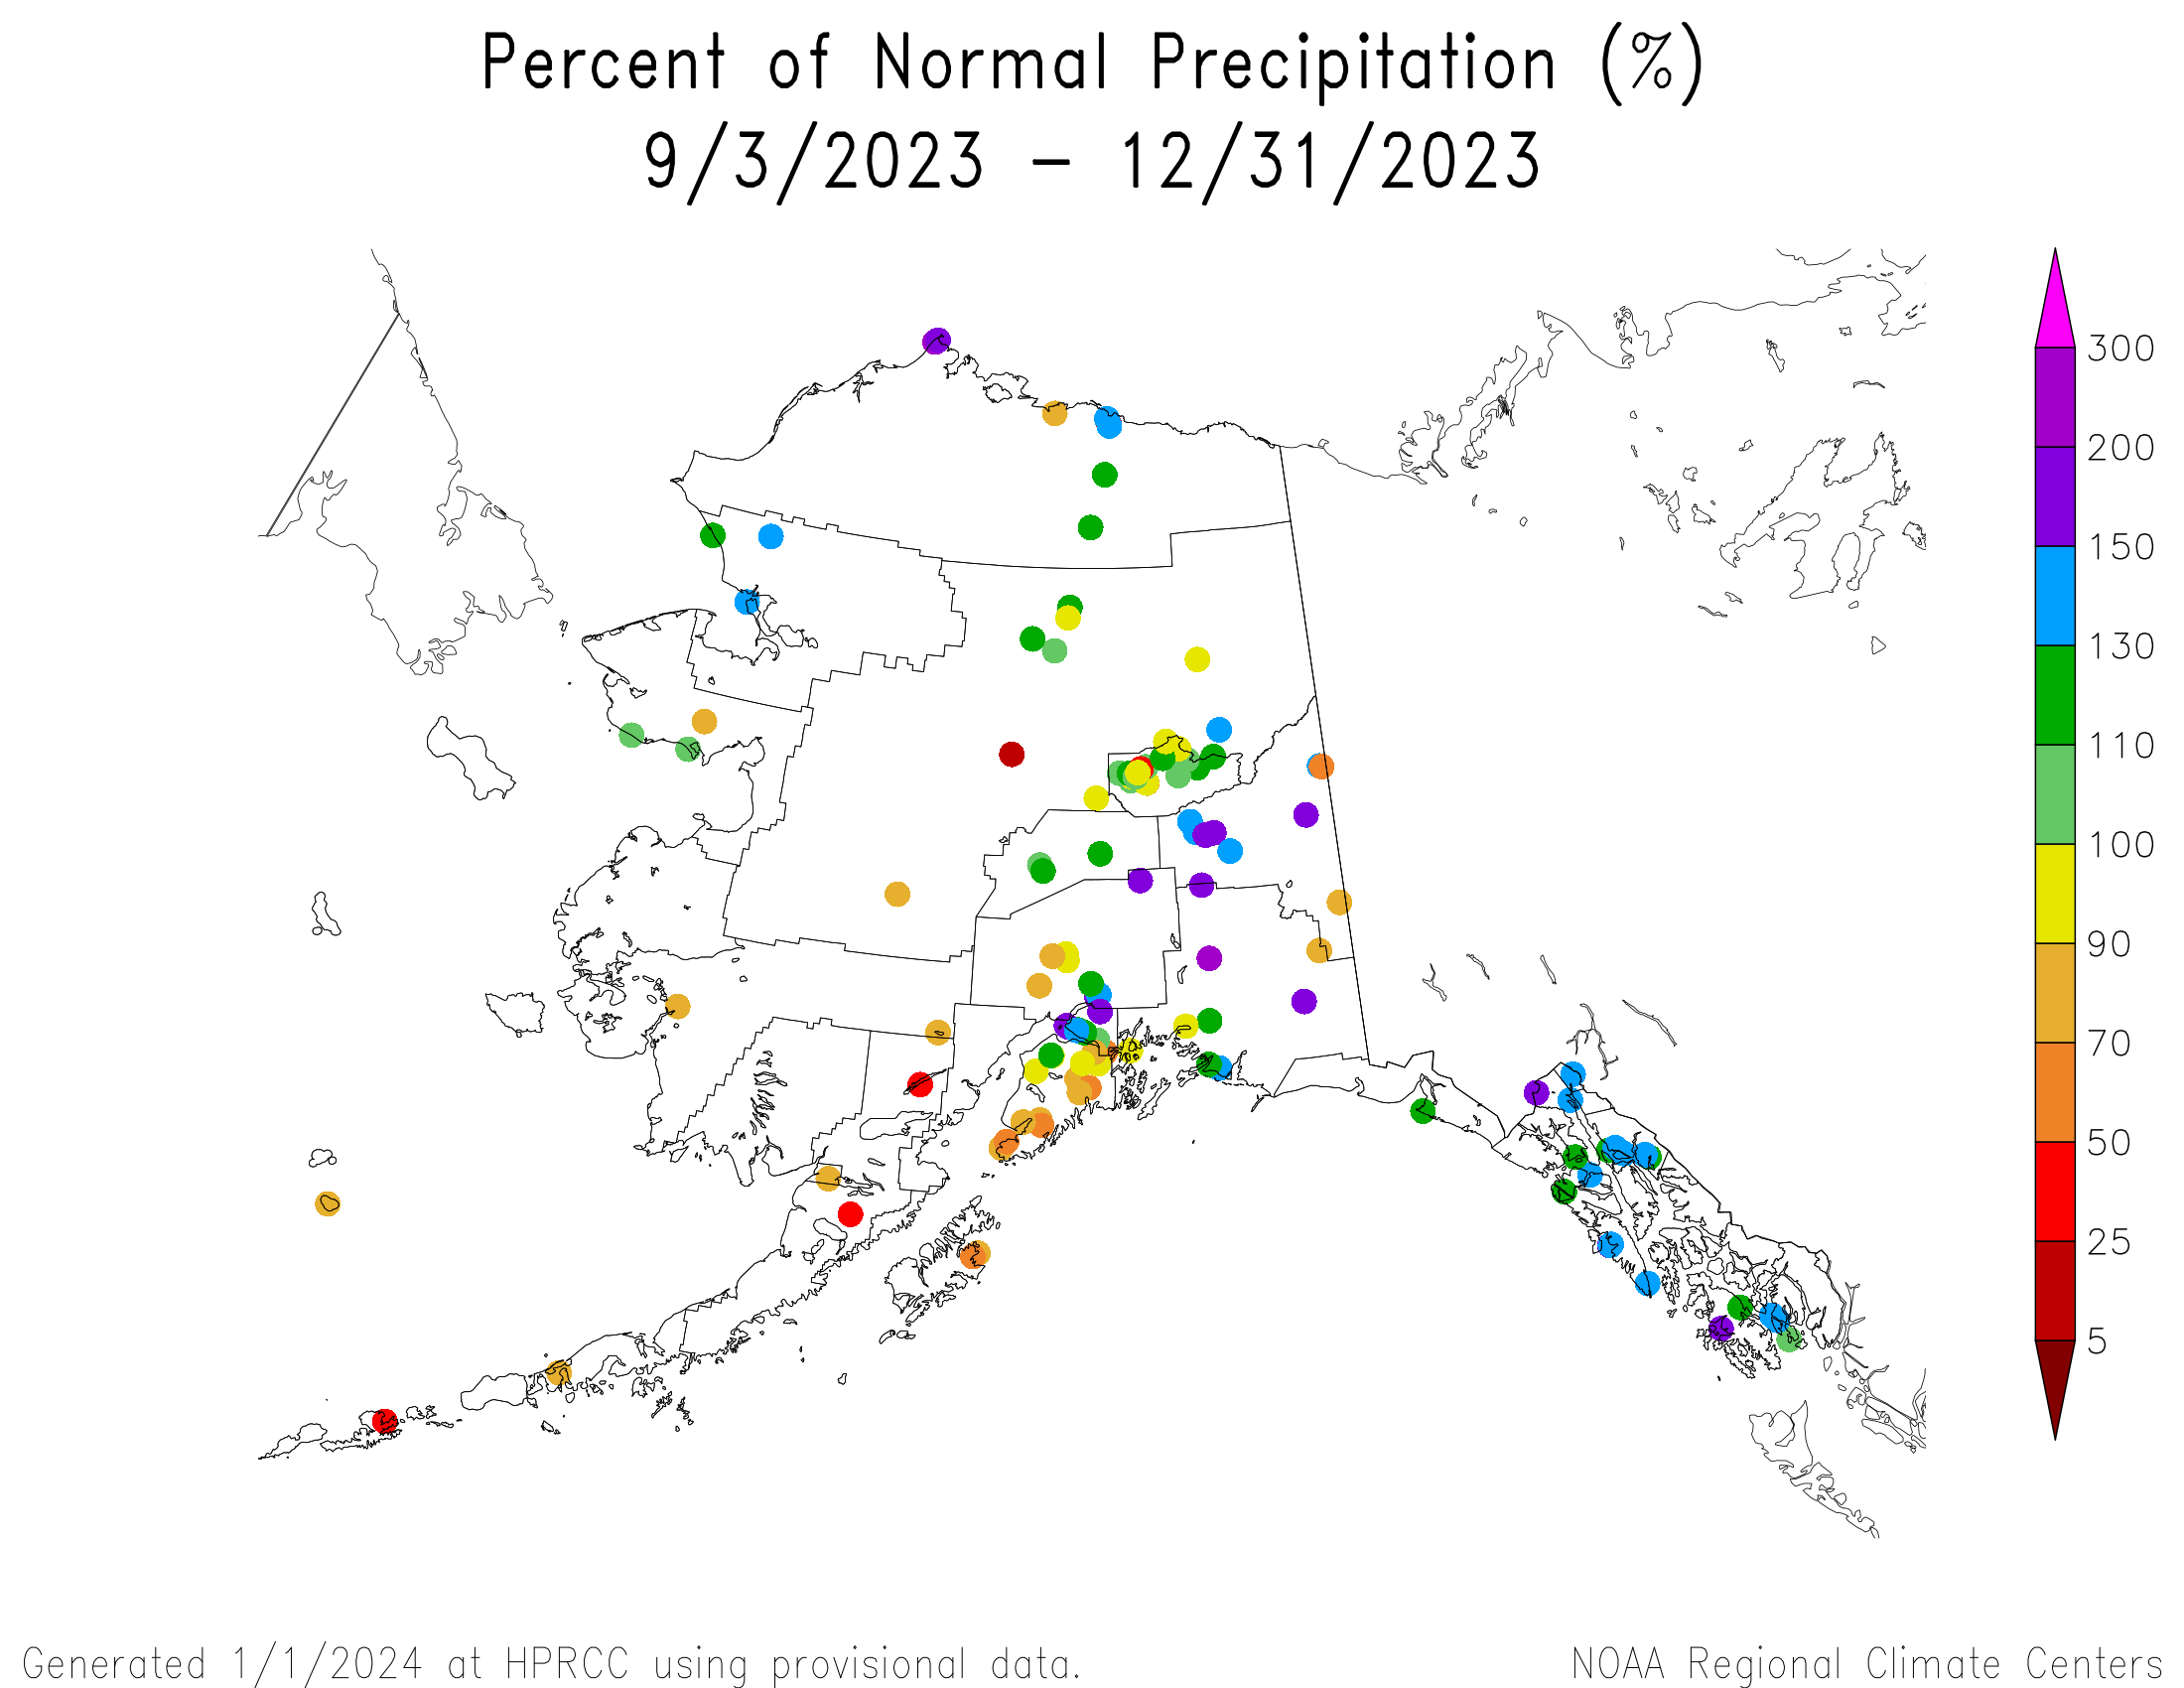
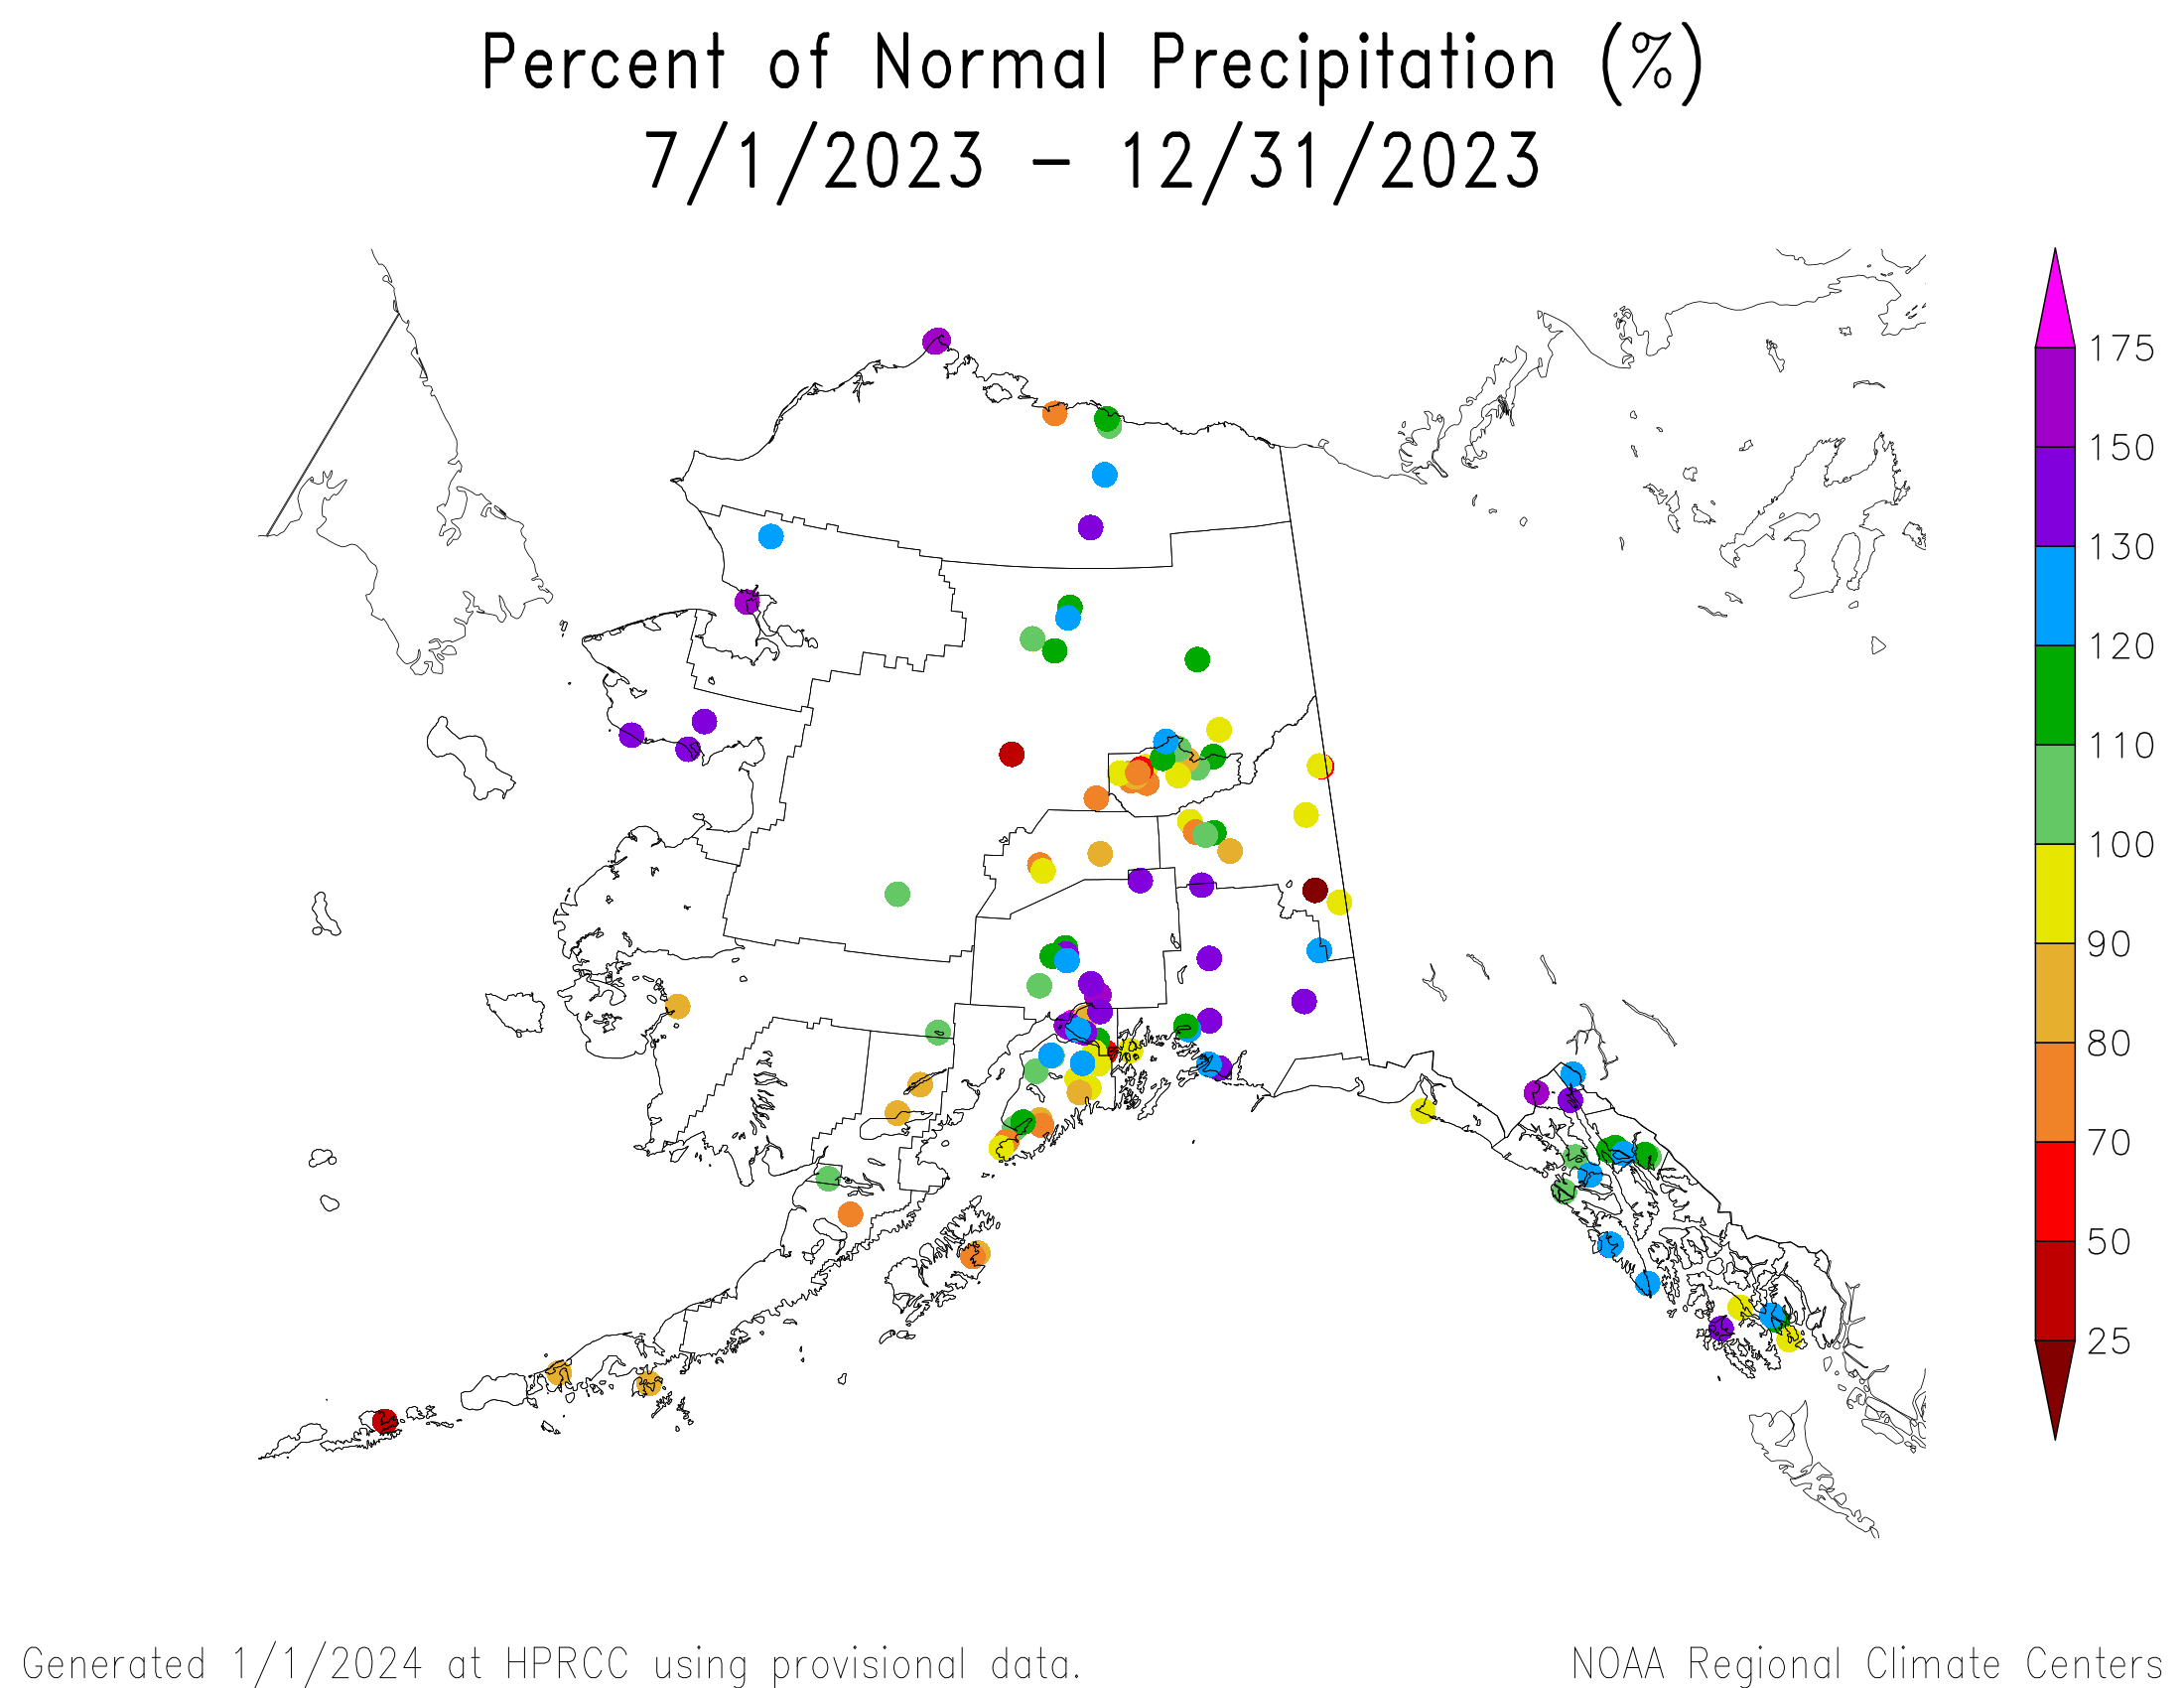
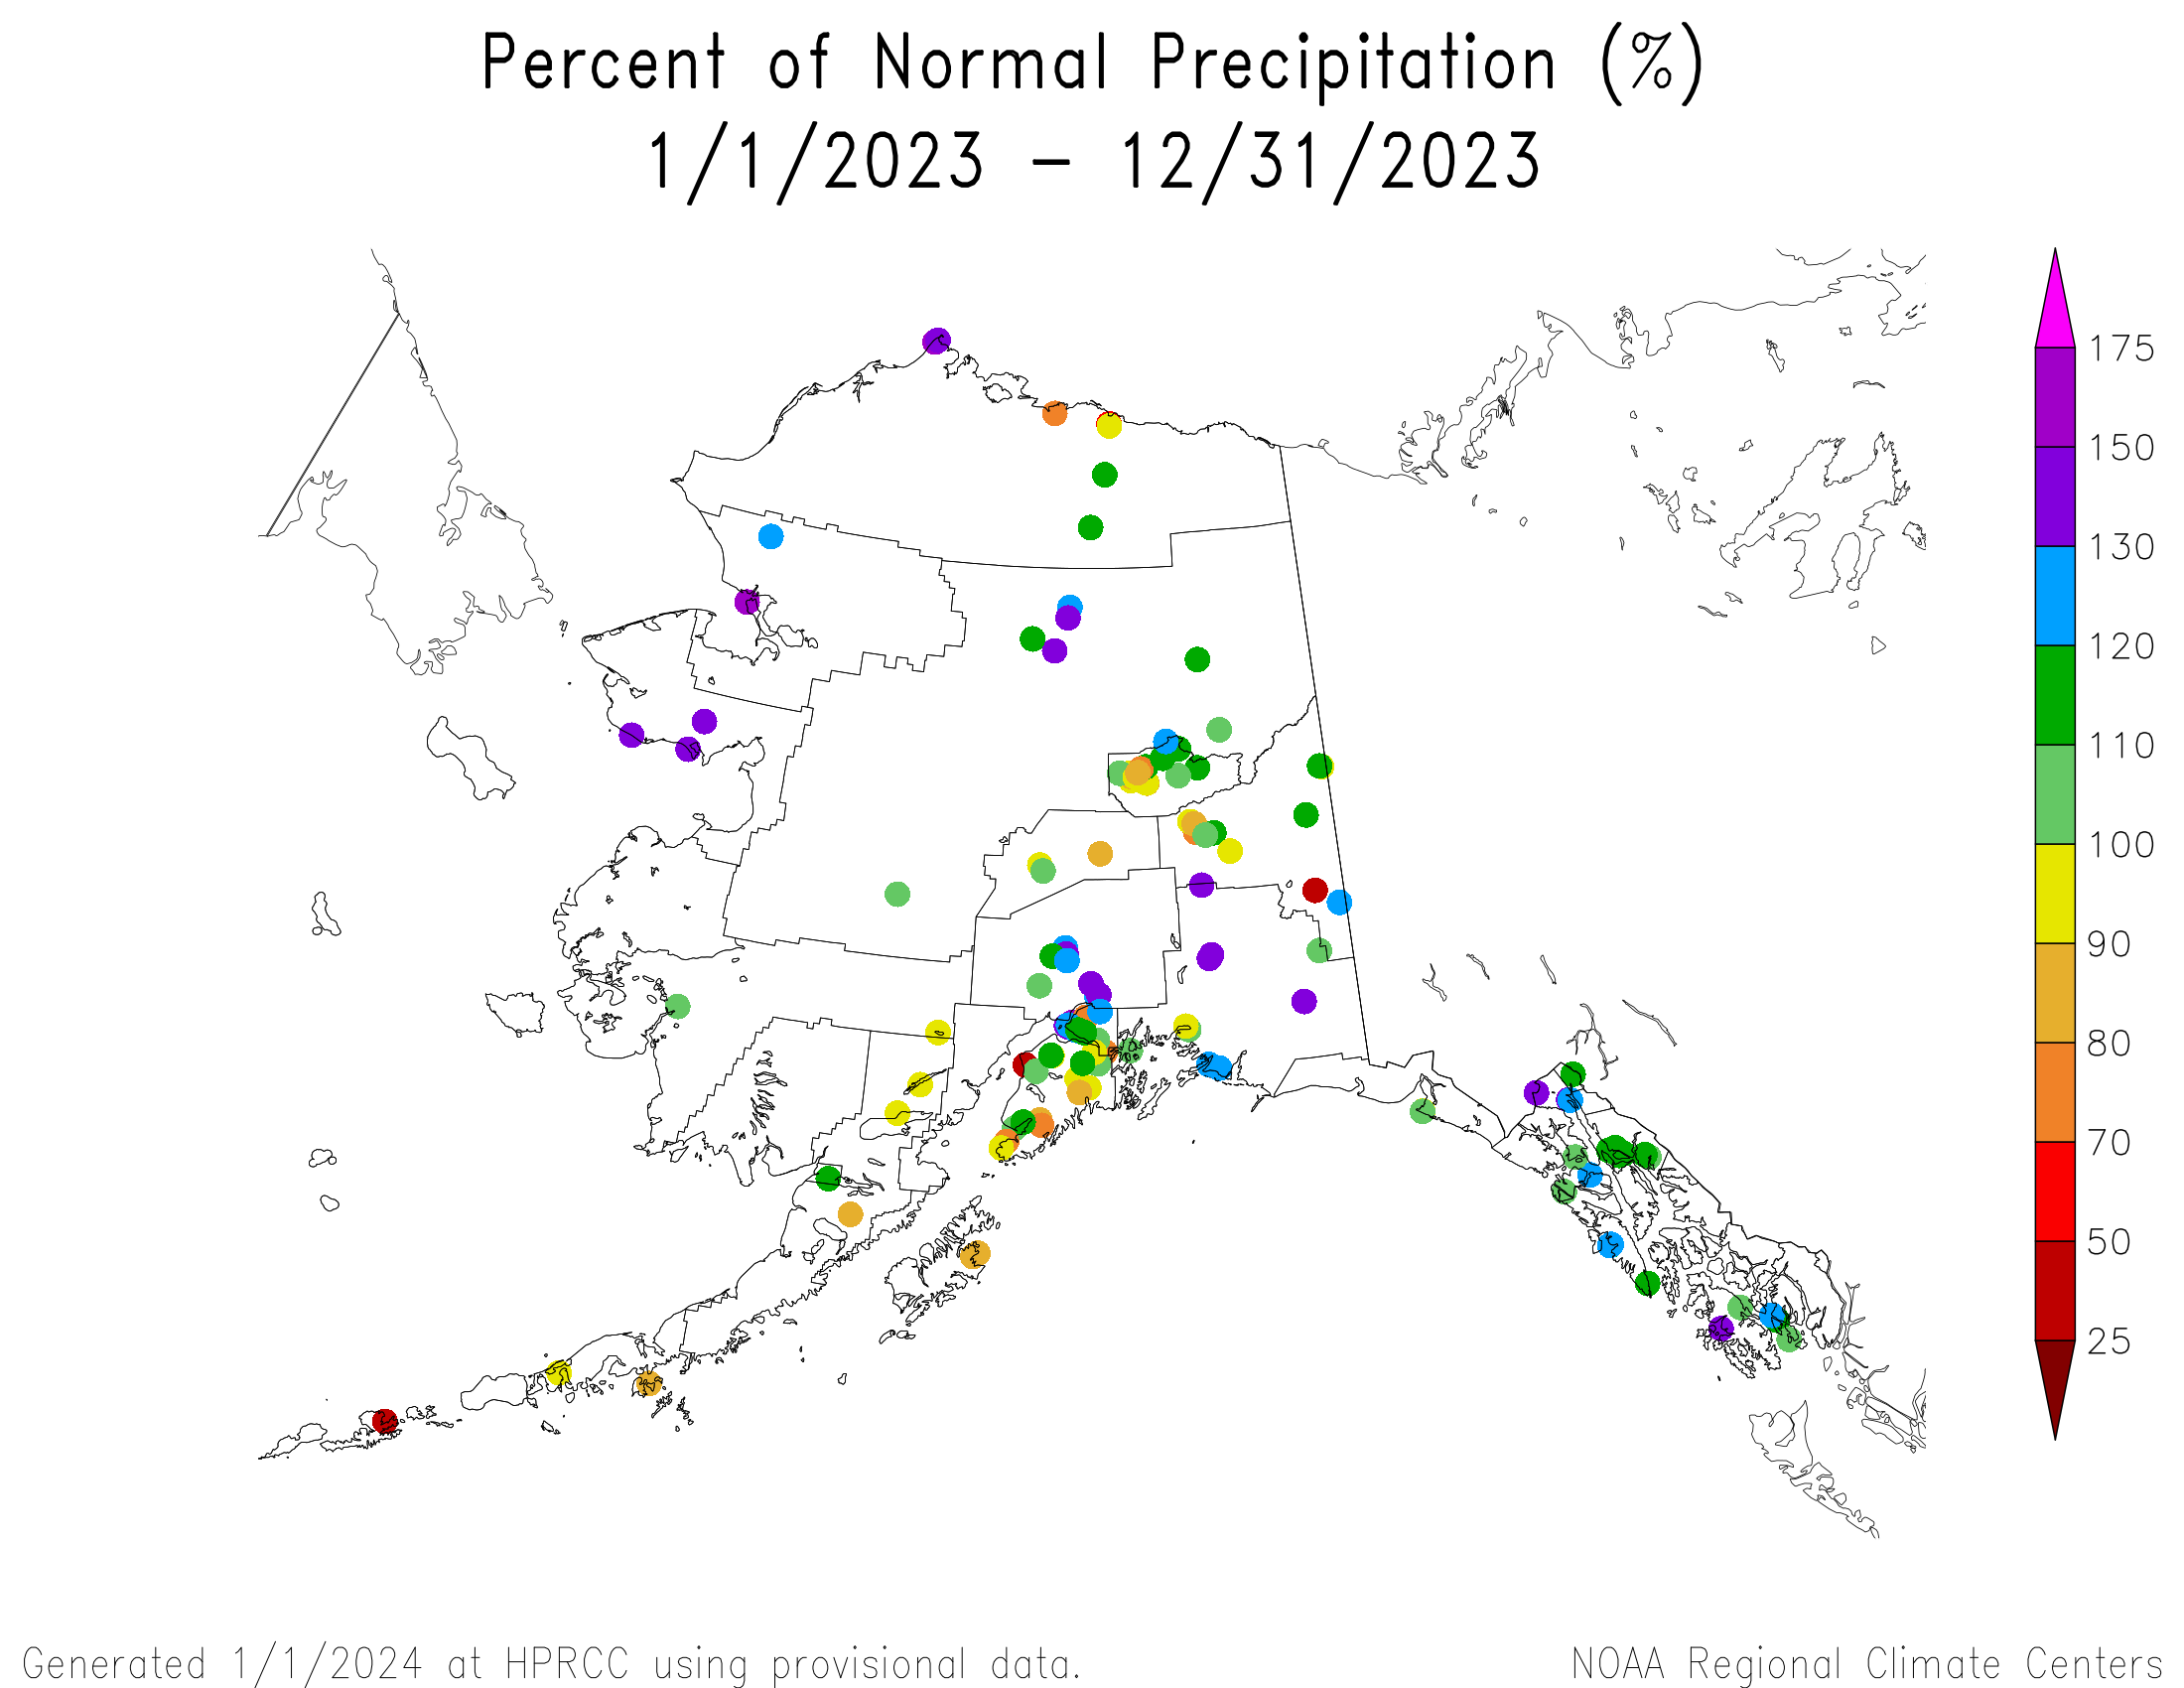
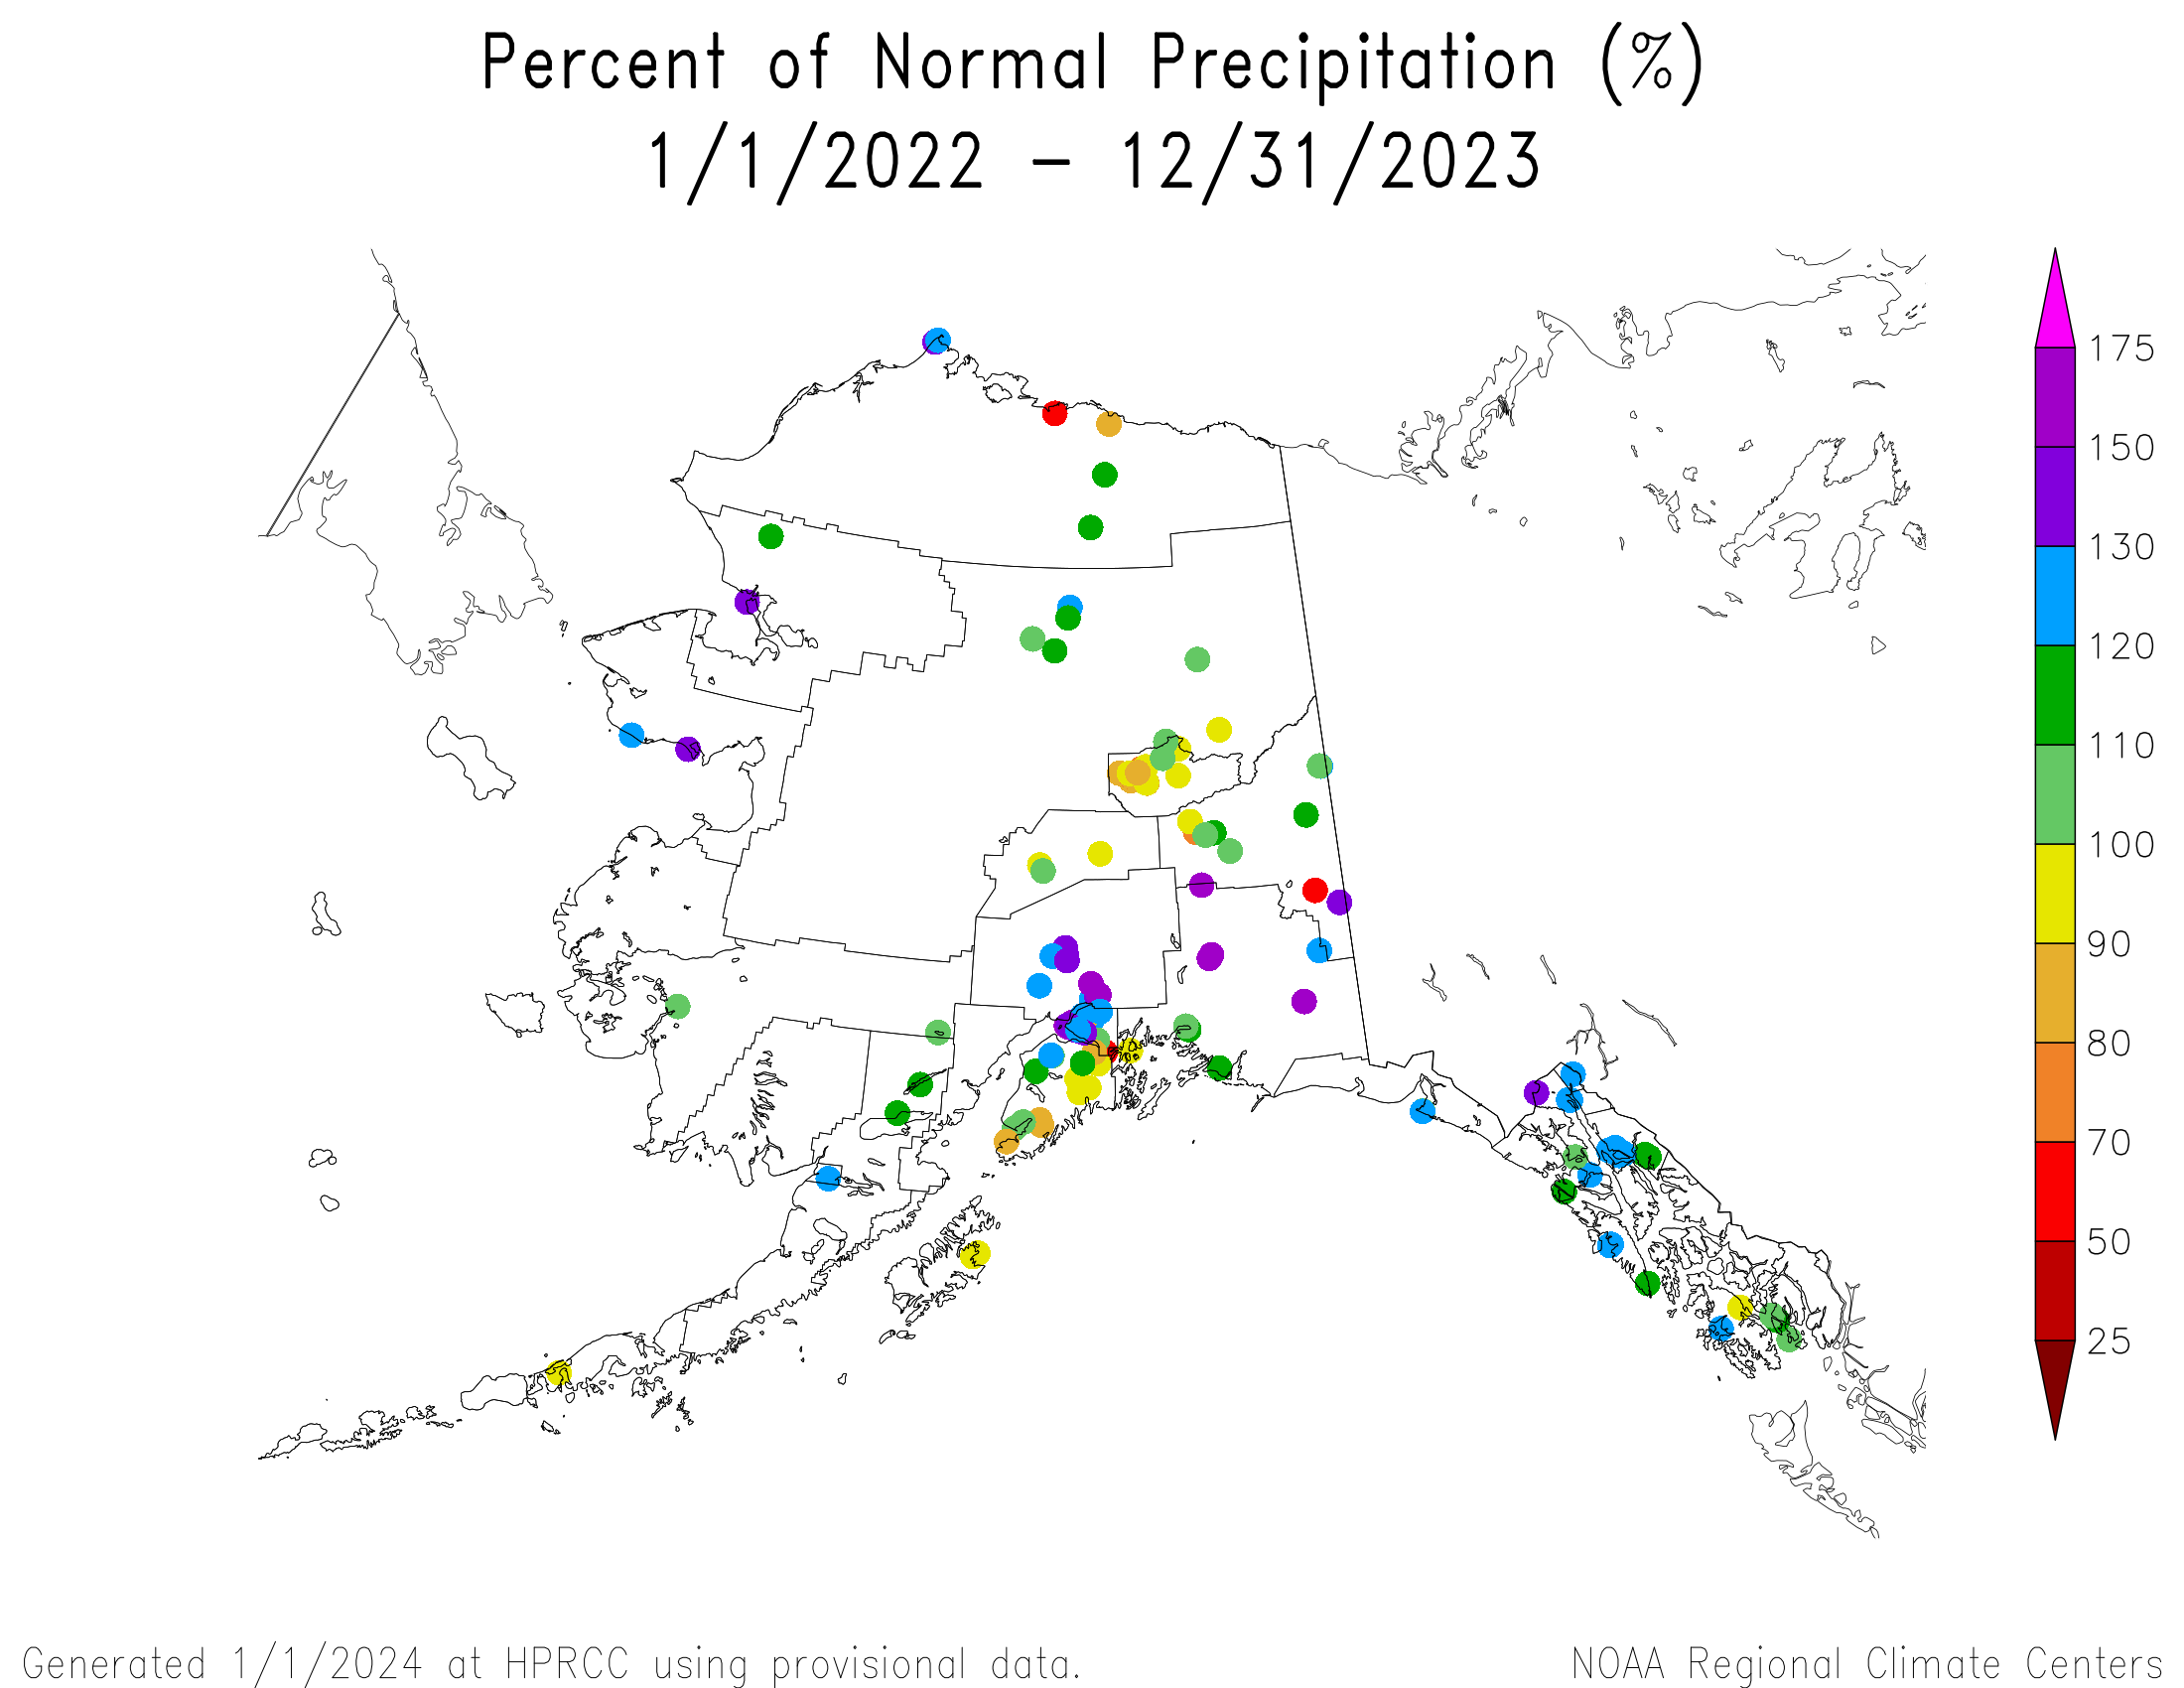
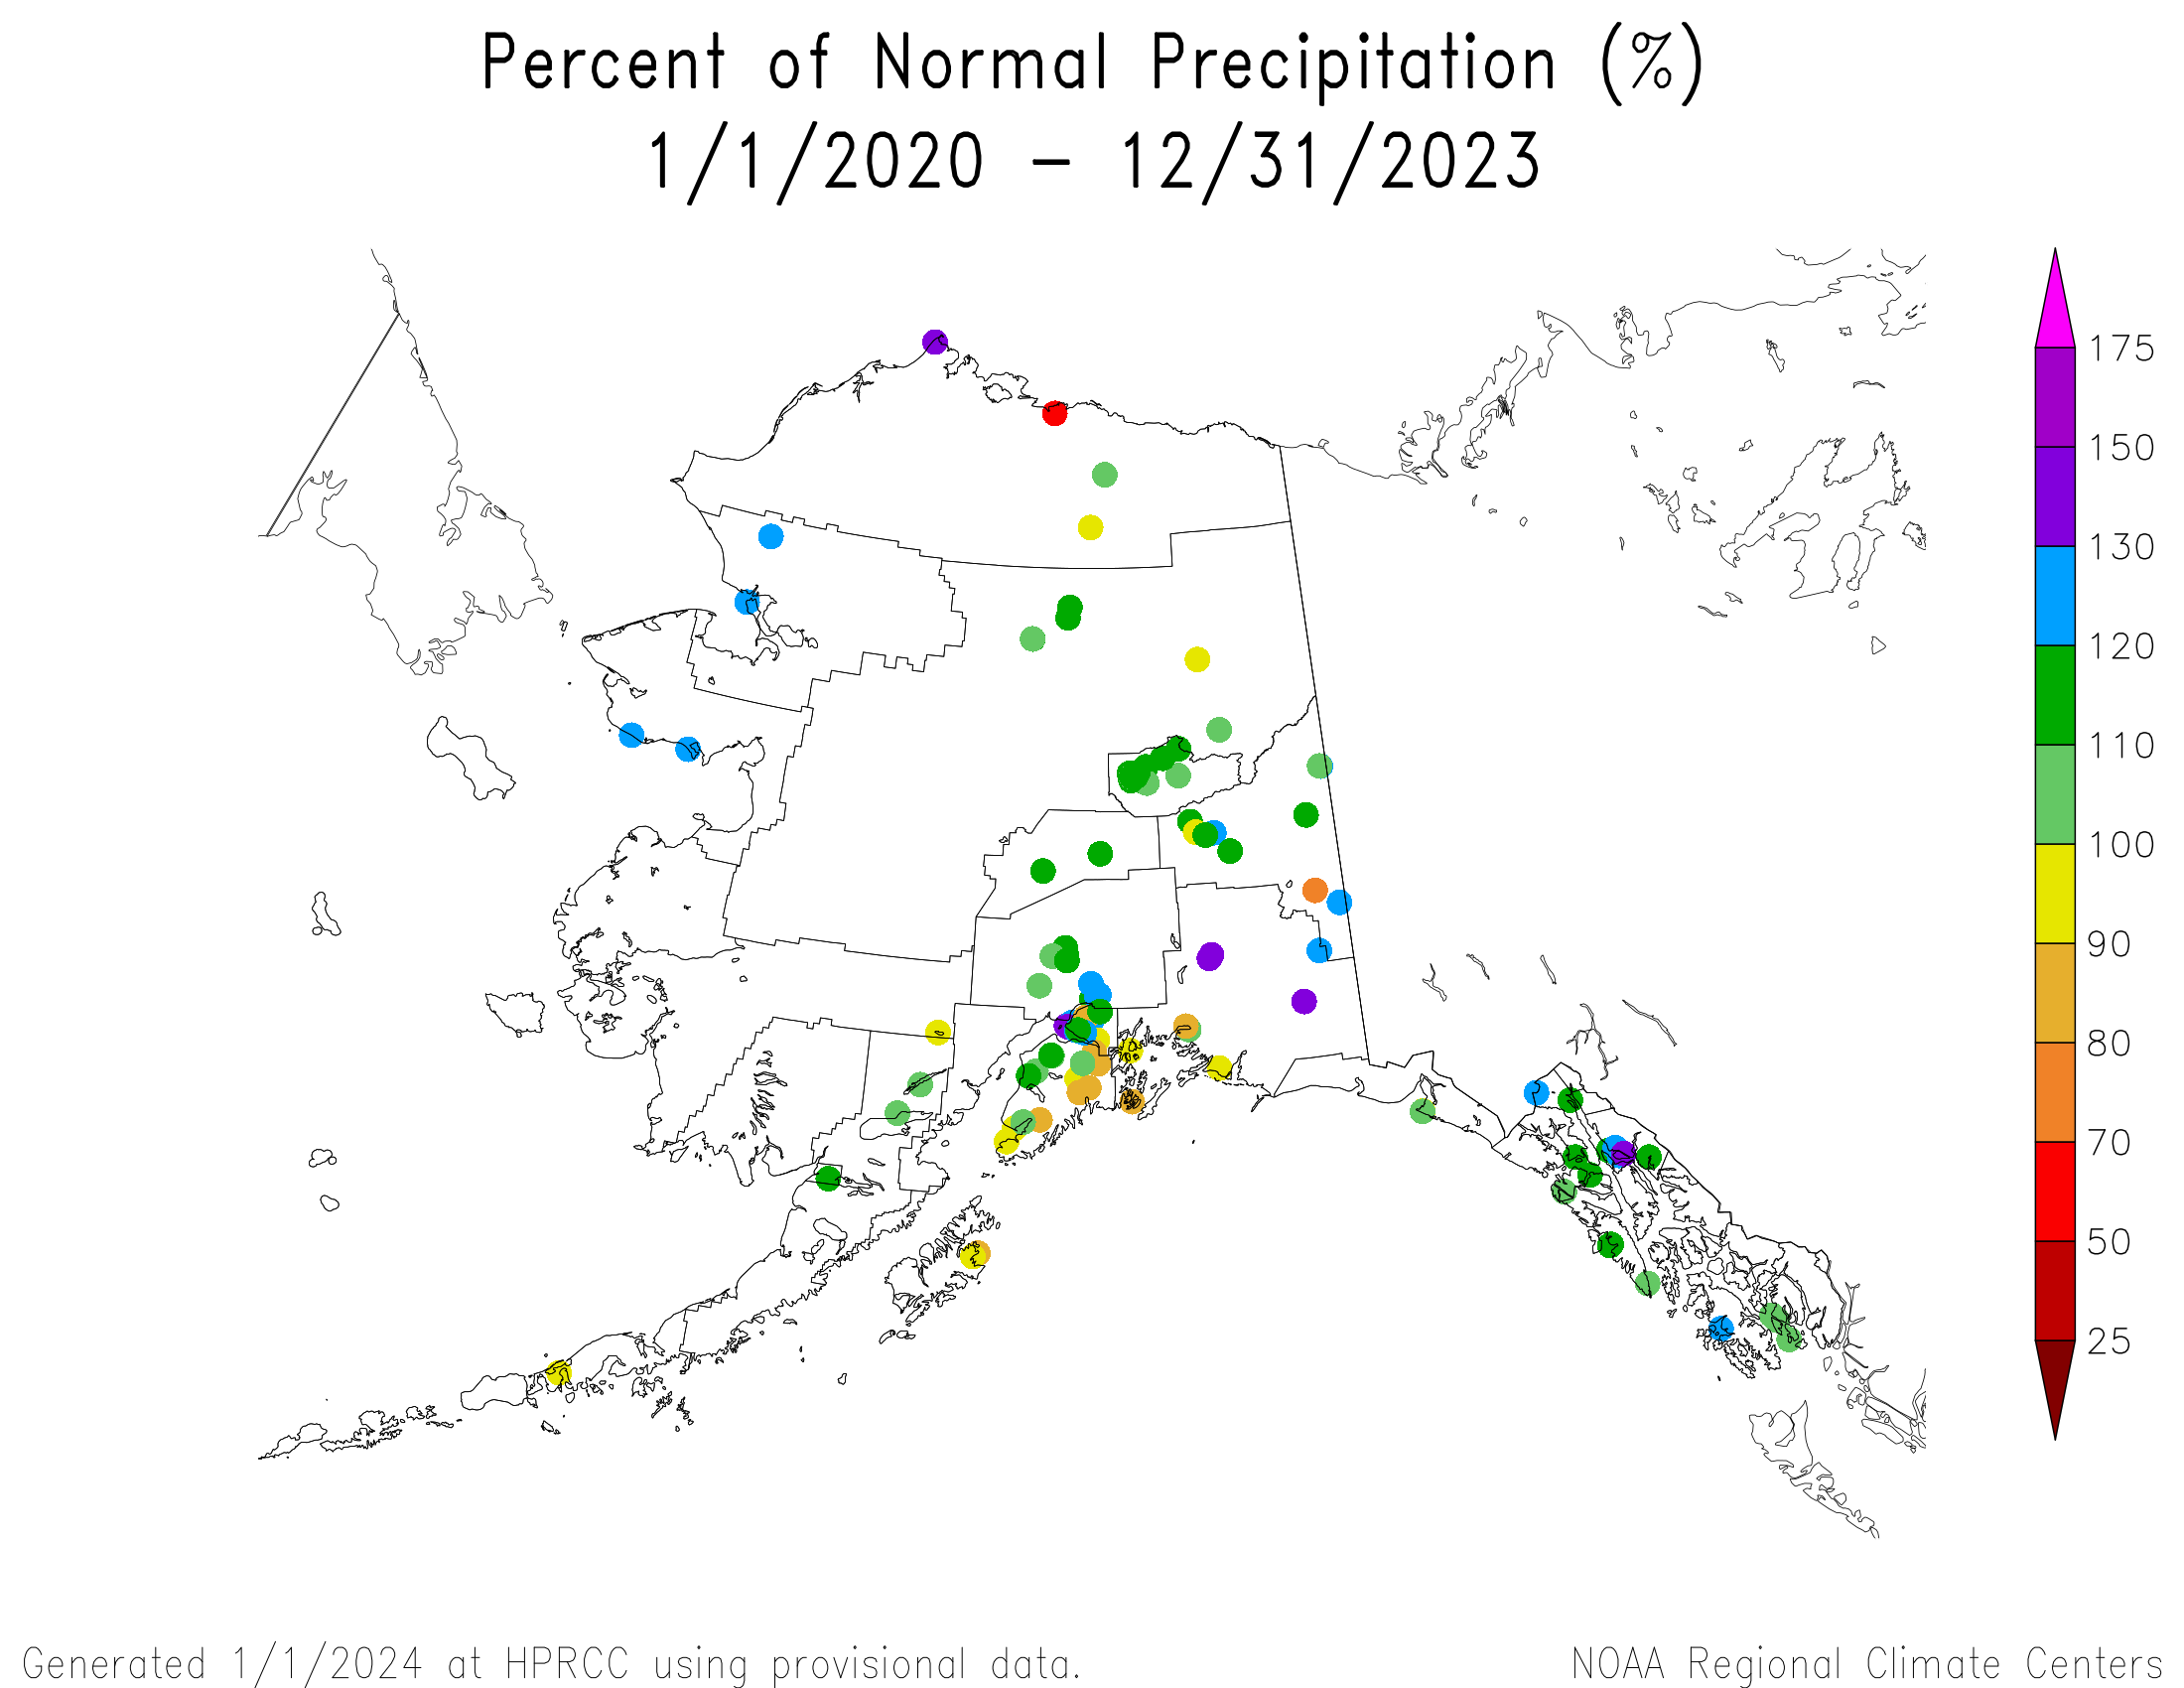
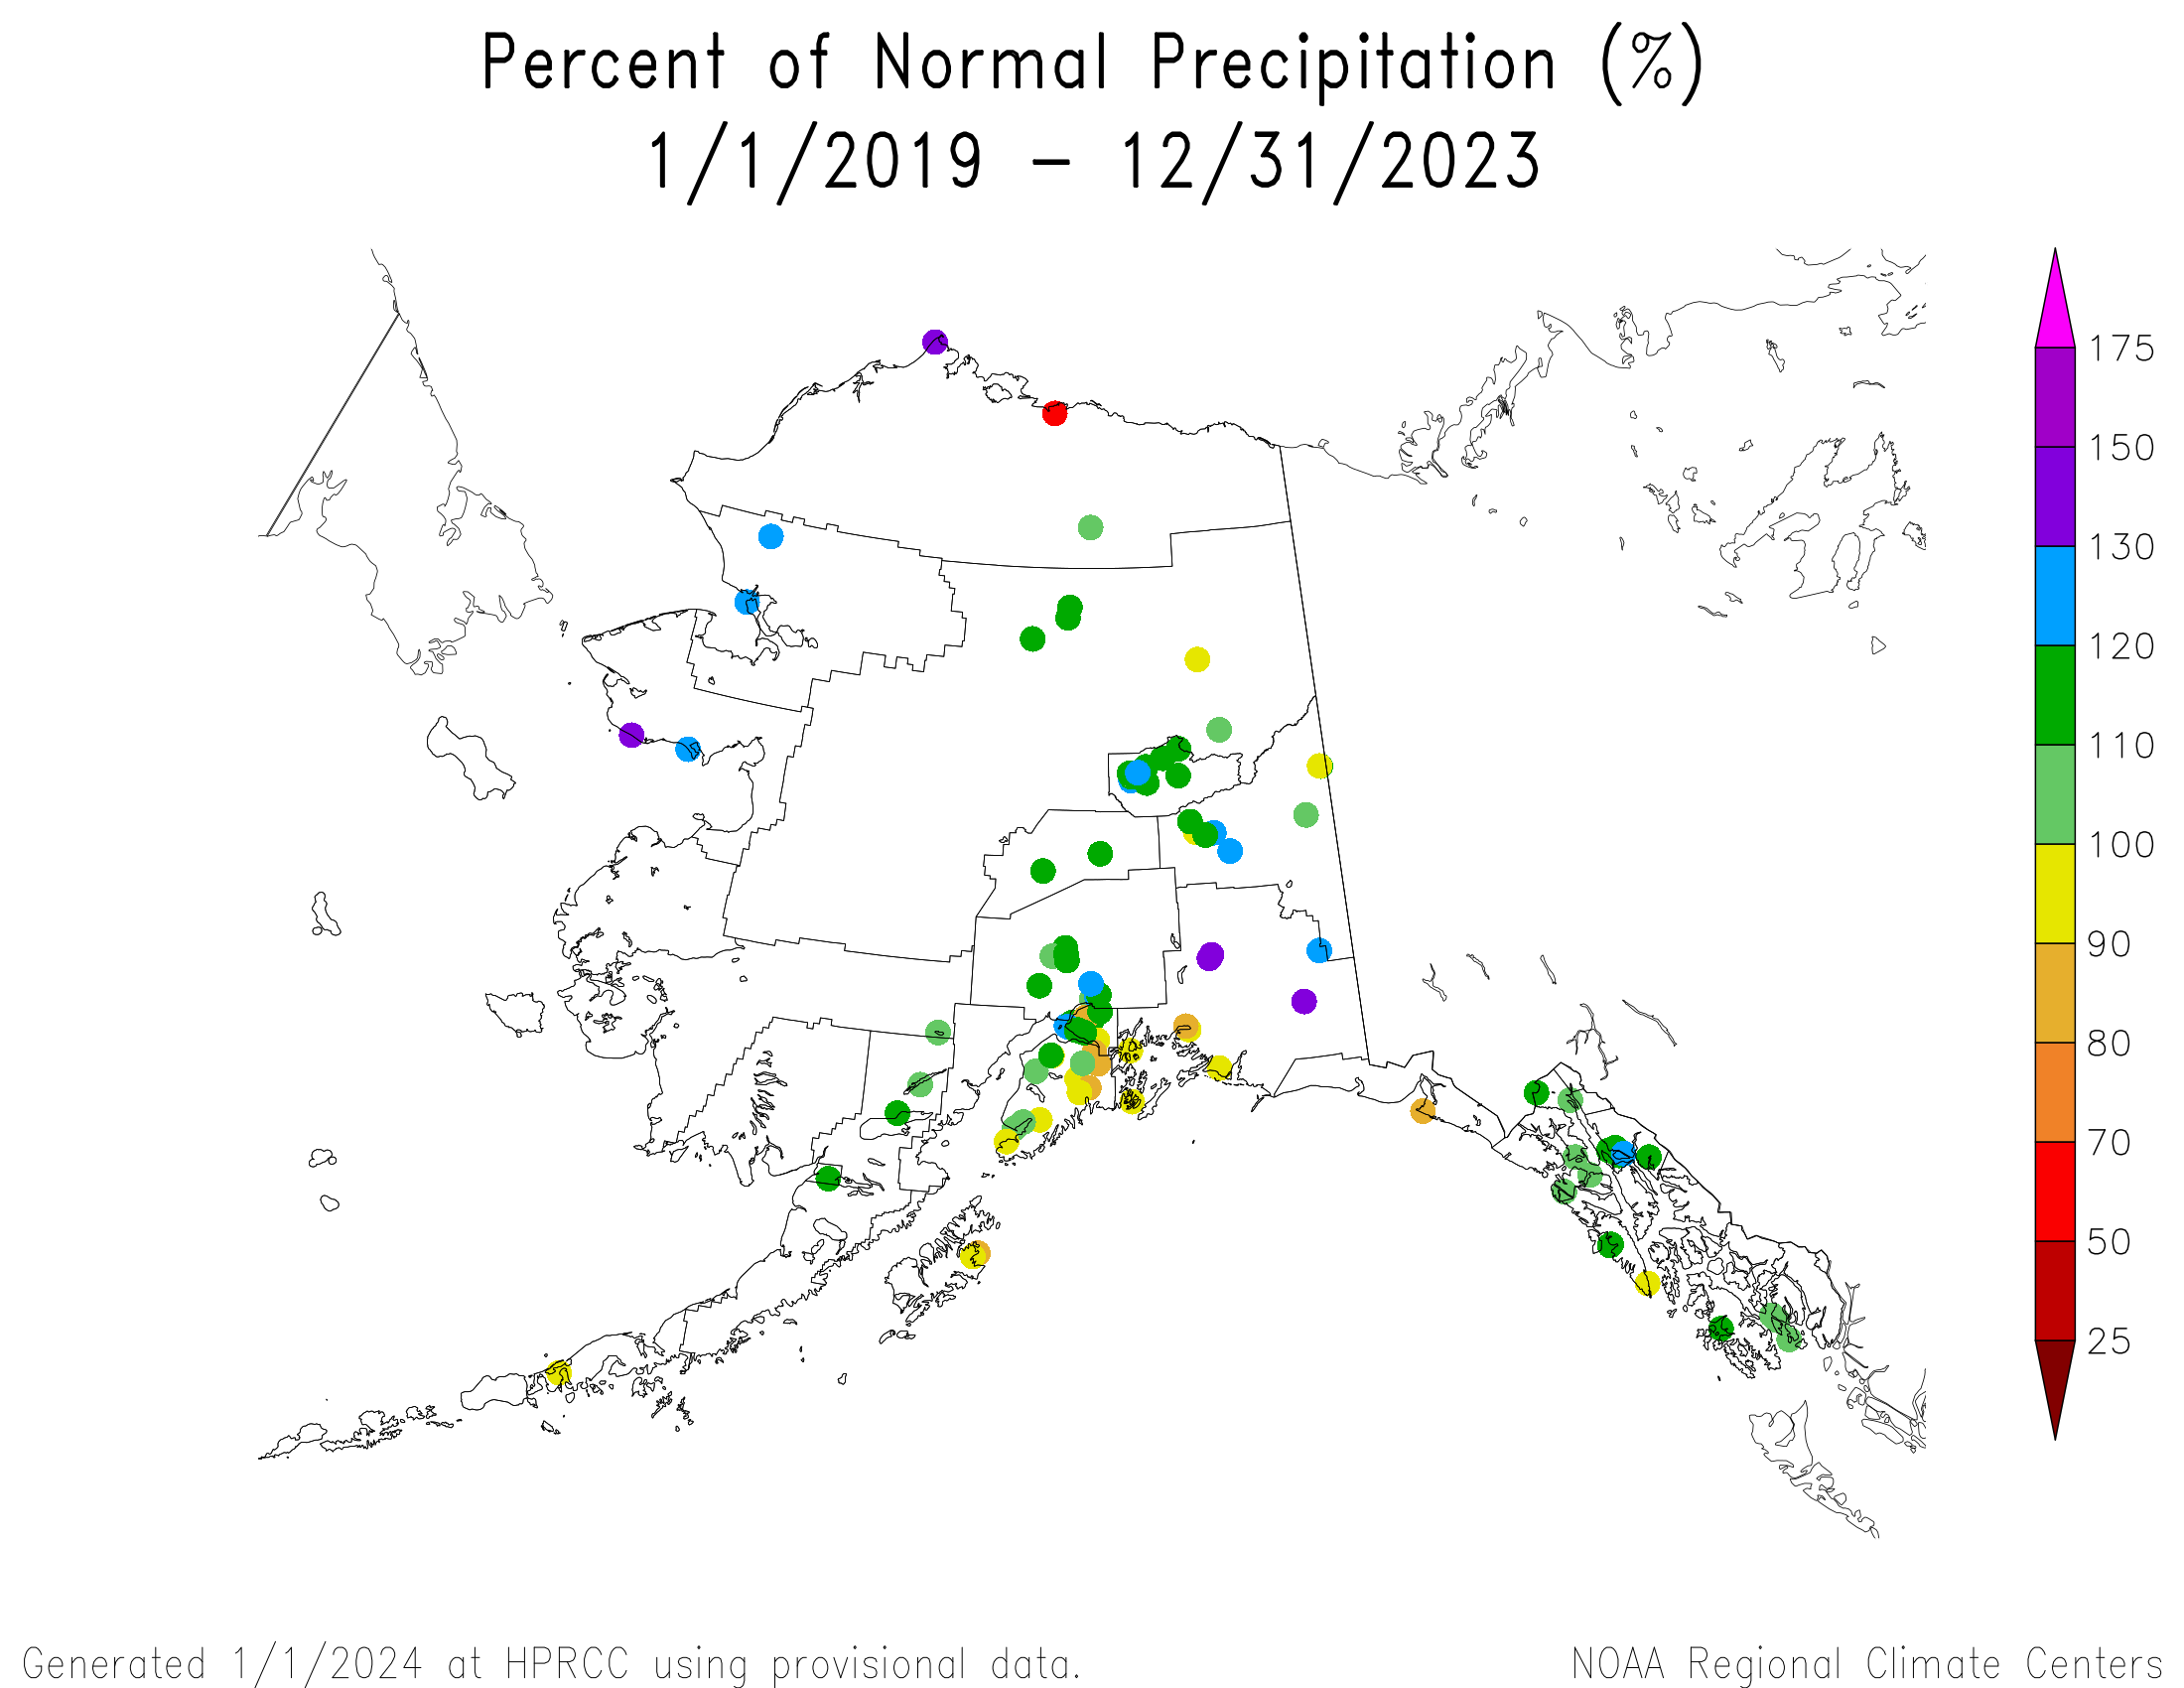
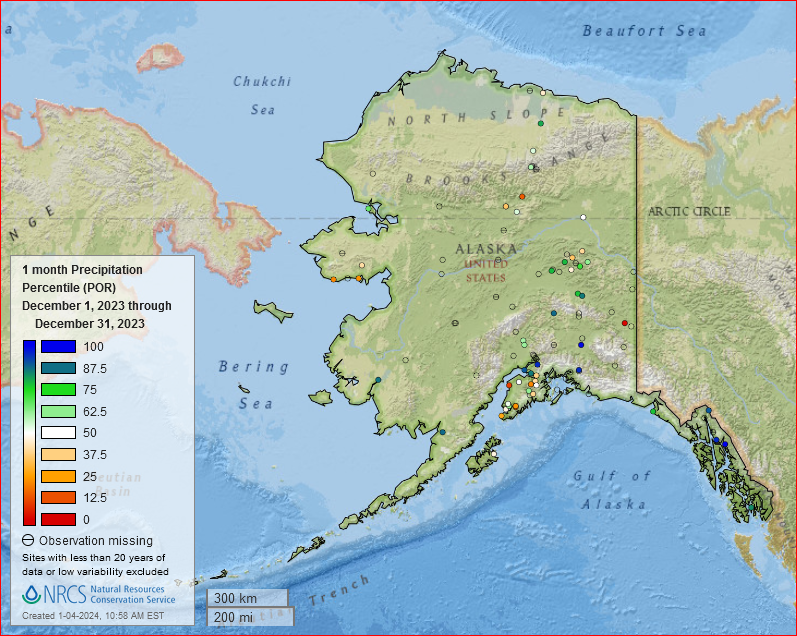
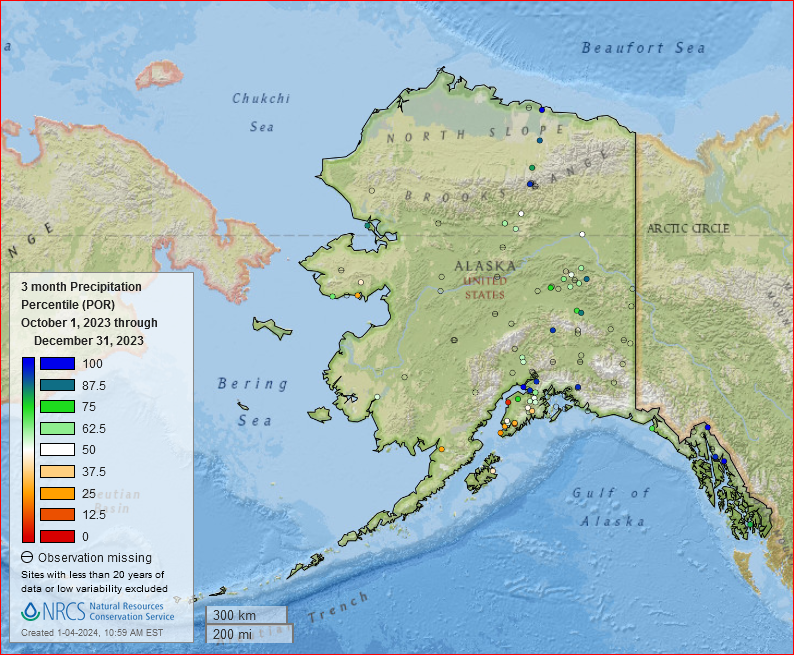
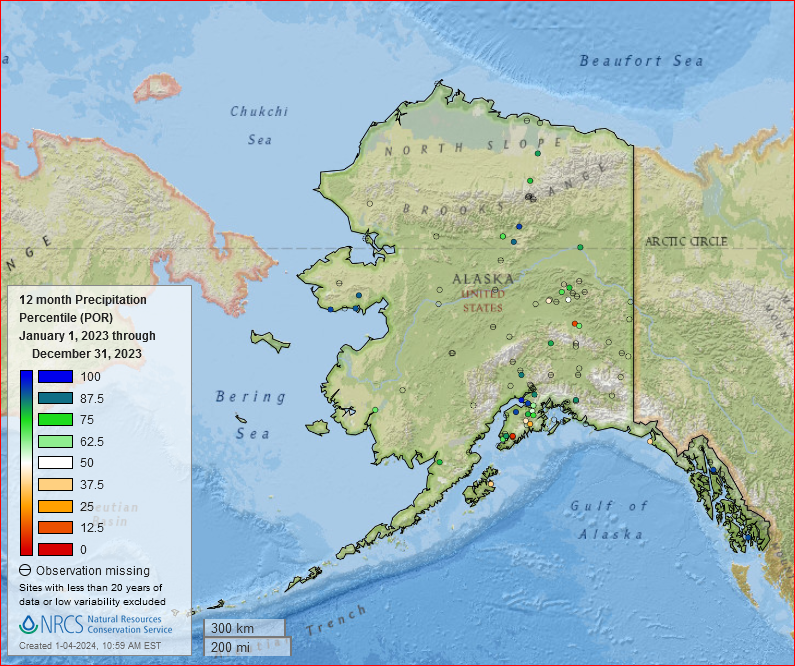
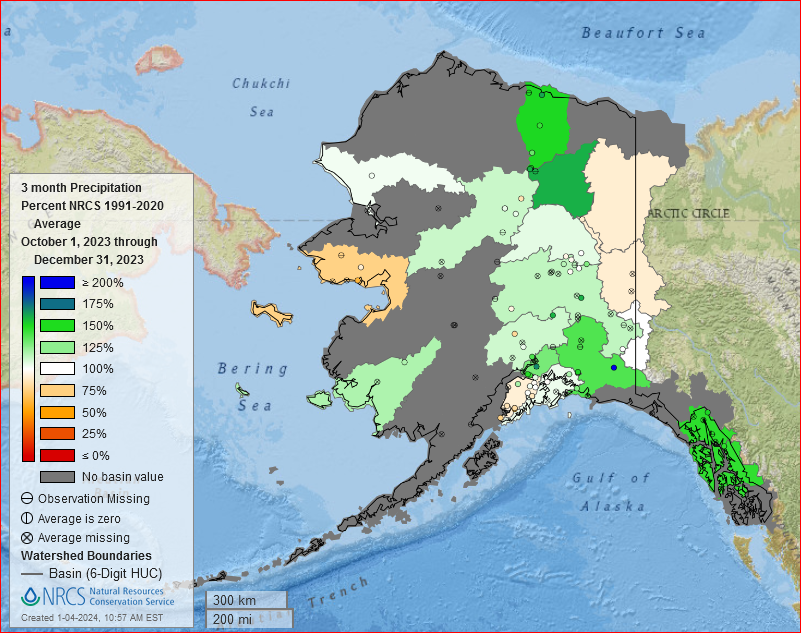
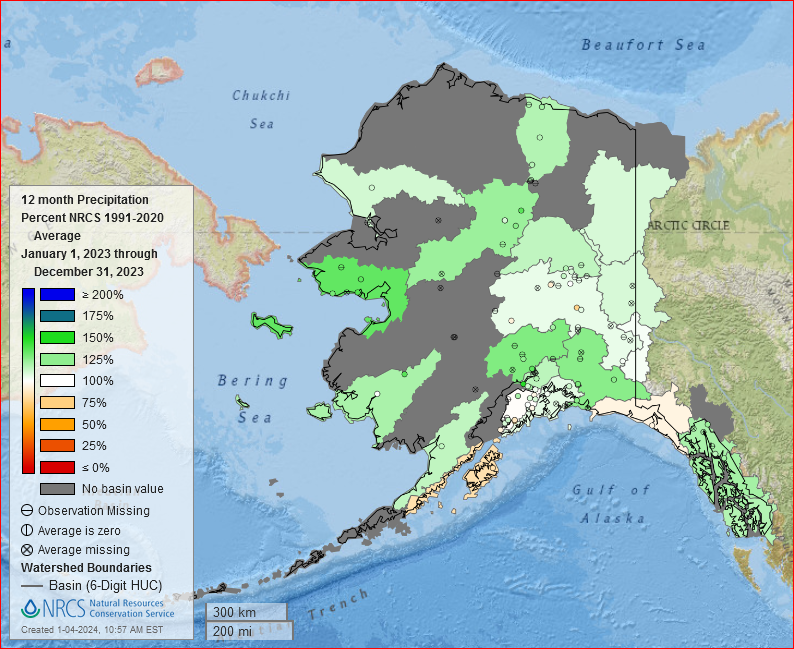
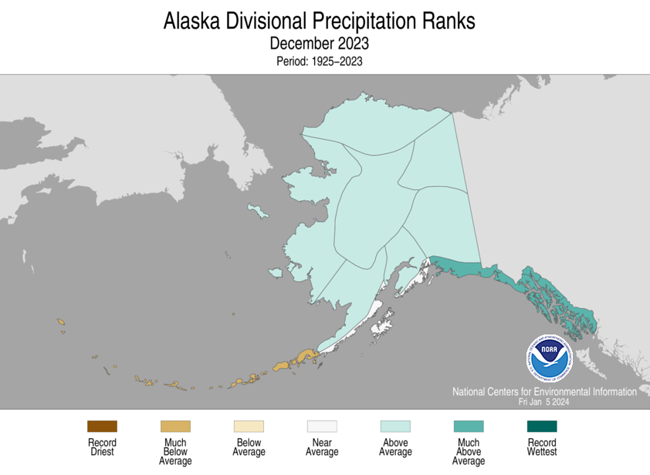
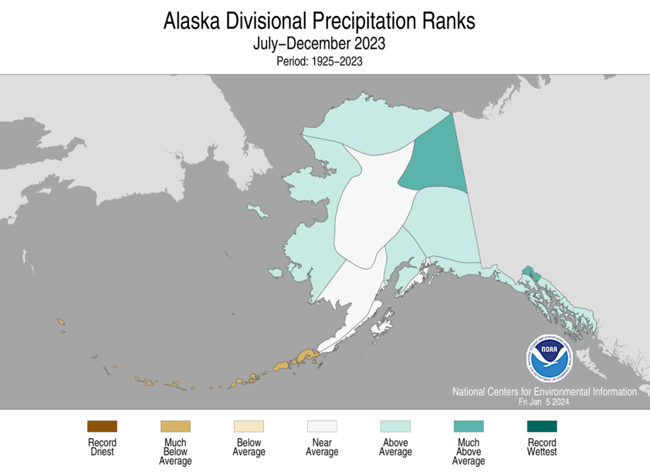
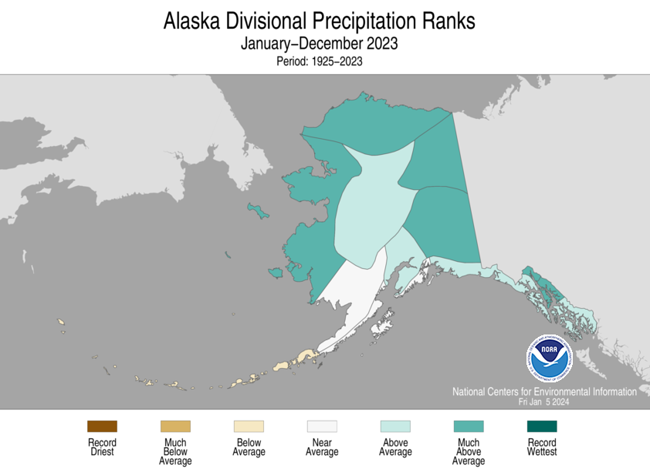
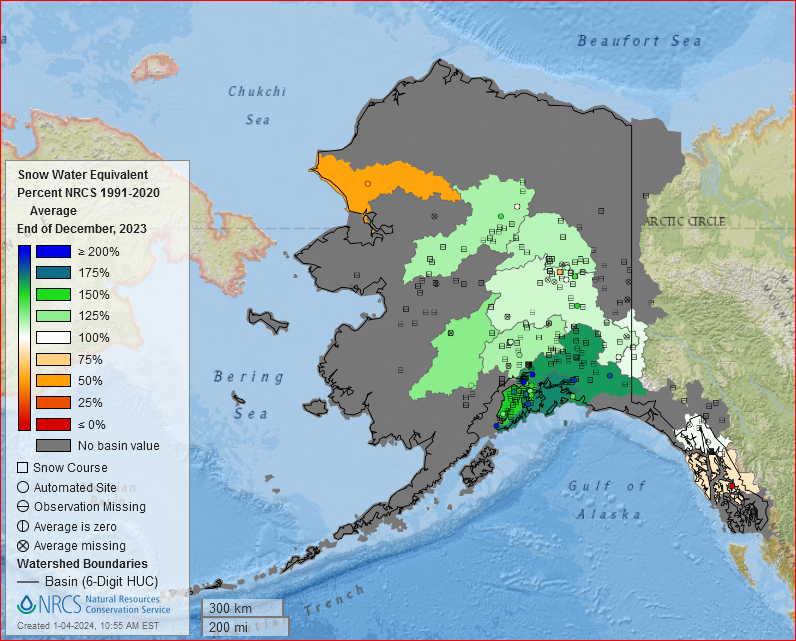
December and November-December 2023 had a mixed precipitation anomaly pattern, with drier-than-normal conditions in some river basins in the west, north, and east, and wetter-than-normal conditions in basins in the south and central regions. When averaged across climate divisions, December ended up wetter than normal, except in the Aleutians where it was drier than normal. At the 3- to 9-month time scales, drier-than-normal conditions dominated in the southwest and wet conditions elsewhere except in the far eastern basins. At longer time scales, drier-than-normal conditions were more common in the south coastal to Aleutian regions with wetter-than-normal conditions elsewhere, except in the interior where some dryness was evident at 12-24 months (low elevation station precipitation anomaly maps for the last 1, 2, 3, 4, 6, 9, 12, 24, 36, 48, 60 months) (high elevation SNOTEL station precipitation percentile maps for the last 1, 3, and 12 months) (SNOTEL basin and station percent of normal precipitation maps for the last 1, 3, and 12 months) (climate division precipitation rank maps for the last 1, 3, 6, and 12 months) (Leaky Bucket model precipitation percentile map).
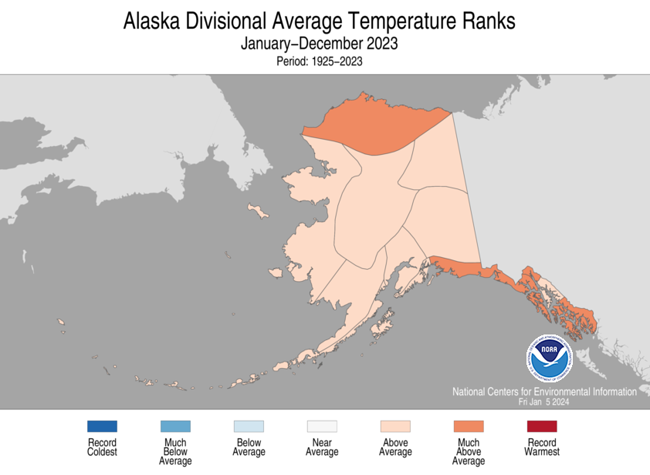
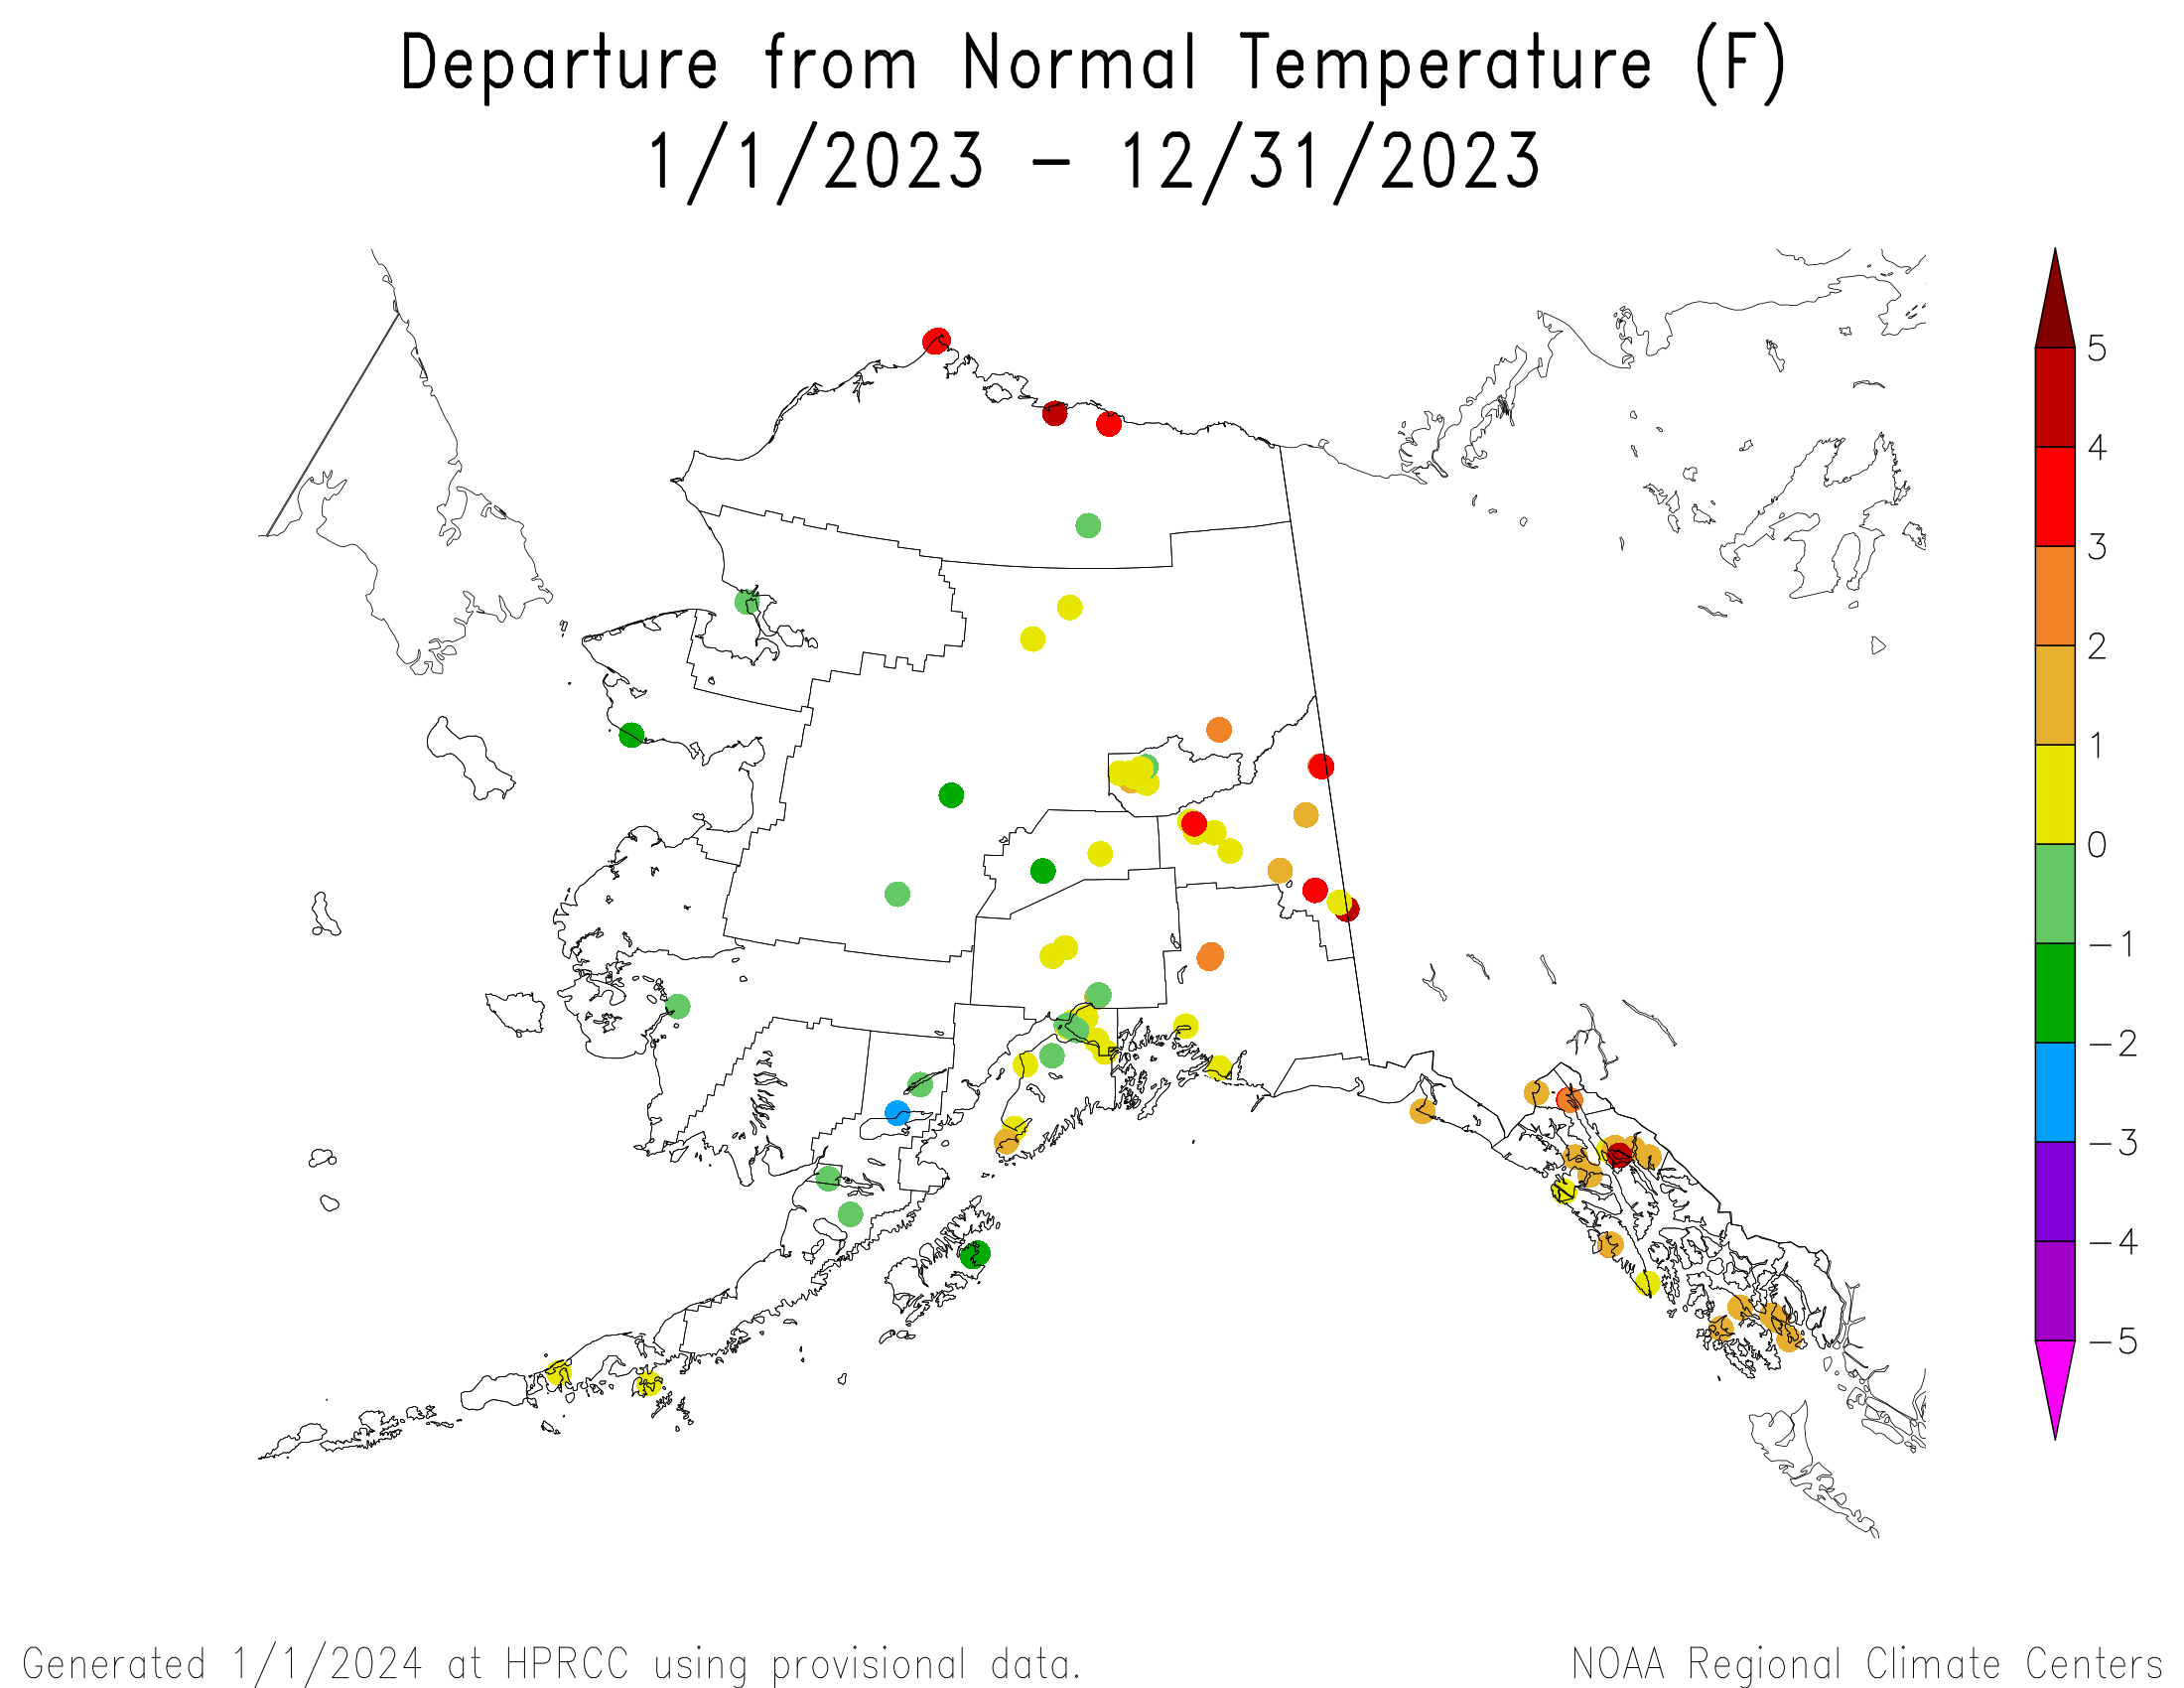
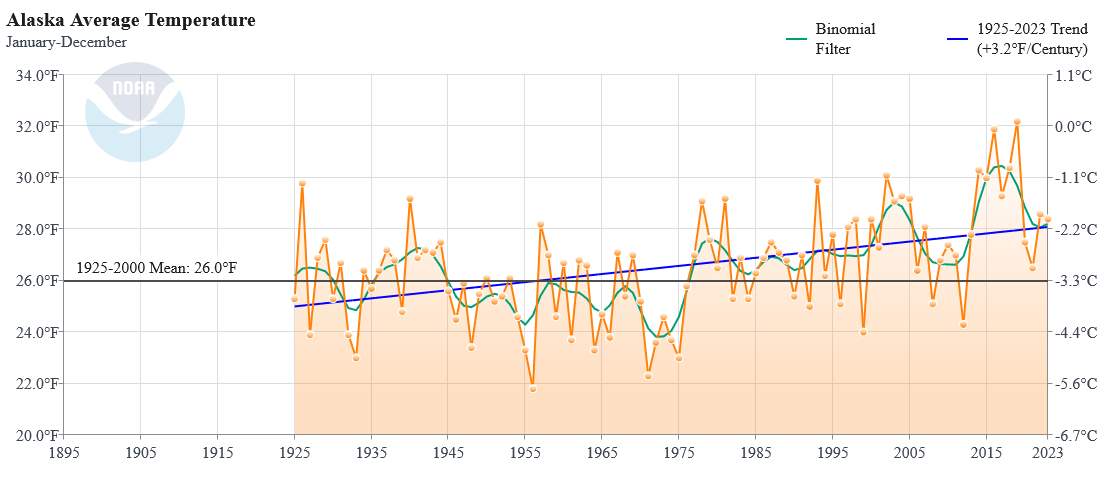
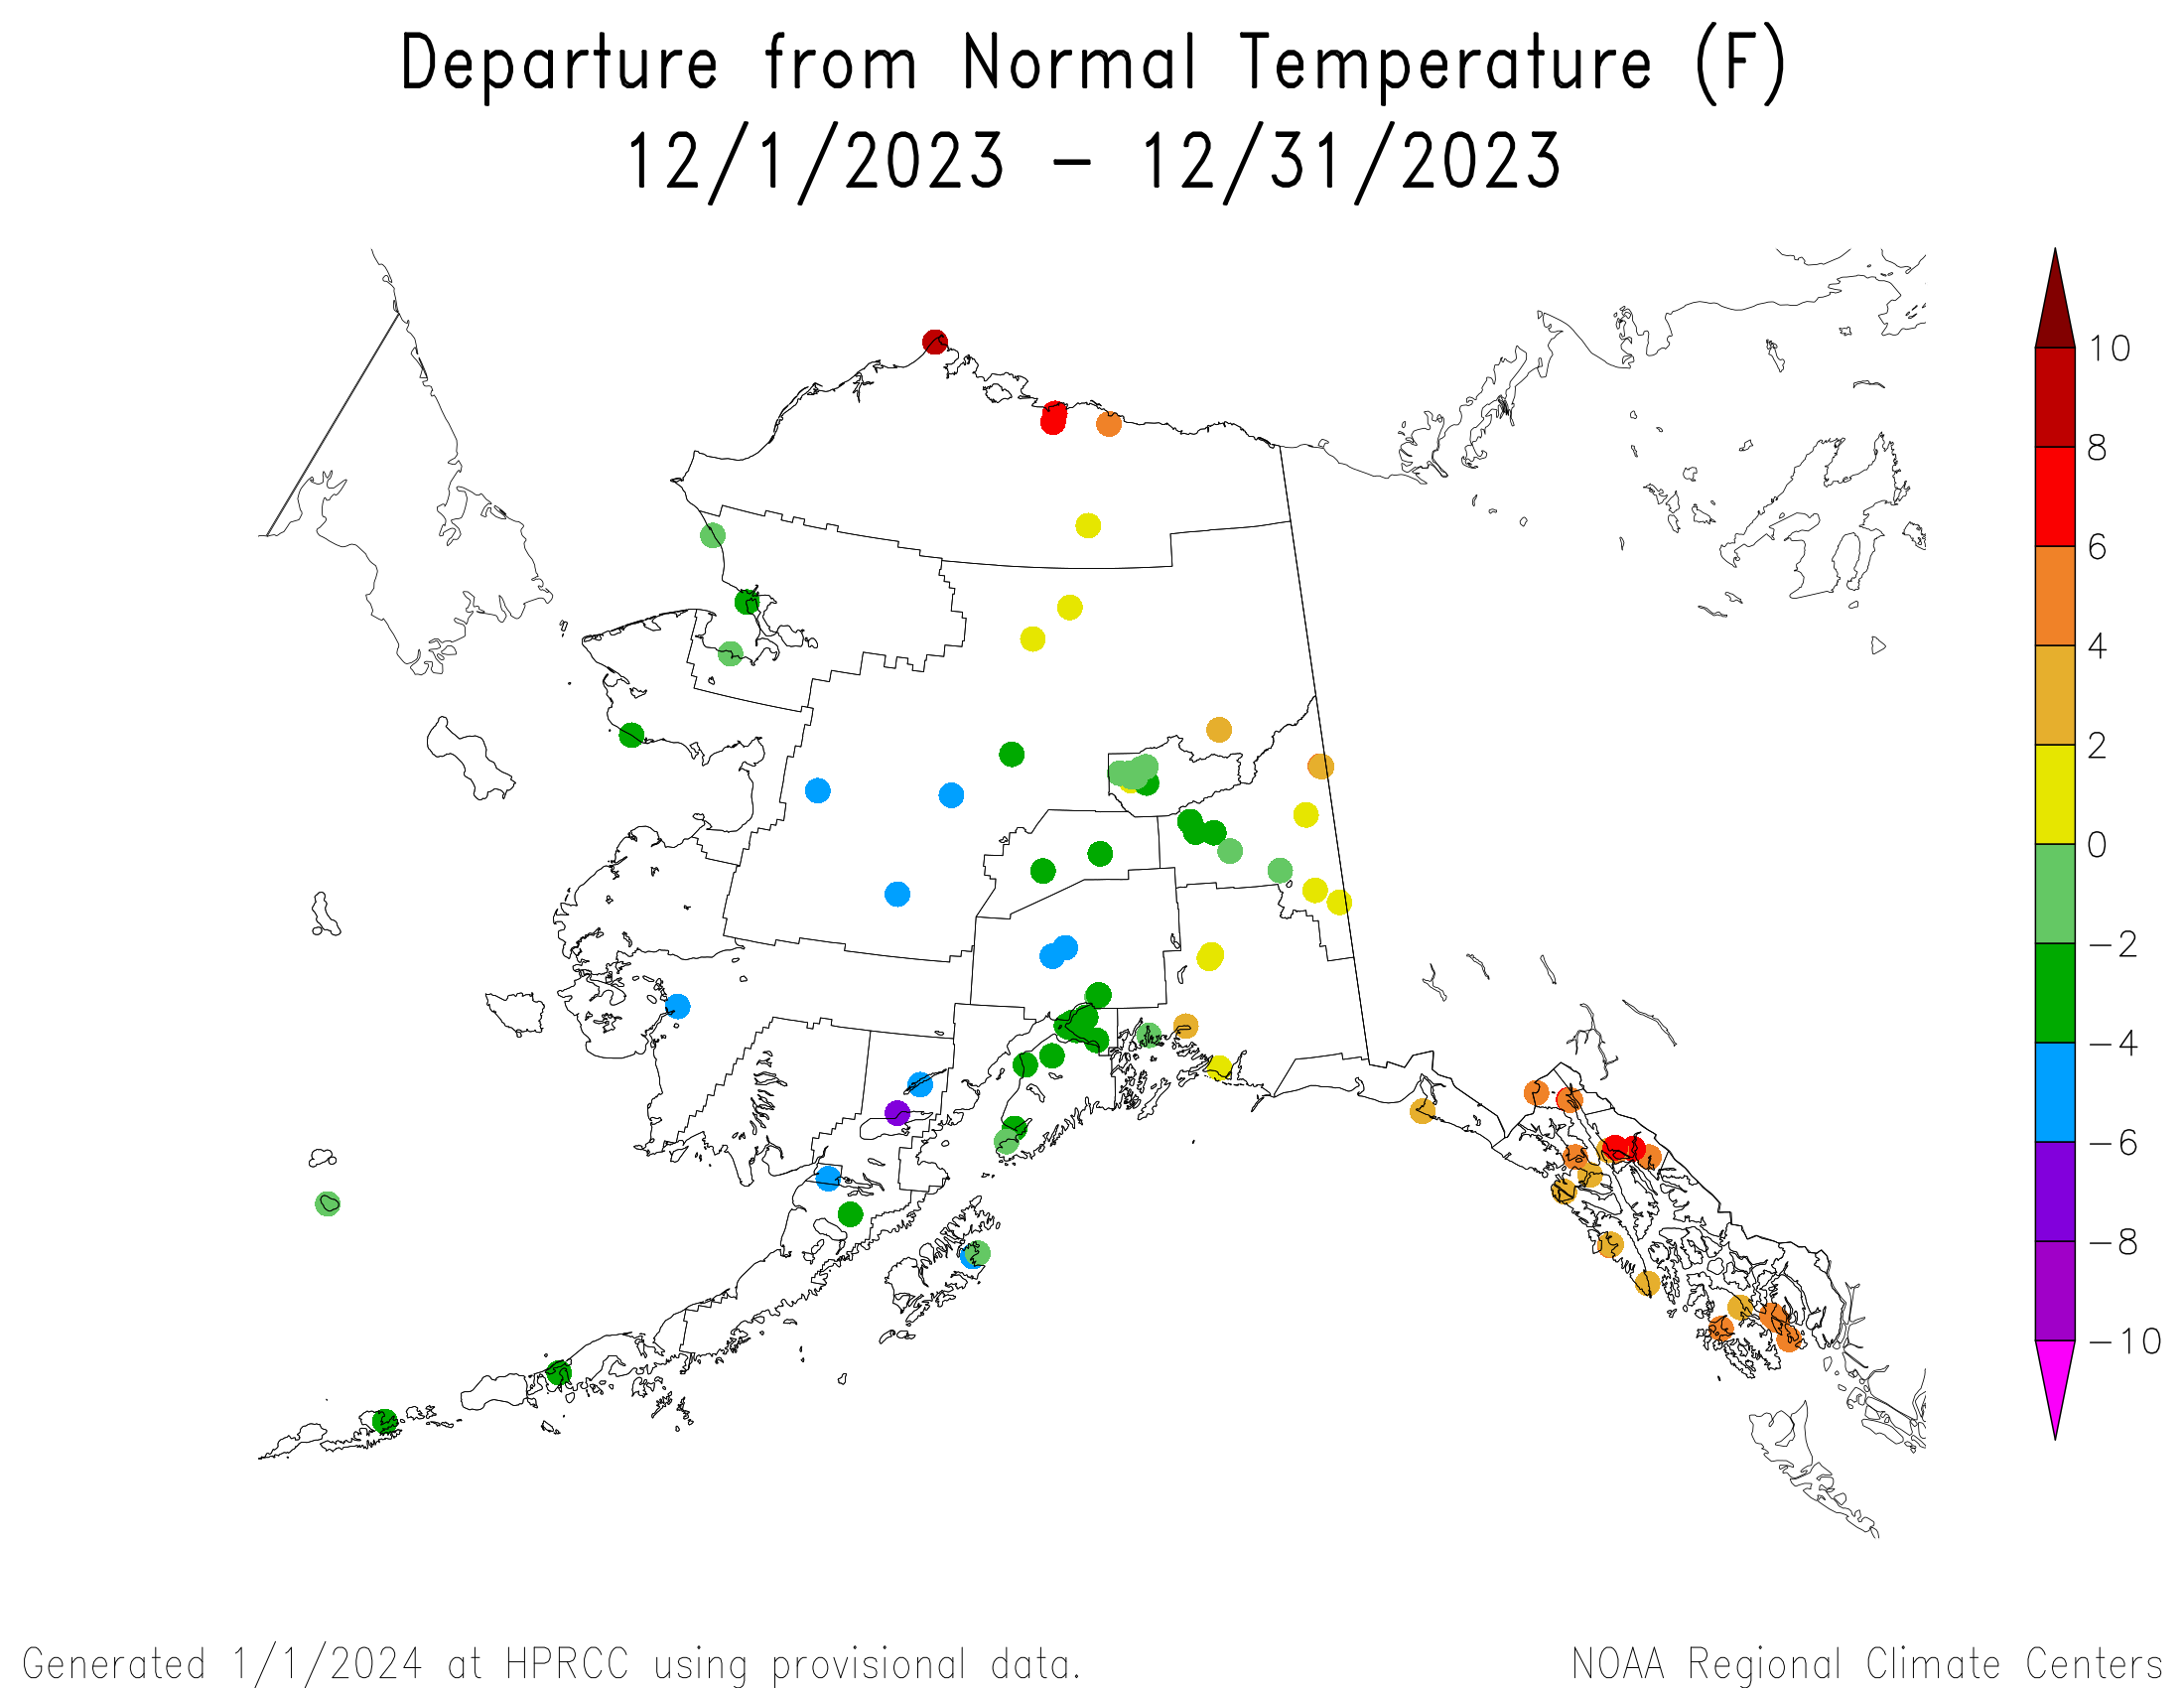
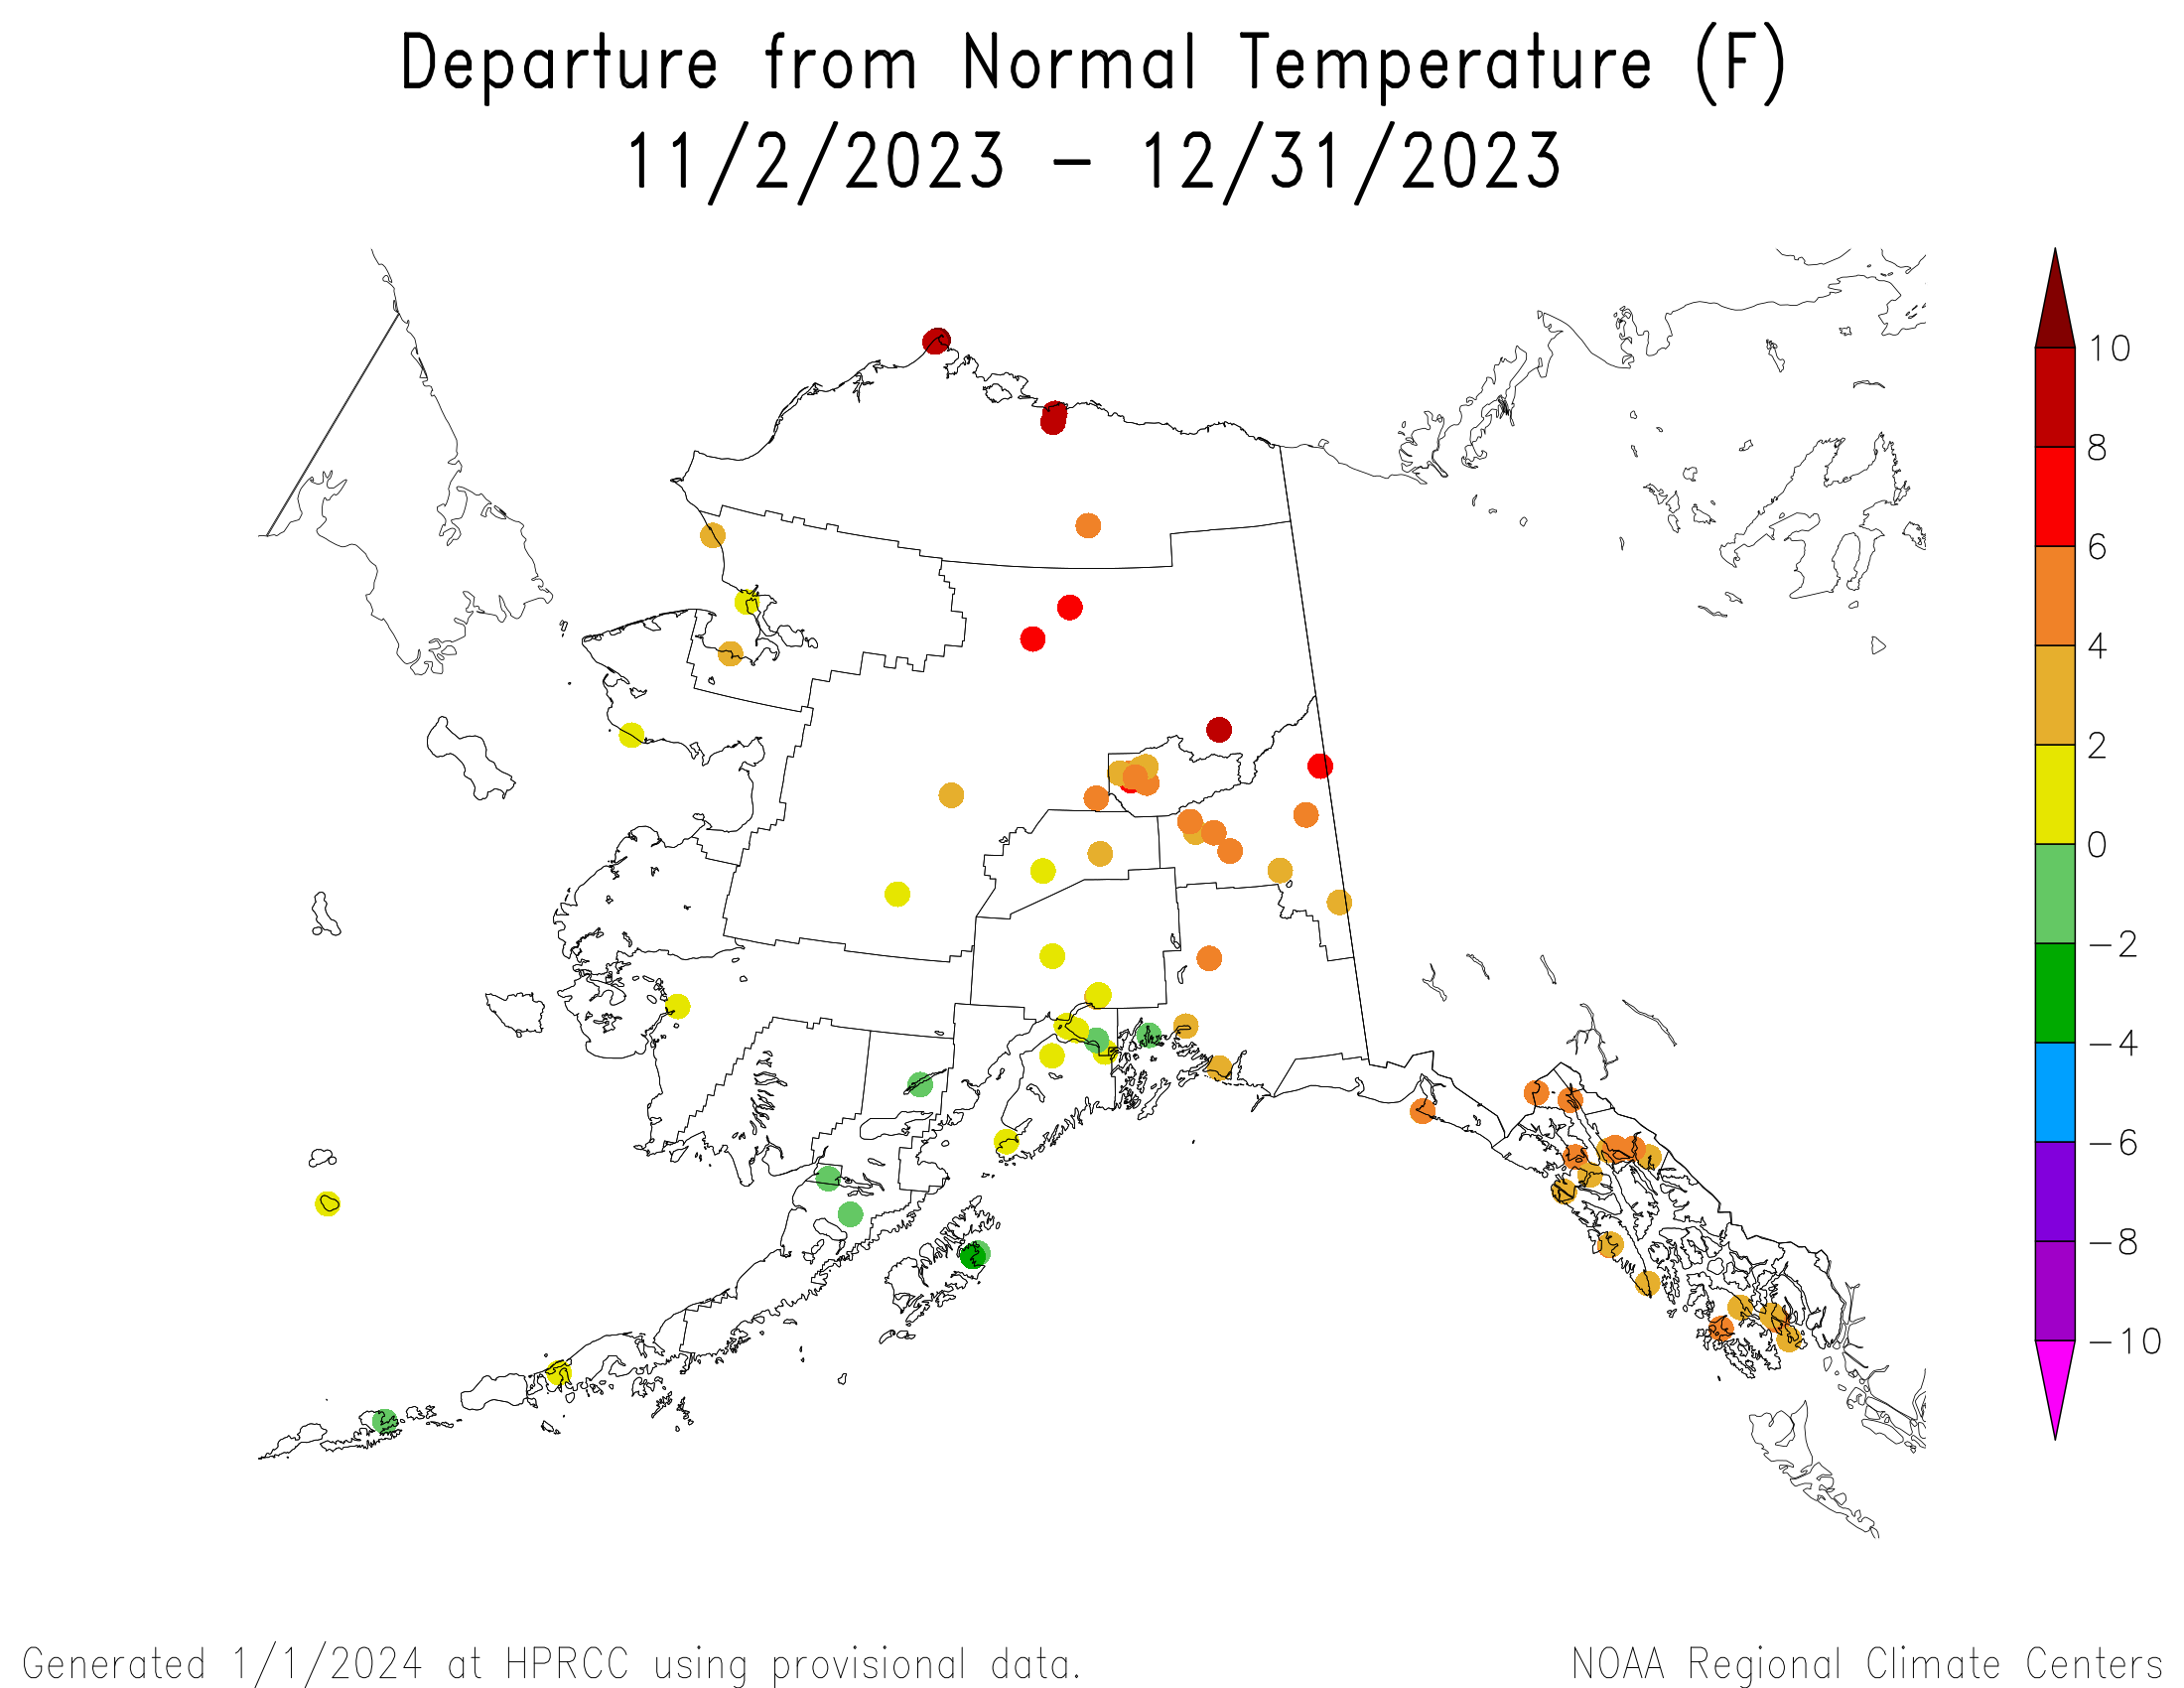
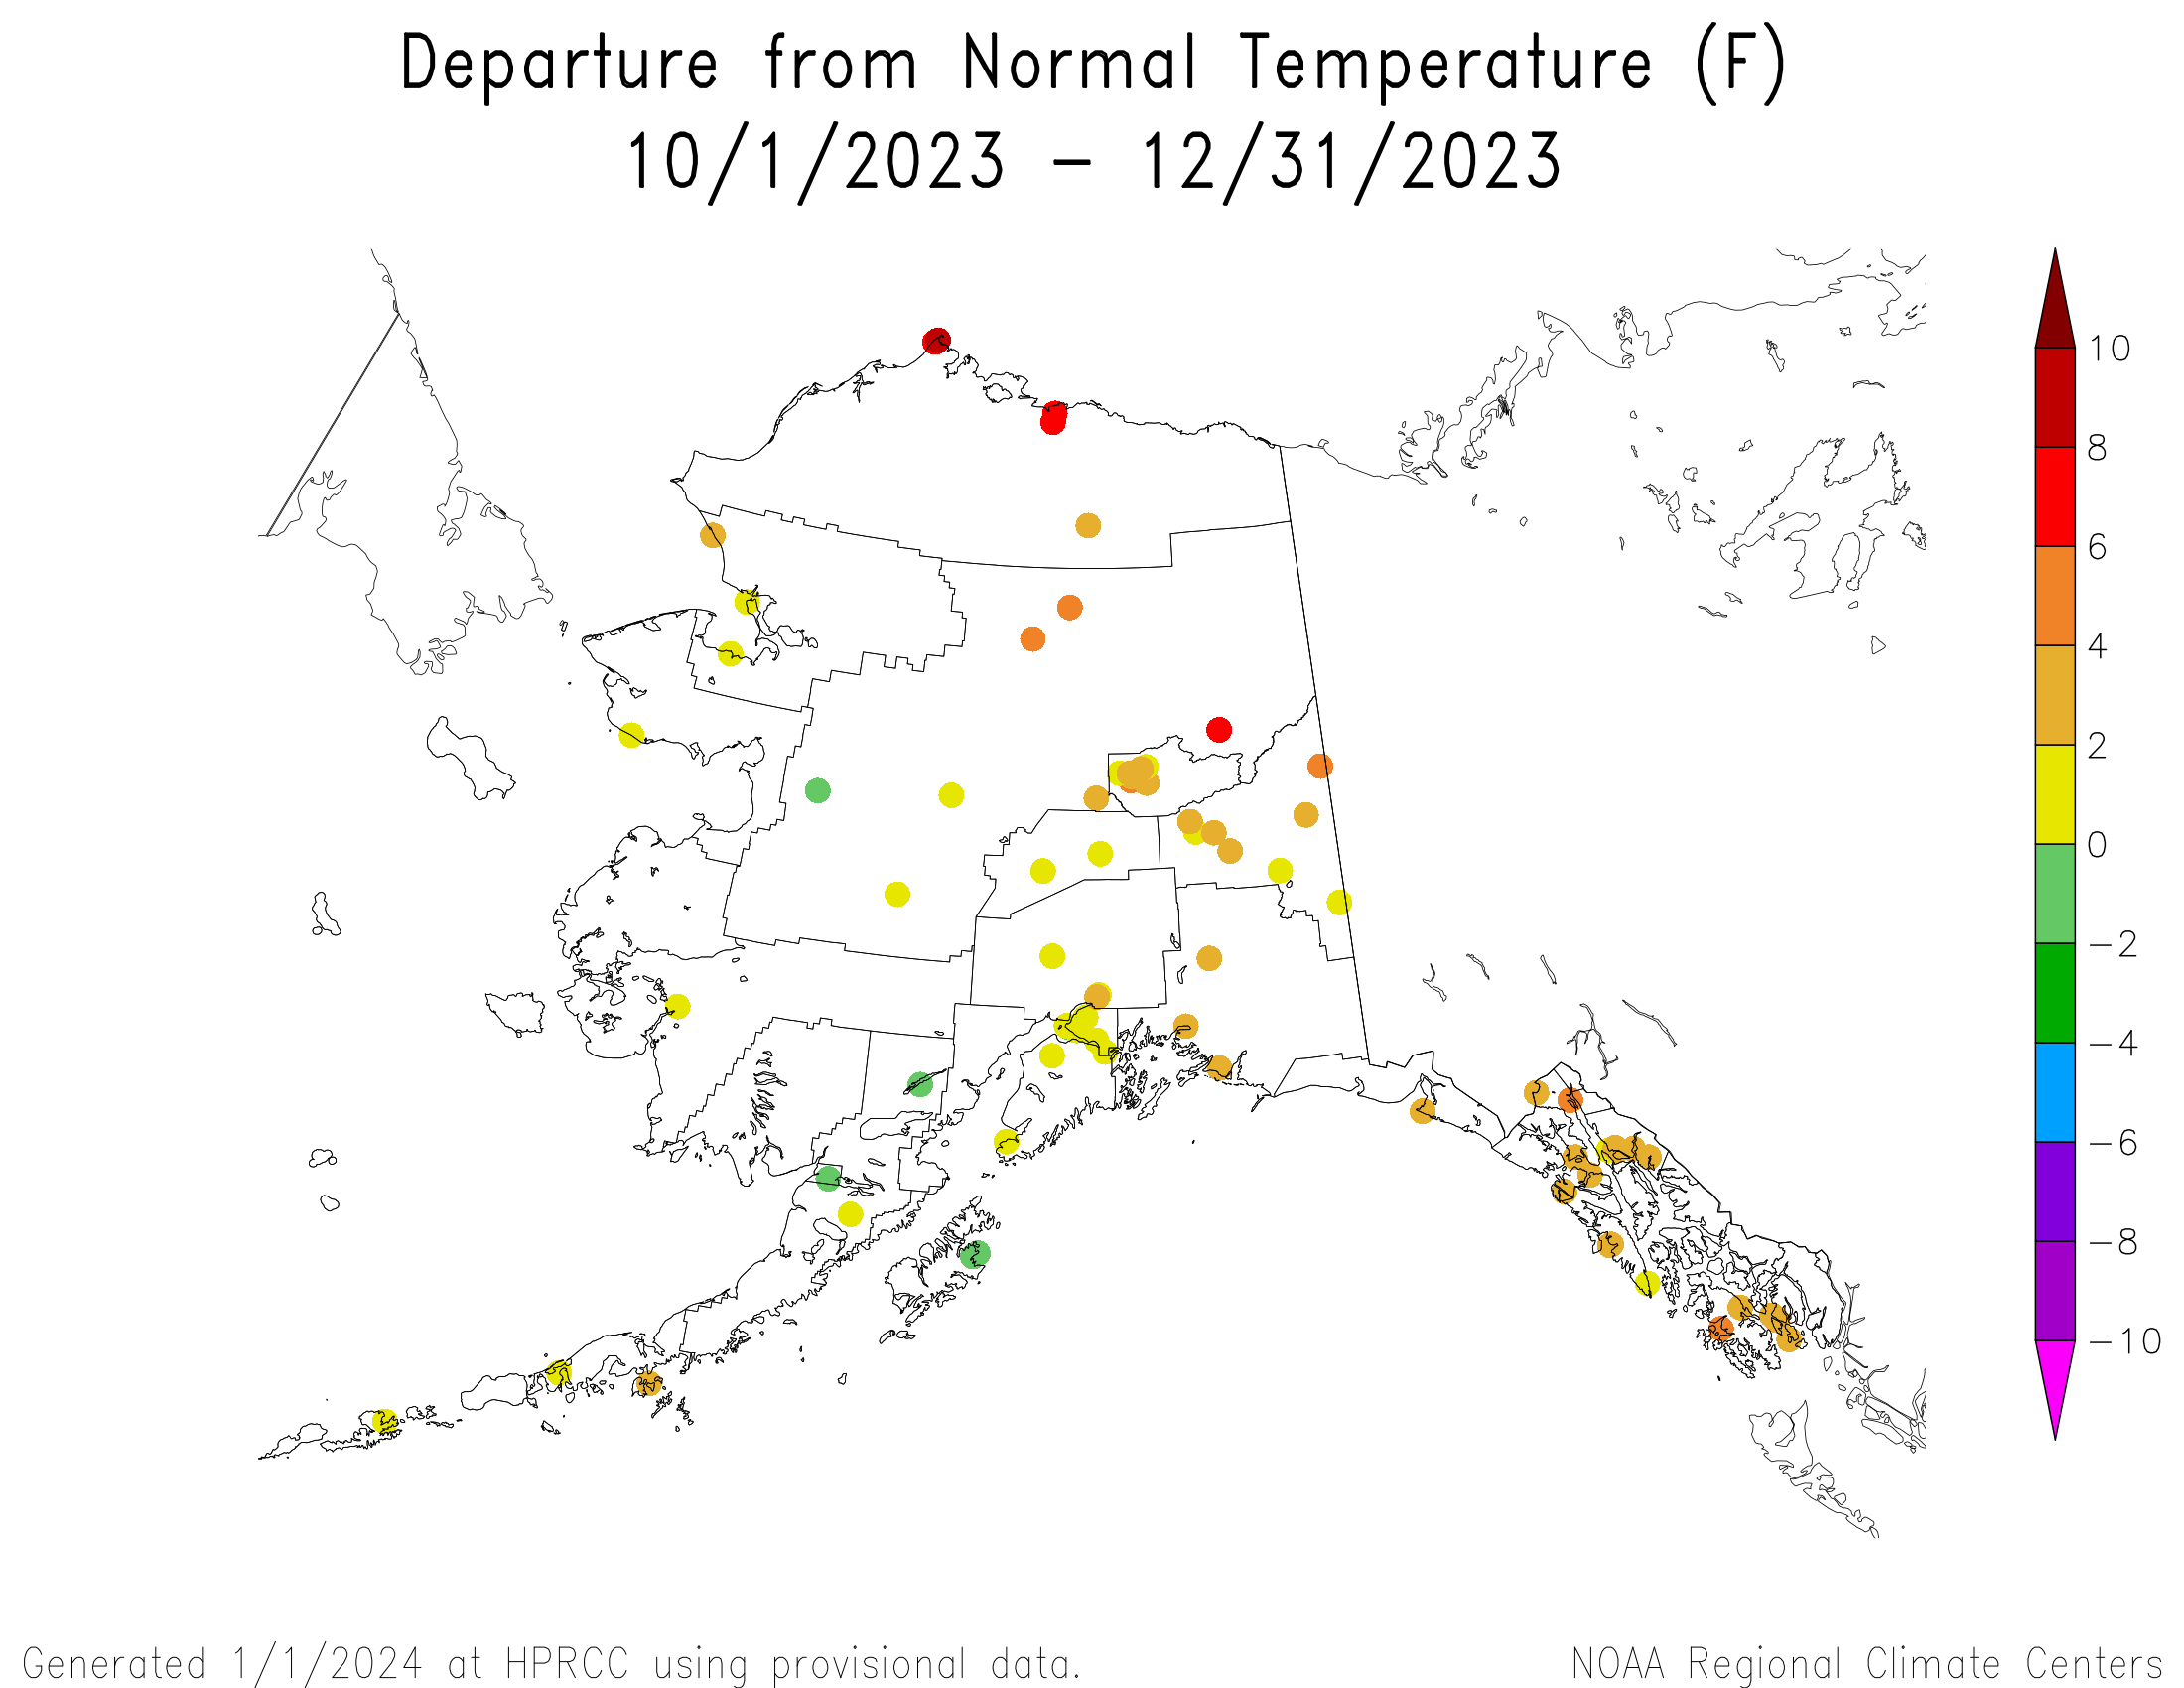
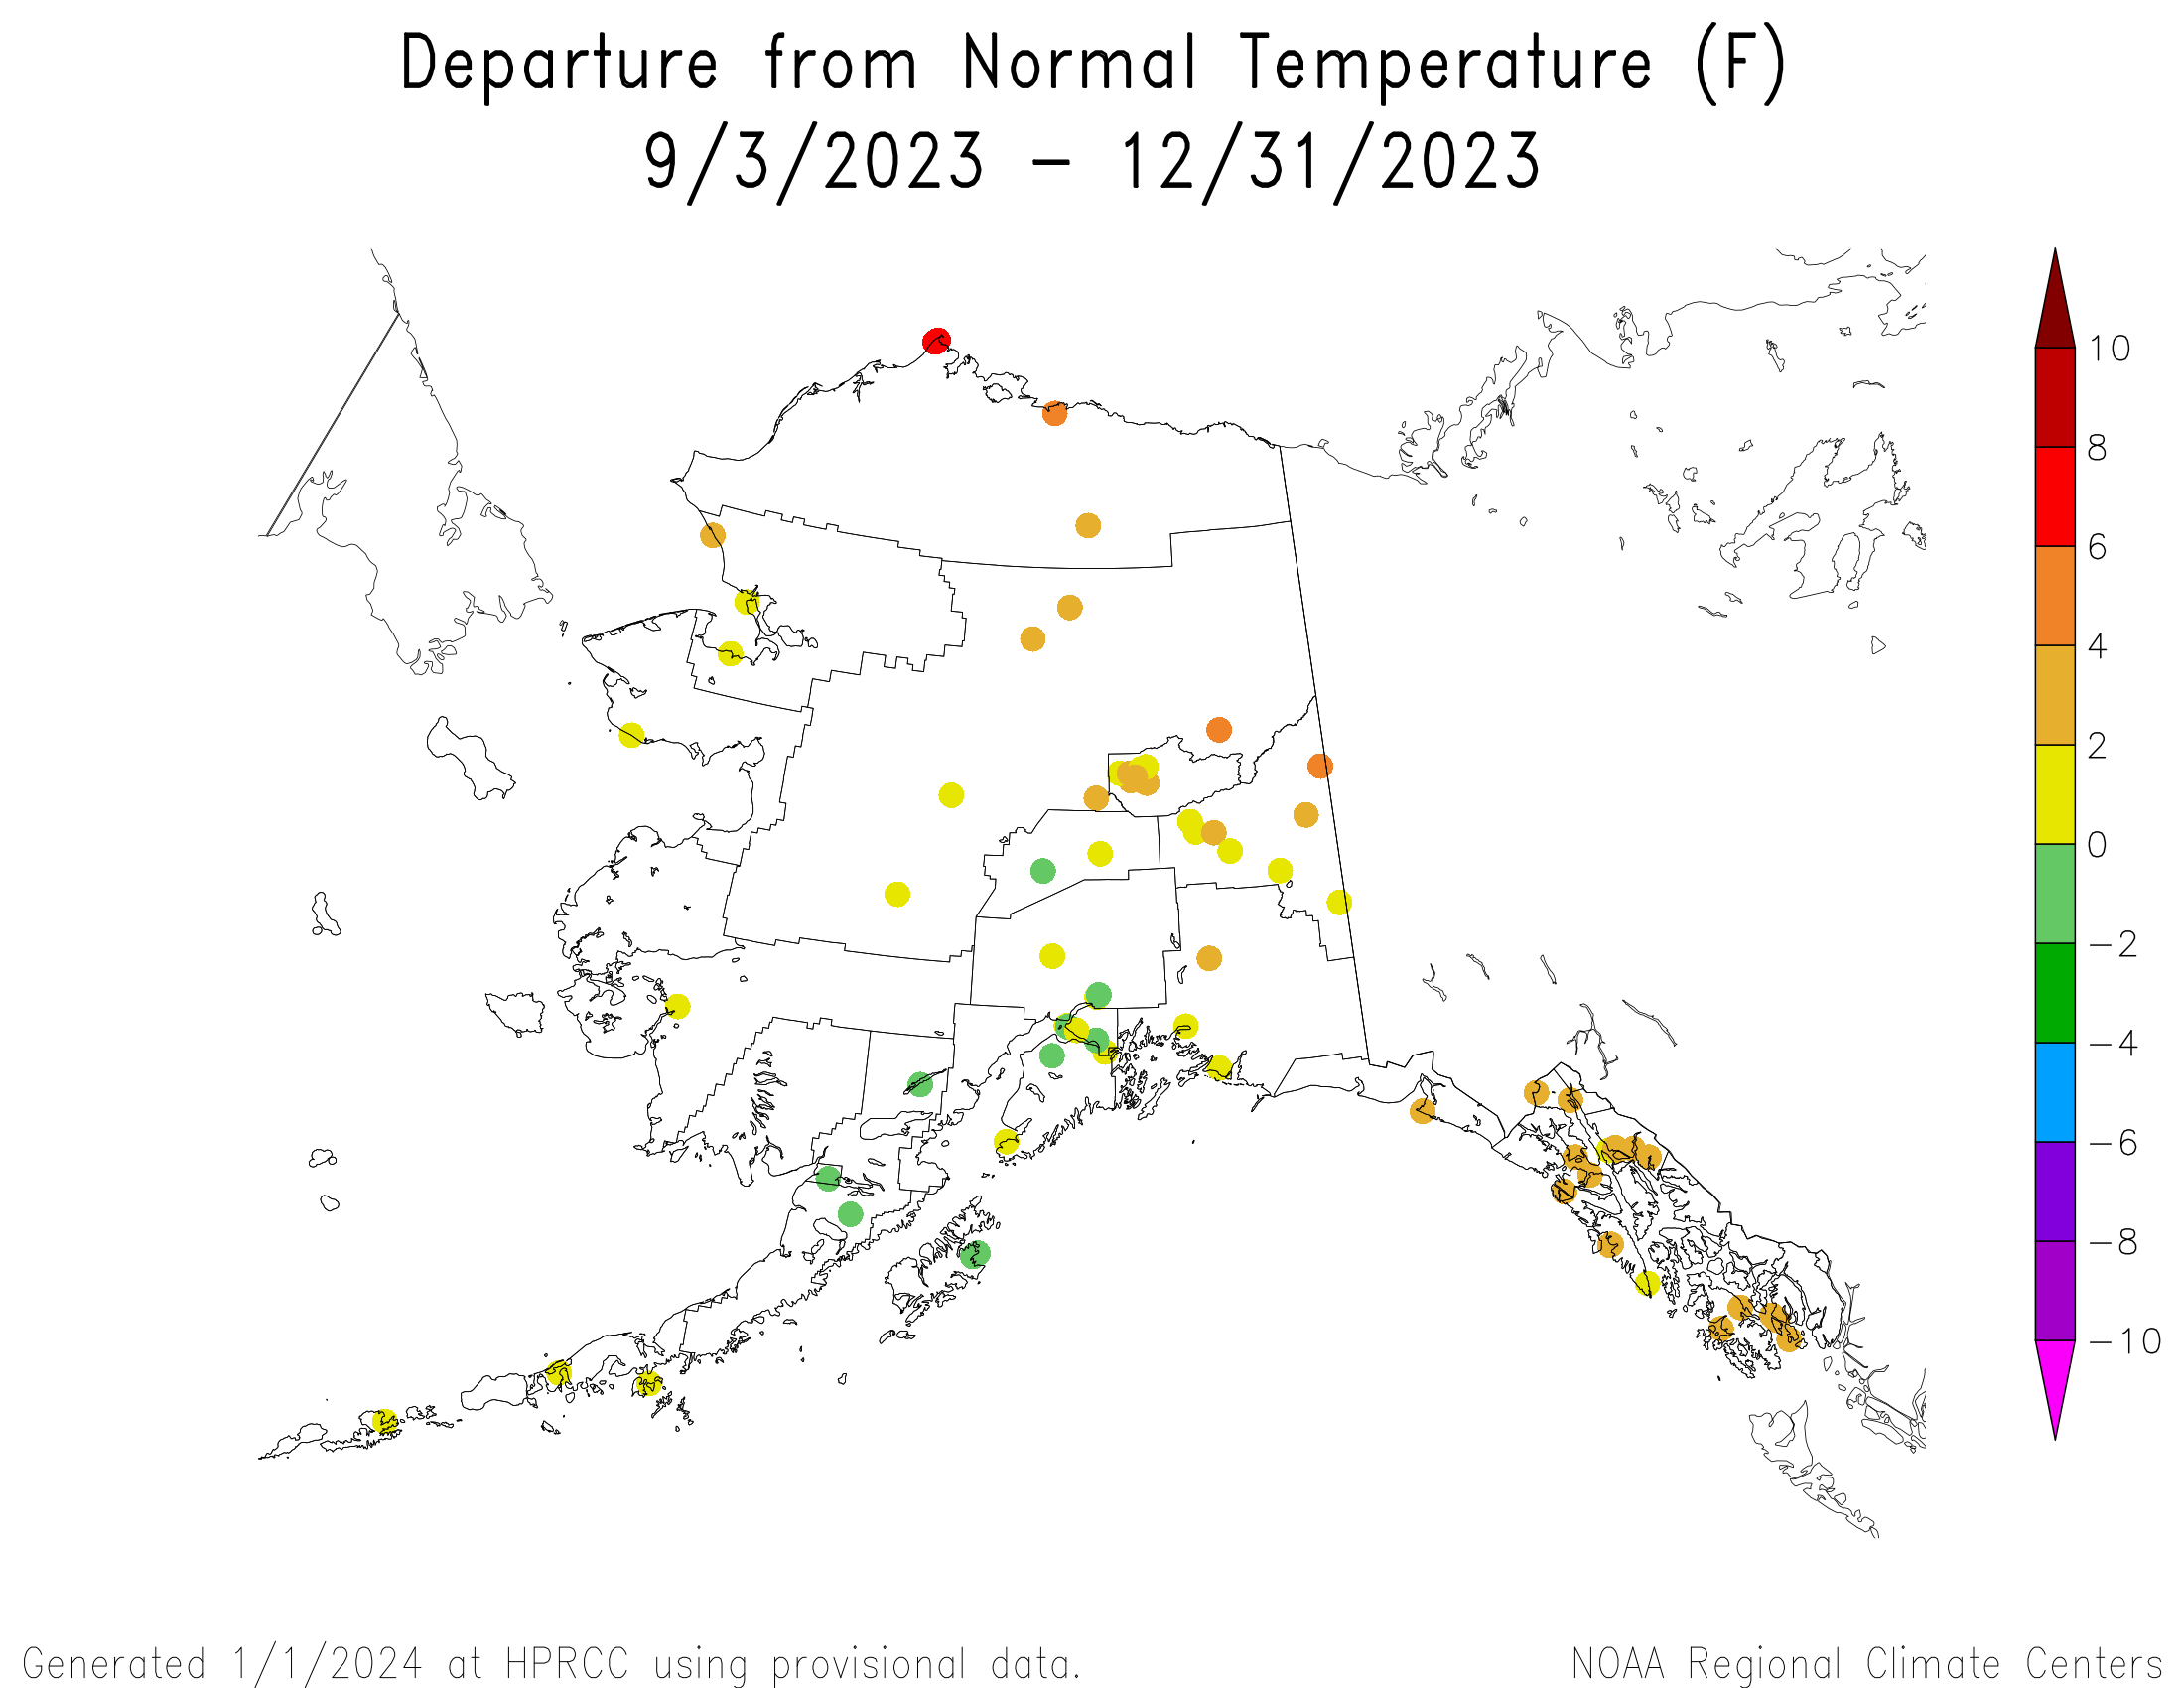
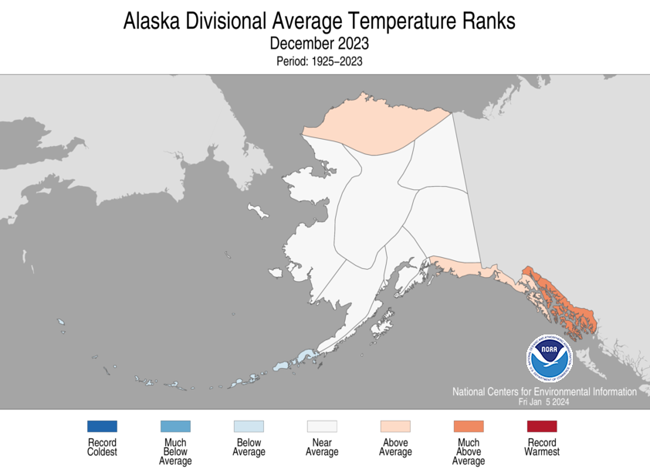
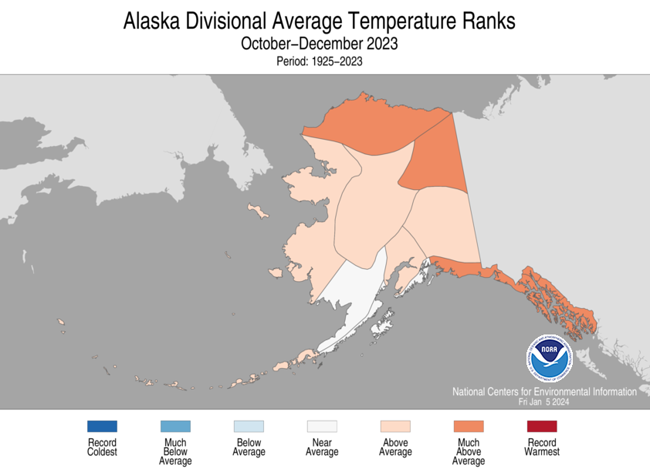
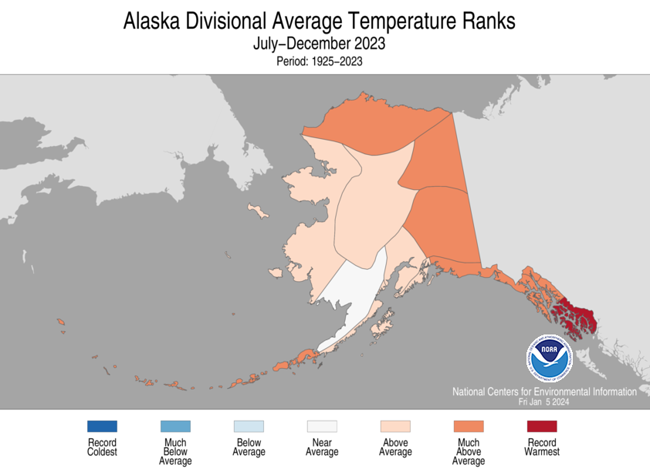
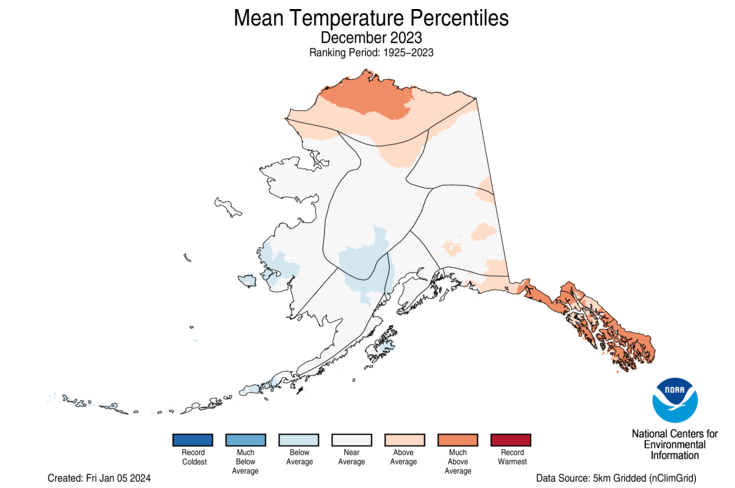
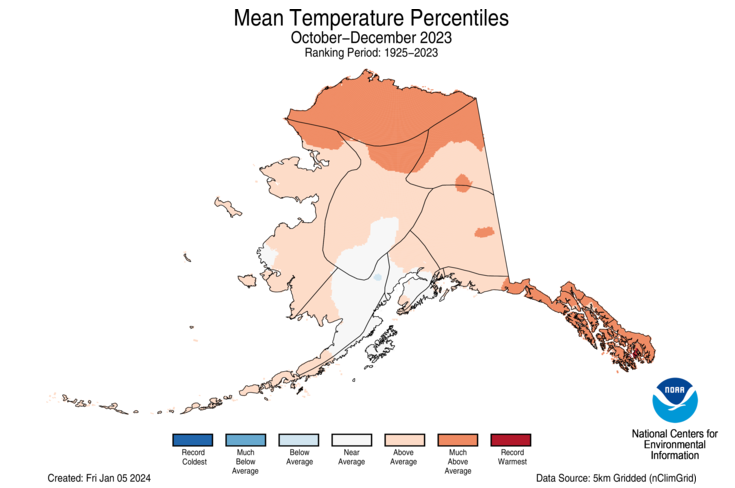
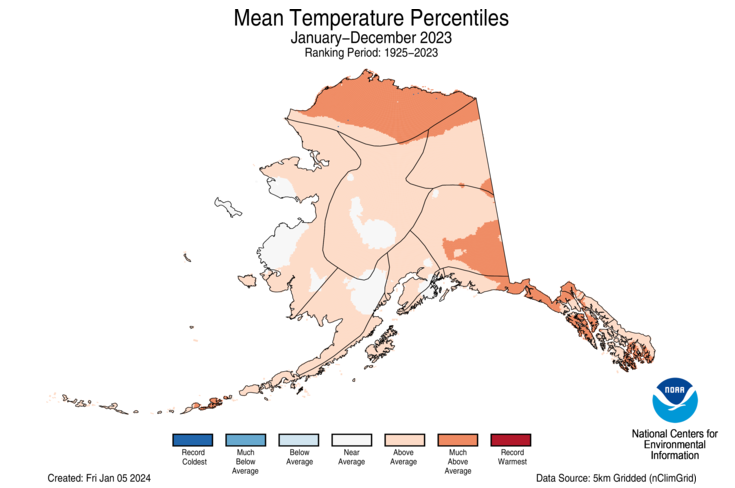
December temperatures were warmer than normal in the far northern and southeastern sections of the state and colder than normal in the west, central, and southwest. At the 2- to 6-month time scales, warmer-than-normal conditions dominated except in the southwest. Warmer-than-average temperatures dominated at longer time scales, when compared to the long-term (1926-2023) average. But when compared to more recent (1991-2020) normals, near to cooler-than-normal temperatures were evident at some western to central stations because of a pronounced warming trend in recent decades (low elevation station temperature anomaly maps for the last 1, 2, 3, 4, 12 months) (climate division temperature rank maps for the last 1, 3, 6, and 12 months) (gridded temperature percentile maps for the last 1, 3, and 12 months) (Leaky Bucket model temperature percentile map).
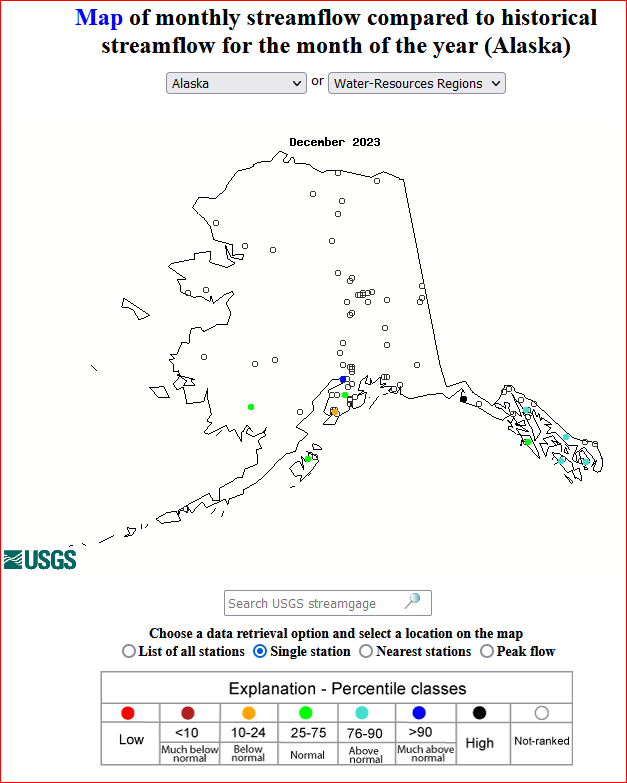
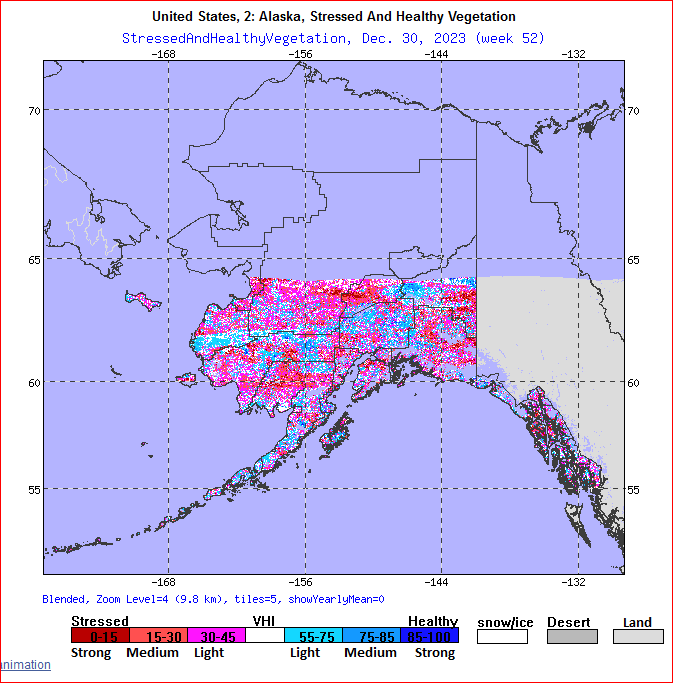
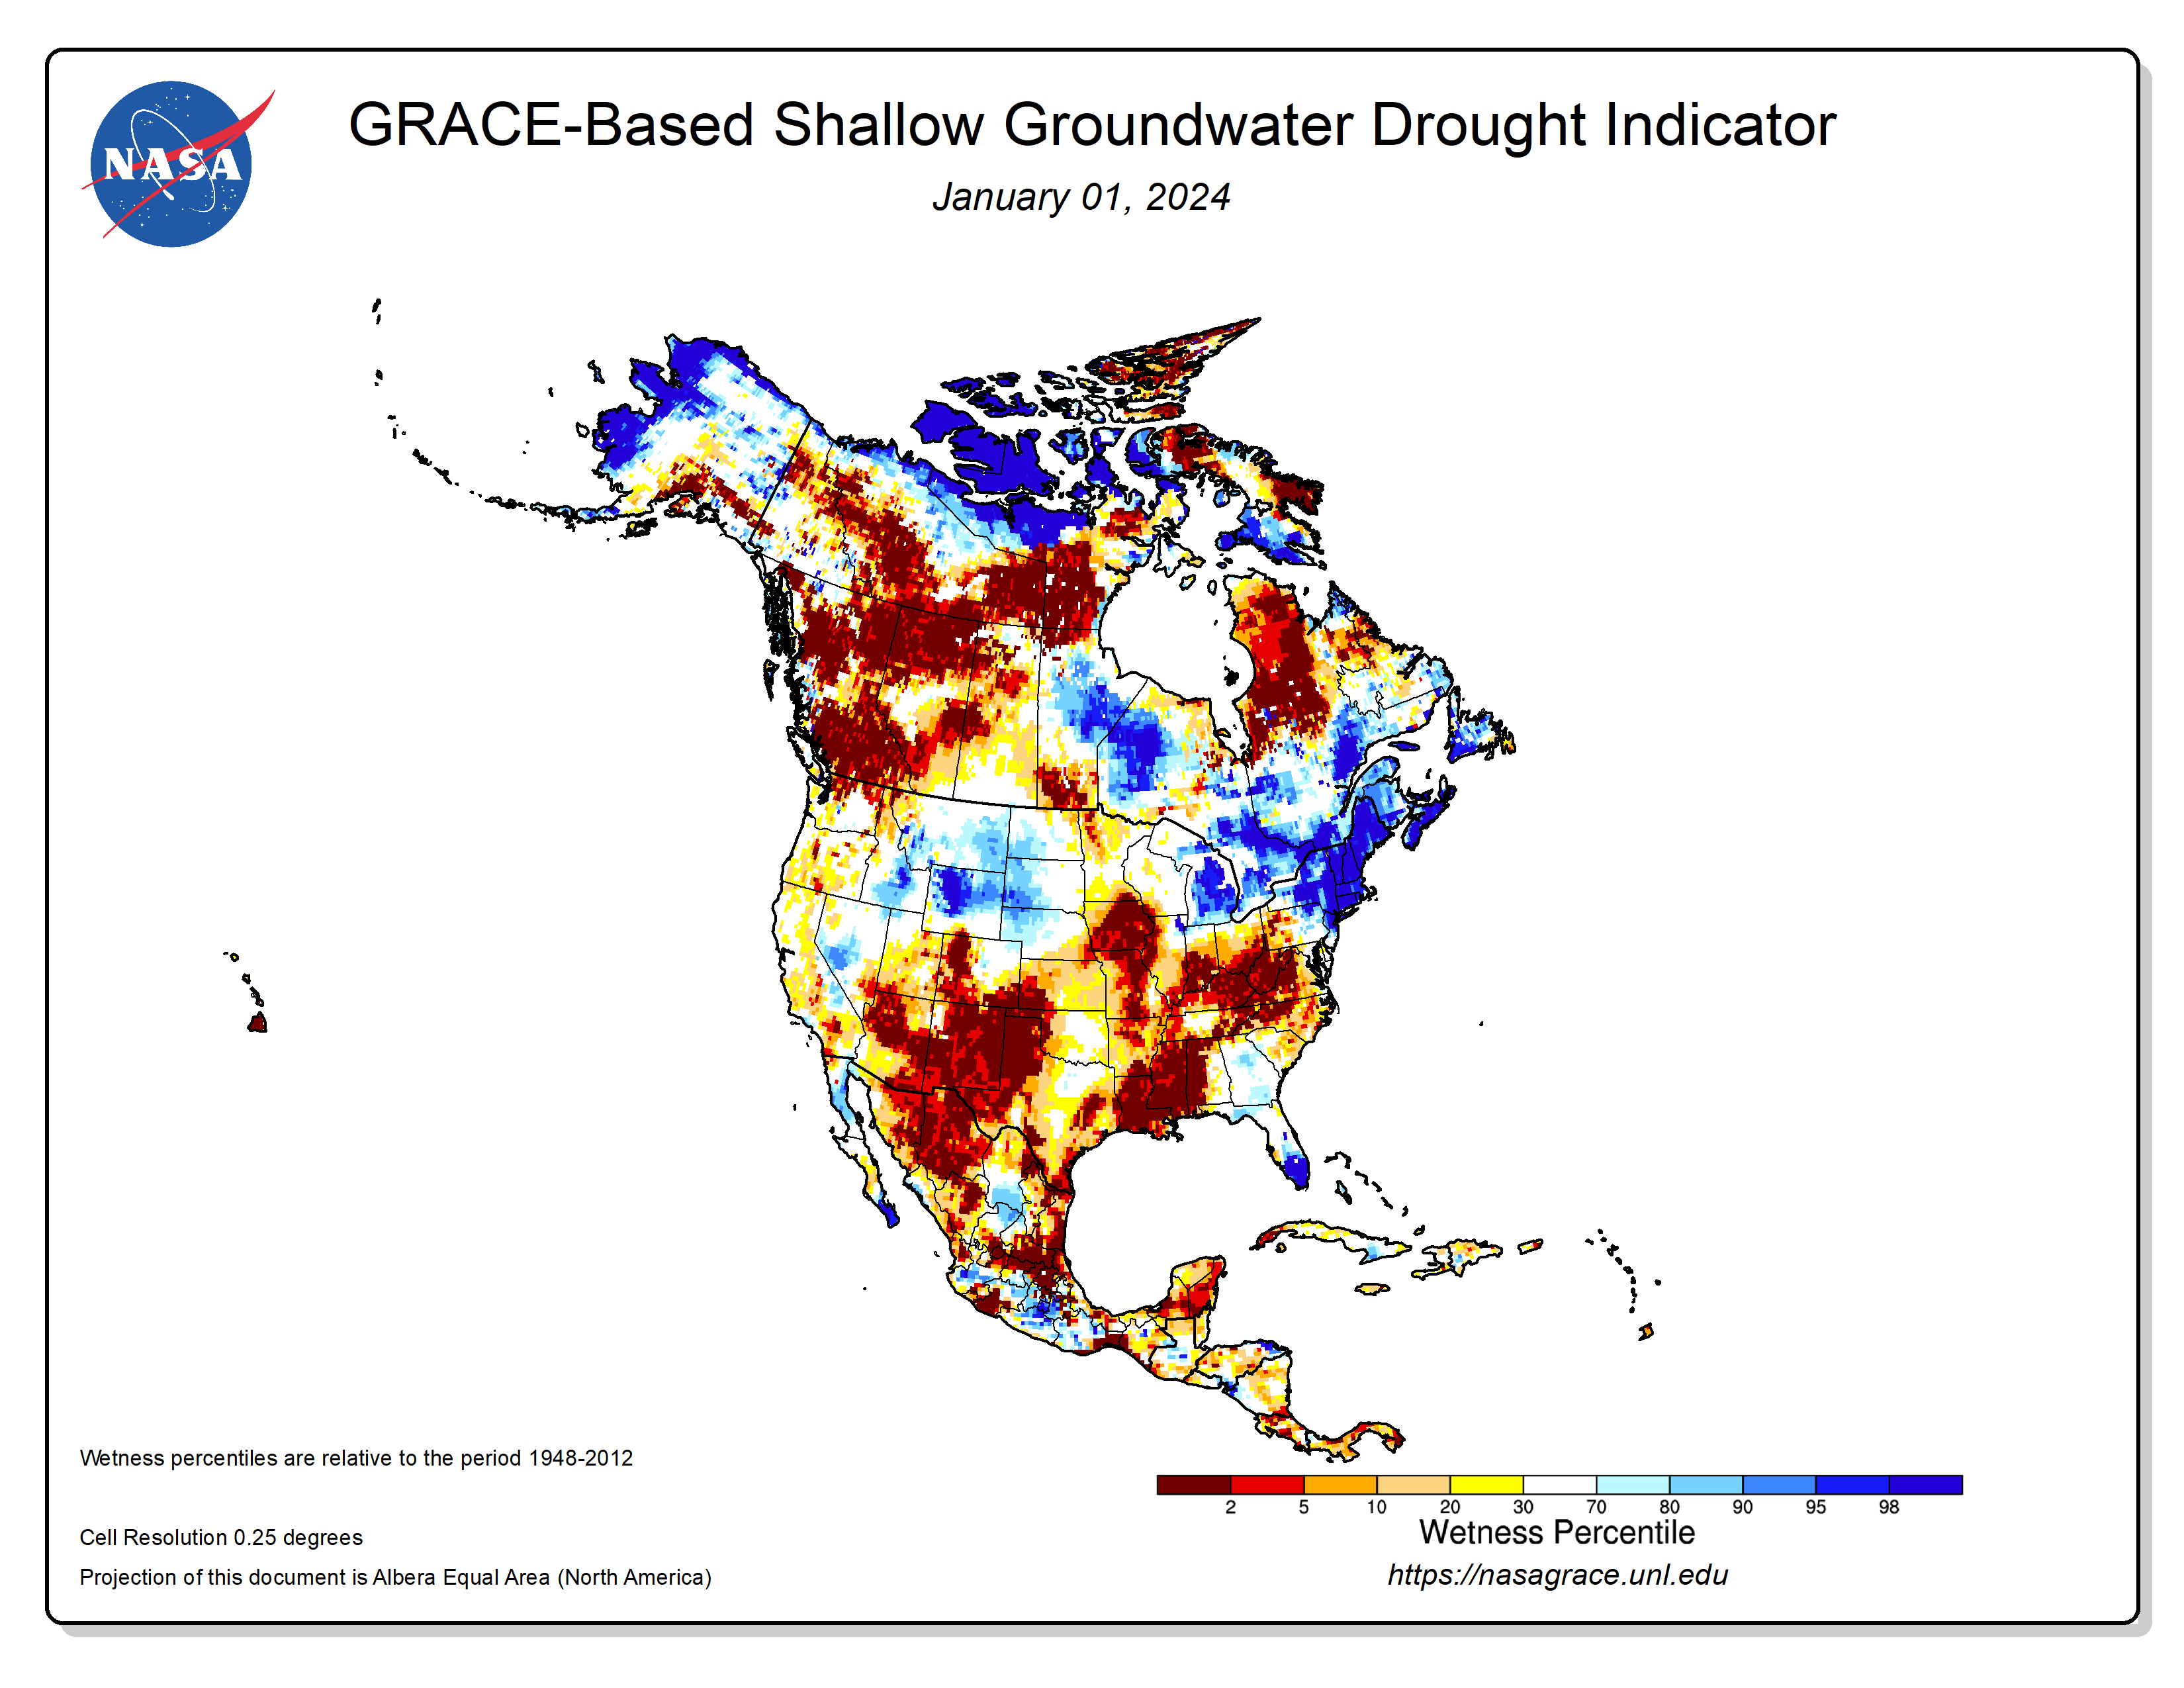
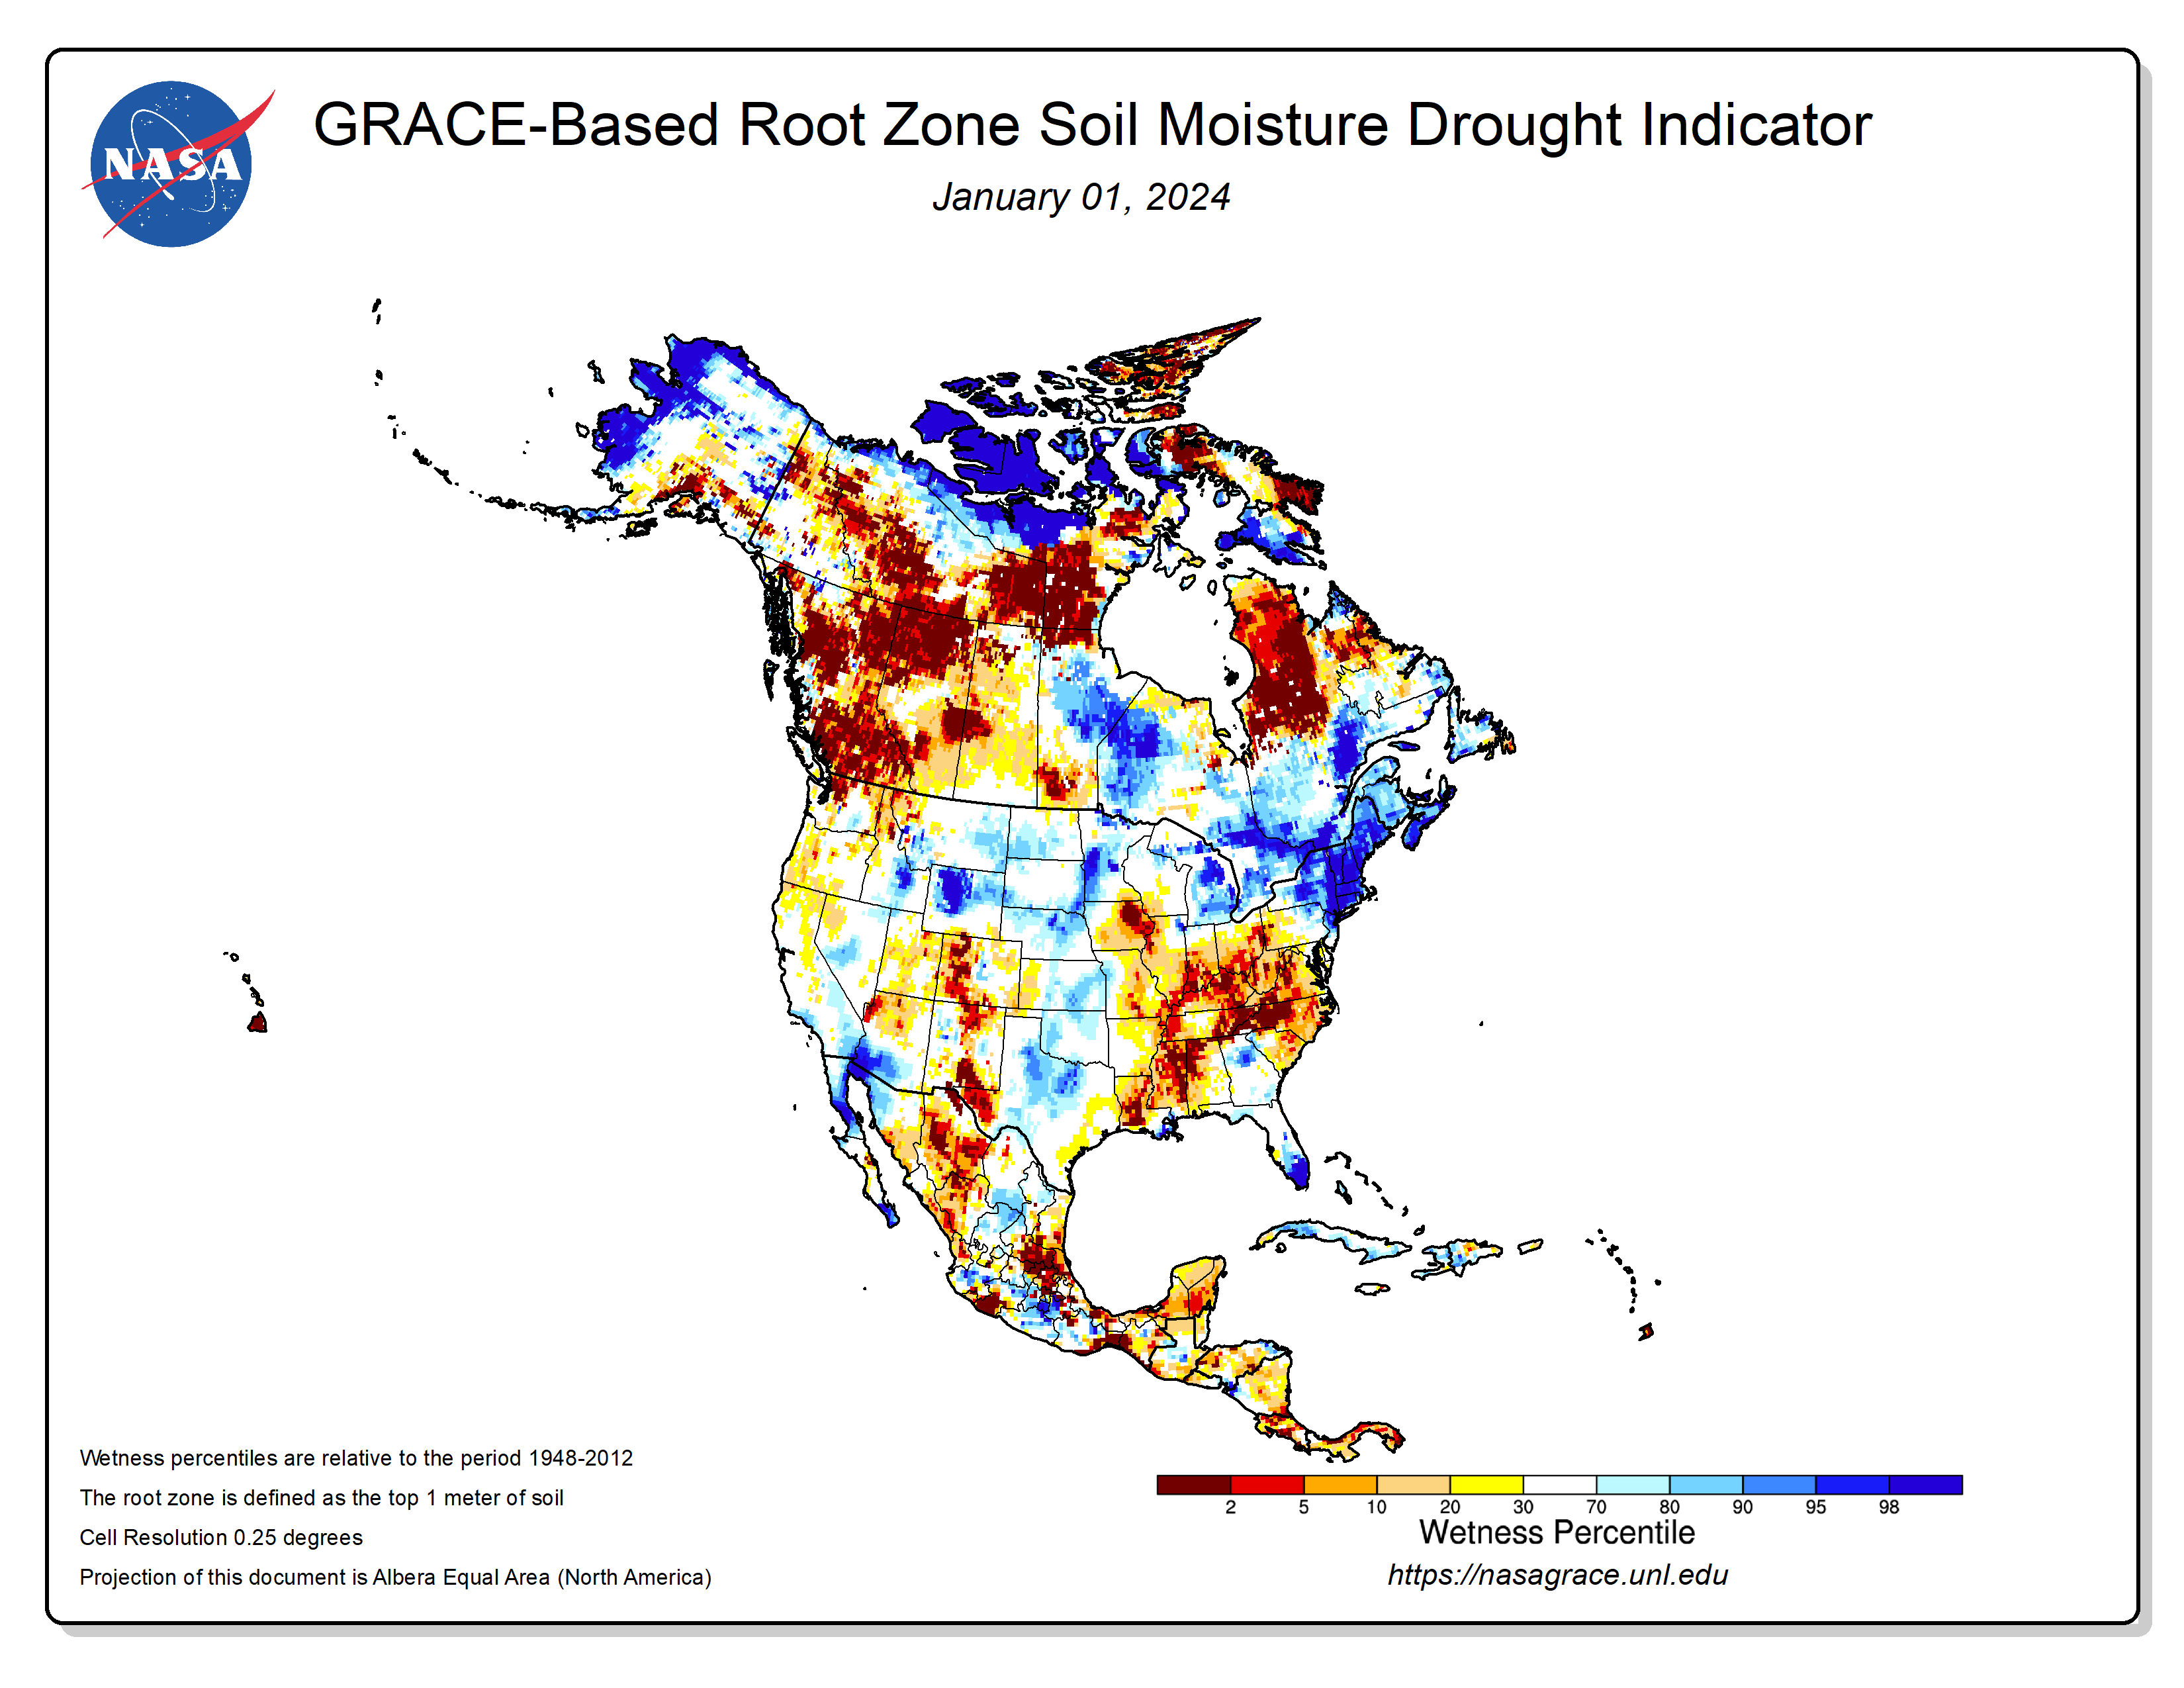
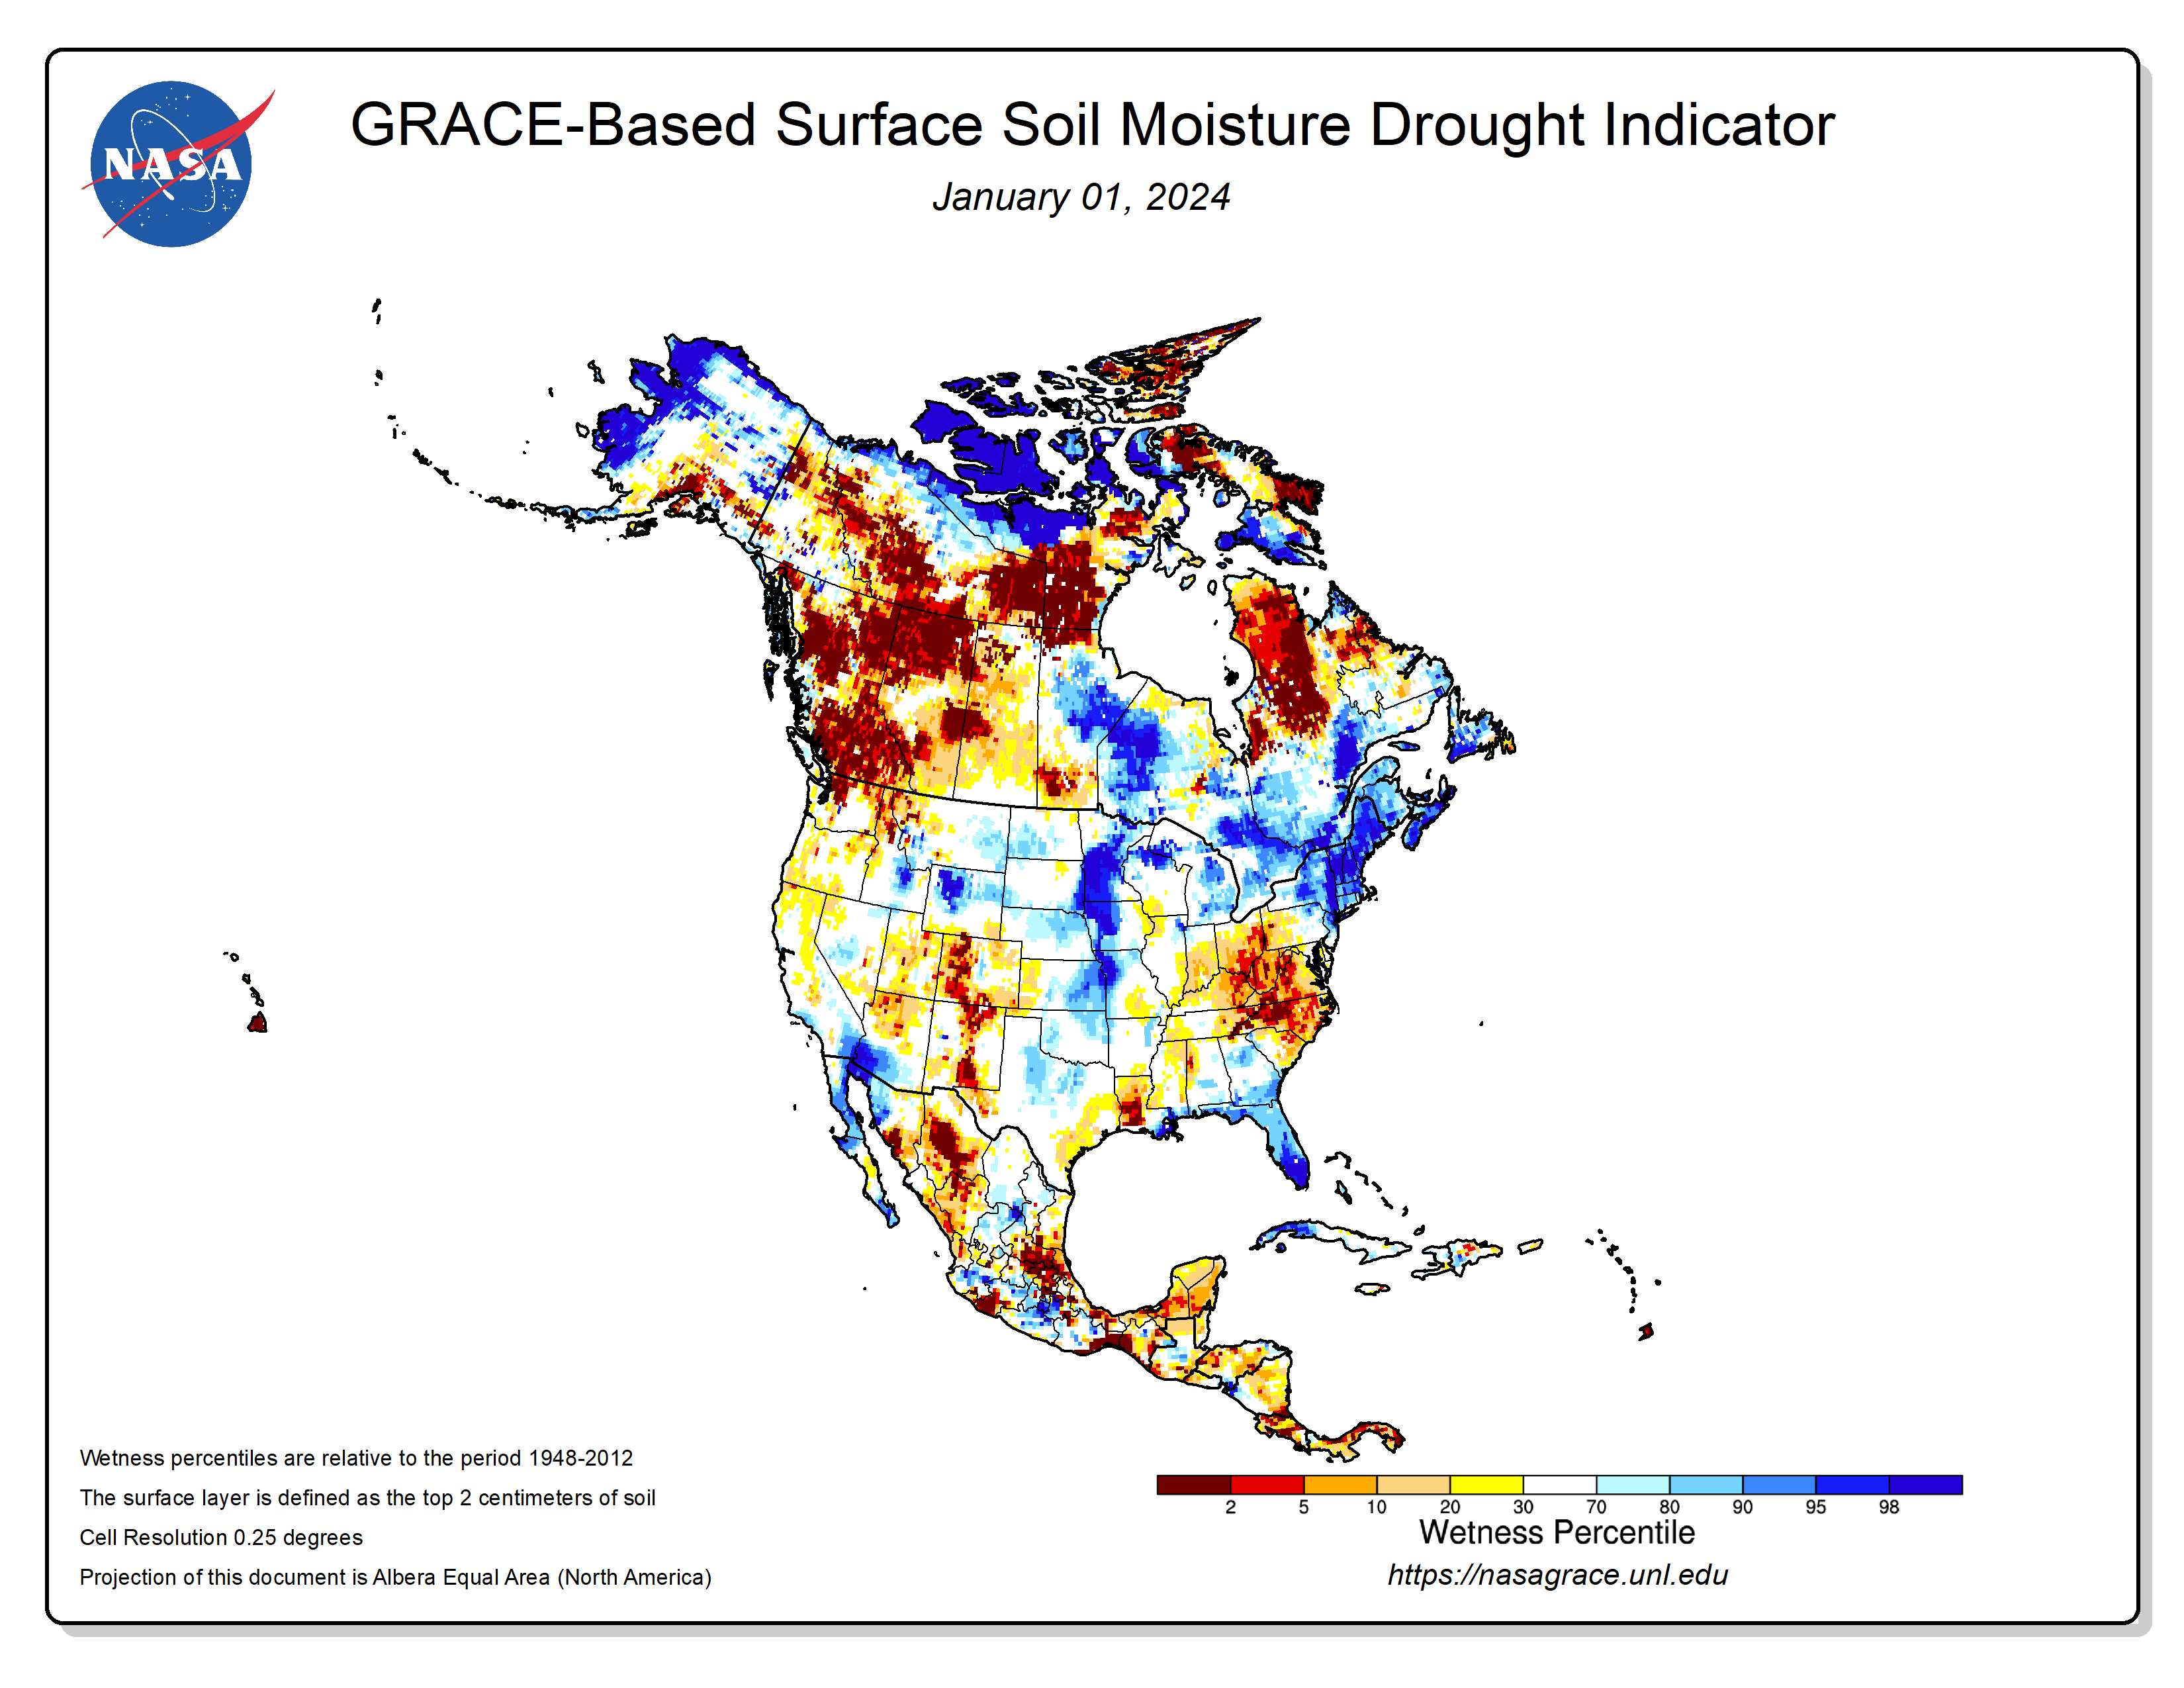
Monthly streamflow was mostly near normal for those streams that haven't yet frozen. Satellite observations of vegetative health (stressed vegetation, drought stress, VHI) revealed areas of stressed vegetation in the south. Snow cover was well established across the state and, in most basins, above average. Satellite-based or modeled observations of groundwater and soil moisture (GRACE root zone and GRACE surface soil moisture; SPoRT estimates of soil moisture at four depths [0-10 cm, 10-40 cm, 40-100 cm, 100-200 cm]; Leaky Bucket modeled soil moisture) suggested some dryness was occurring in parts of the southeast and northeast.
Alaska was free of drought or abnormal dryness on the January 2, 2024 USDM map.
Puerto Rico and U.S. Virgin Islands

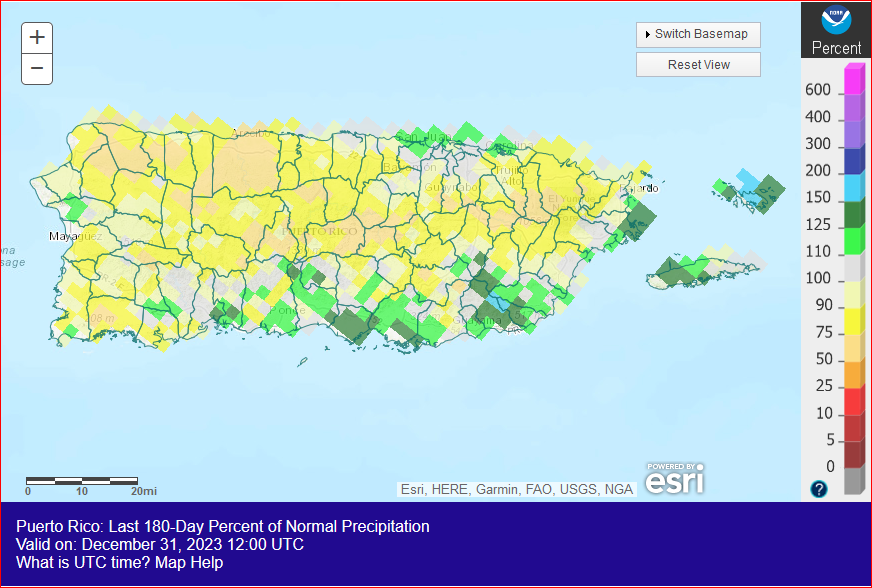
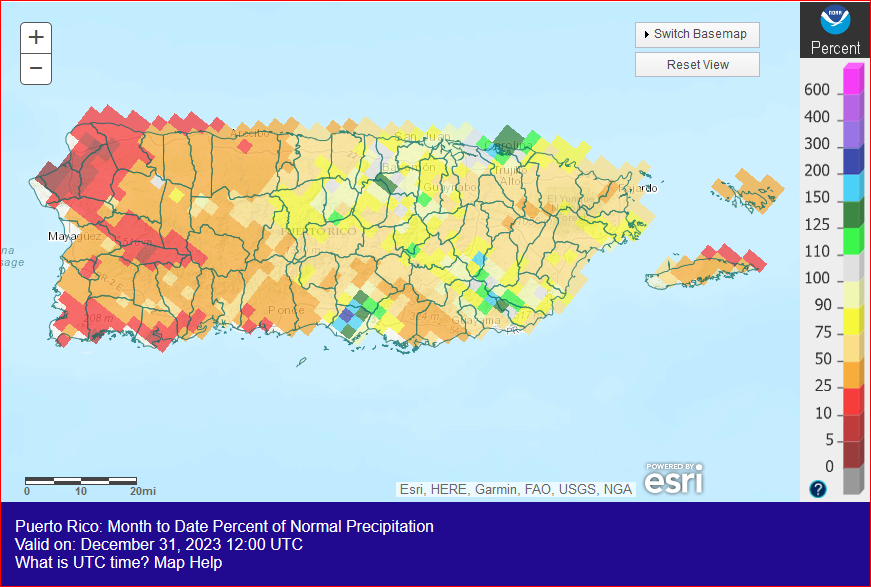
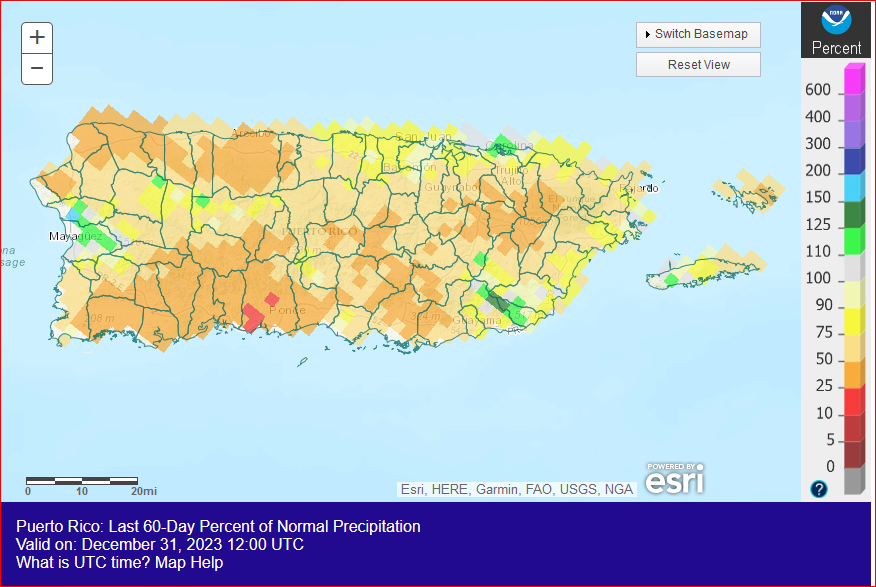
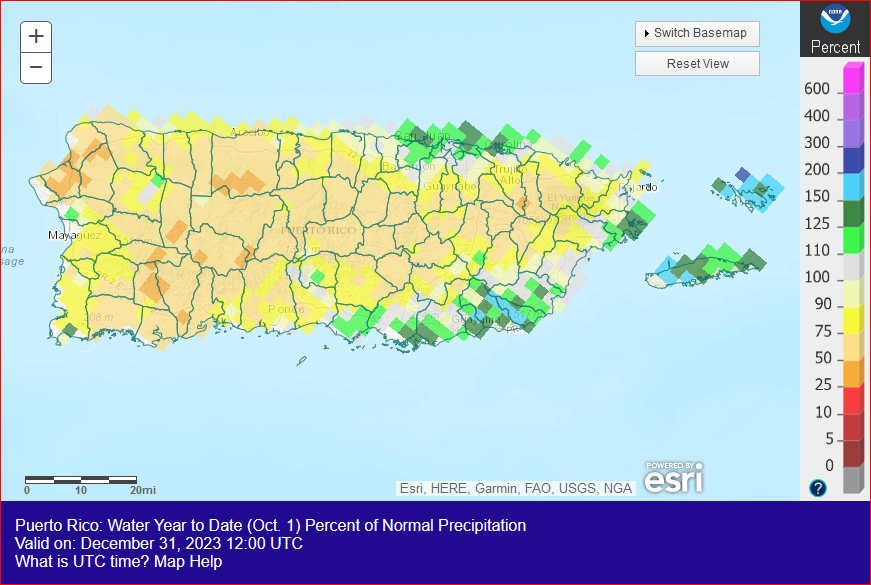
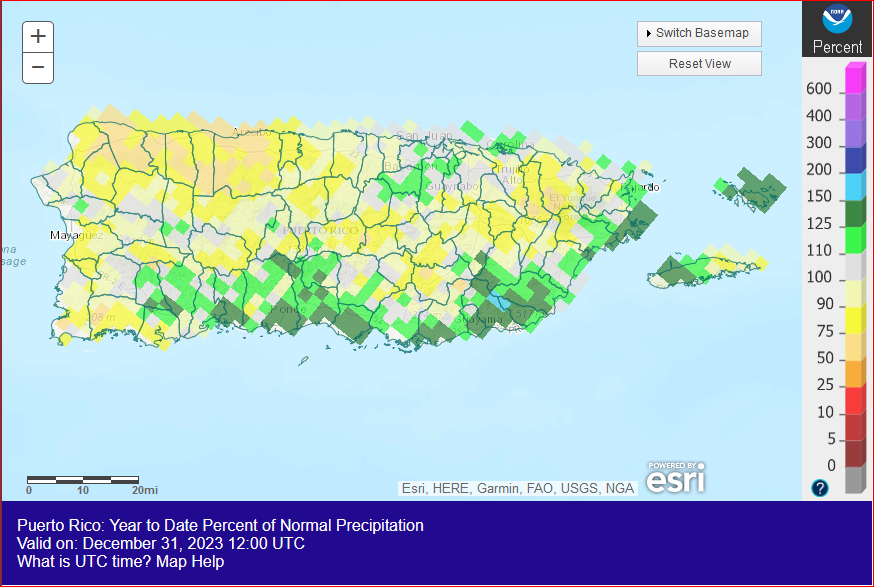
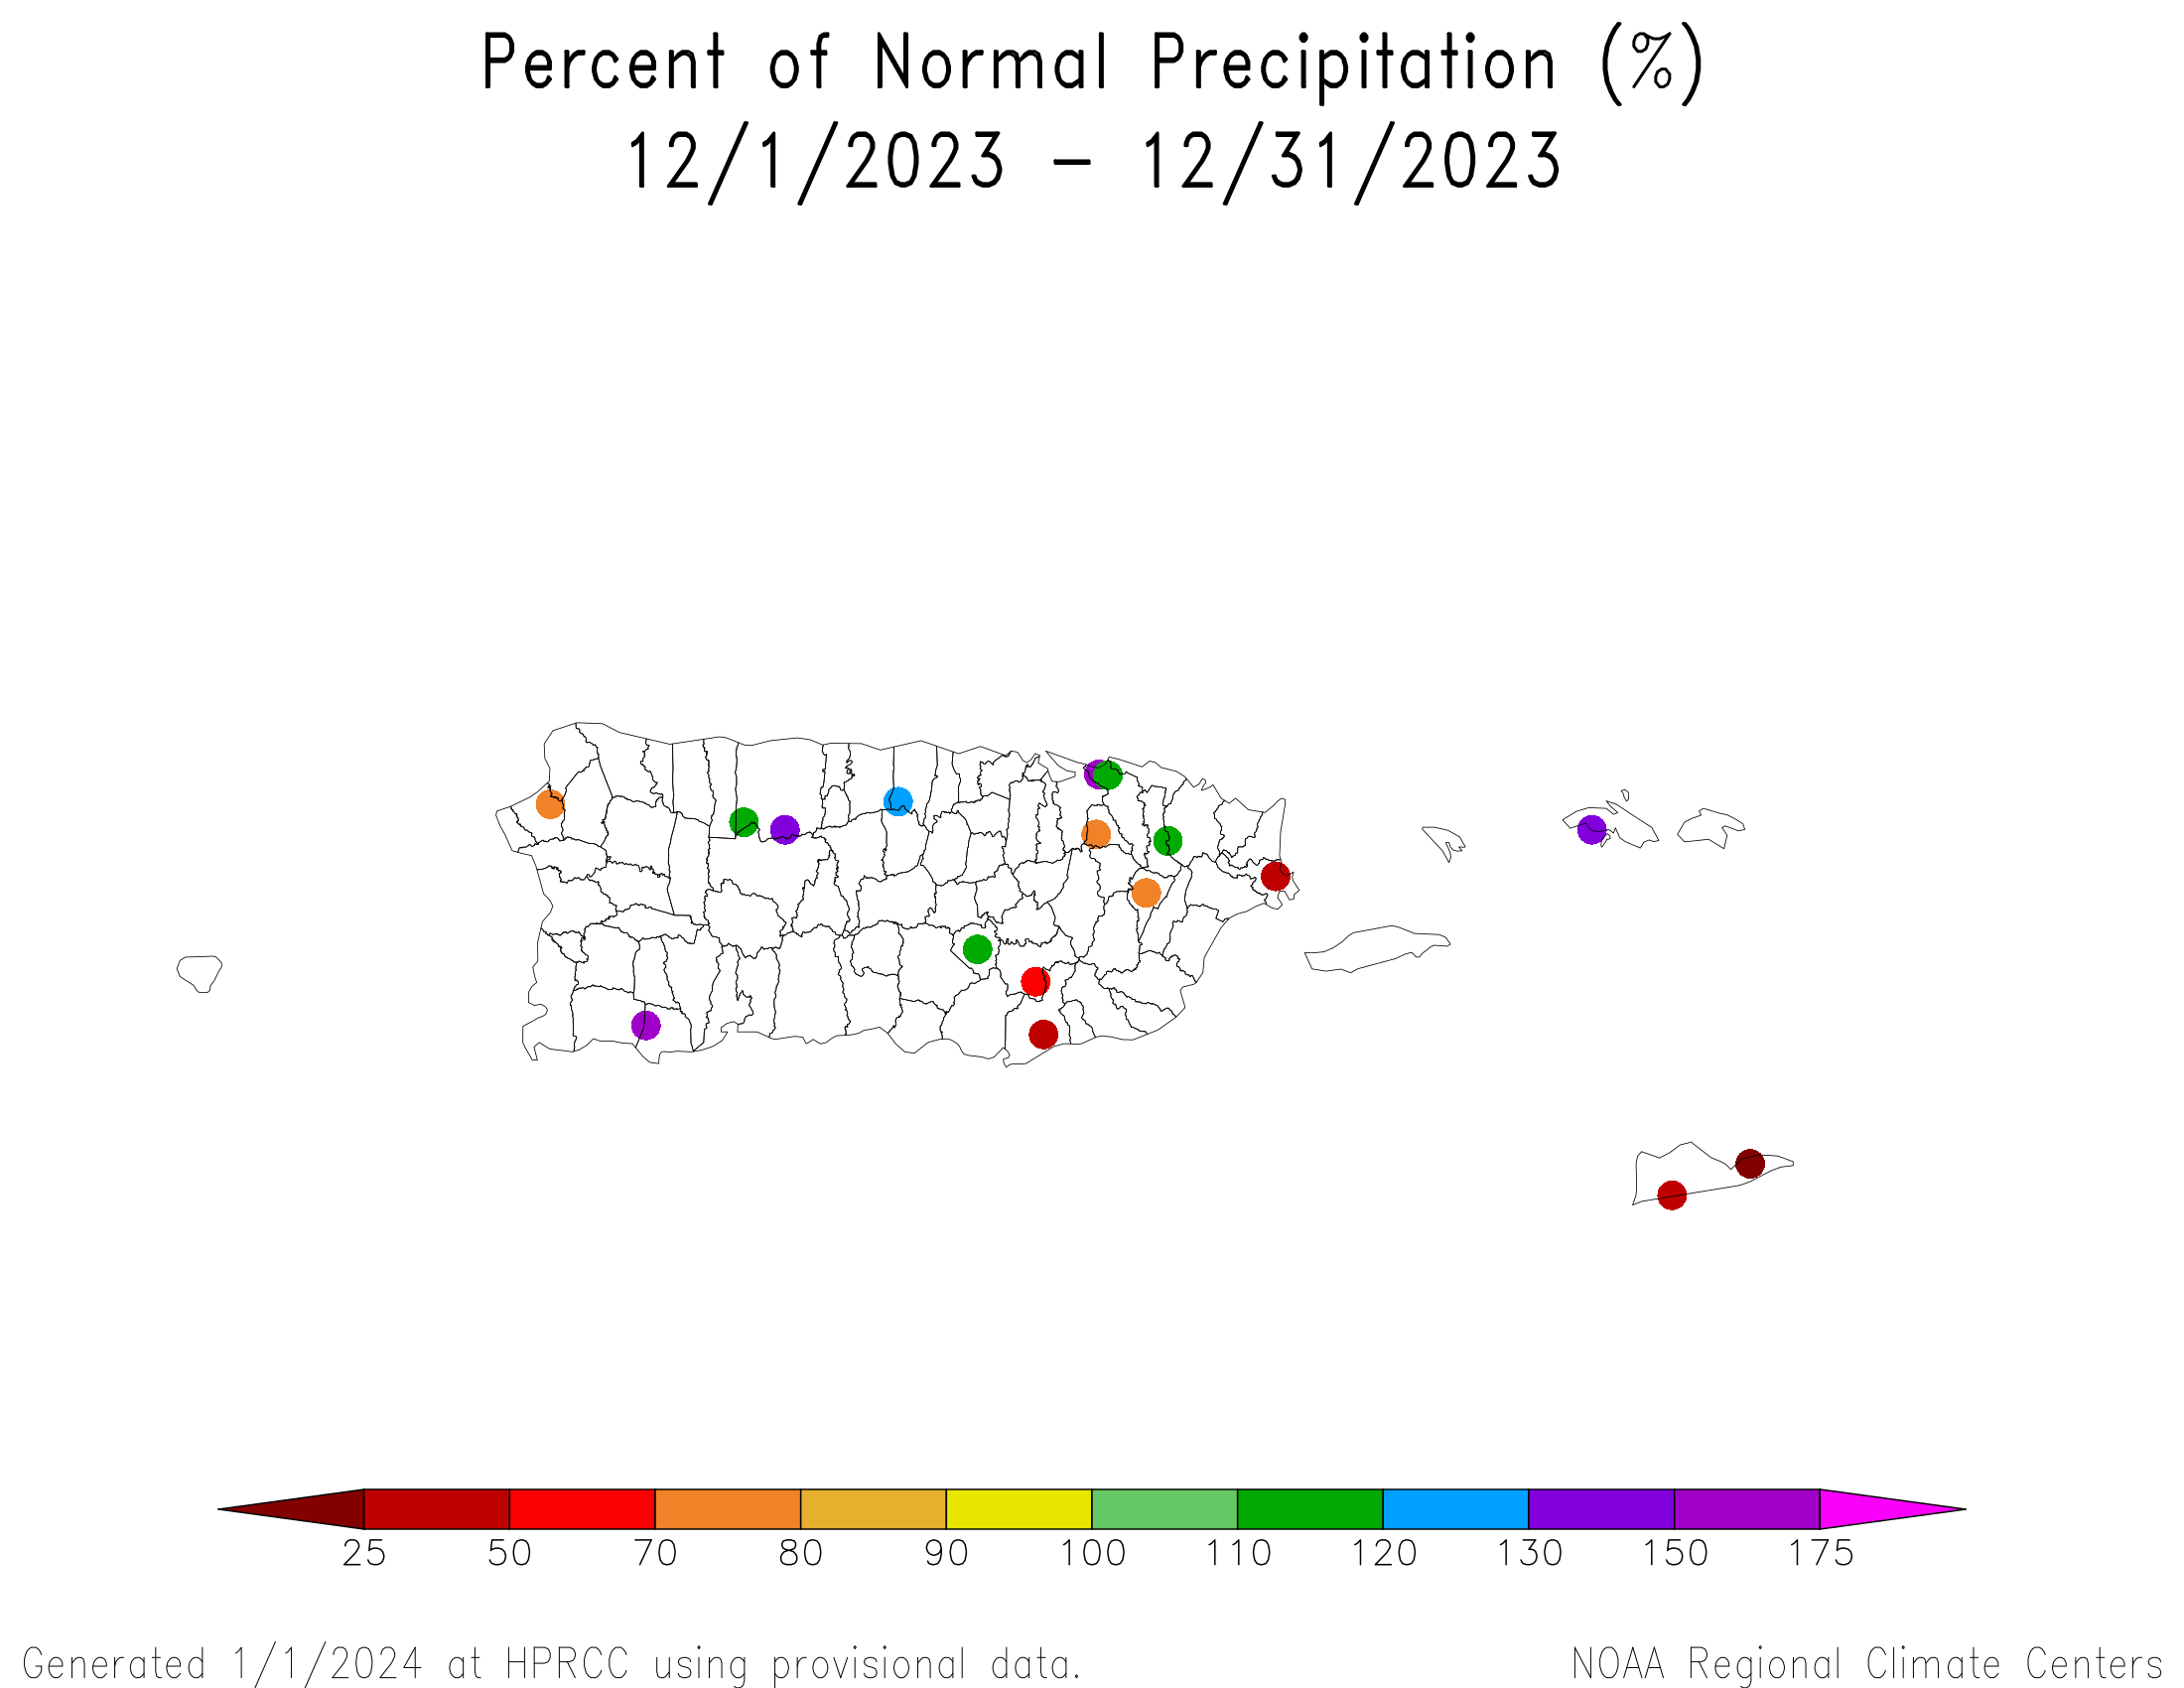
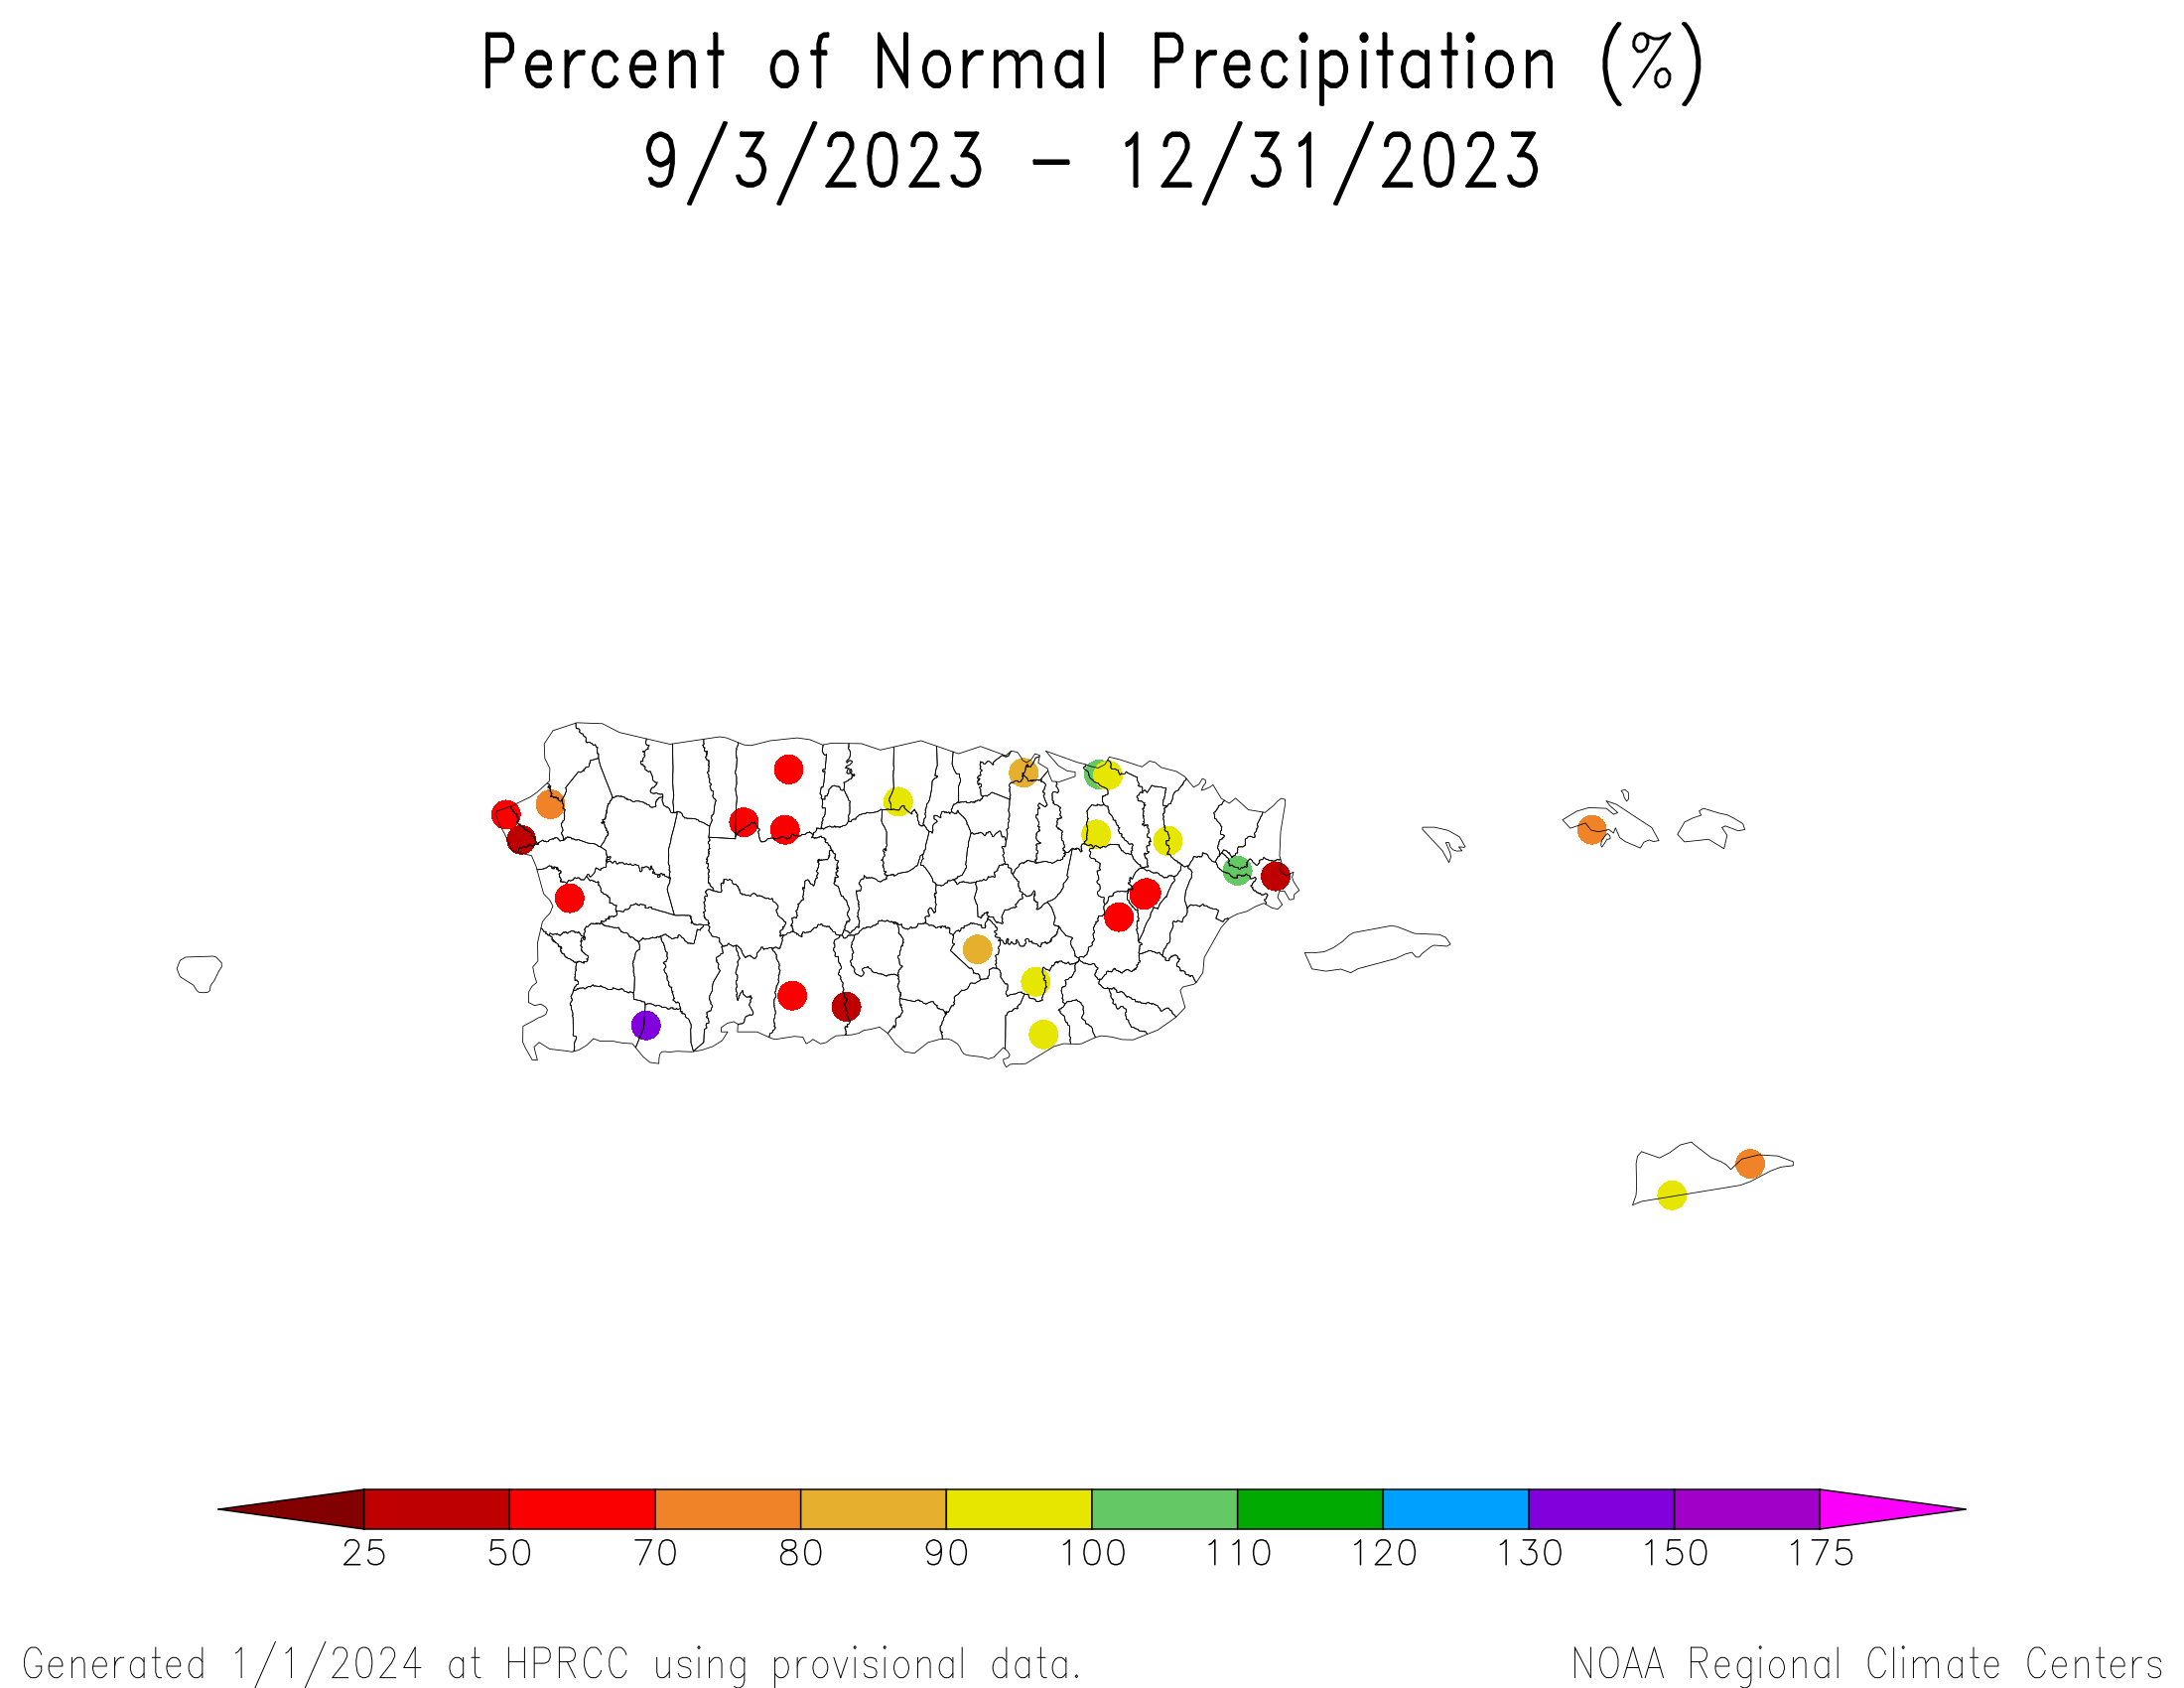
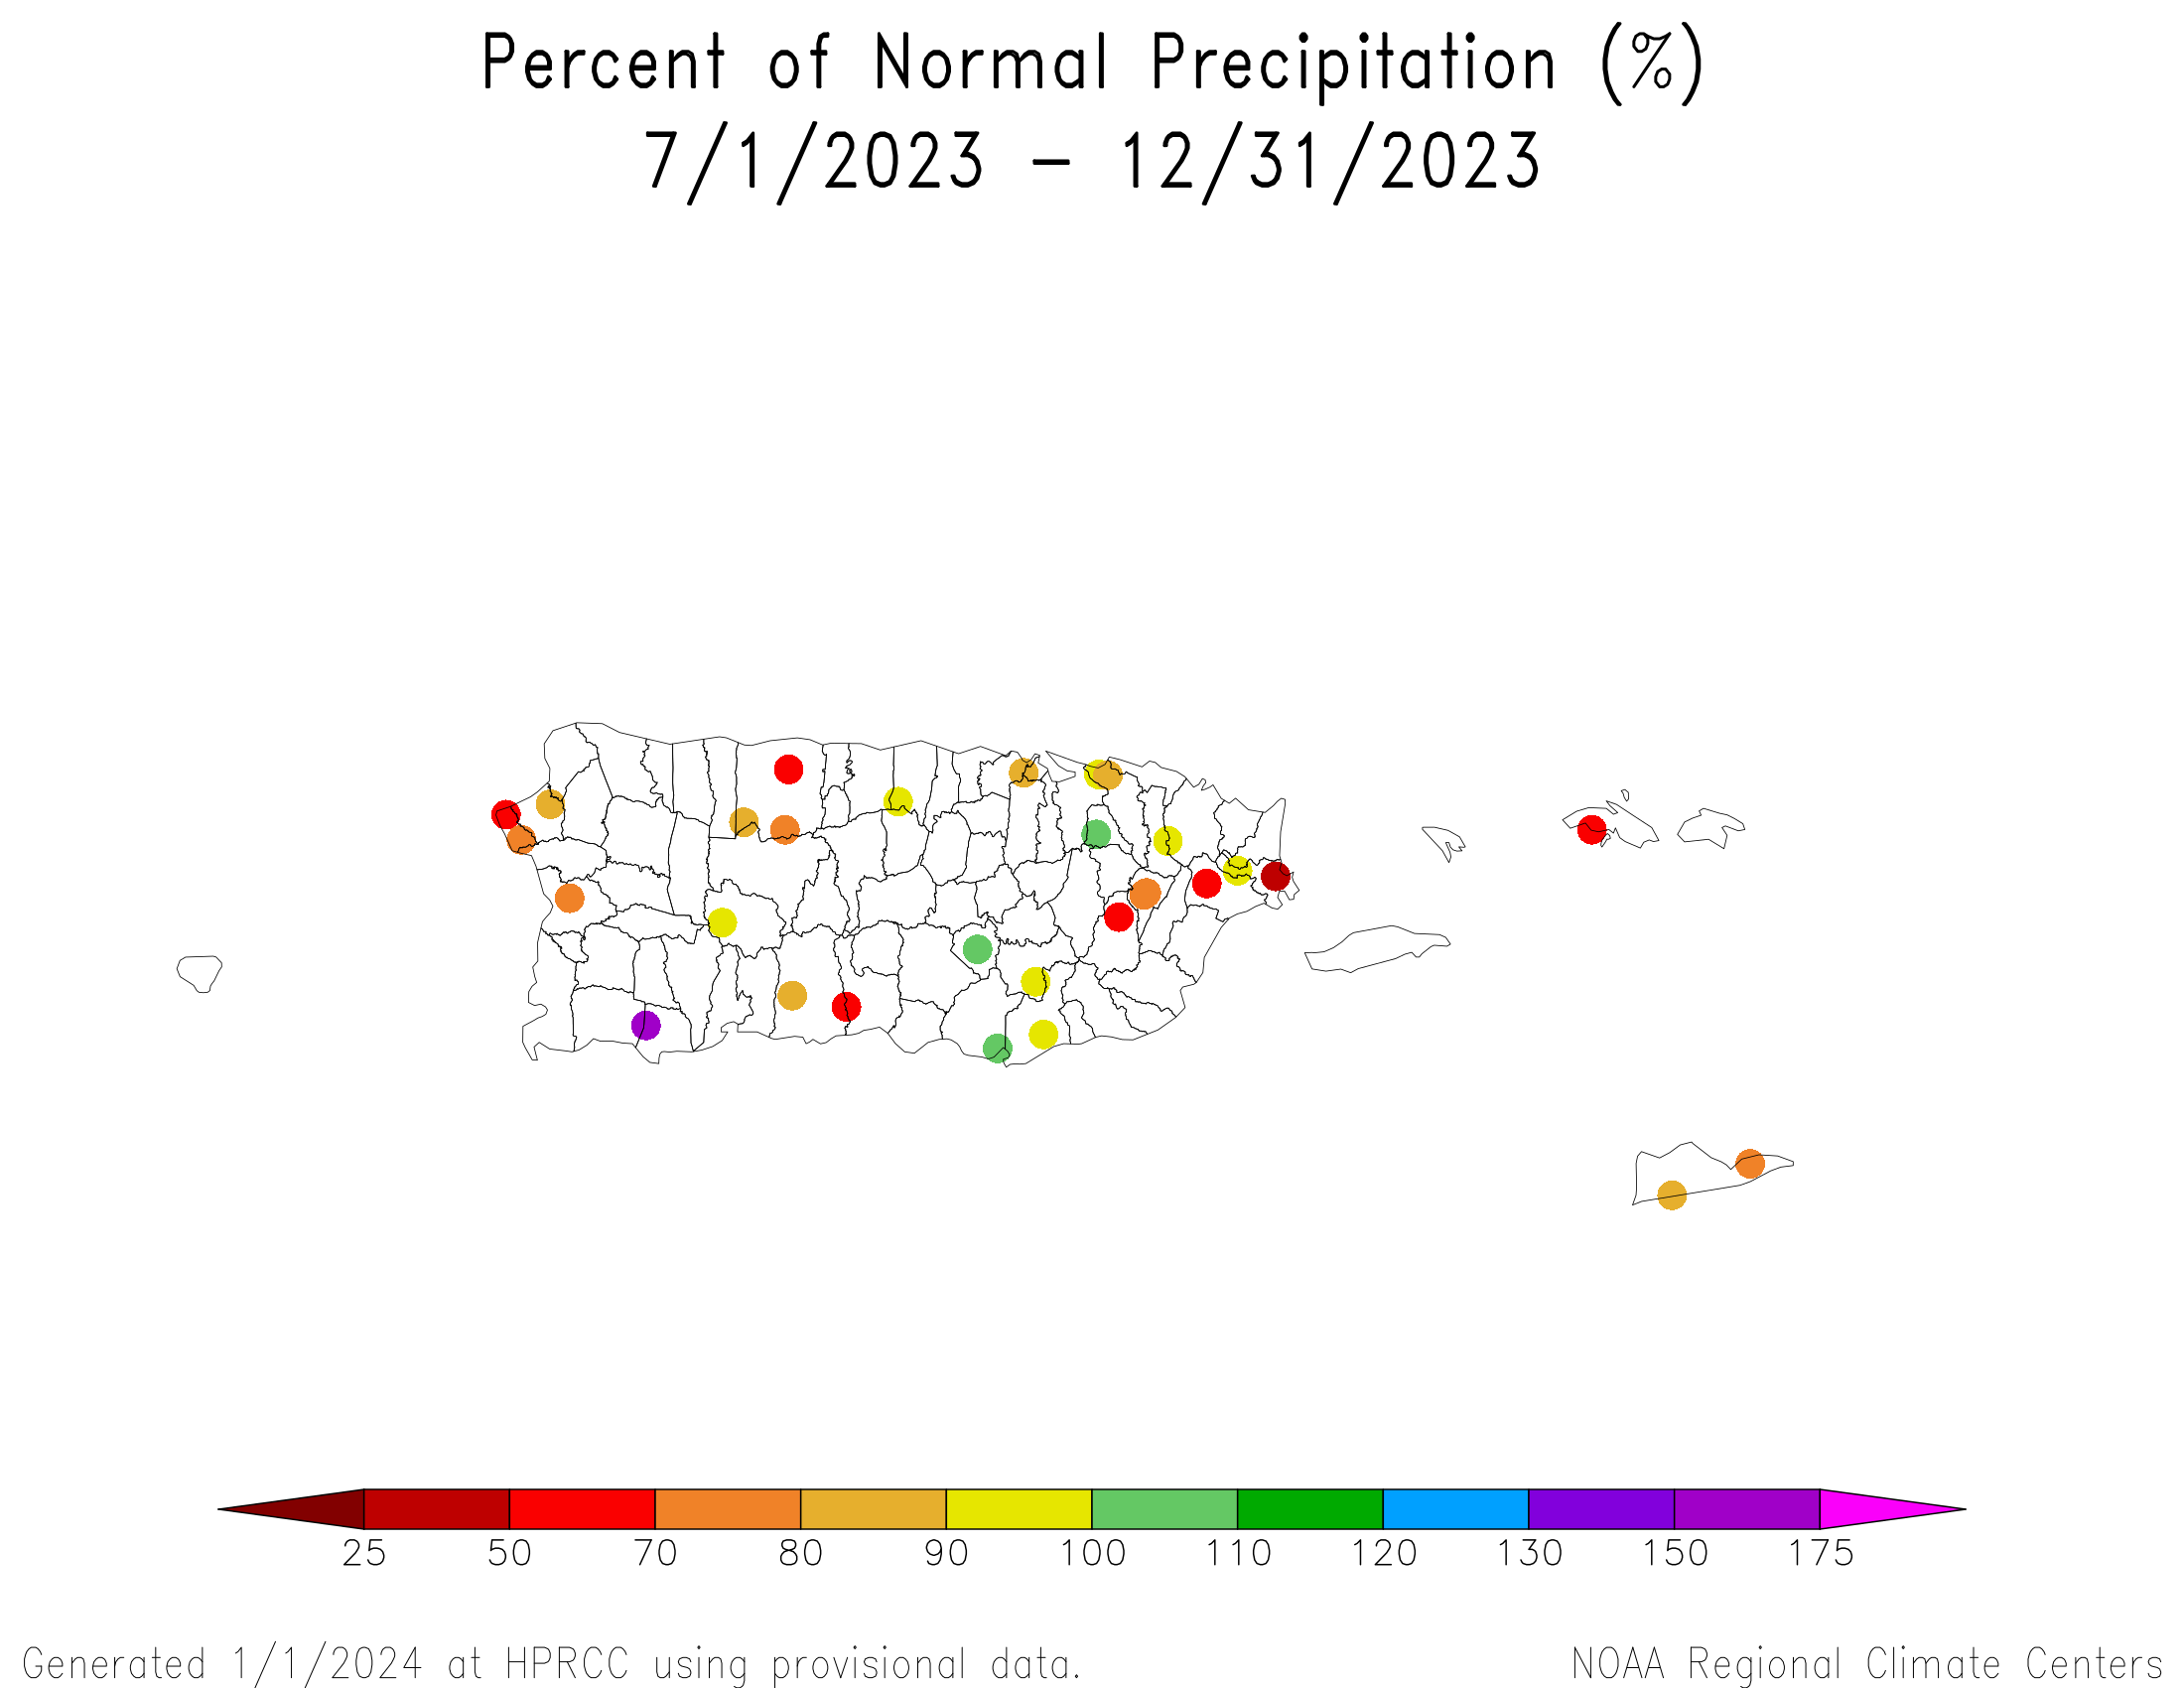
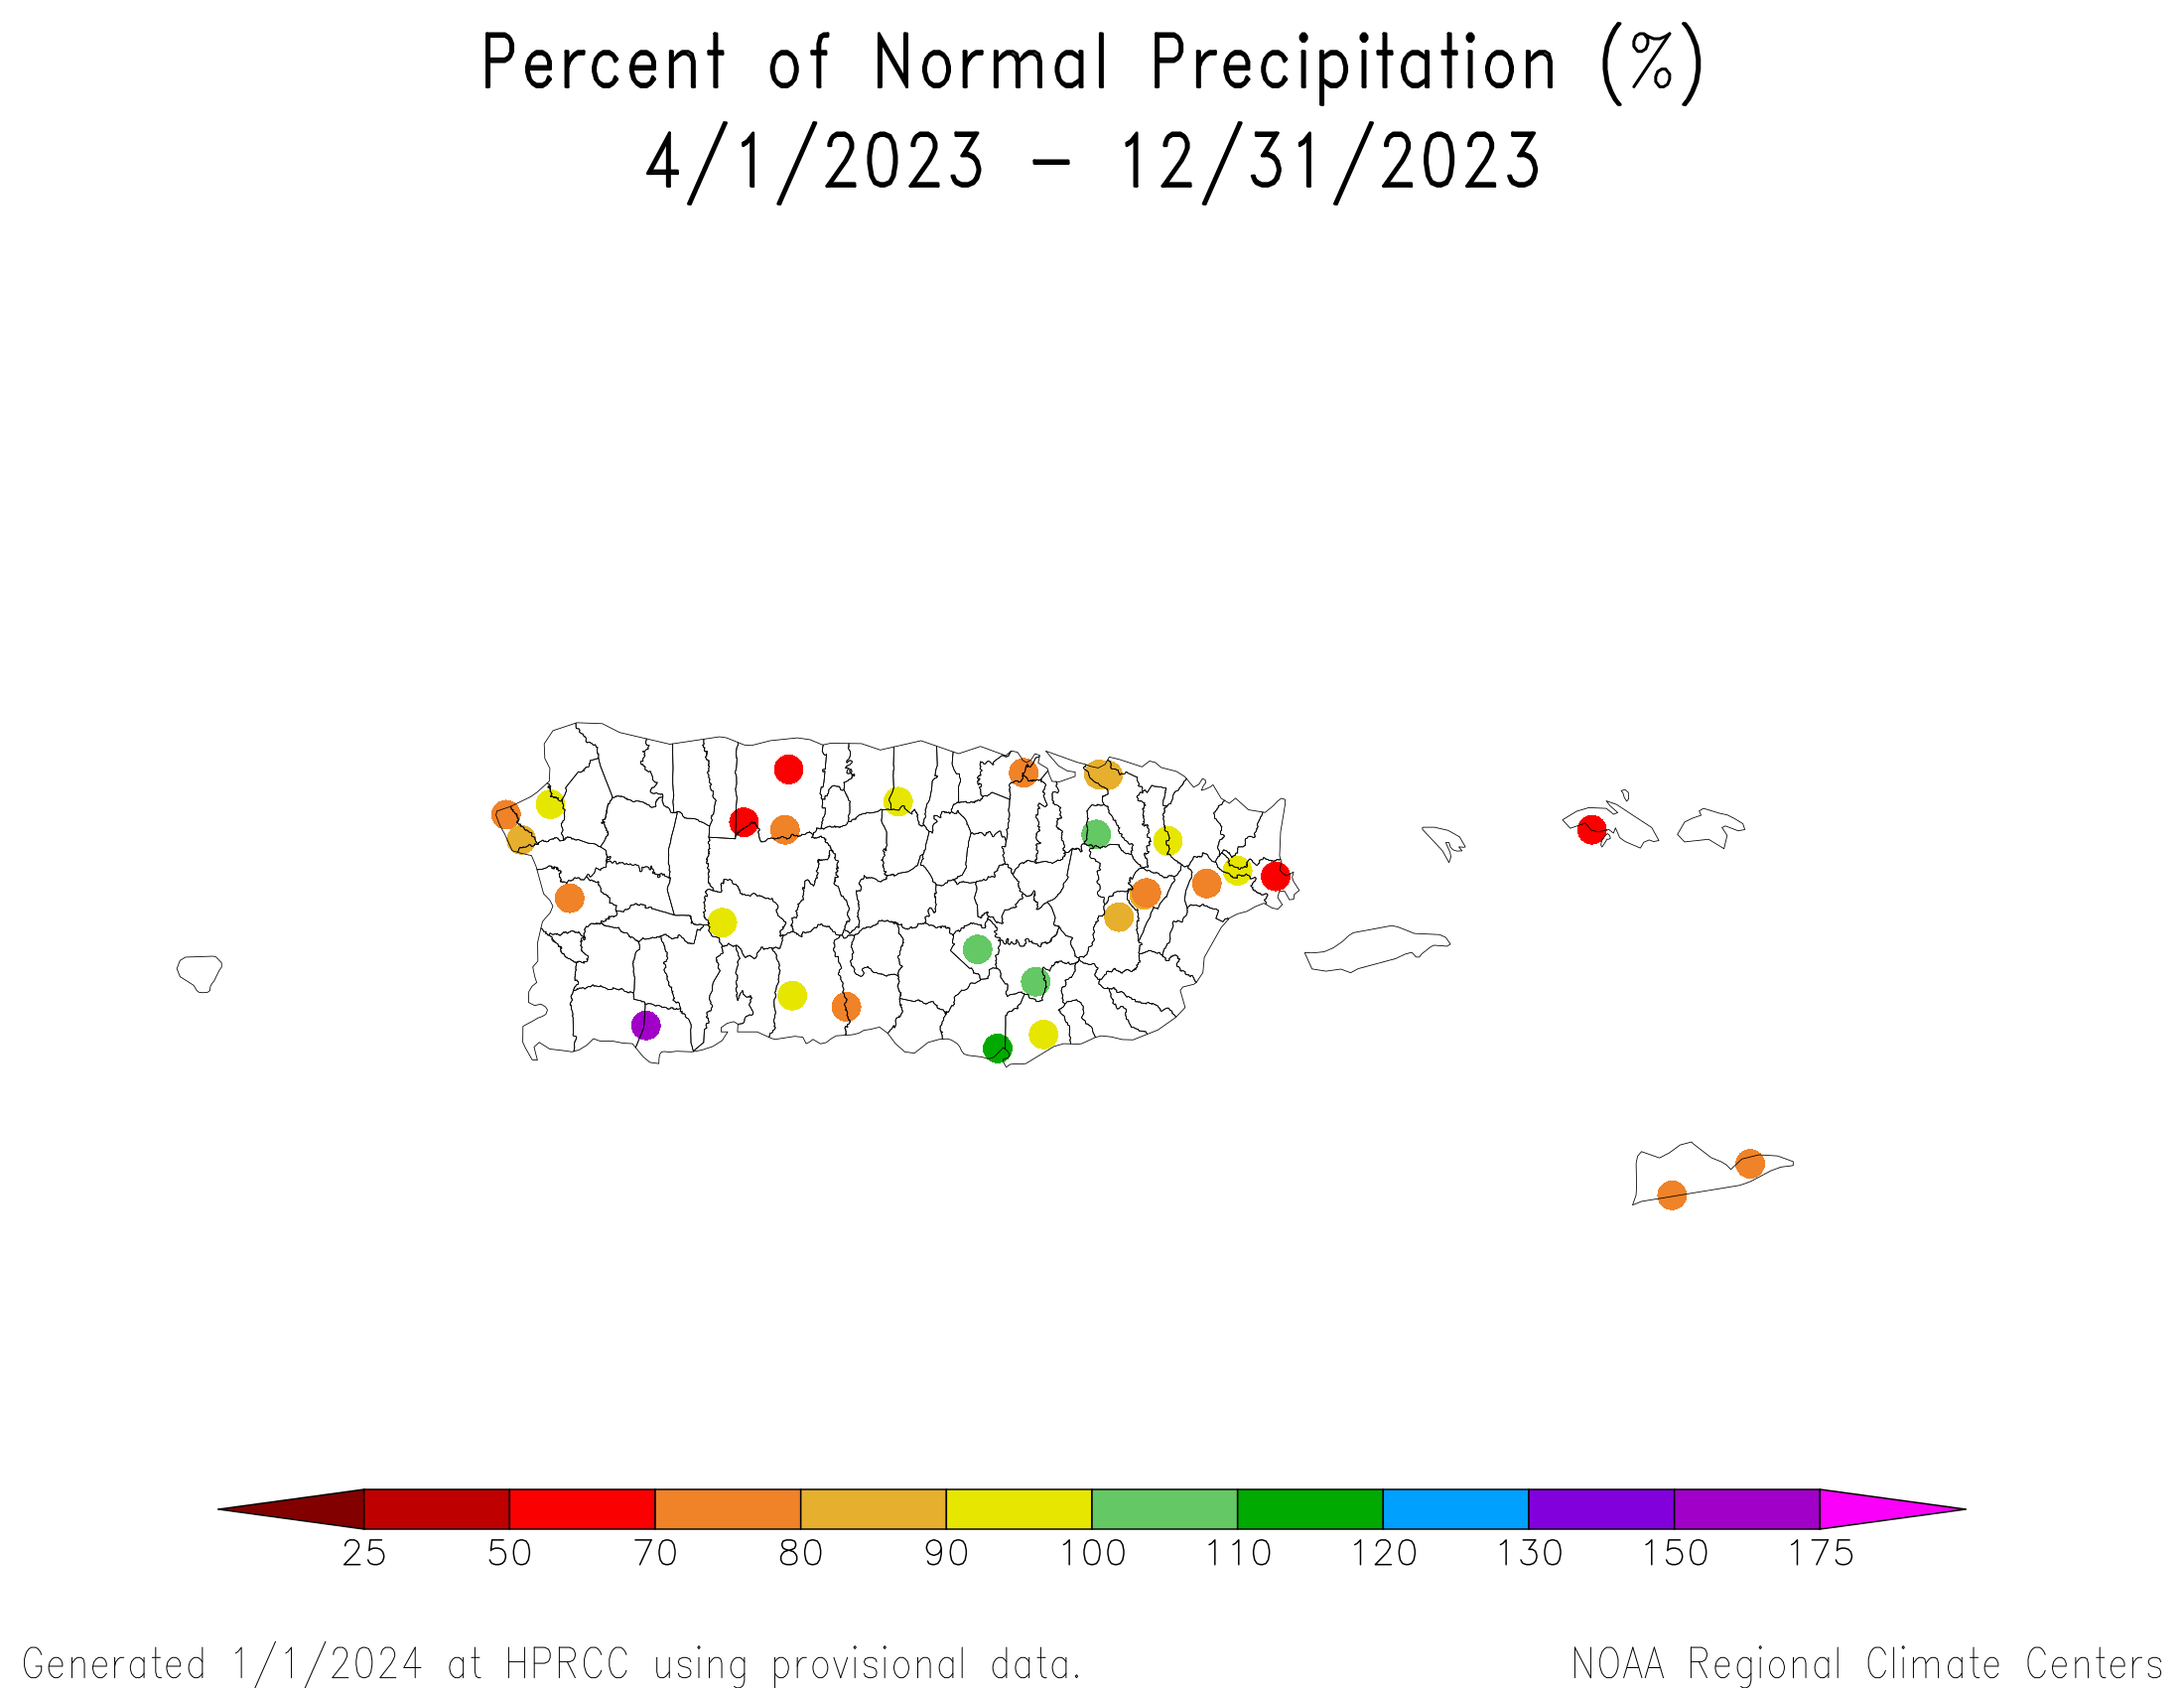
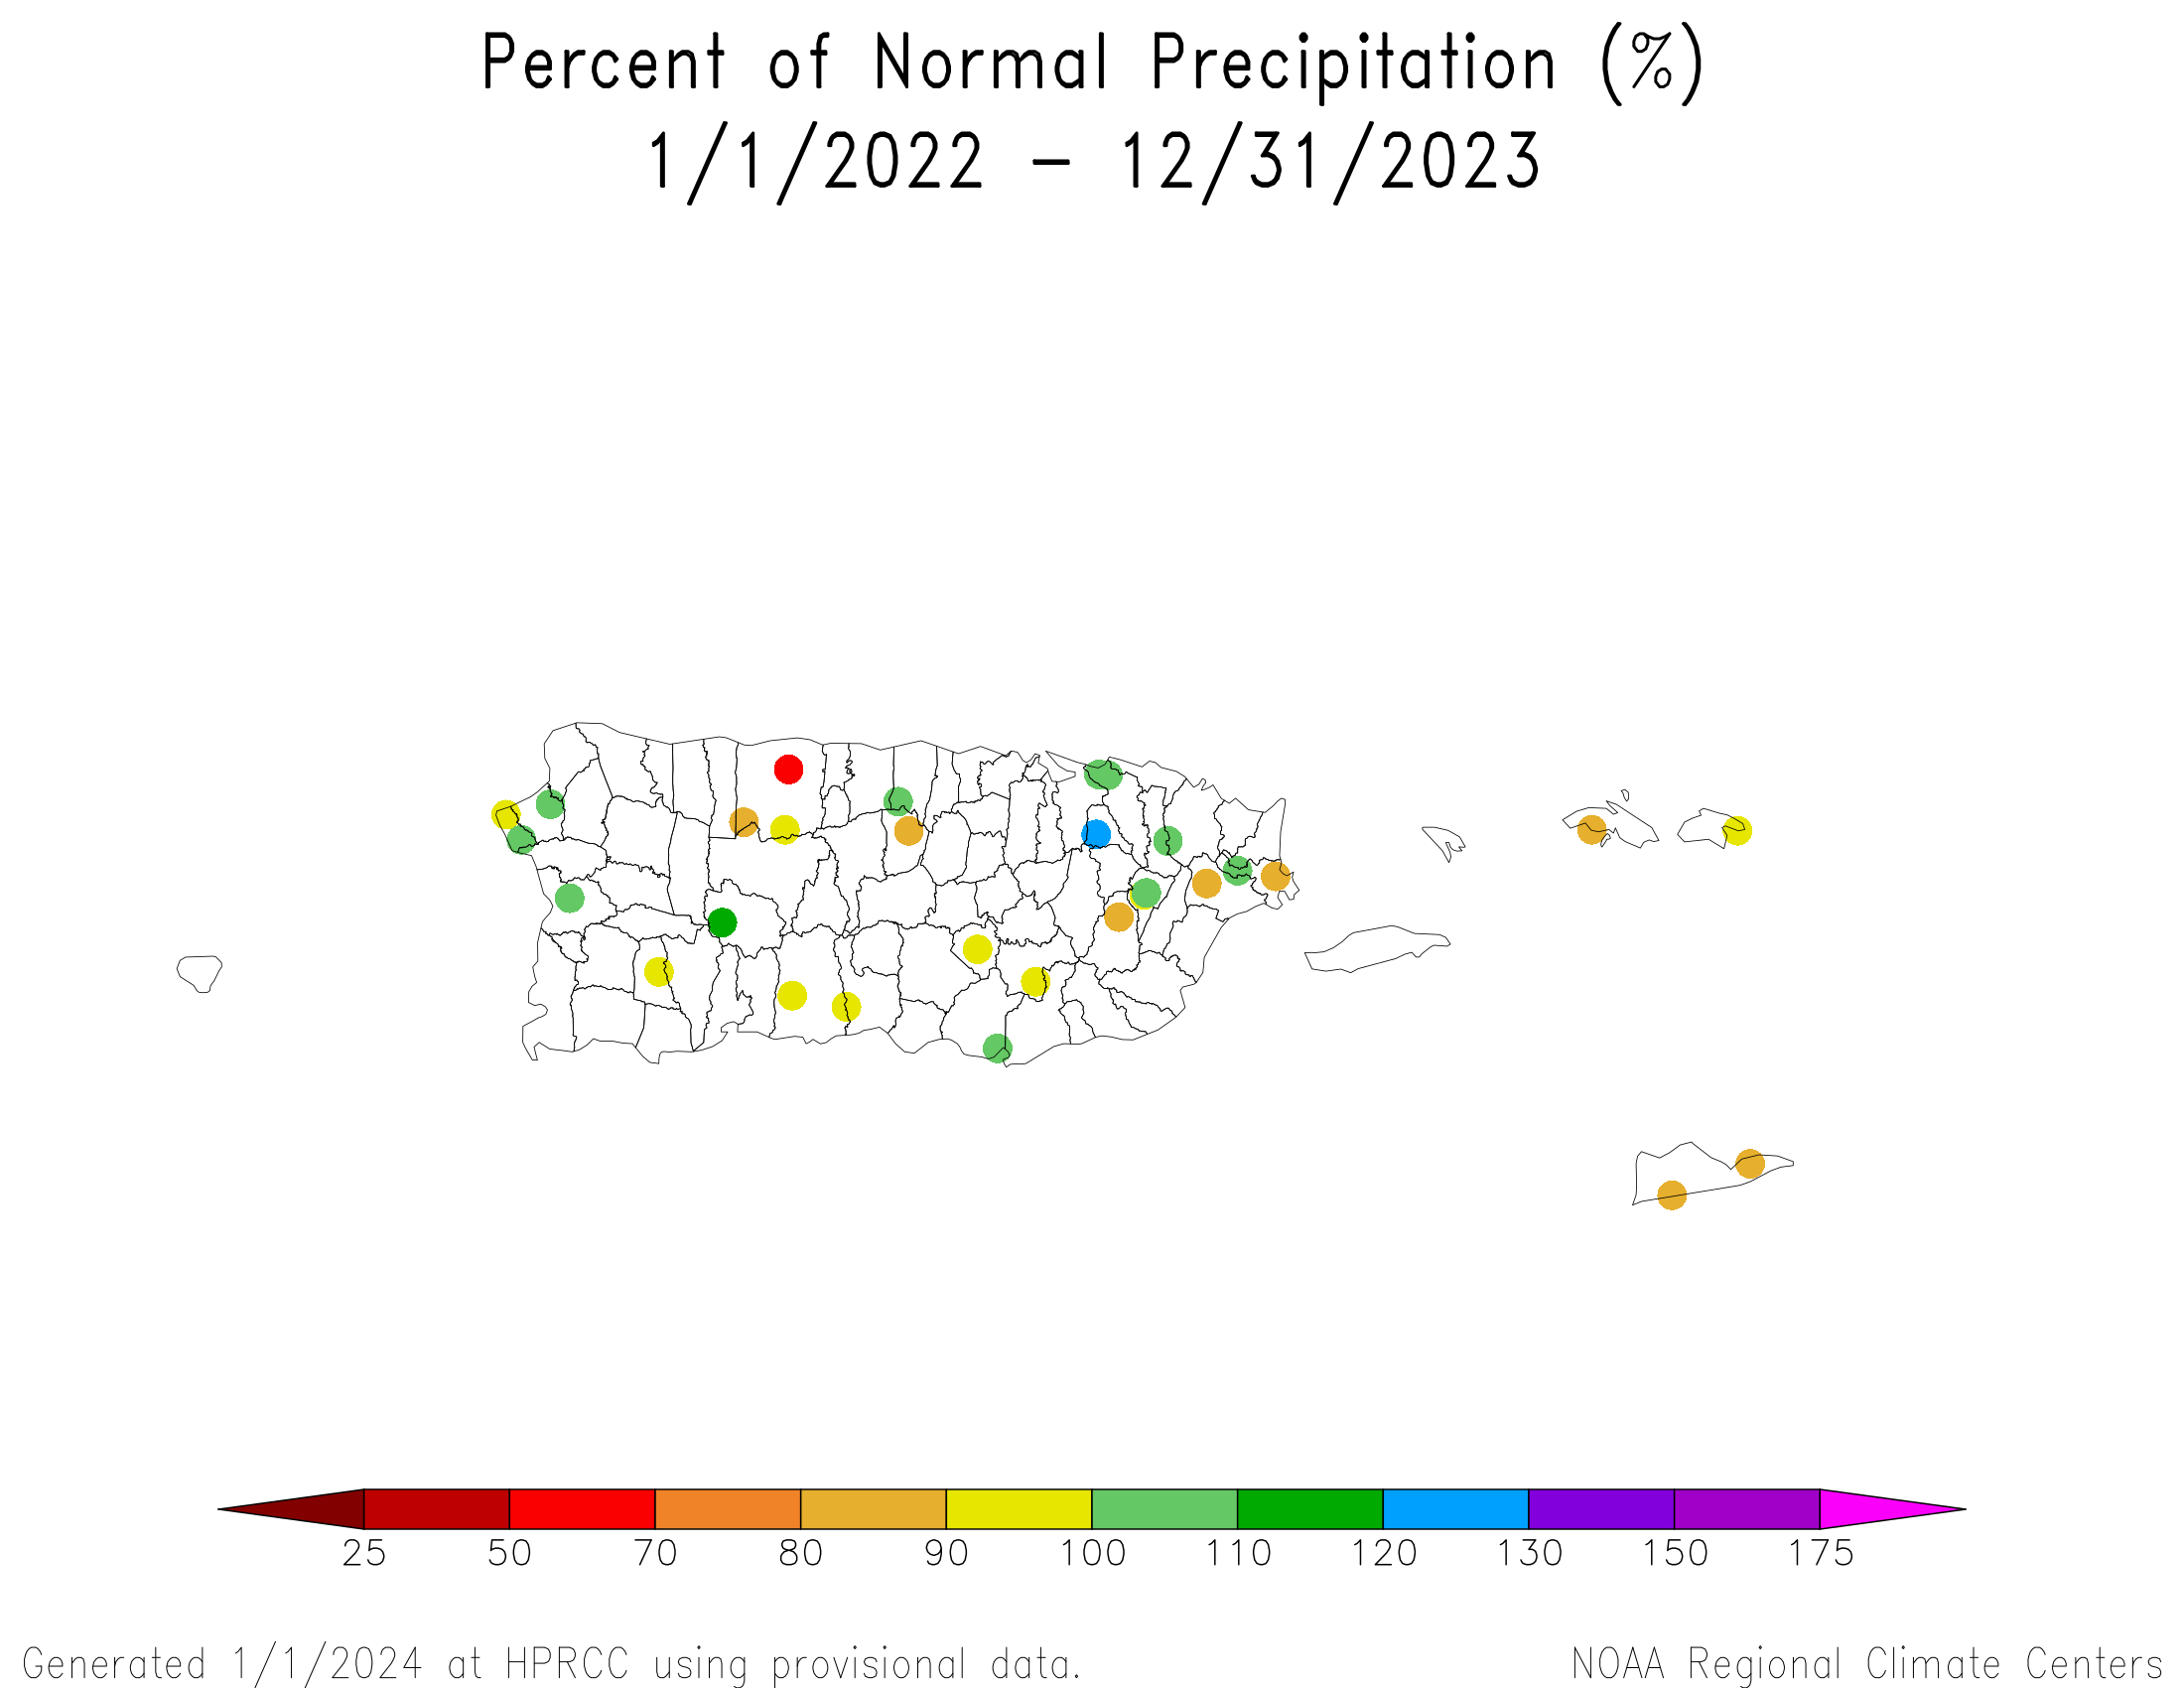
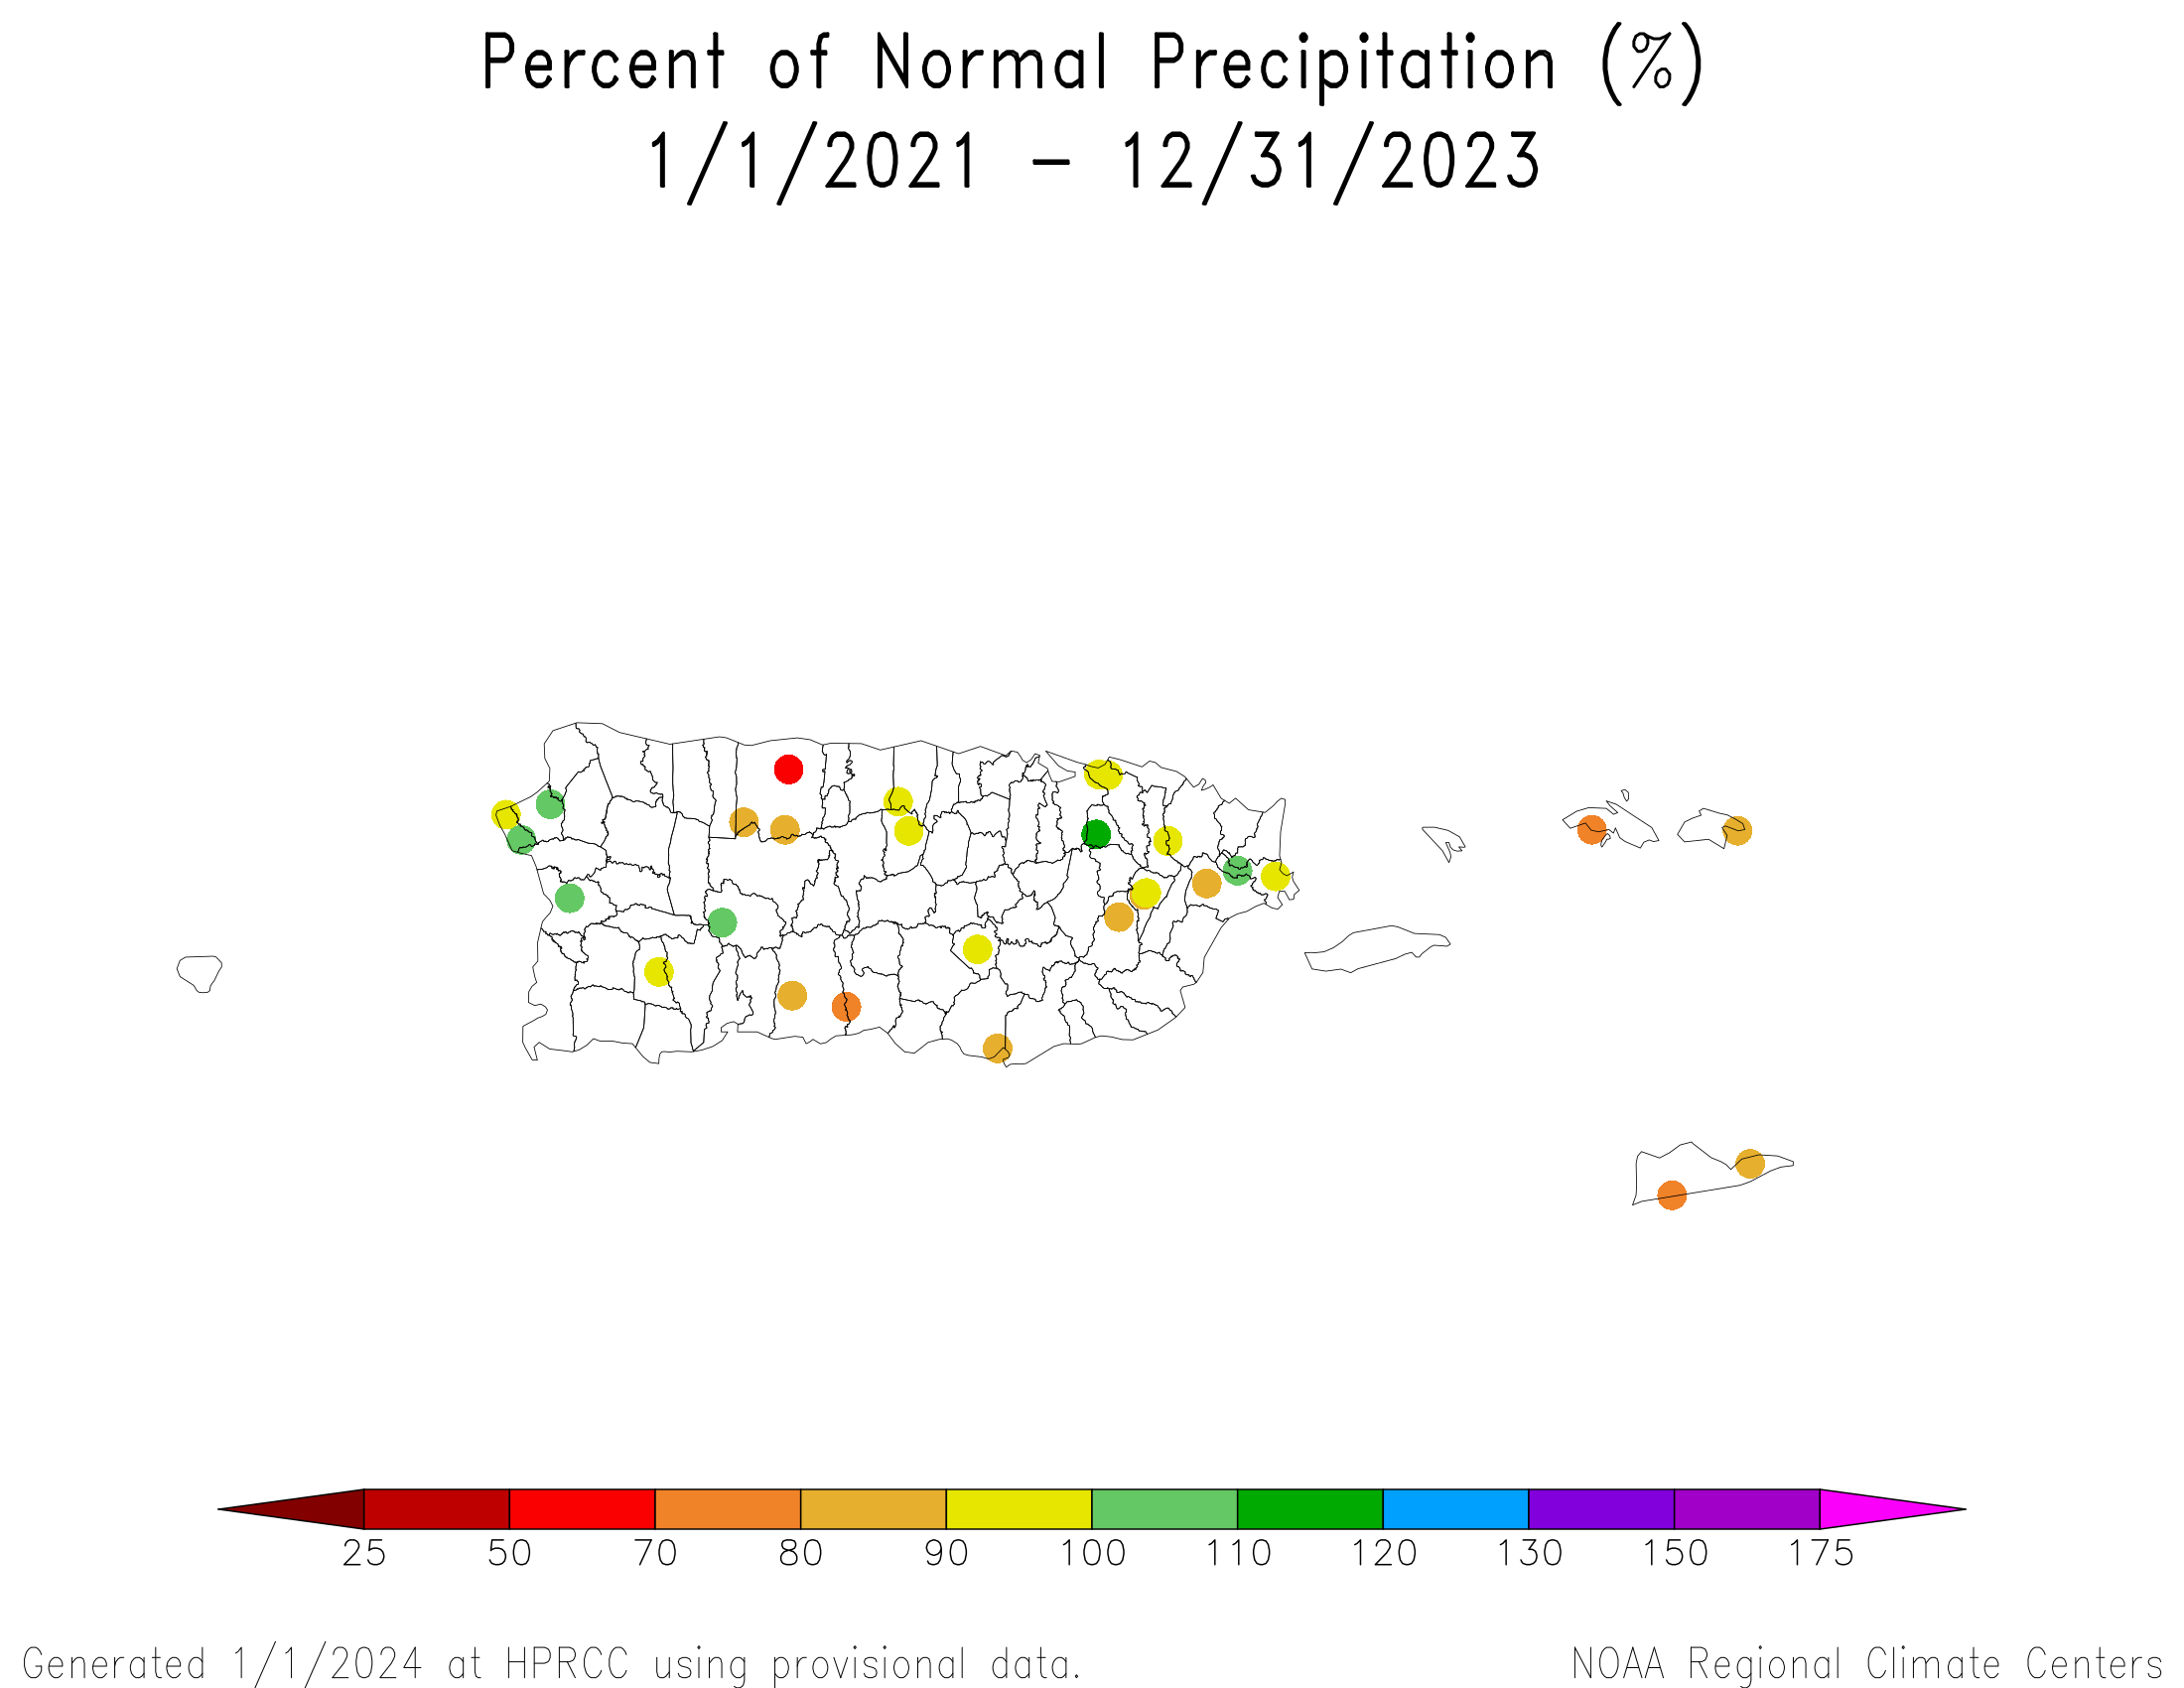
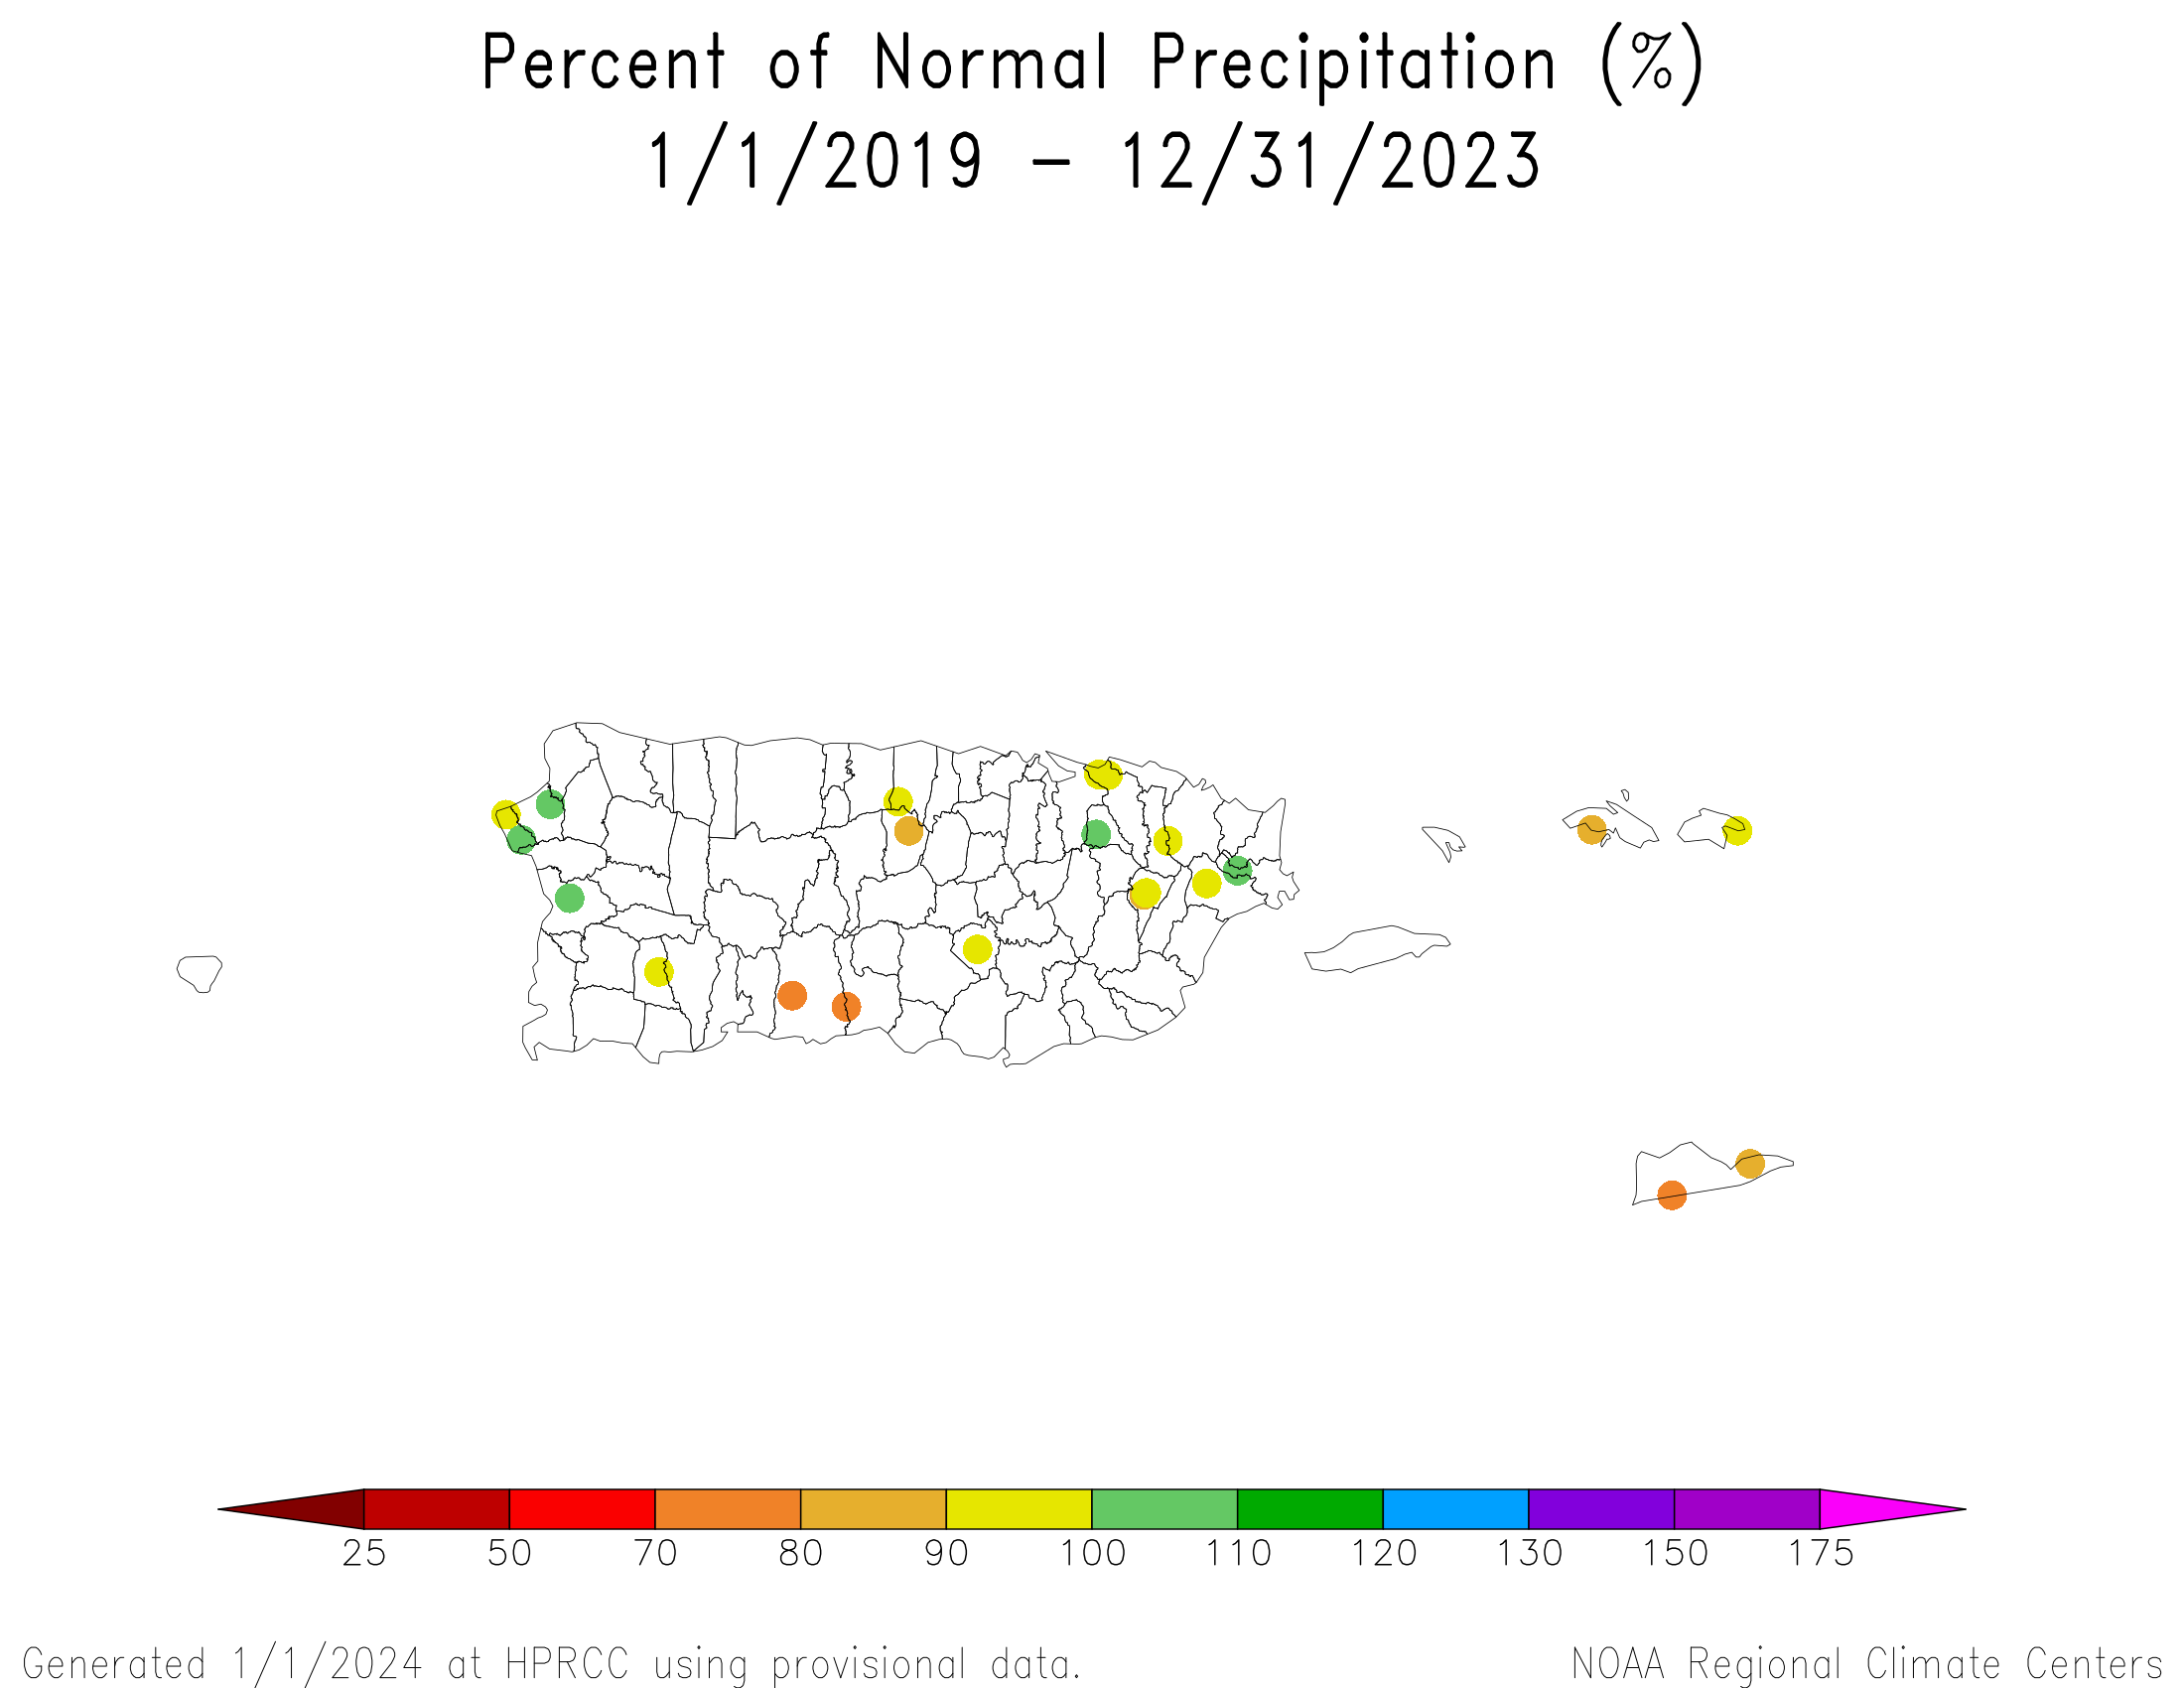
December 2023 was drier than normal across parts of Puerto Rico (PR) and southern parts of the U.S. Virgin Islands (USVI). Drier-than-normal conditions dominated at the 2-month time scale. A mixed precipitation anomaly pattern was evident at 3 months, but drier-than-normal conditions dominated again at the 4- to 12-month time scales. At longer time scales, the USVI was persistently drier than normal while a mixed anomaly pattern was evident across PR (radar-based precipitation anomaly estimates for the last 1, 2, 3, 6, and 12 months) (low elevation station precipitation anomaly maps for the last 1, 2, 3, 4, 6, 9, 12, 24, 36, 48, 60 months)
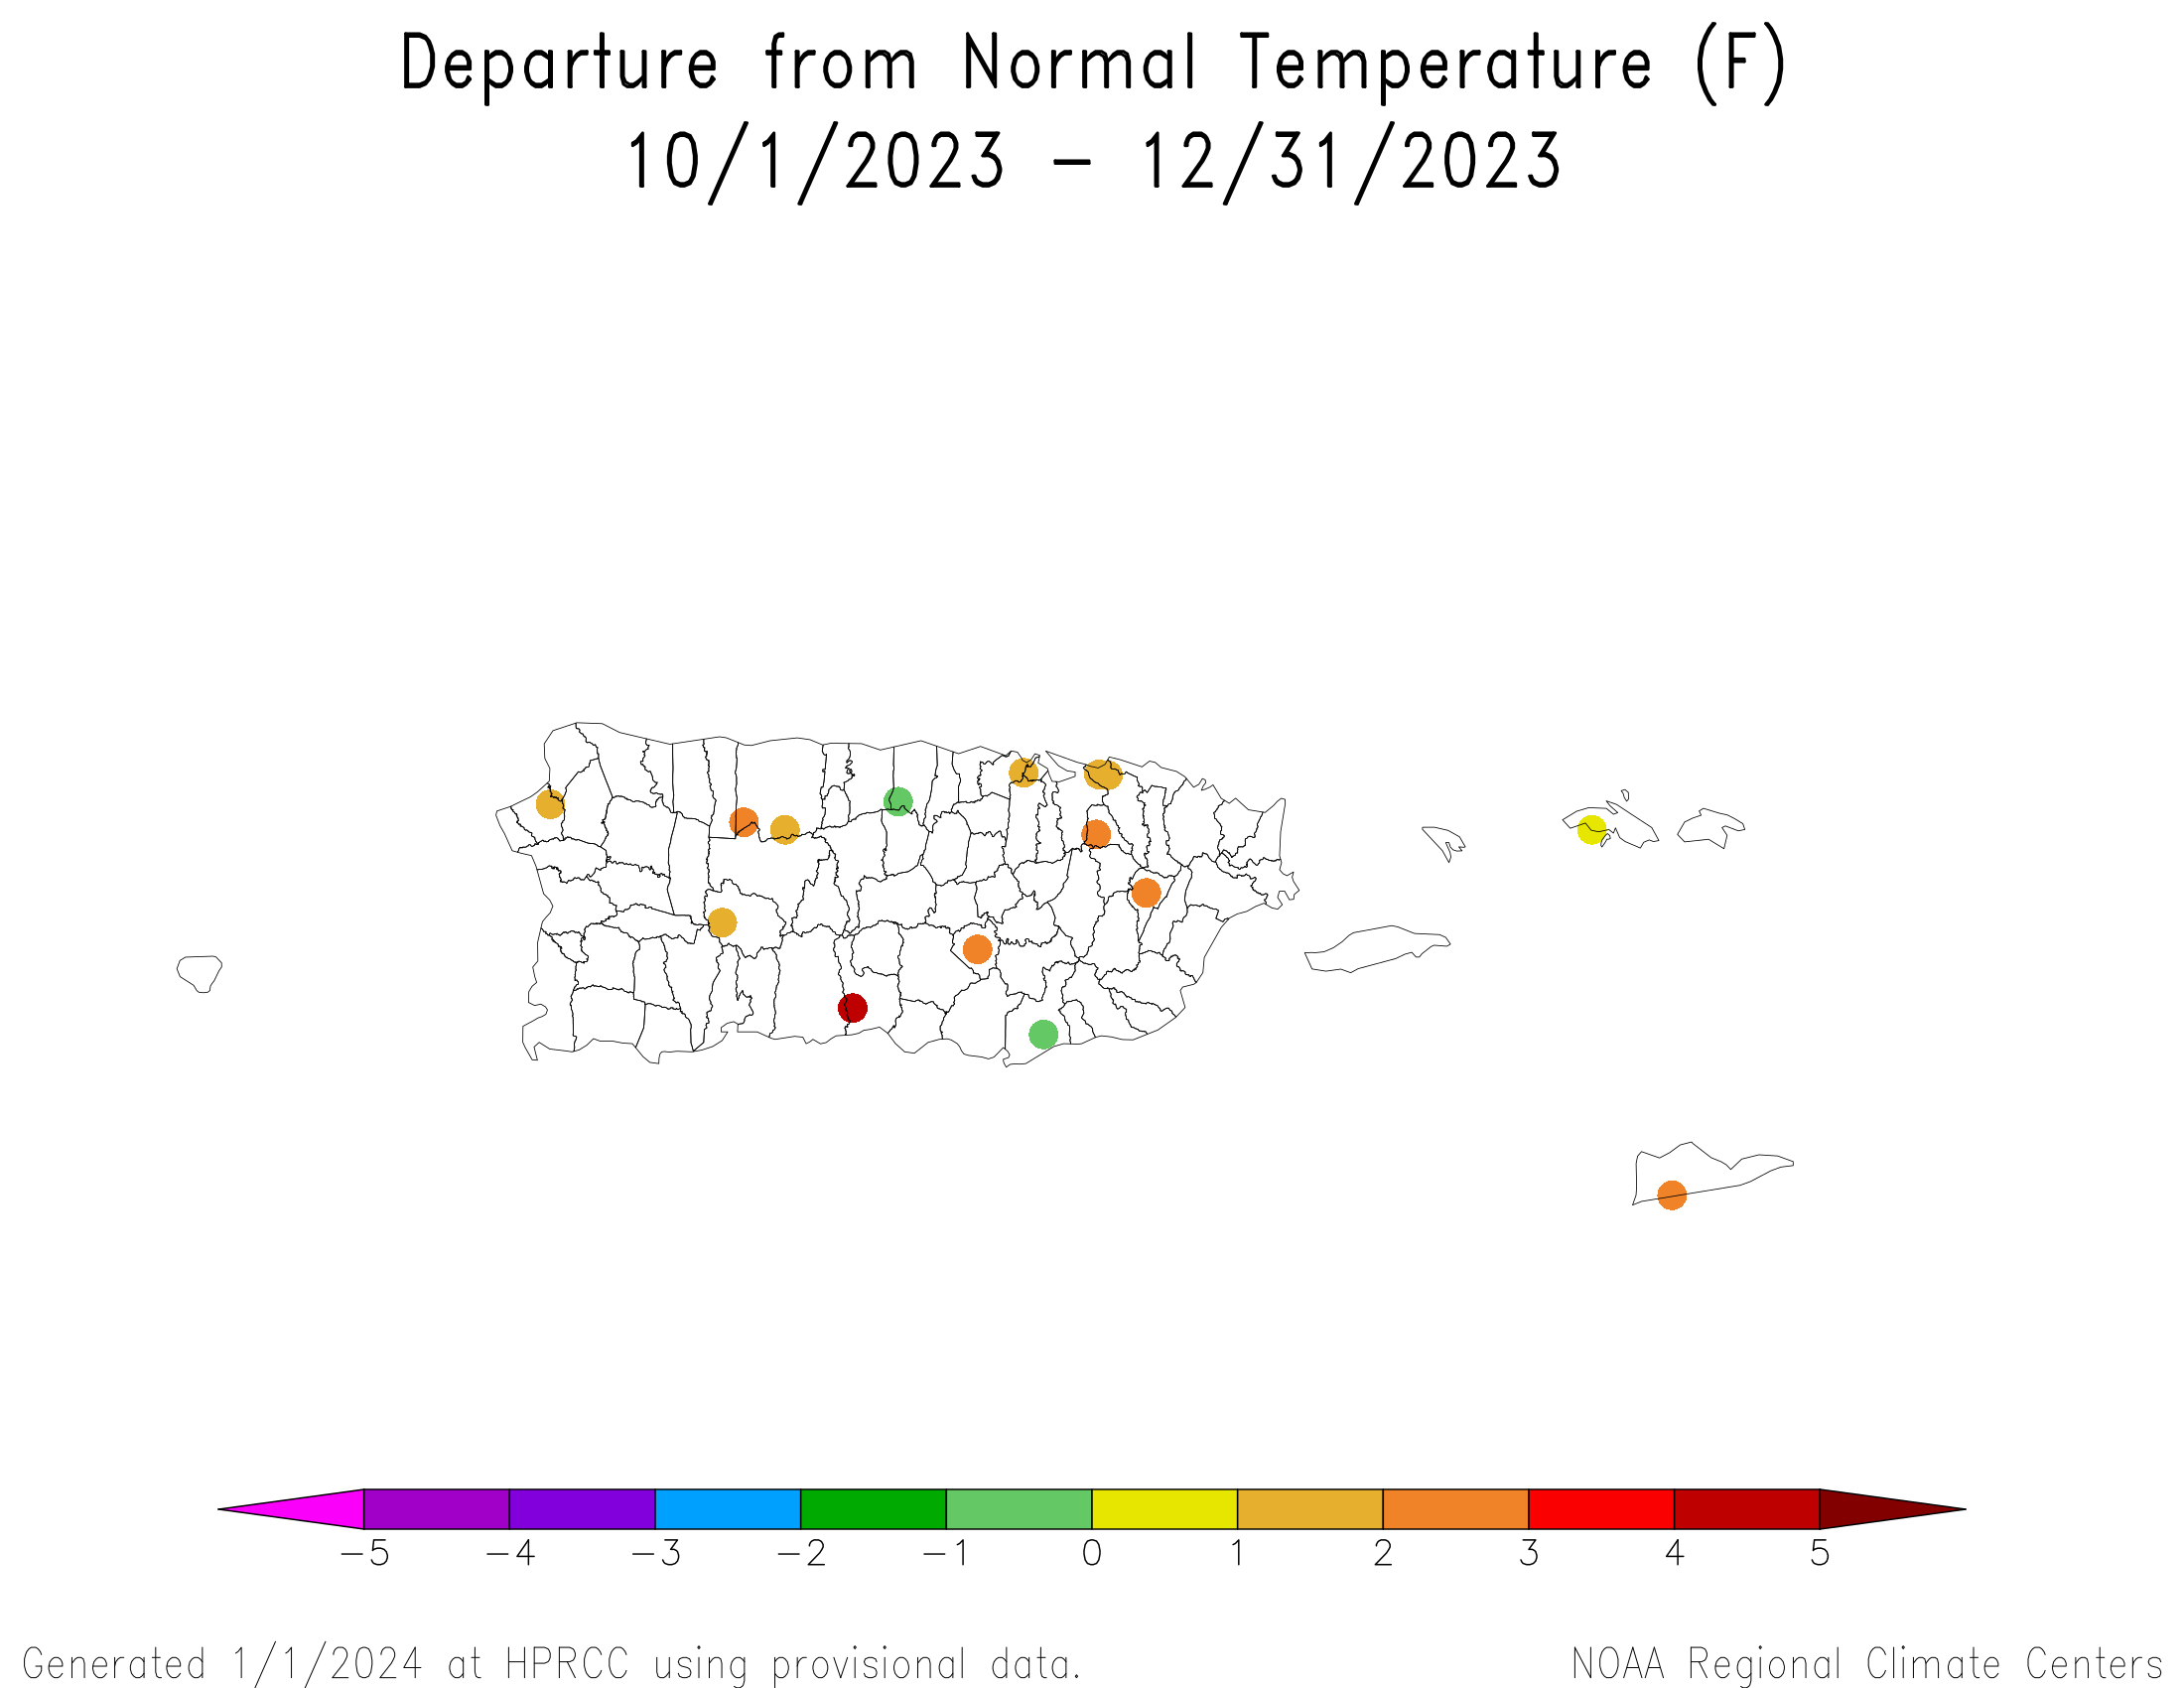
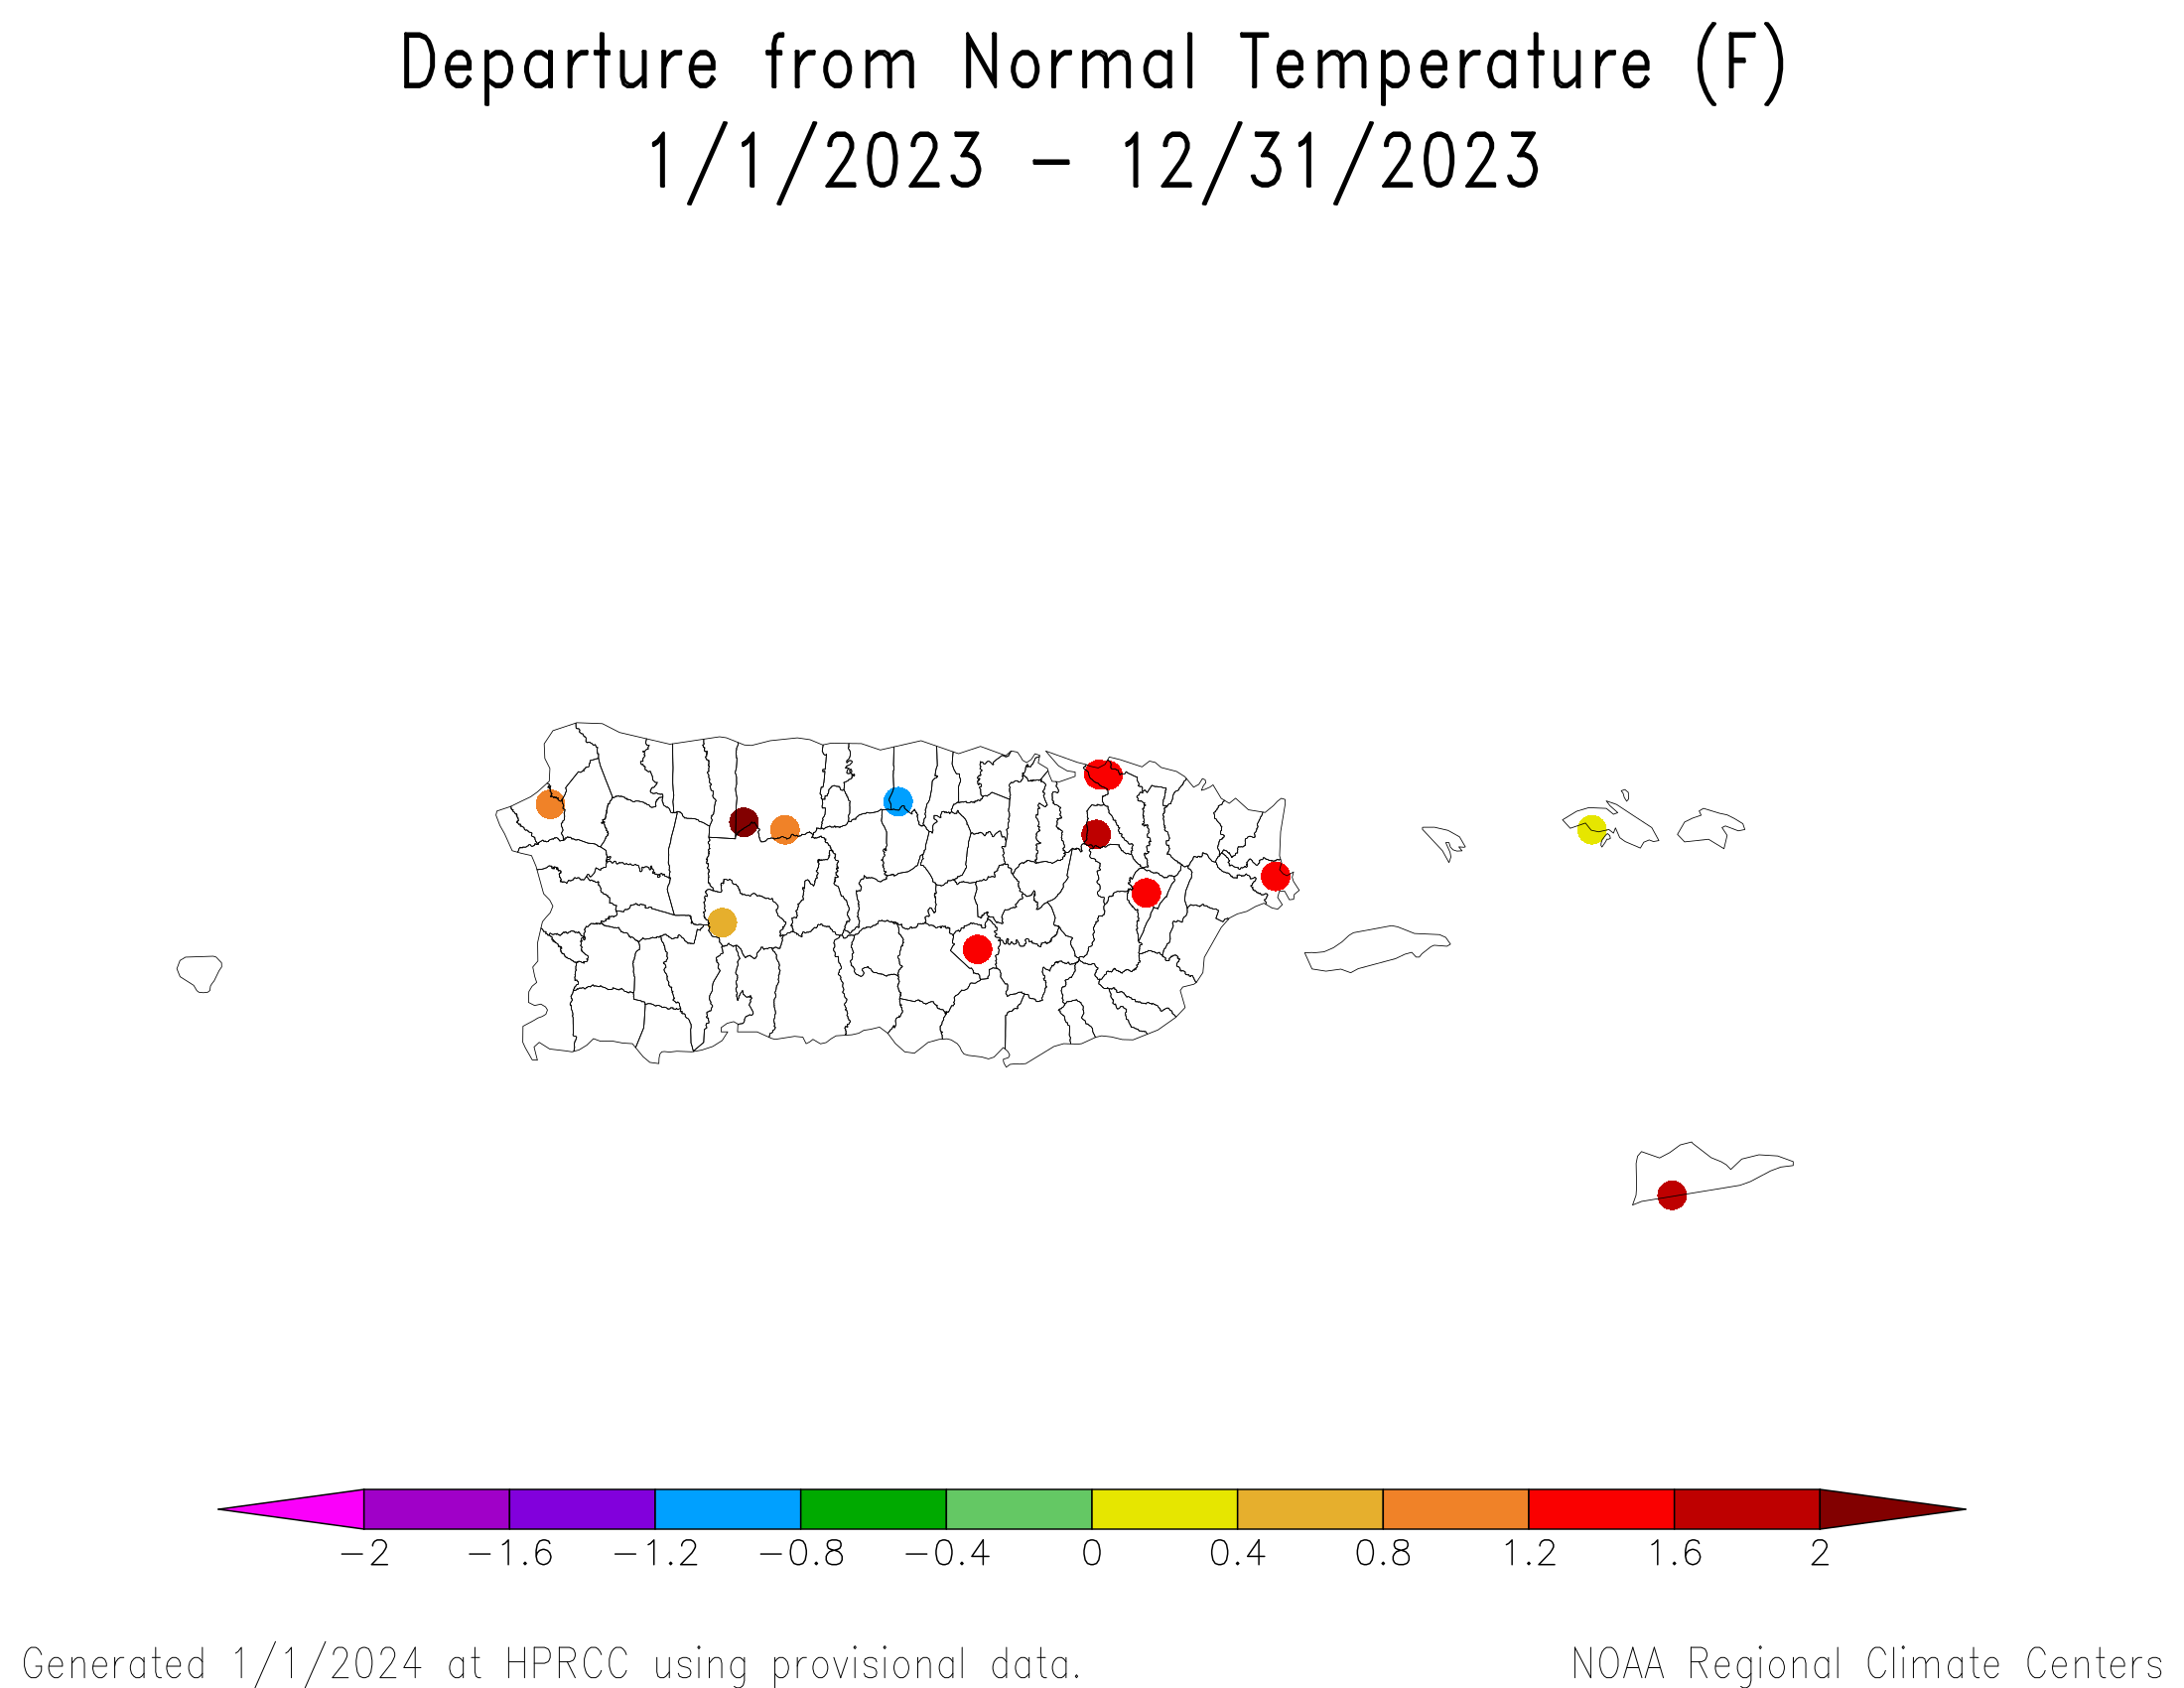
December was warmer than normal at most locations but cooler than normal at some stations in PR and the USVI. Temperatures were consistently warmer than normal at longer time scales (low elevation station temperature anomaly maps for the last 1, 2, 3, 4, 12 months).
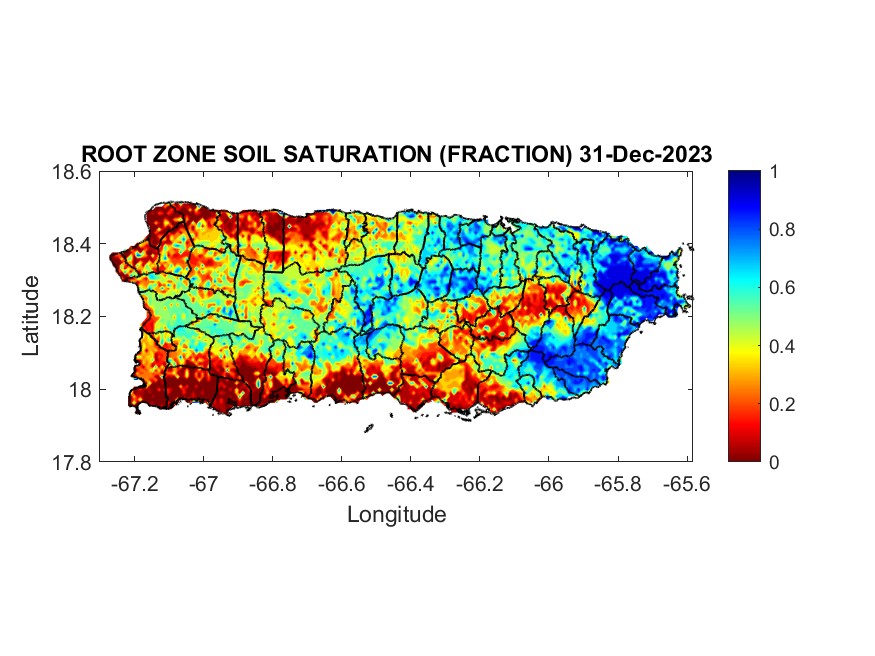
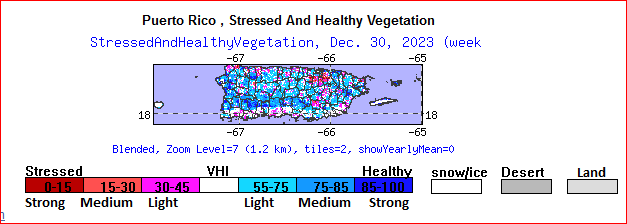
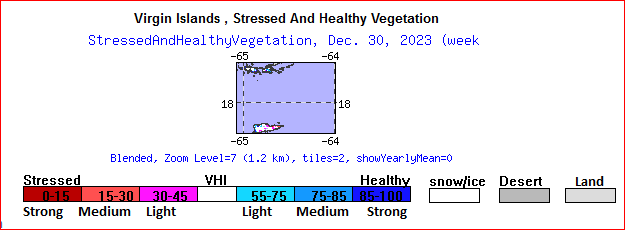
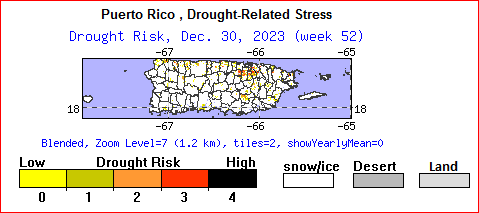
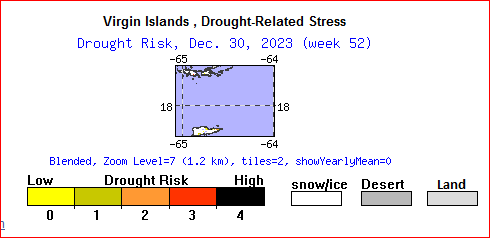
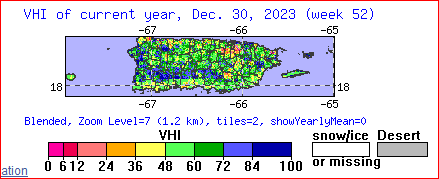
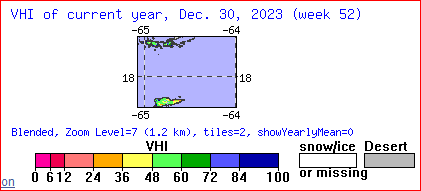
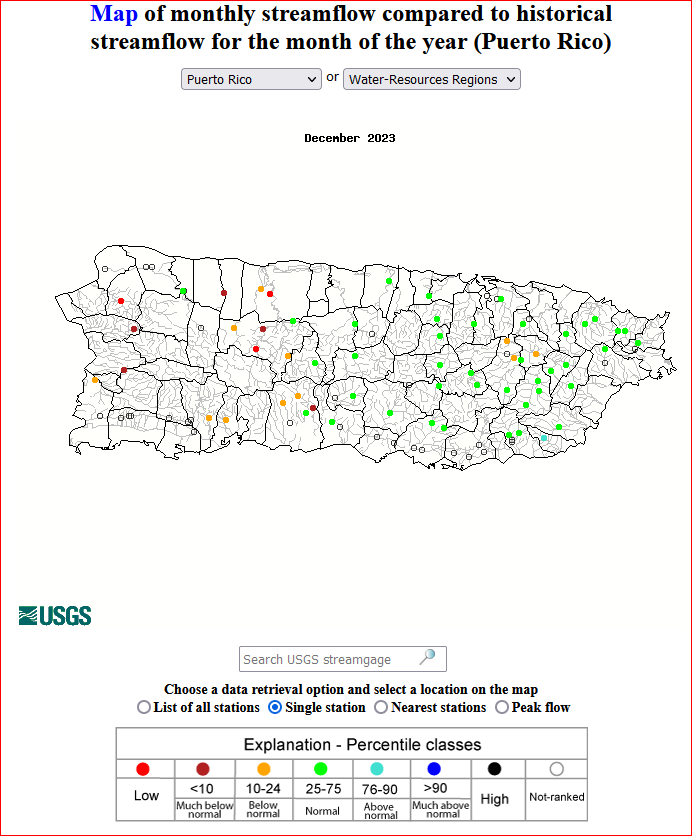
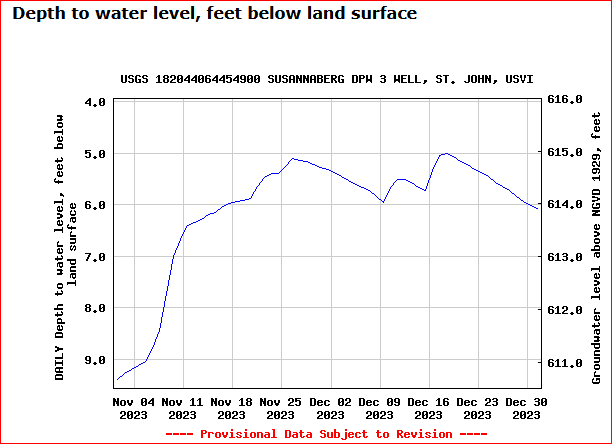
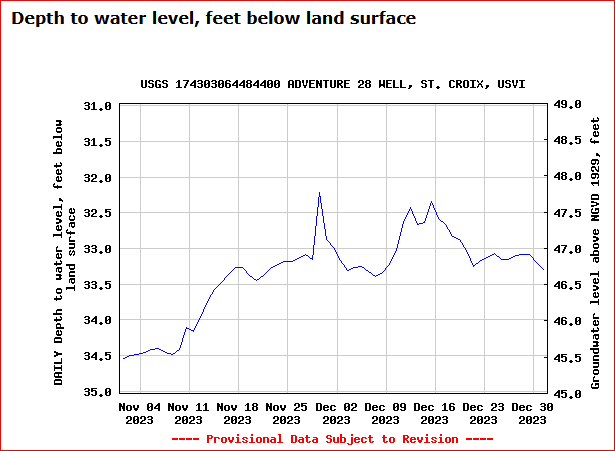
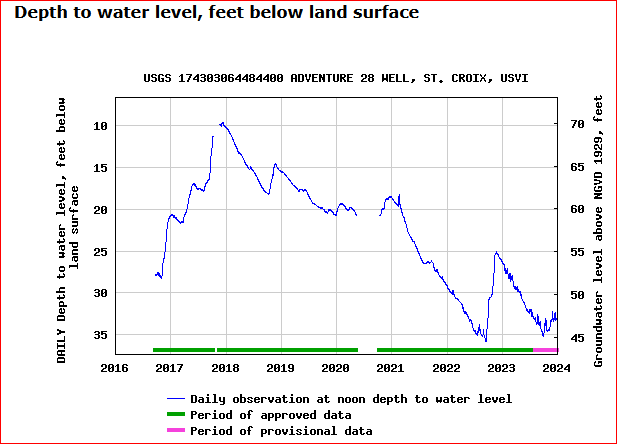
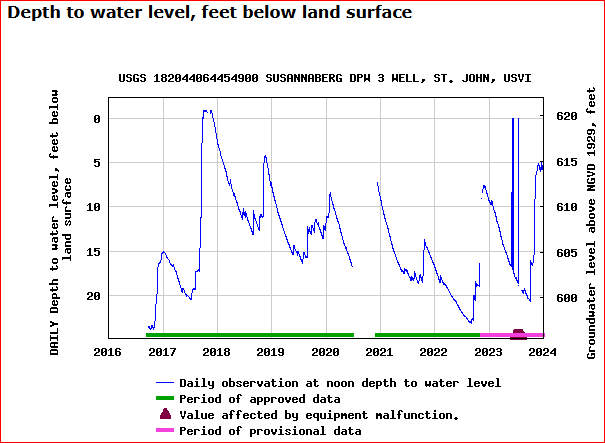
Root zone analyses indicated that soil conditions were dry along the southern and northwestern coasts of PR and in the eastern interior (root zone soil saturation fraction). Satellite observations of vegetative health (stressed vegetation for PR and USVI, drought stress for PR and USVI, VHI for PR and USVI) revealed a few areas of stressed vegetation on PR and the USVI. Monthly streamflow on PR showed below-normal streams in western areas. In the USVI, groundwater levels generally held steady during the first half of December but then consistently declined during the second half on all 3 islands (St. John, St. Croix, St. Thomas). The end-of-December groundwater level continued well in the bottom third of the historical record at St. Croix, but was in the upper third at St. John.
In the USVI, short- and long-term moderate drought (D1) continued on St. Croix, long-term severe drought continued on St. Thomas, and St. John continued free of drought and abnormal dryness. On PR, moderate drought expanded slightly to cover about 4.8% of the territory on the January 2, 2024 USDM map.
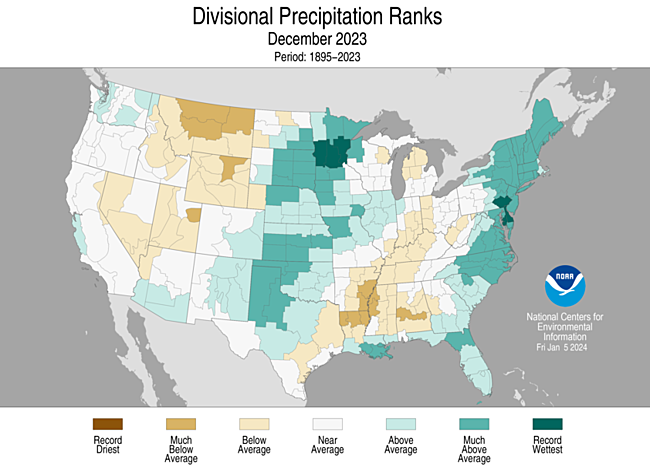
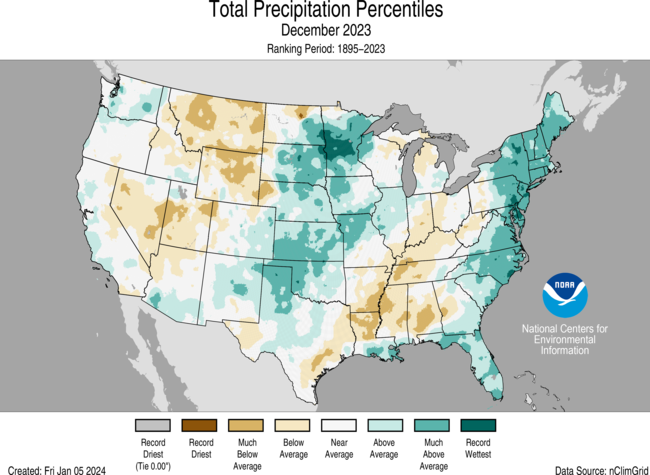
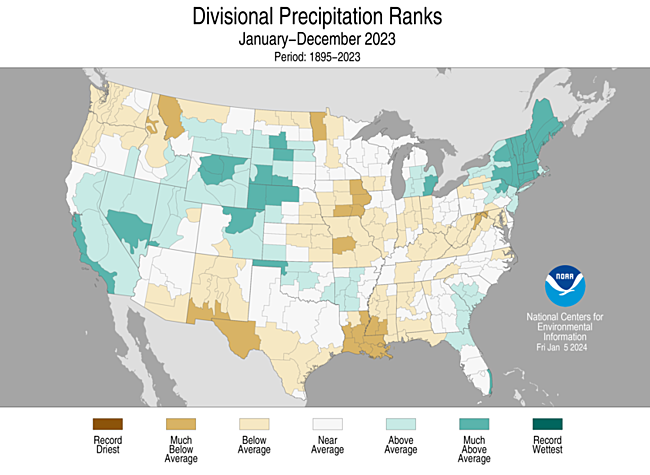
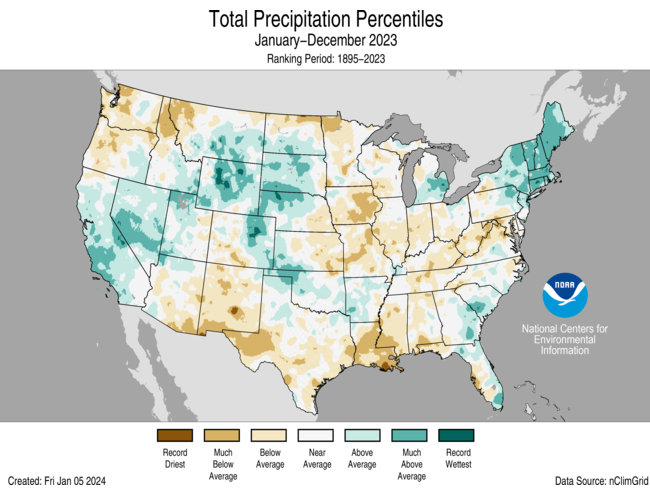
CONUS State Precipitation Ranks
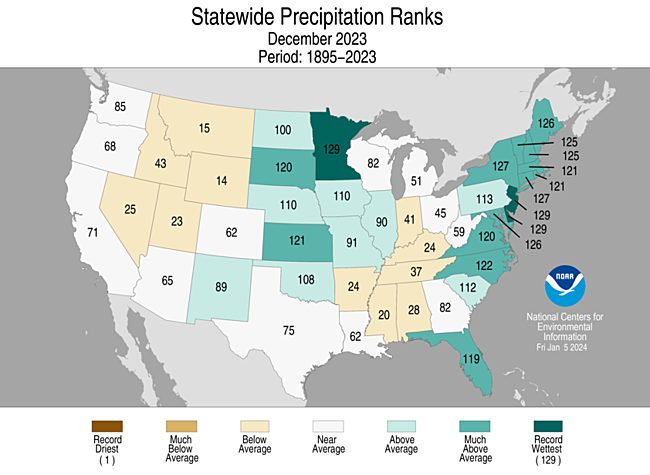
December 2023 was drier than normal across much of the West from the Great Basin to northern High Plains, from the western Gulf of Mexico coast to the Ohio Valley, and in parts of the Great Lakes. Eleven states had a precipitation rank in the driest third of the 129-year historical record for December, but none ranked in the top ten driest category.
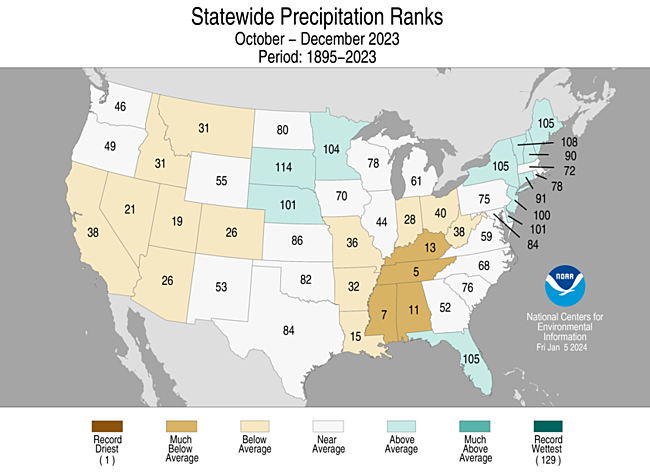
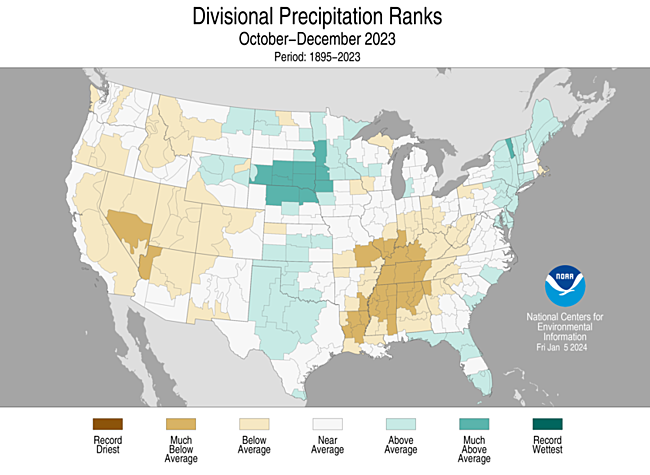
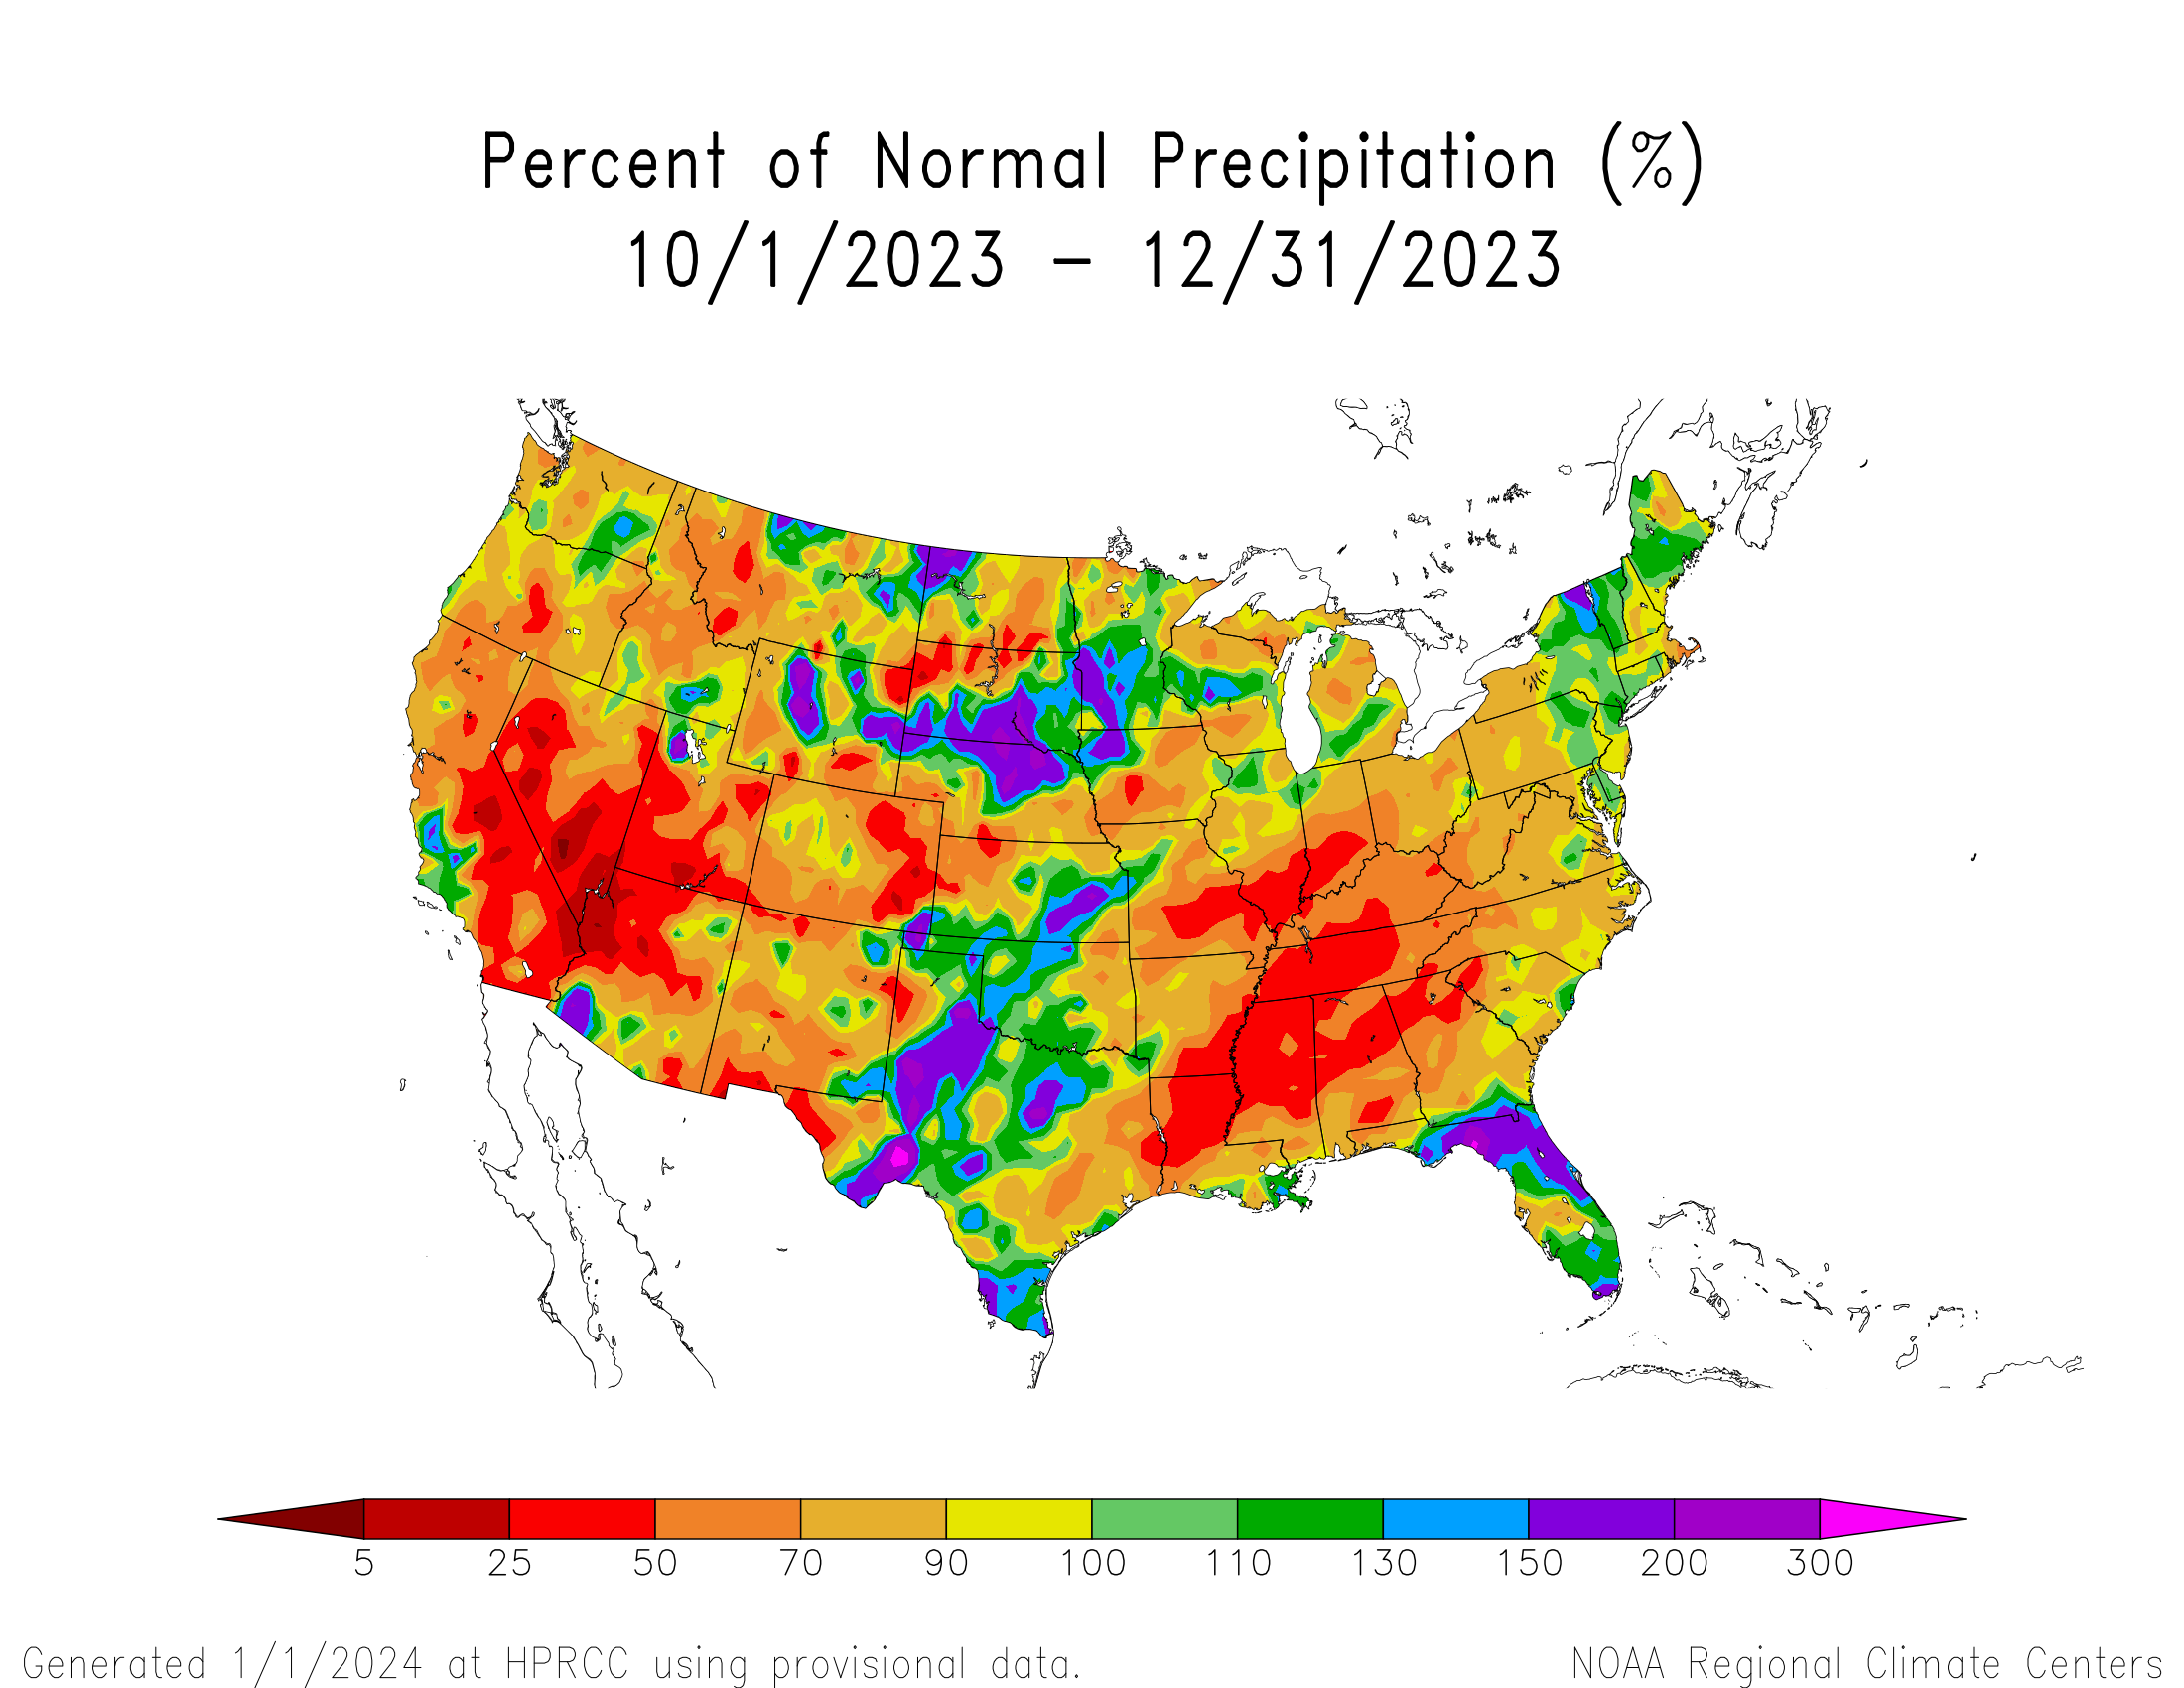
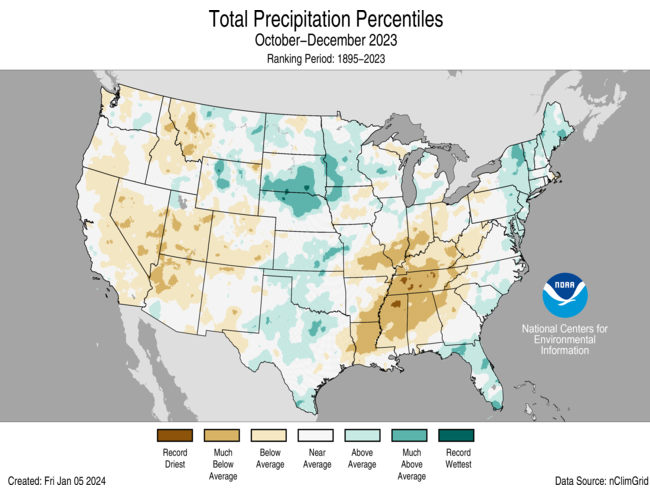
October-December 2023 was drier than normal across much of the CONUS from the Mississippi River to the East Coast, much of the West, and parts of the Great Plains, with record dryness locally in parts of the Tennessee Valley. Seventeen states had a precipitation rank in the driest third of the 1895-2023 historical record for October-December, including two that ranked in the top ten driest category — Tennessee (fifth driest) and Mississippi (seventh driest) — and two that were close: Alabama (11th driest) and Kentucky (13th driest).
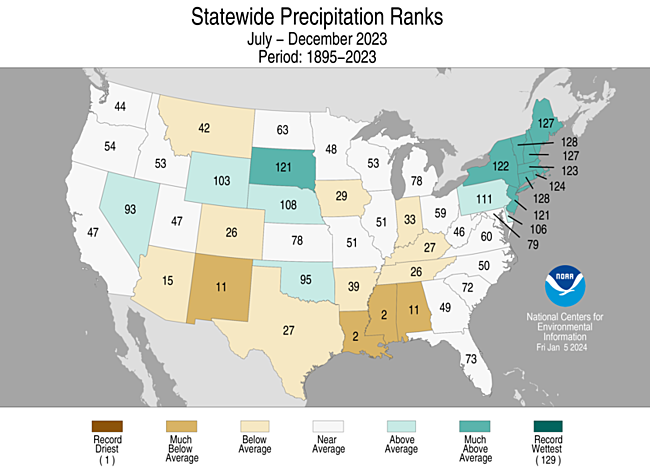
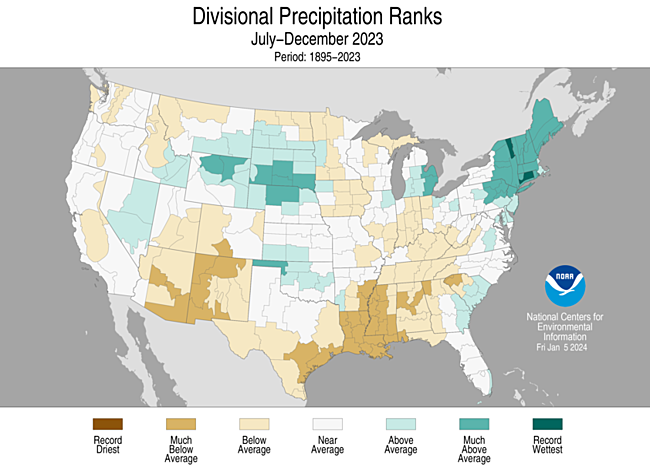
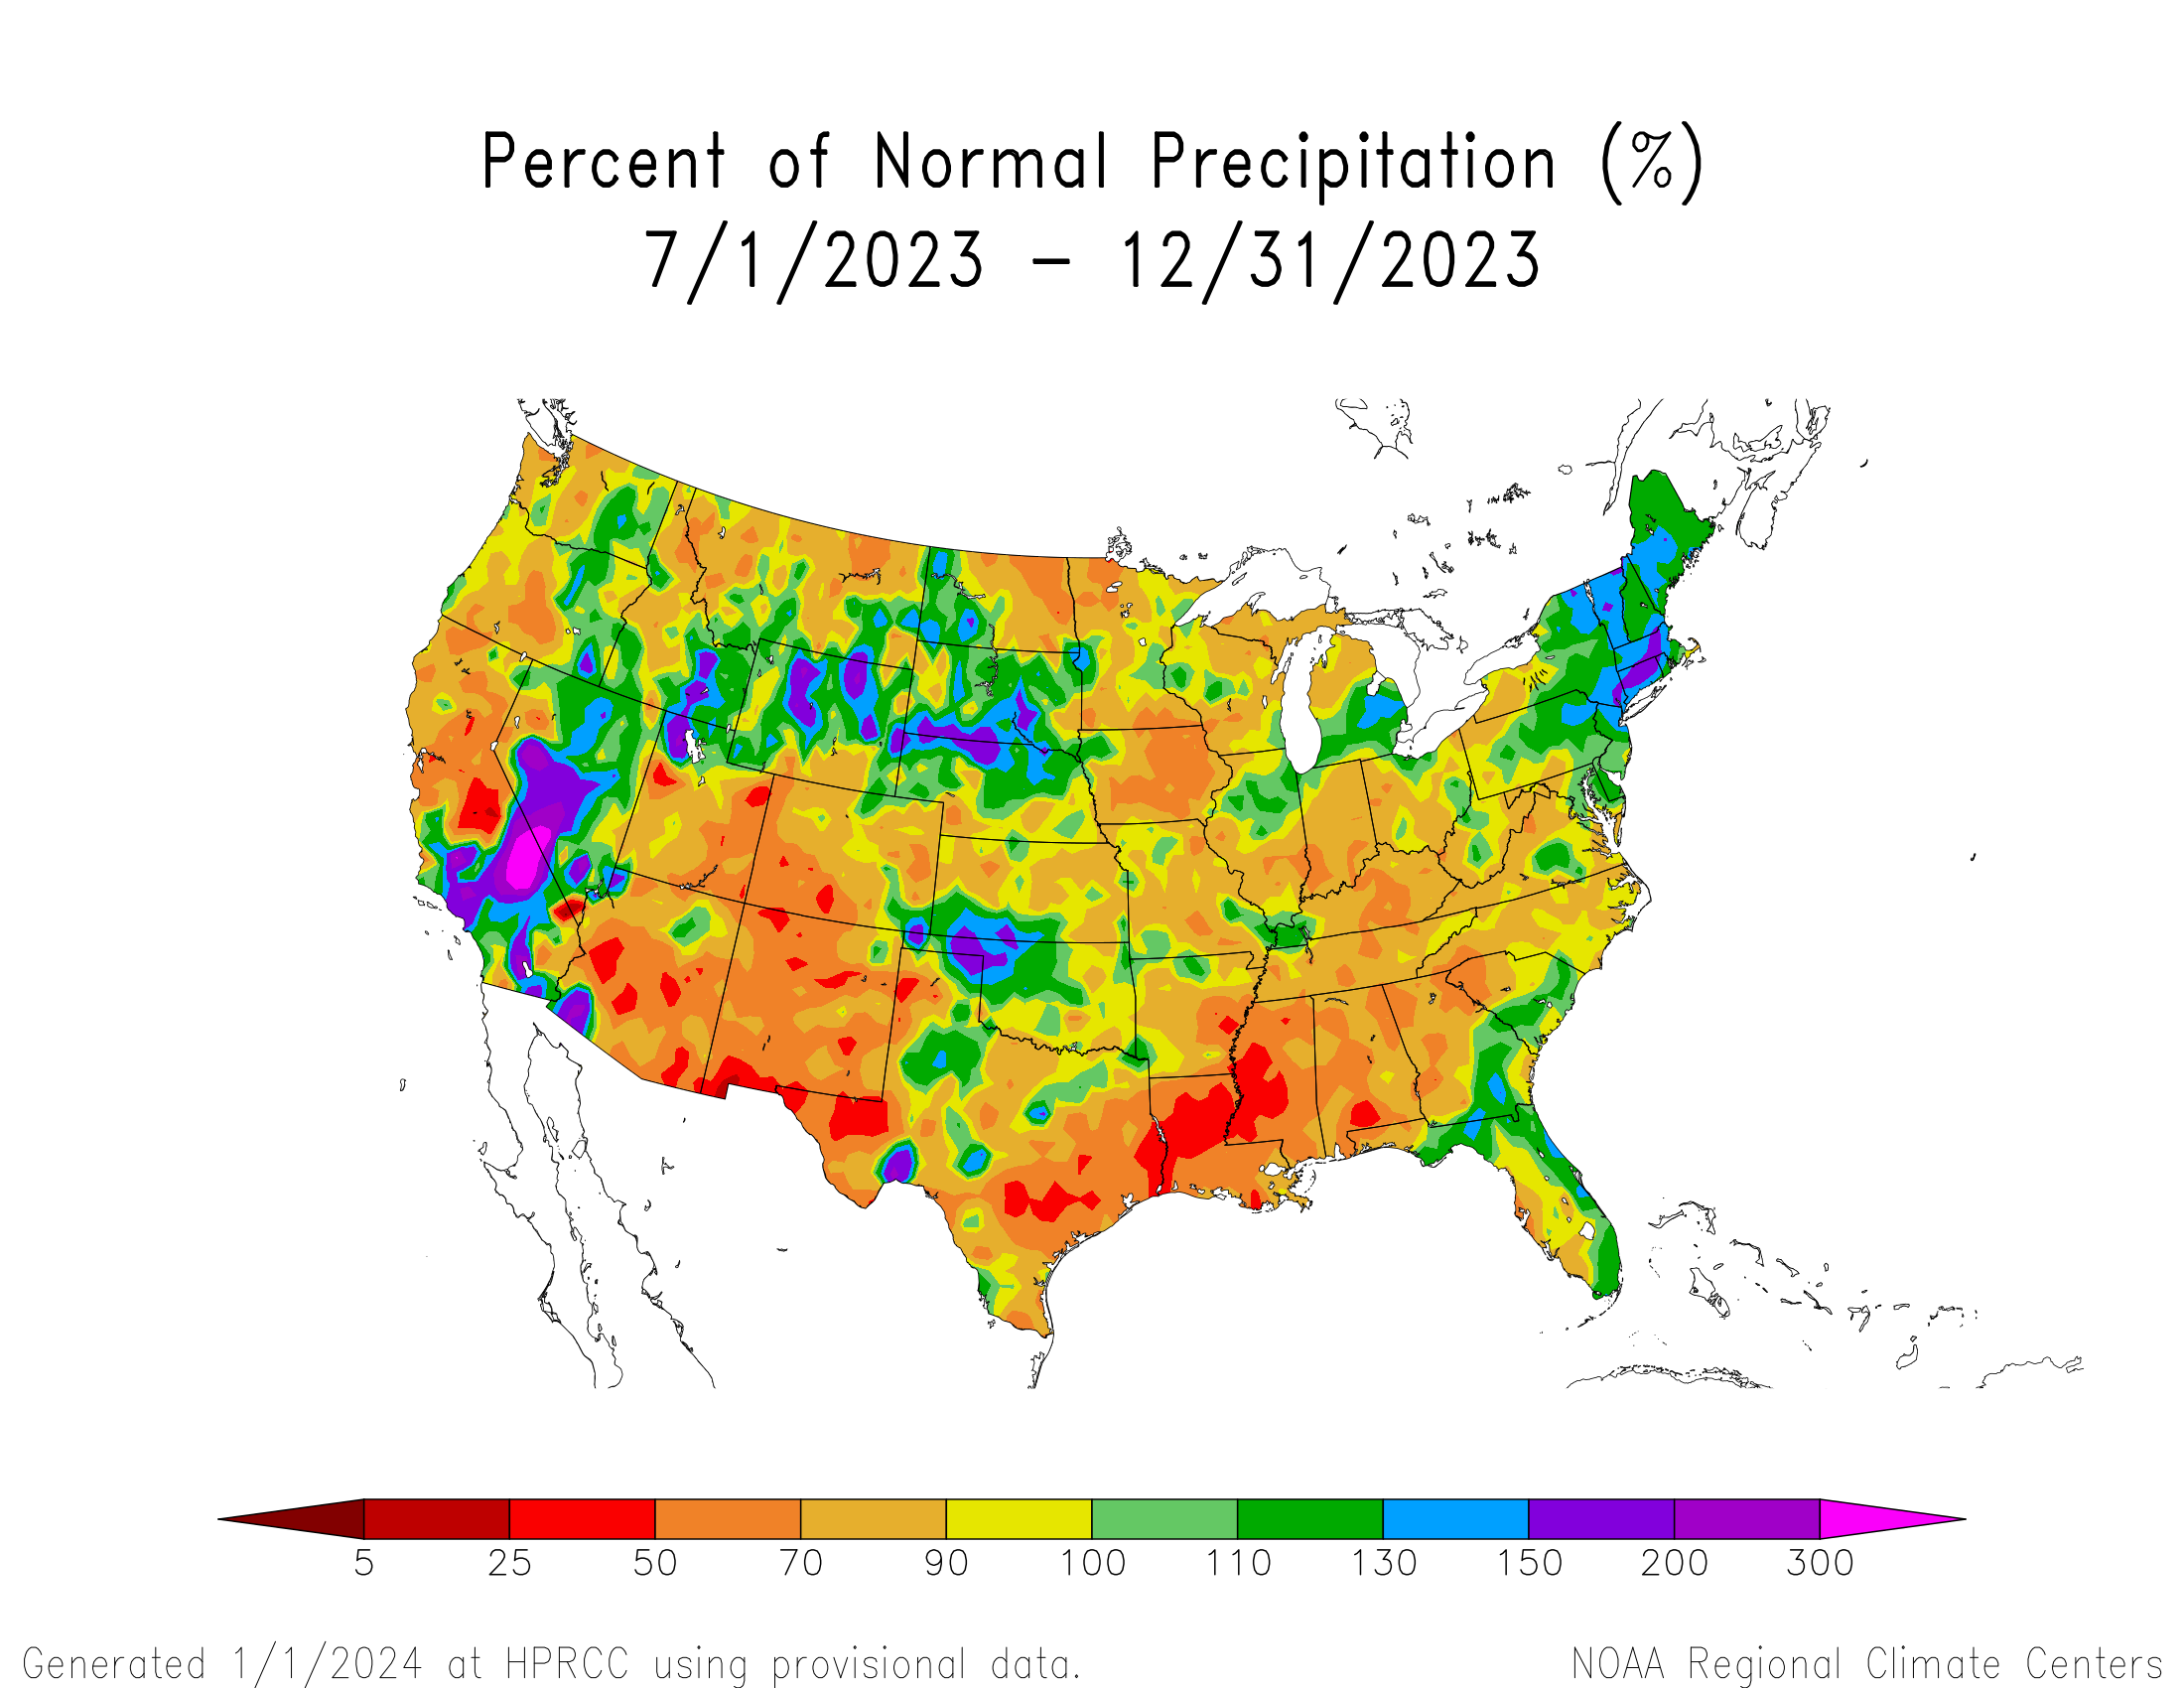
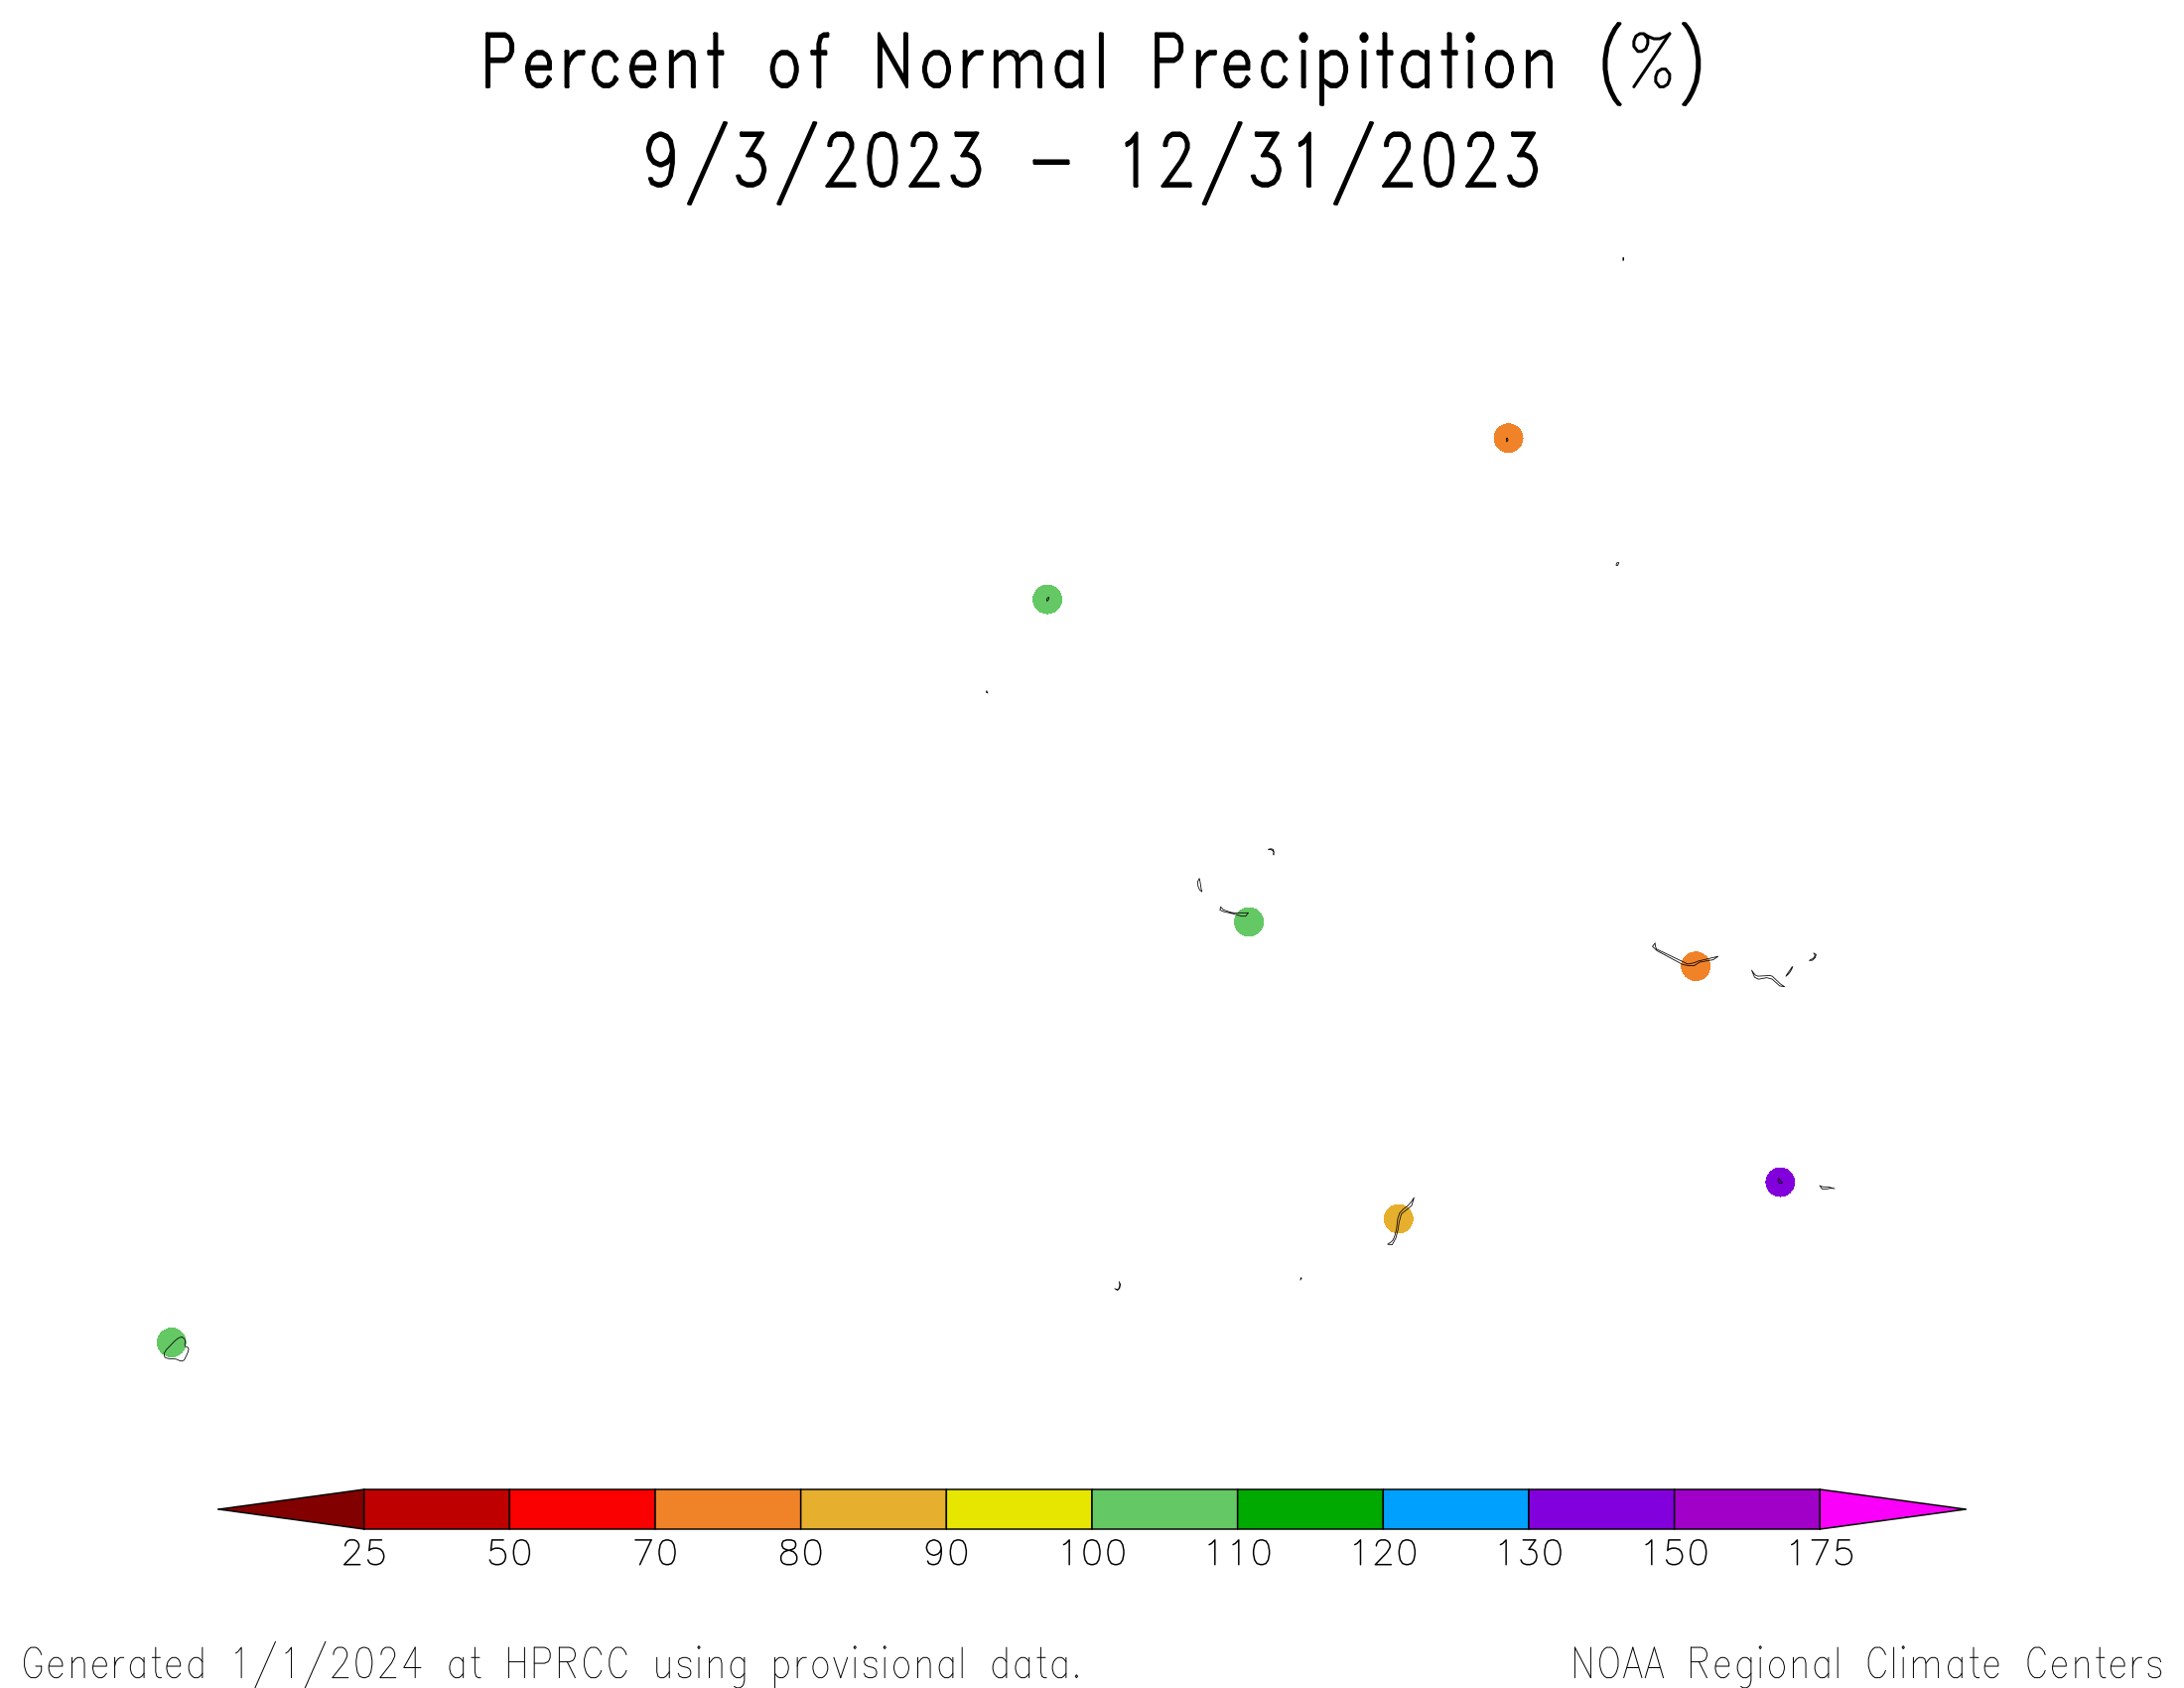
July-December 2023 was drier than normal across a large part of the CONUS from the Mississippi River to the Appalachians, much of the Deep South and Southeast, the Southwest, parts of the Plains, and the Far West. Thirteen states had a precipitation rank in the driest third of the historical record for July-December, including two that ranked in the top ten driest category — Louisiana (second driest) and Mississippi (second driest) — and two that were close: Alabama (11th driest) and New Mexico (11th driest).
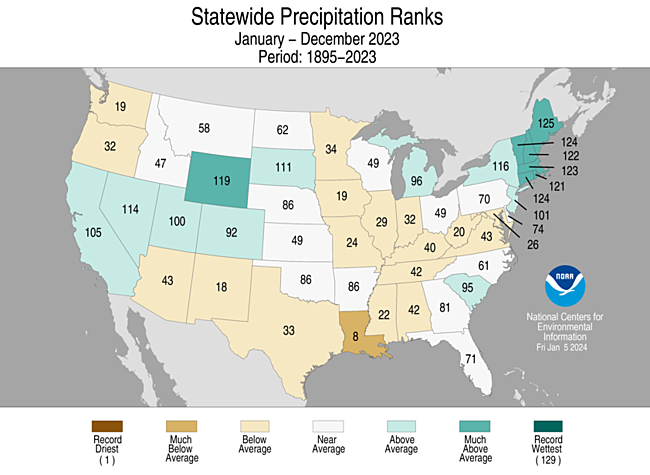
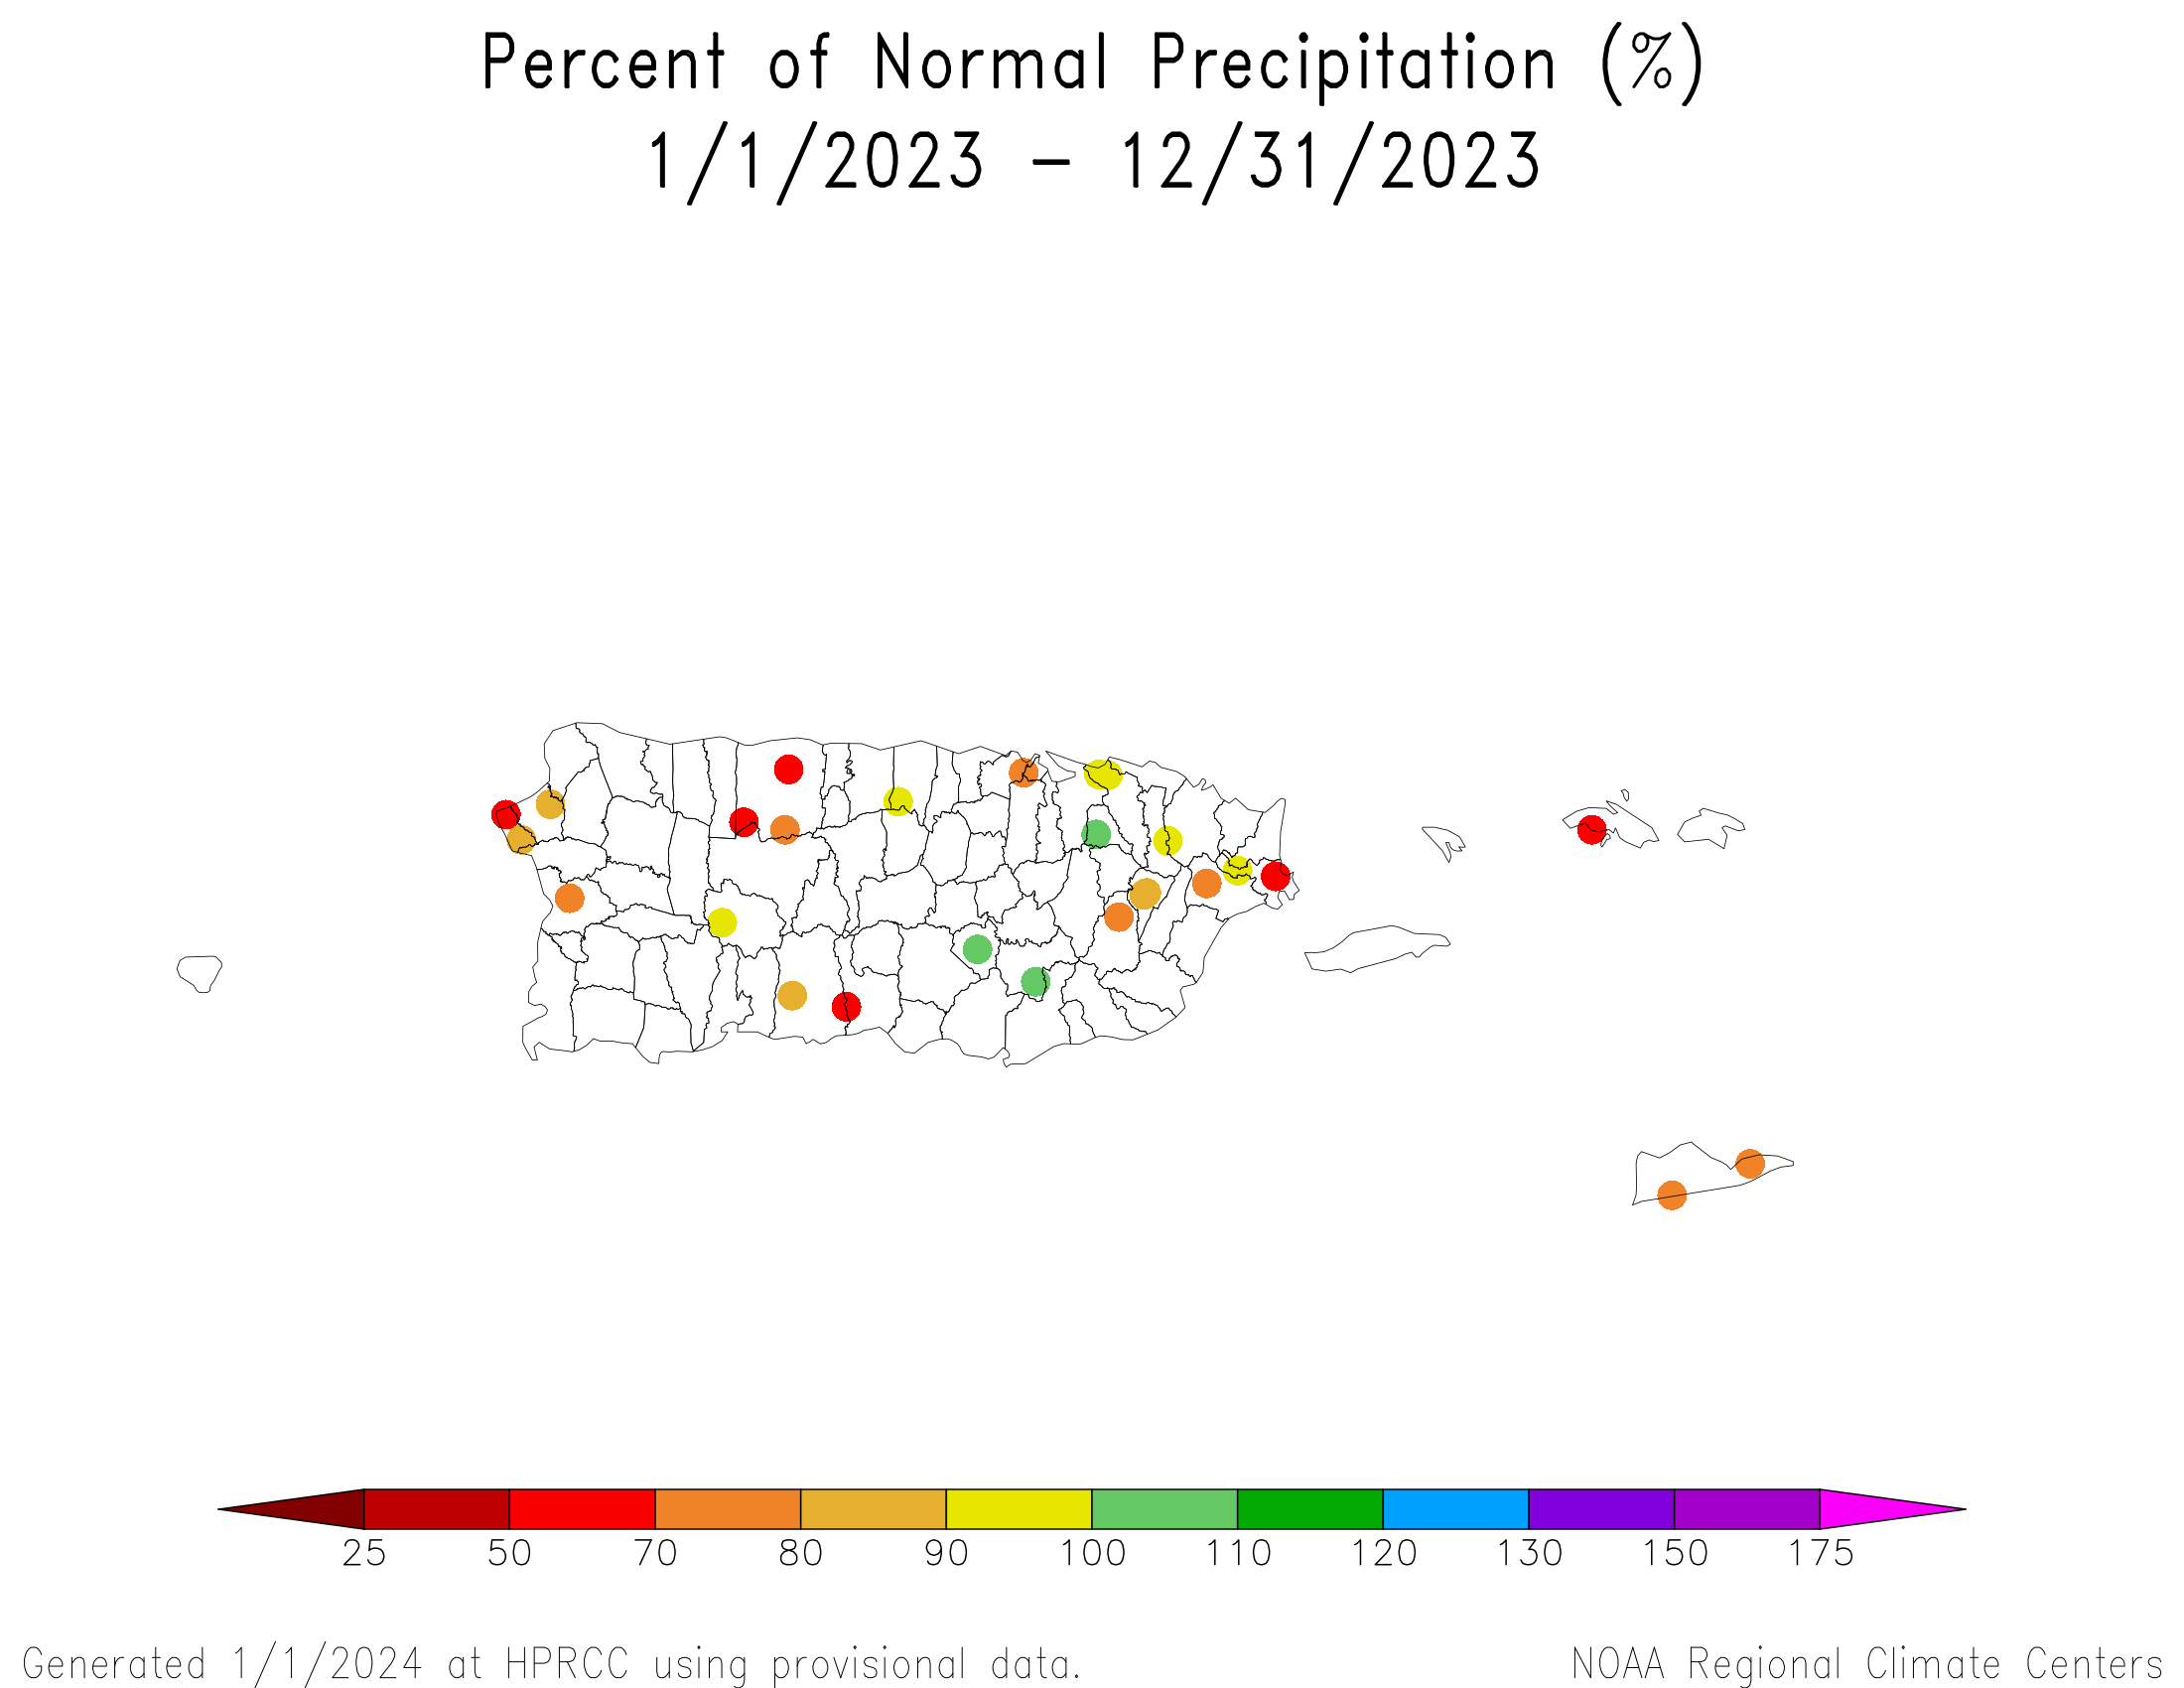
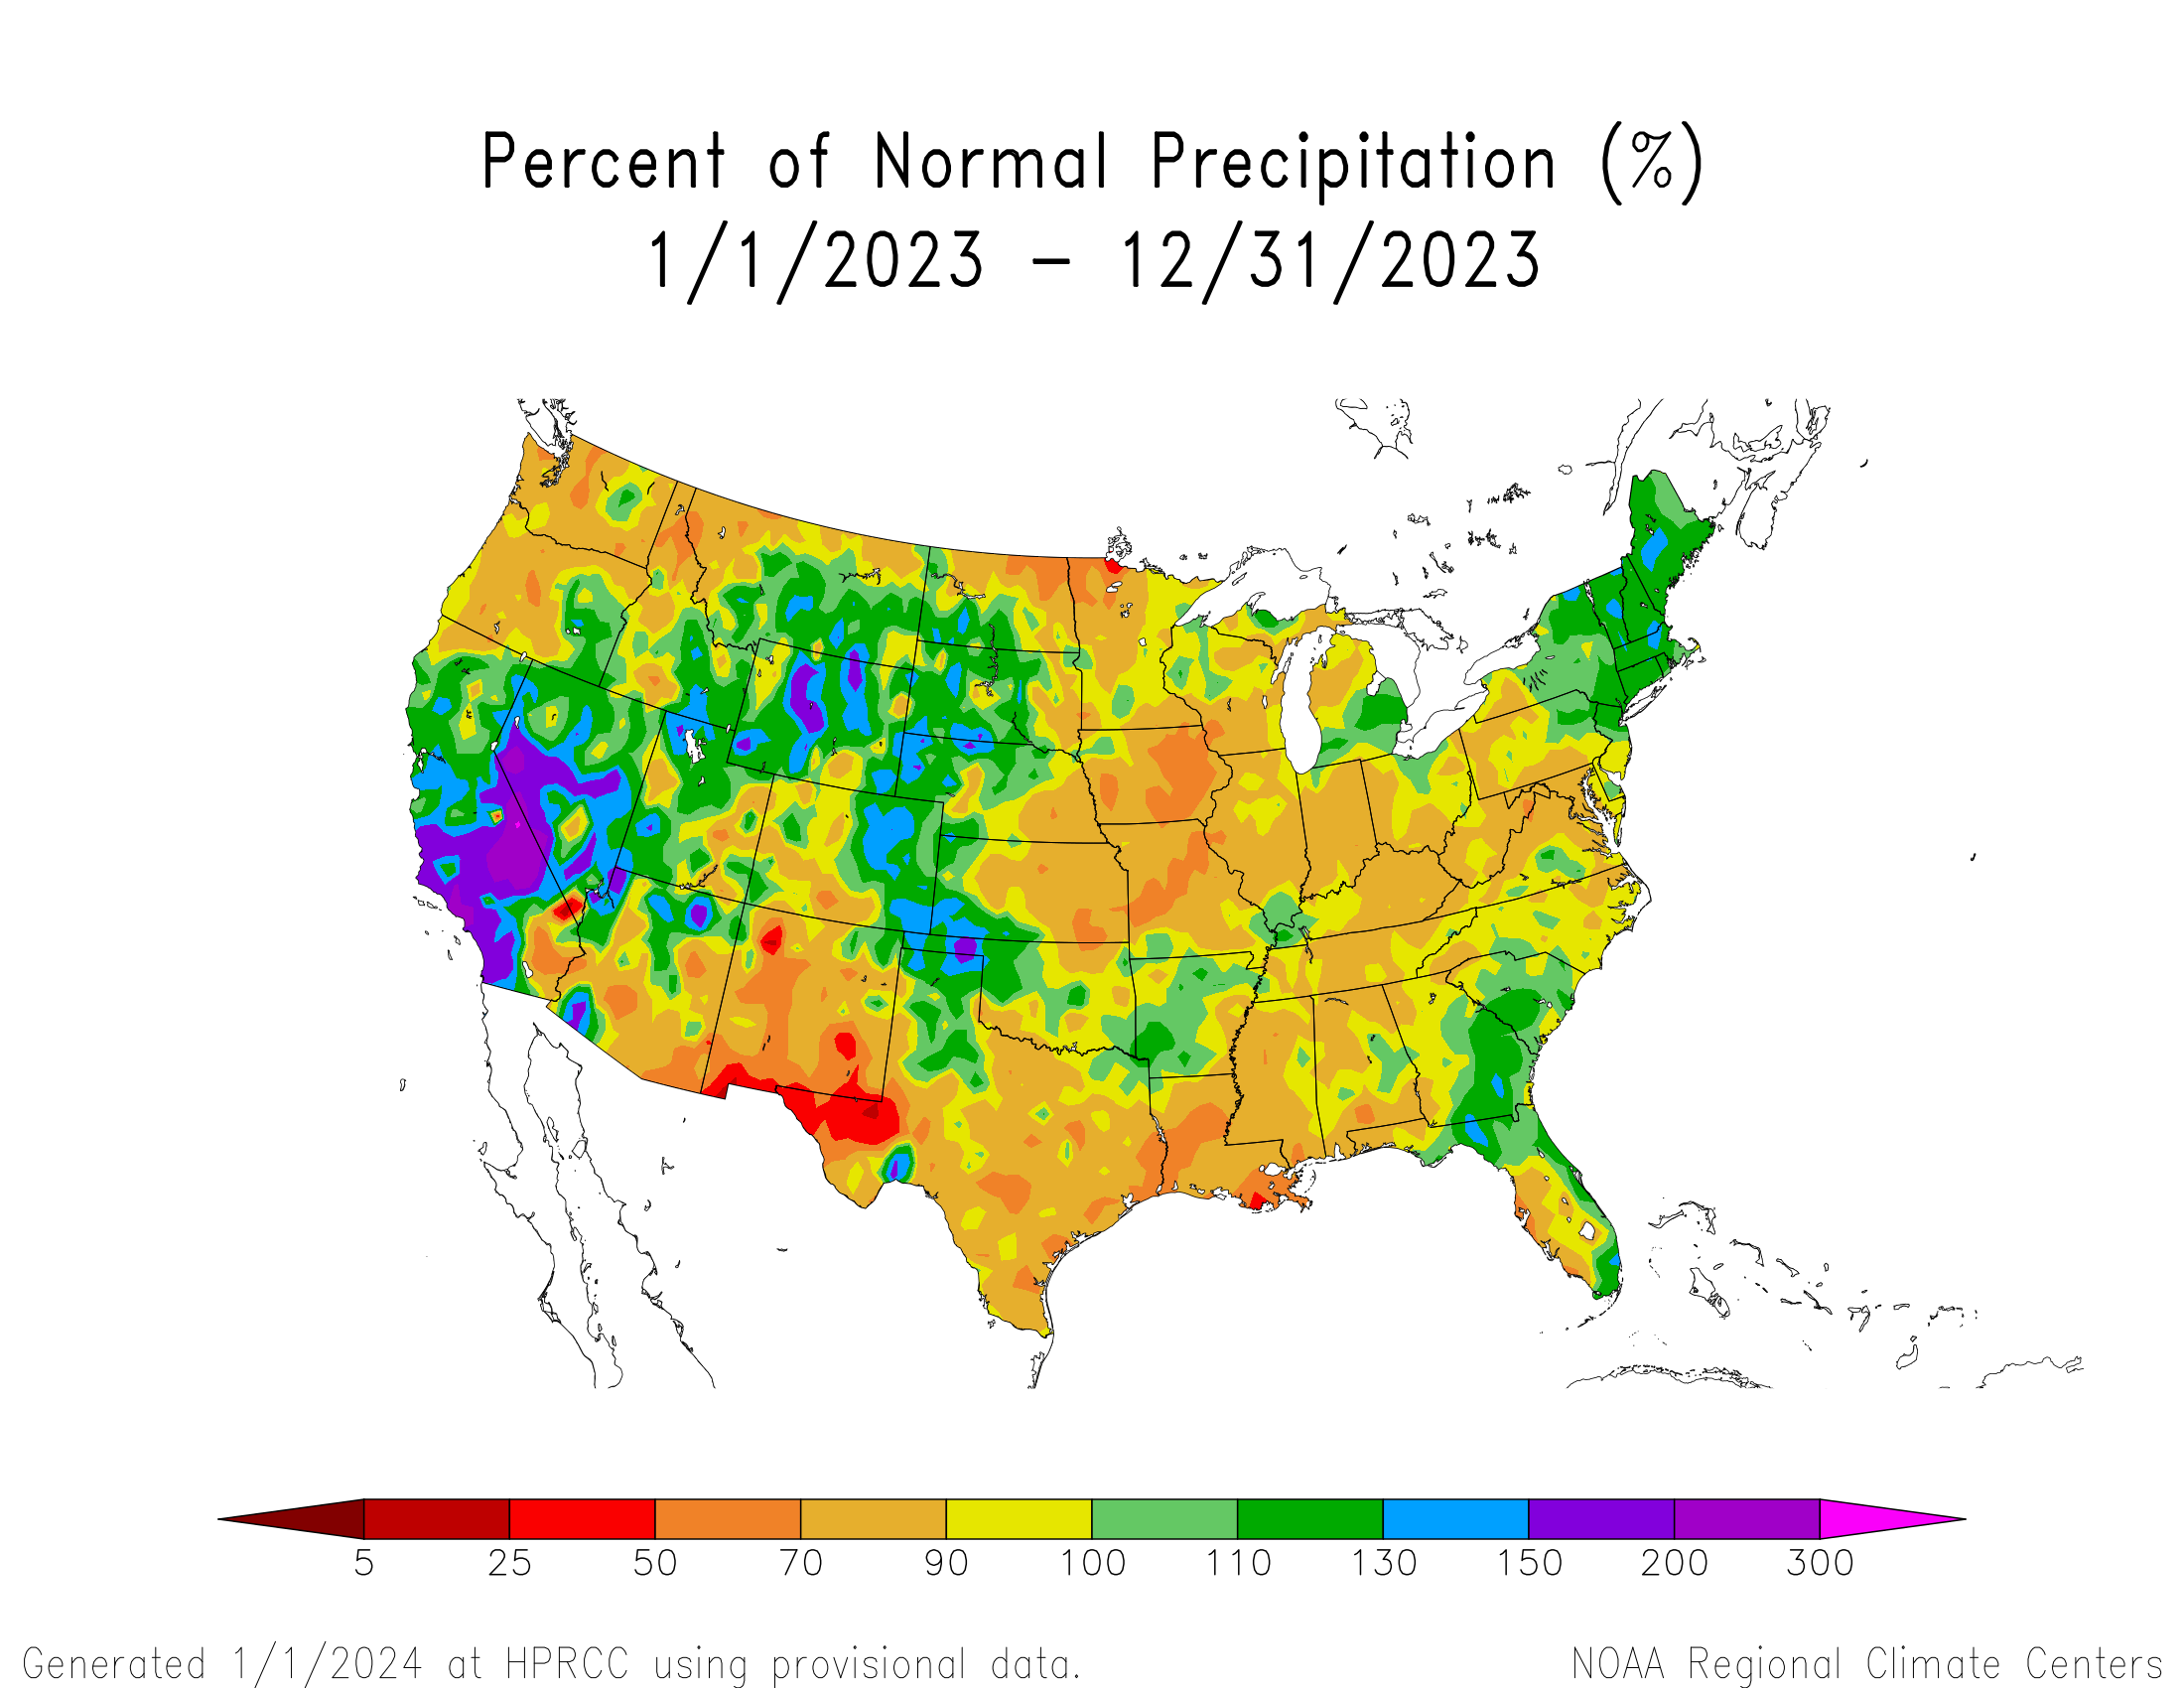
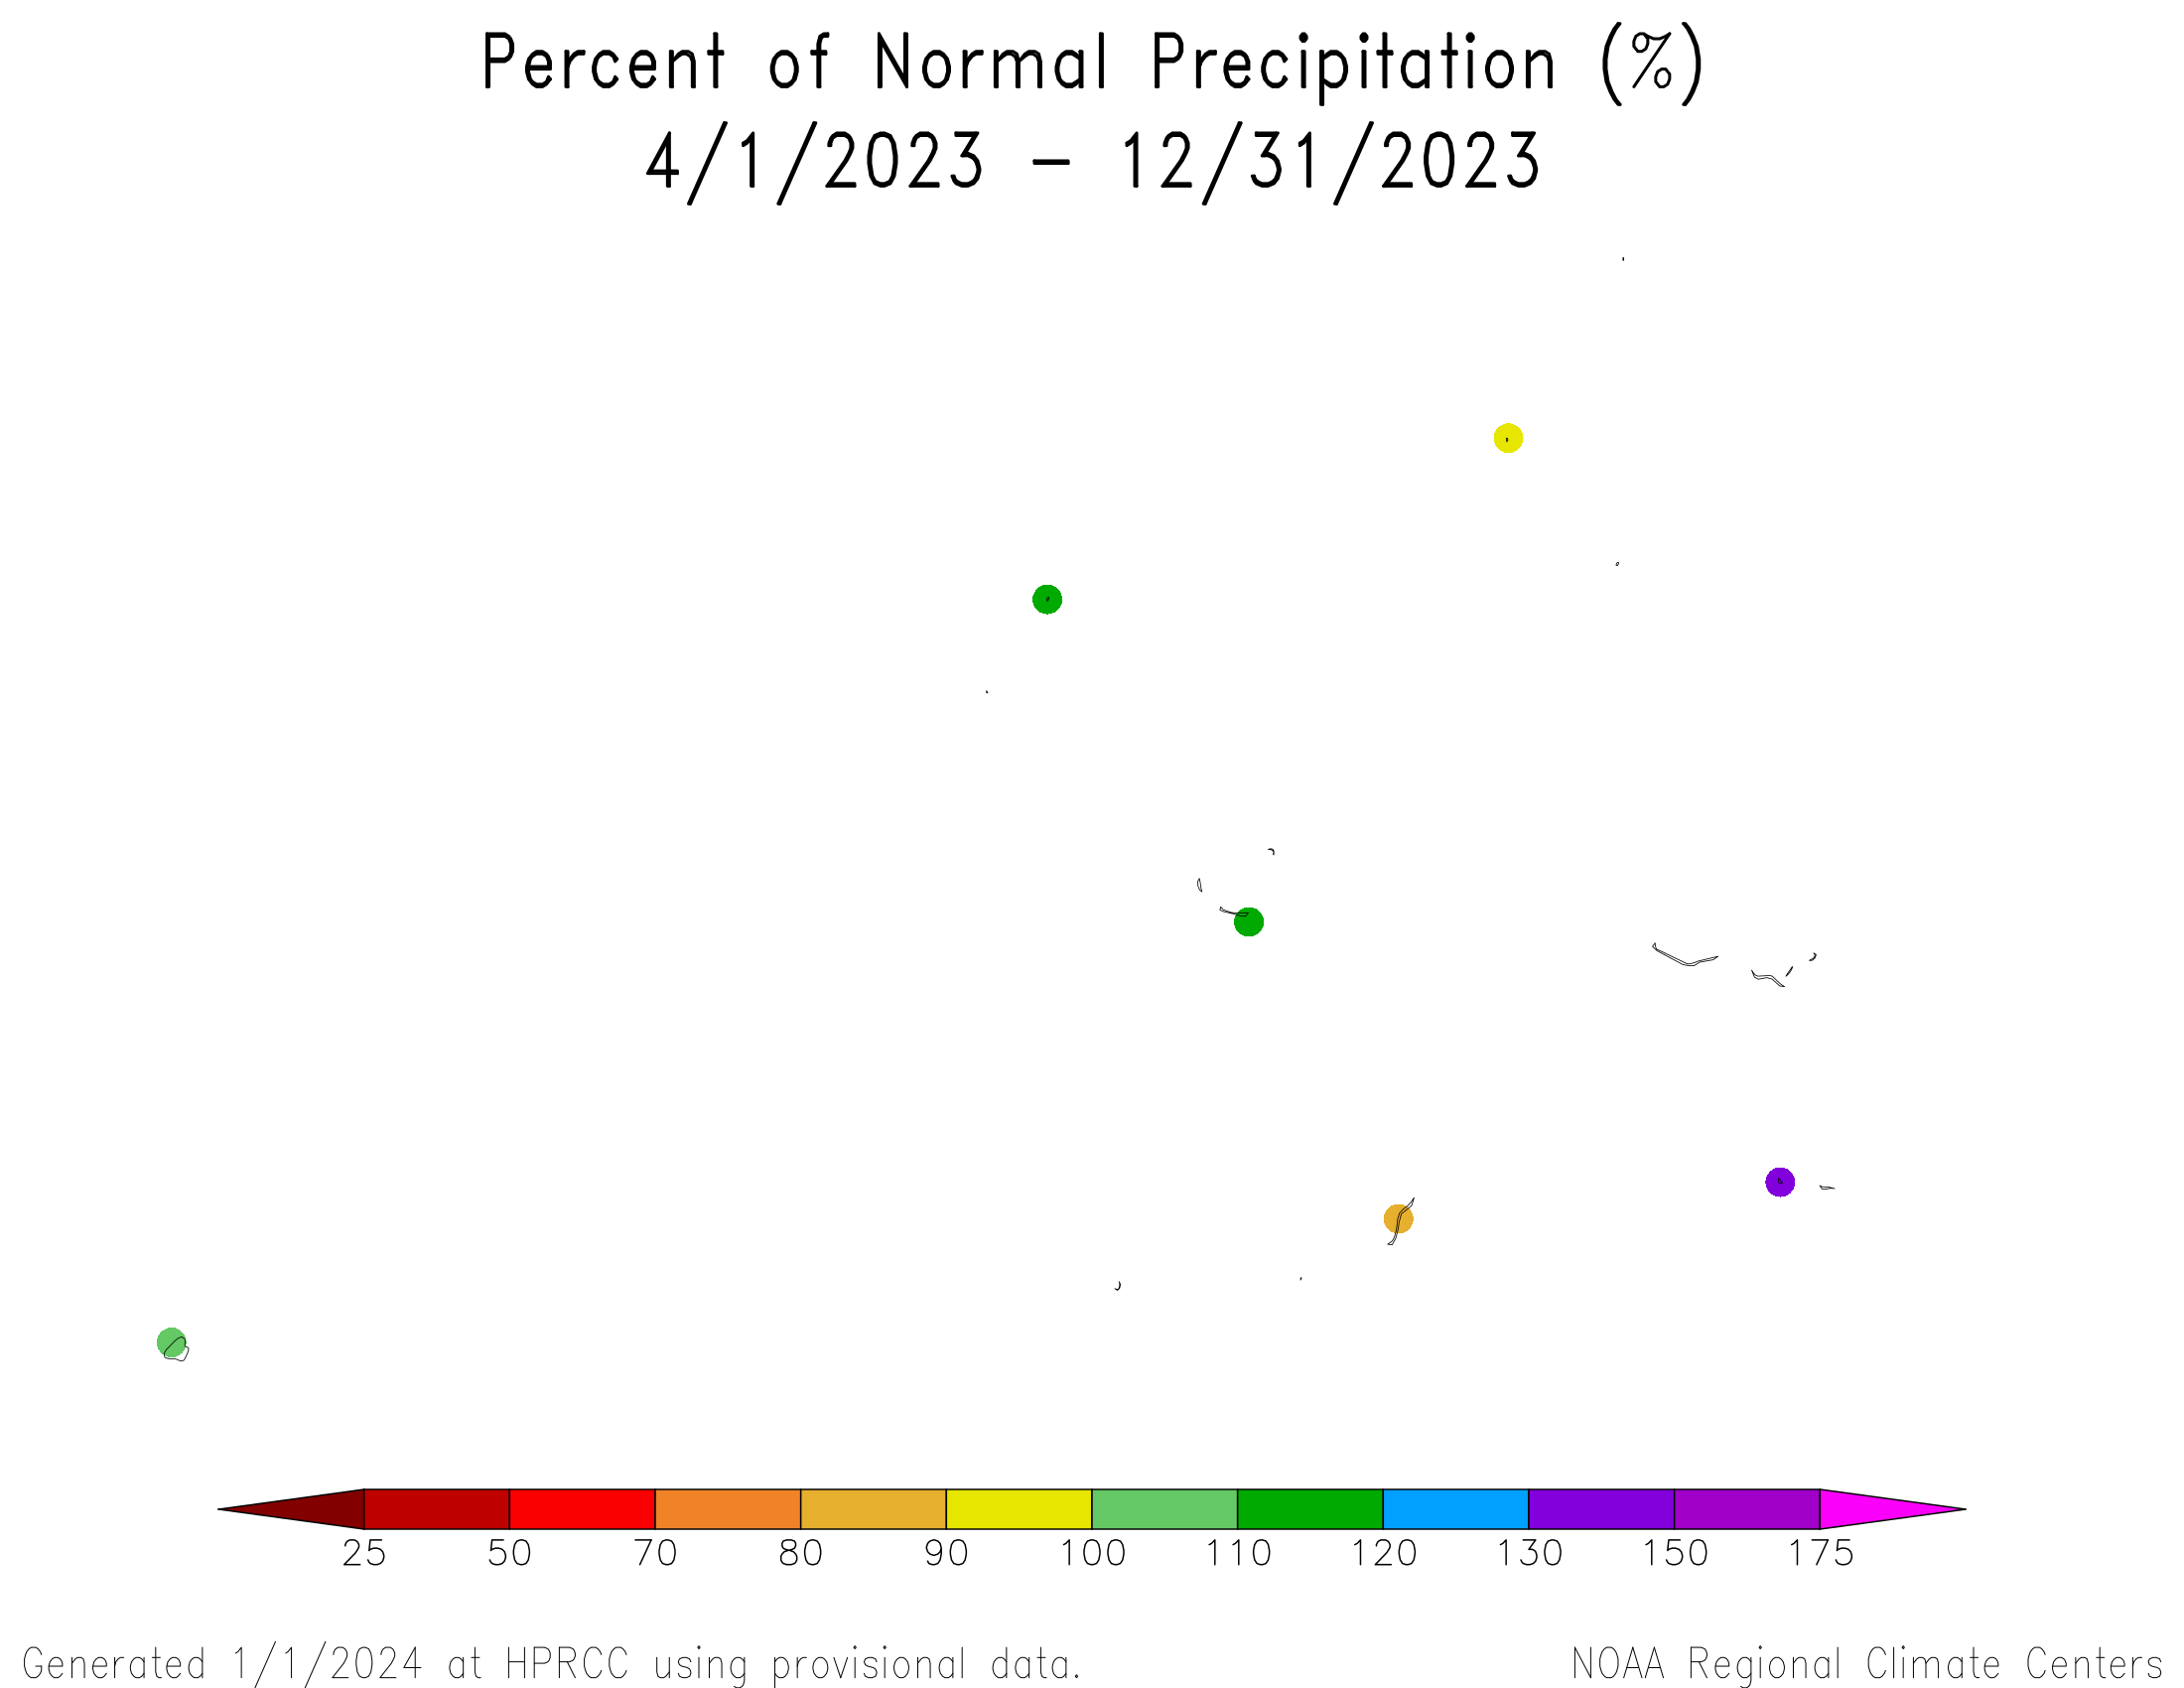
January-December 2023 was drier than normal across the Pacific Northwest, Southwest (Four Corners states), southern Plains to Tennessee Valley, Upper Mississippi Valley, western Florida coast, and central Plains to Mid-Atlantic. Eighteen states had a precipitation rank in the driest third of the historical record for January-December, including one that ranked in the top ten driest category — Louisiana (eighth driest).
Agricultural Belts
During December 2023, the Primary Hard Red Winter Wheat agricultural belt was mostly warmer and wetter than normal. The month ranked as the tenth wettest and second warmest December, regionwide, in the 1895-2023 record.
October marks the beginning of the growing season for the Primary Hard Red Winter Wheat belt. October-December 2023 was mostly warmer than normal and drier than normal in the north and wetter than normal in the south. The period ranked as the 46th wettest and third warmest October-December, regionwide, on record.
According to the U.S. Department of Agriculture (USDA), as of January 2, 2024, drought affected approximately 16% of barley production, 45% of corn production, 33% of cotton production, 36% of sorghum production, 50% of soybean production, 25% of spring wheat production, 32% of winter wheat production, 33% of hay acreage, 35% of the cattle inventory, 23% of the milk cow inventory, and 29% of the sheep inventory.
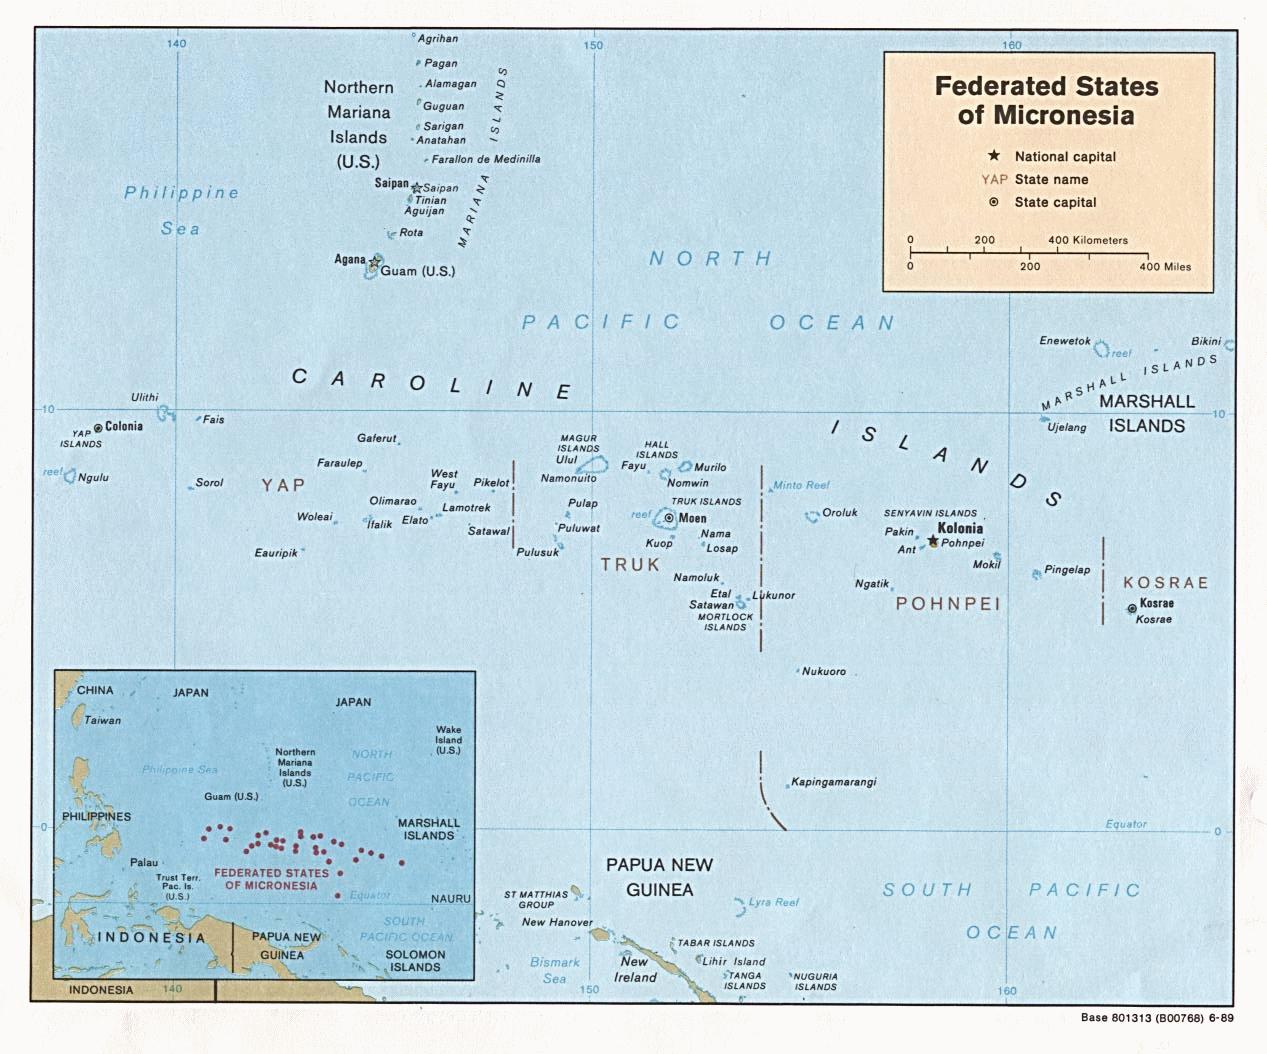
U.S.-Affiliated Pacific Islands
The NOAA National Weather Service (NWS) offices, the Pacific ENSO Applications Climate Center (PEAC), and partners provided reports on conditions across the Pacific Islands.
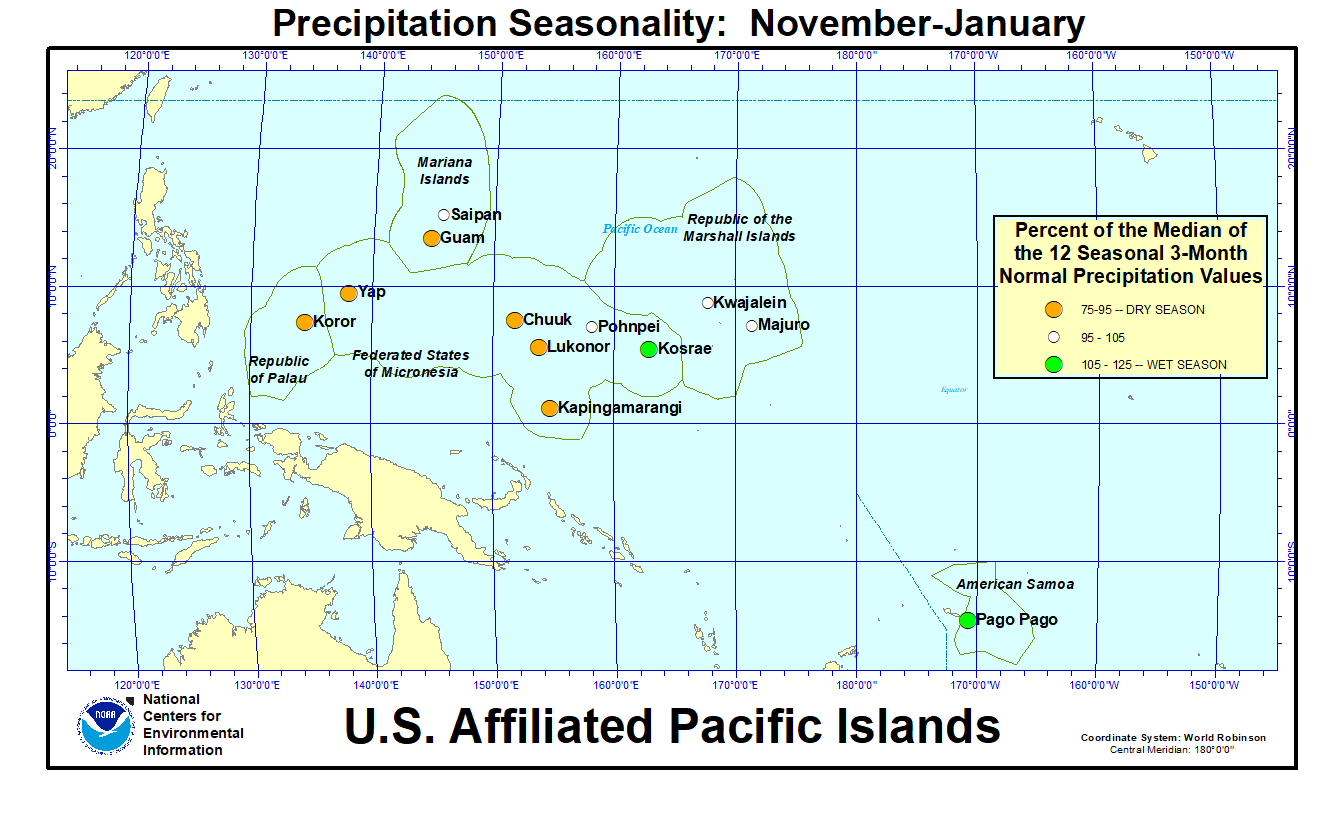
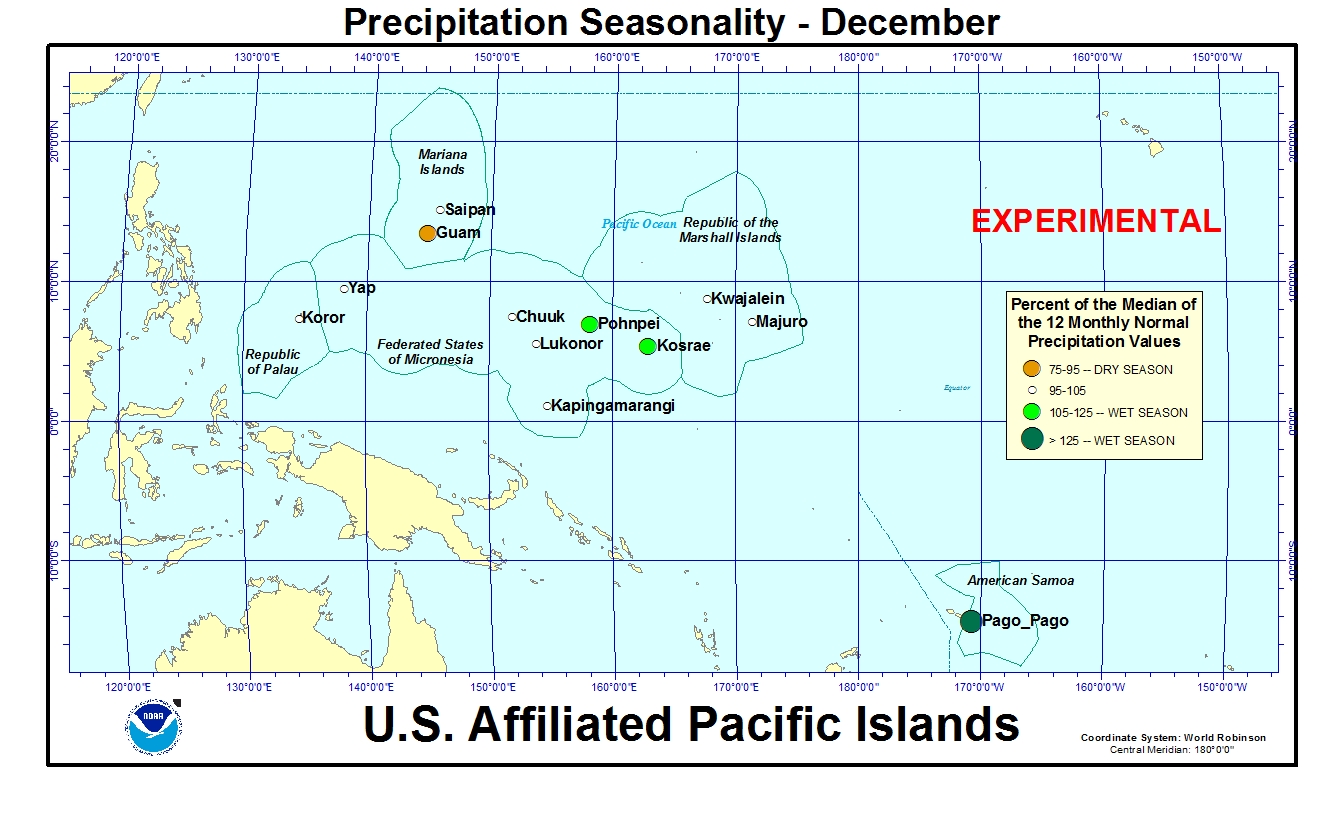
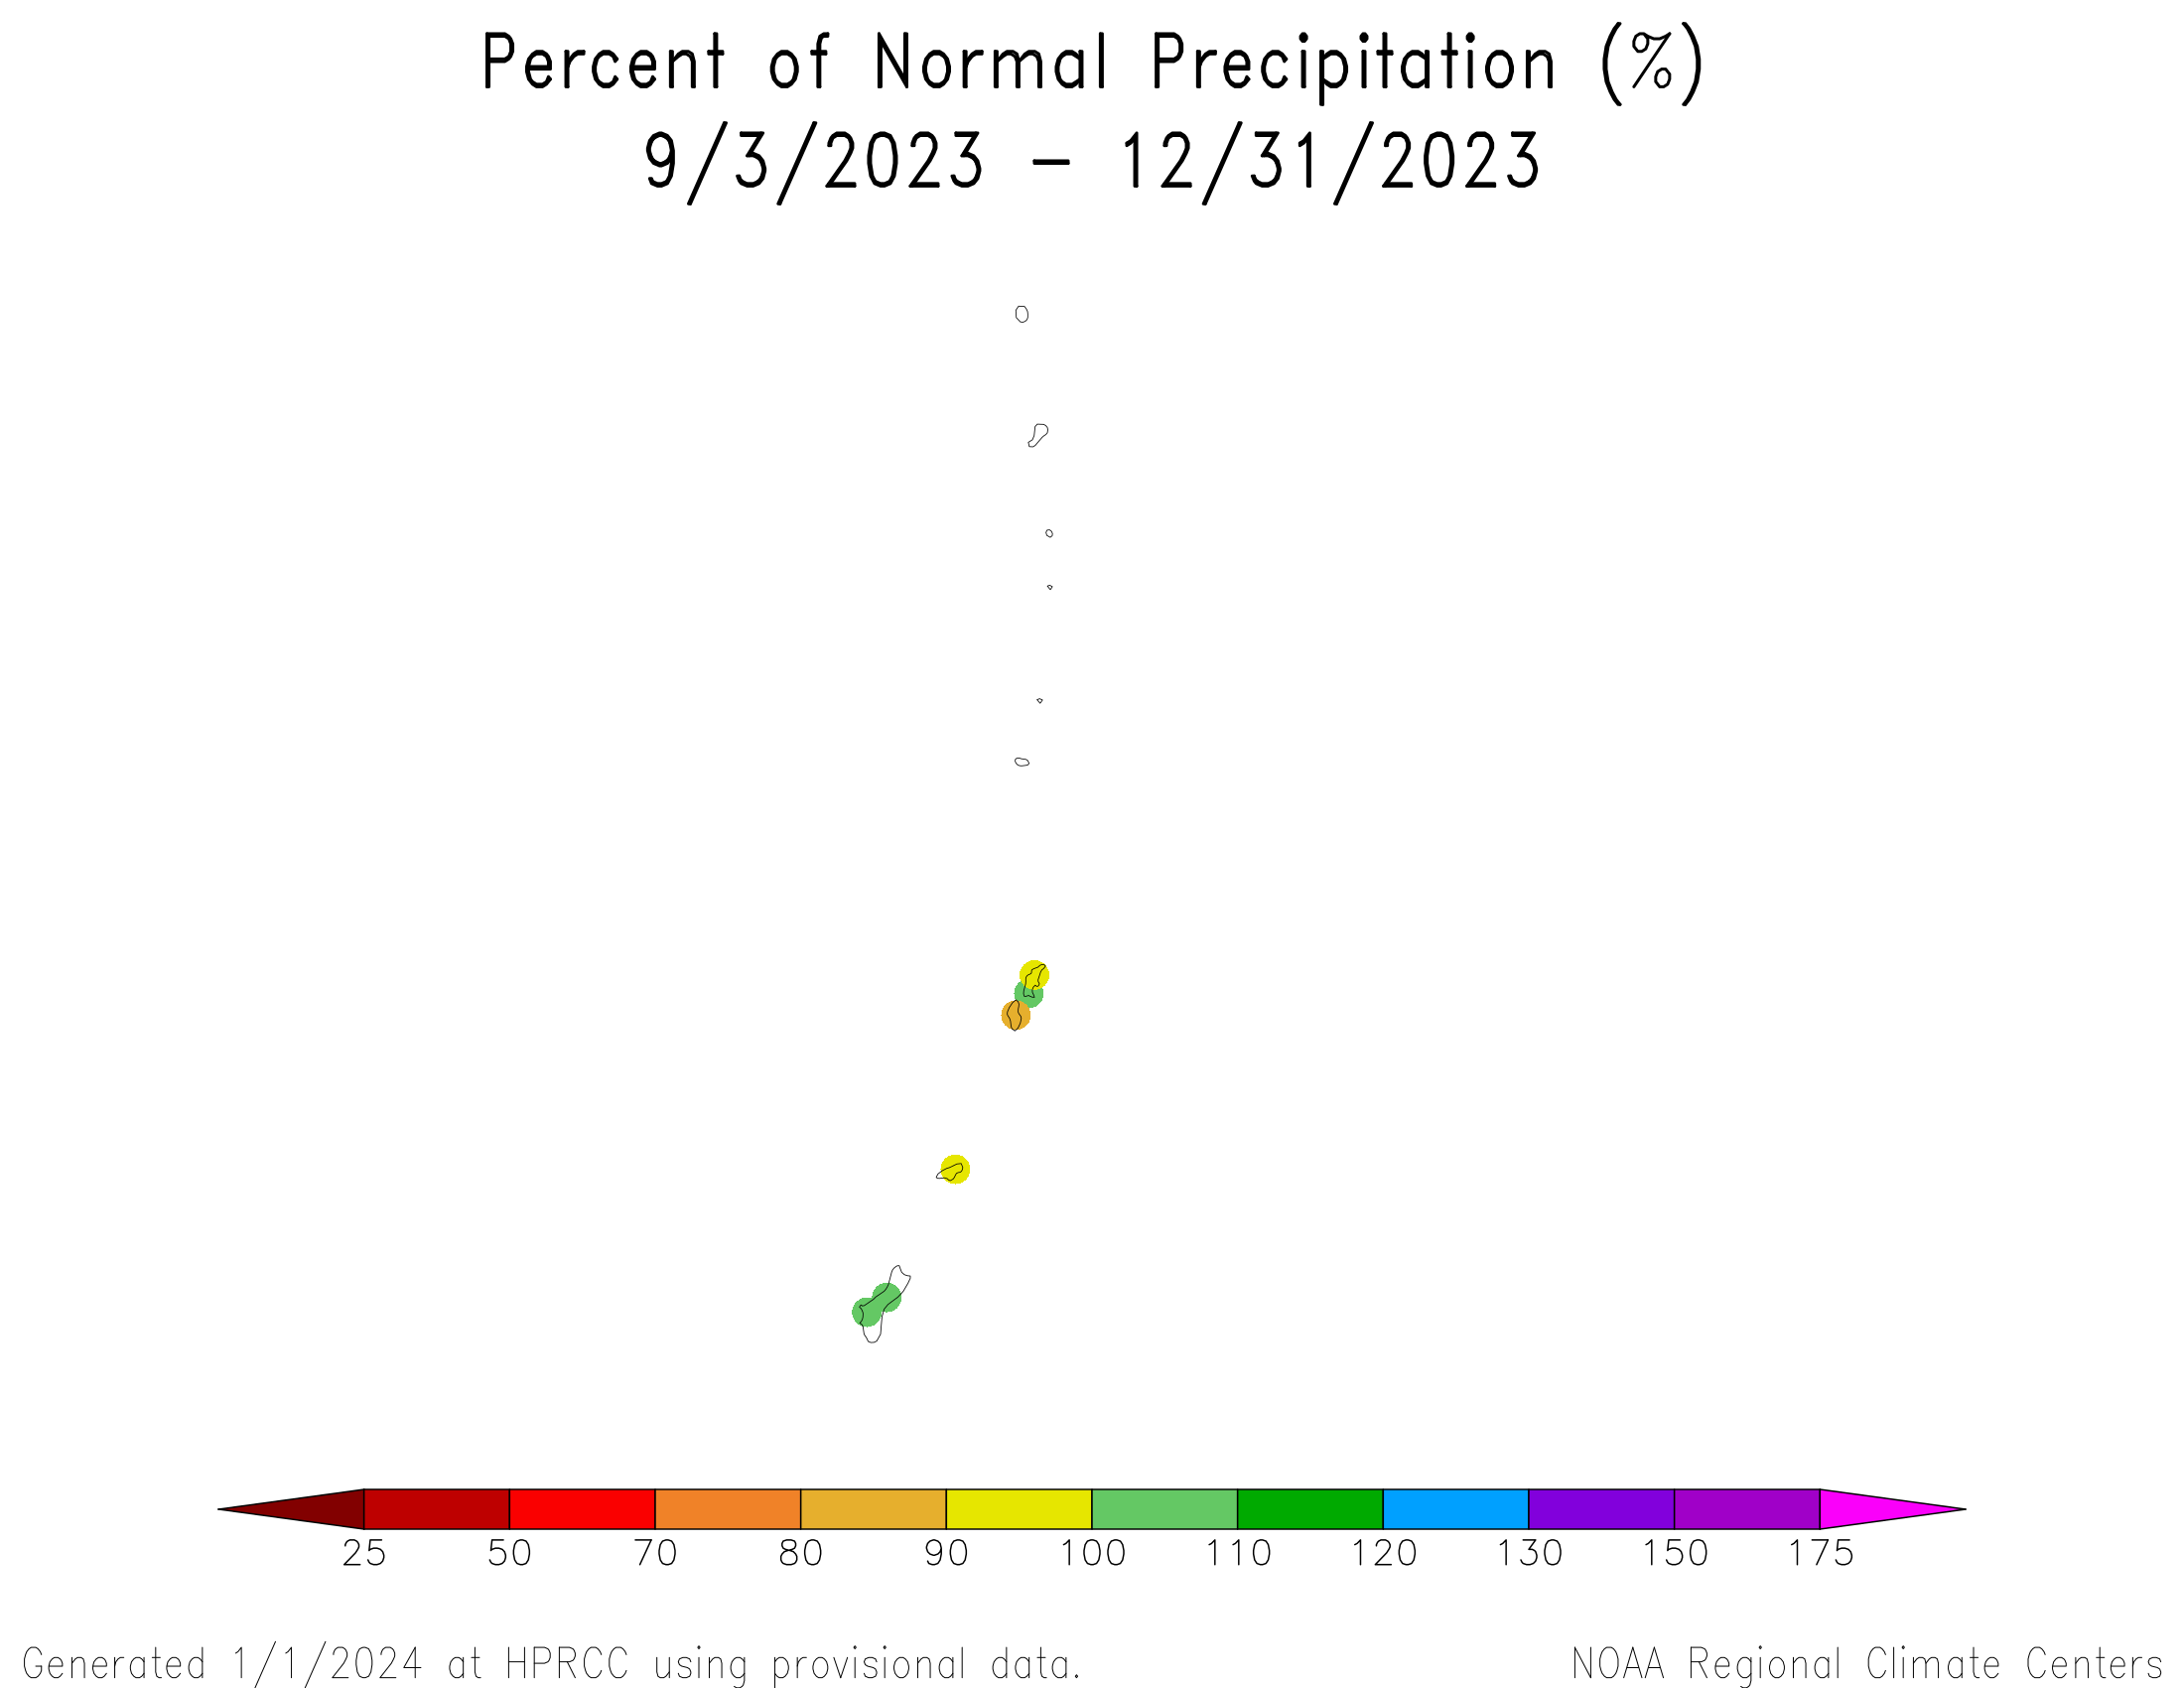
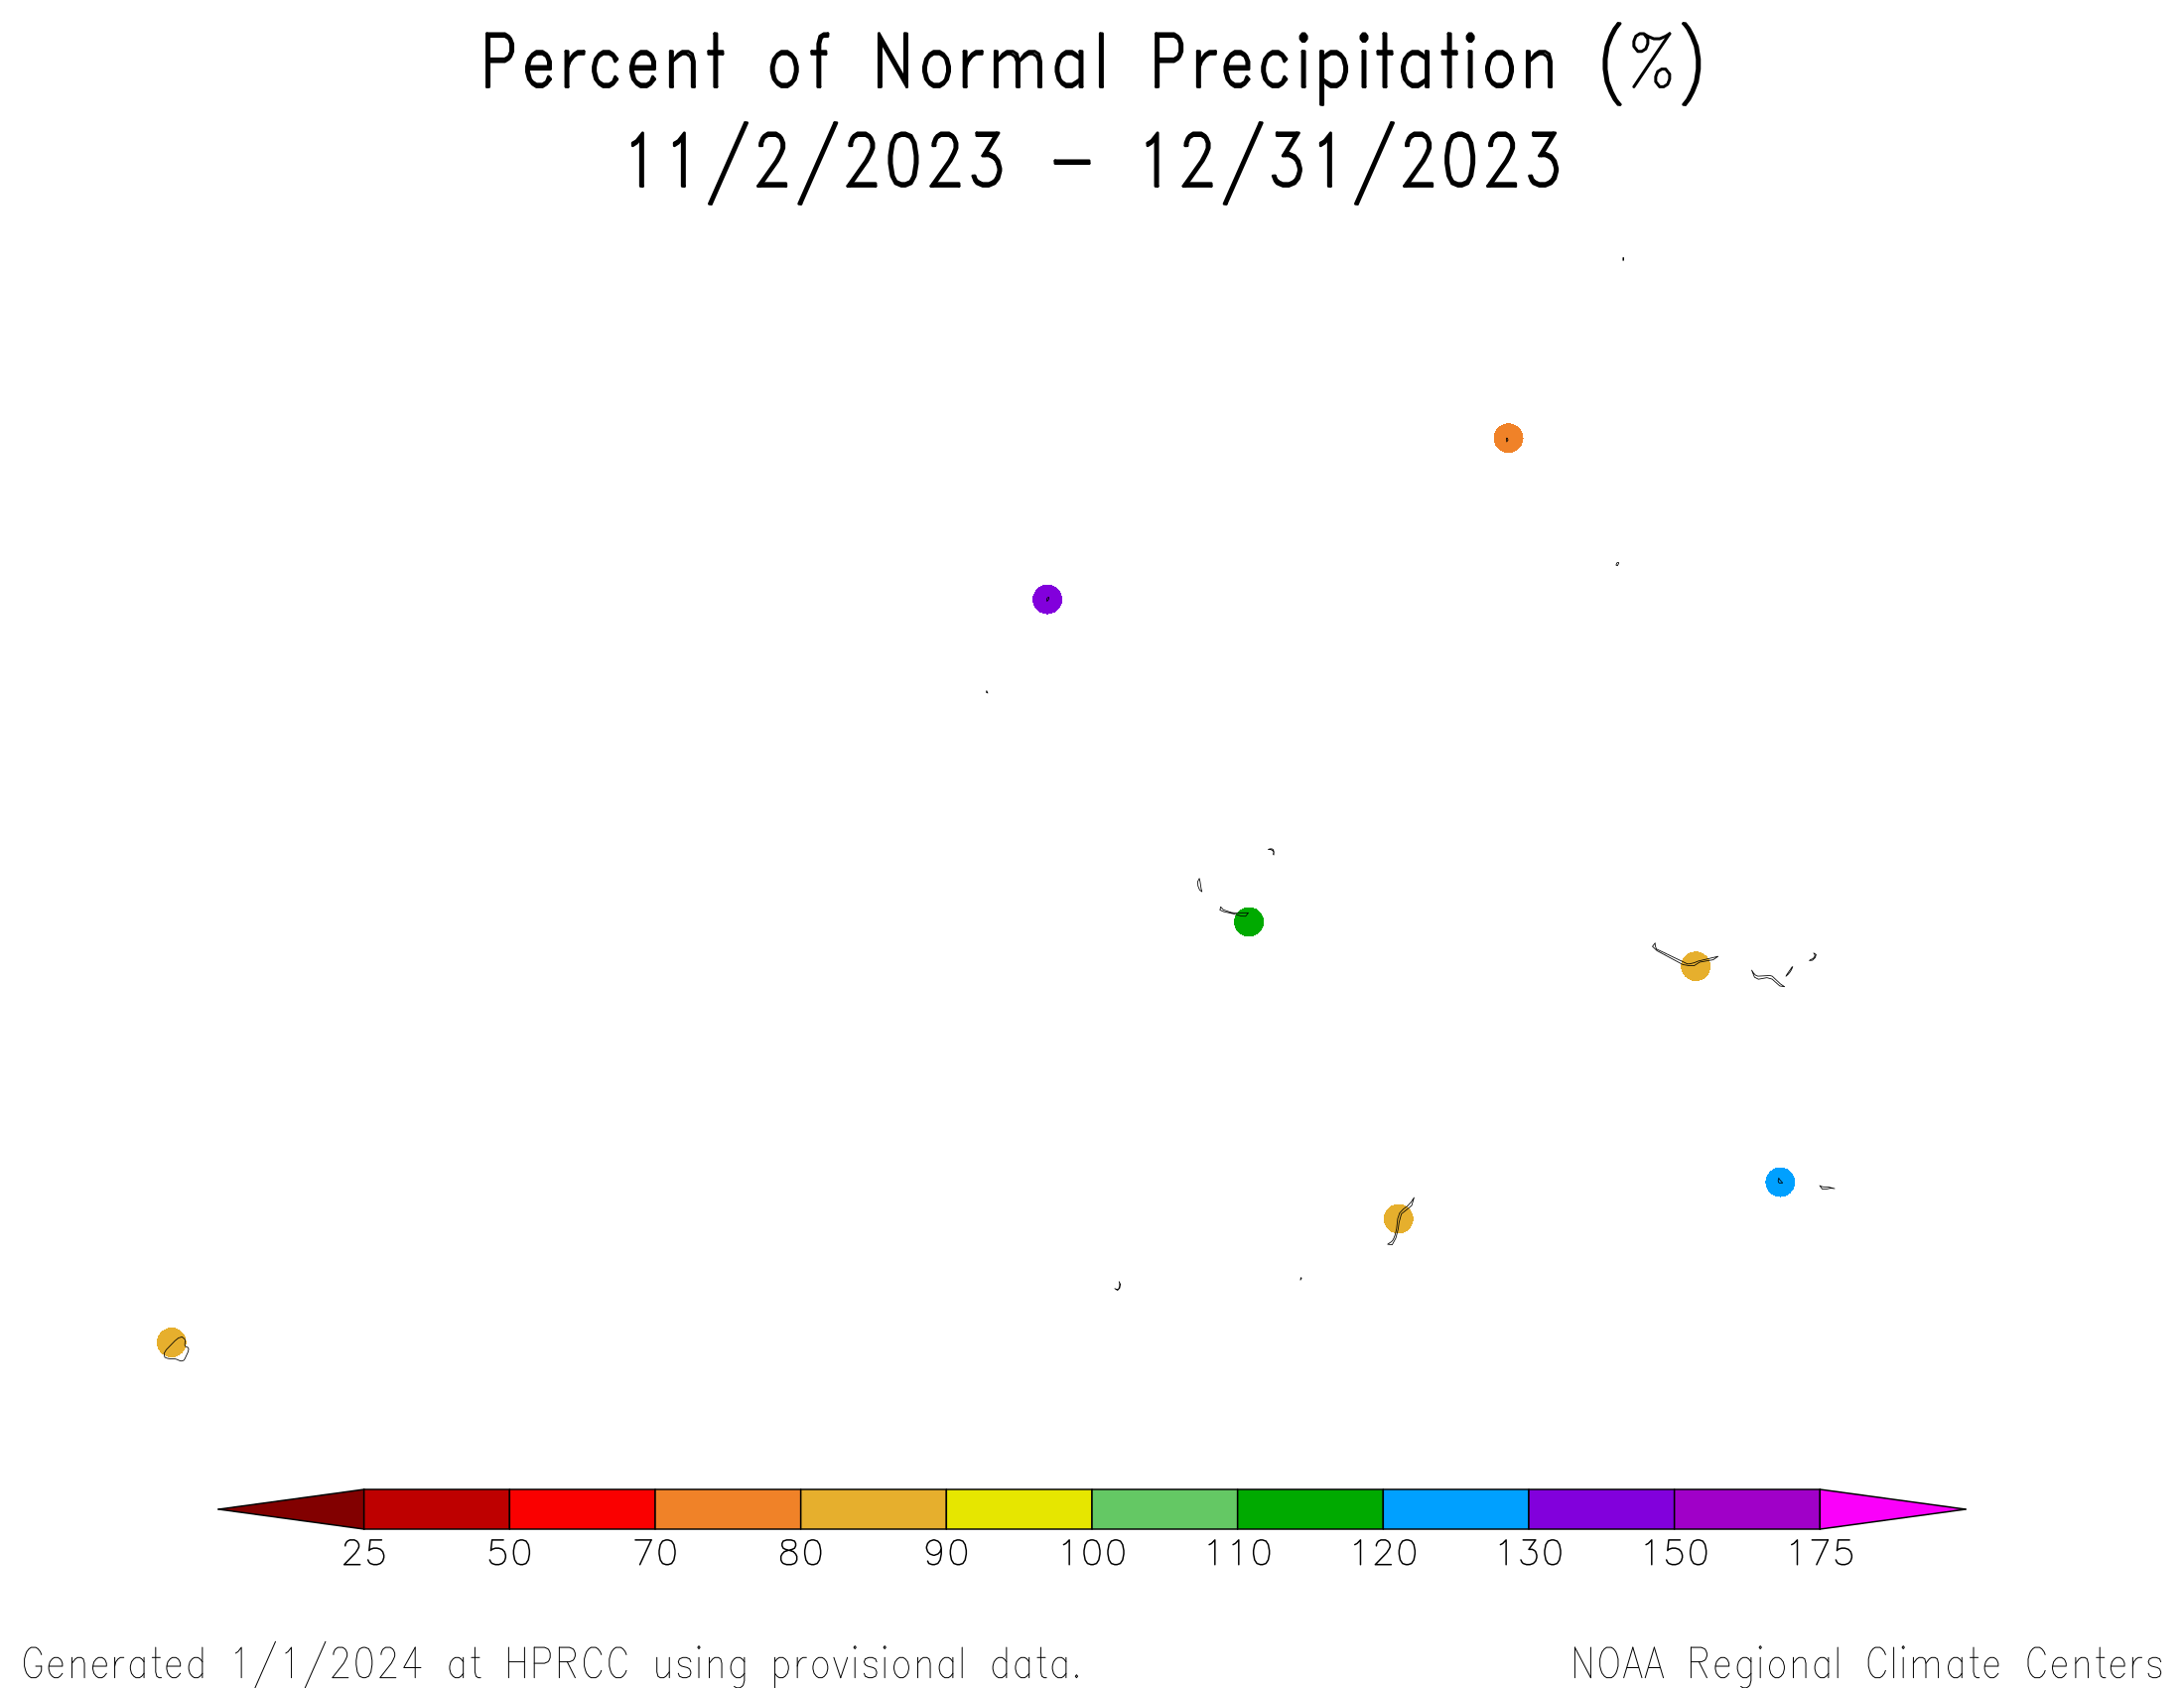
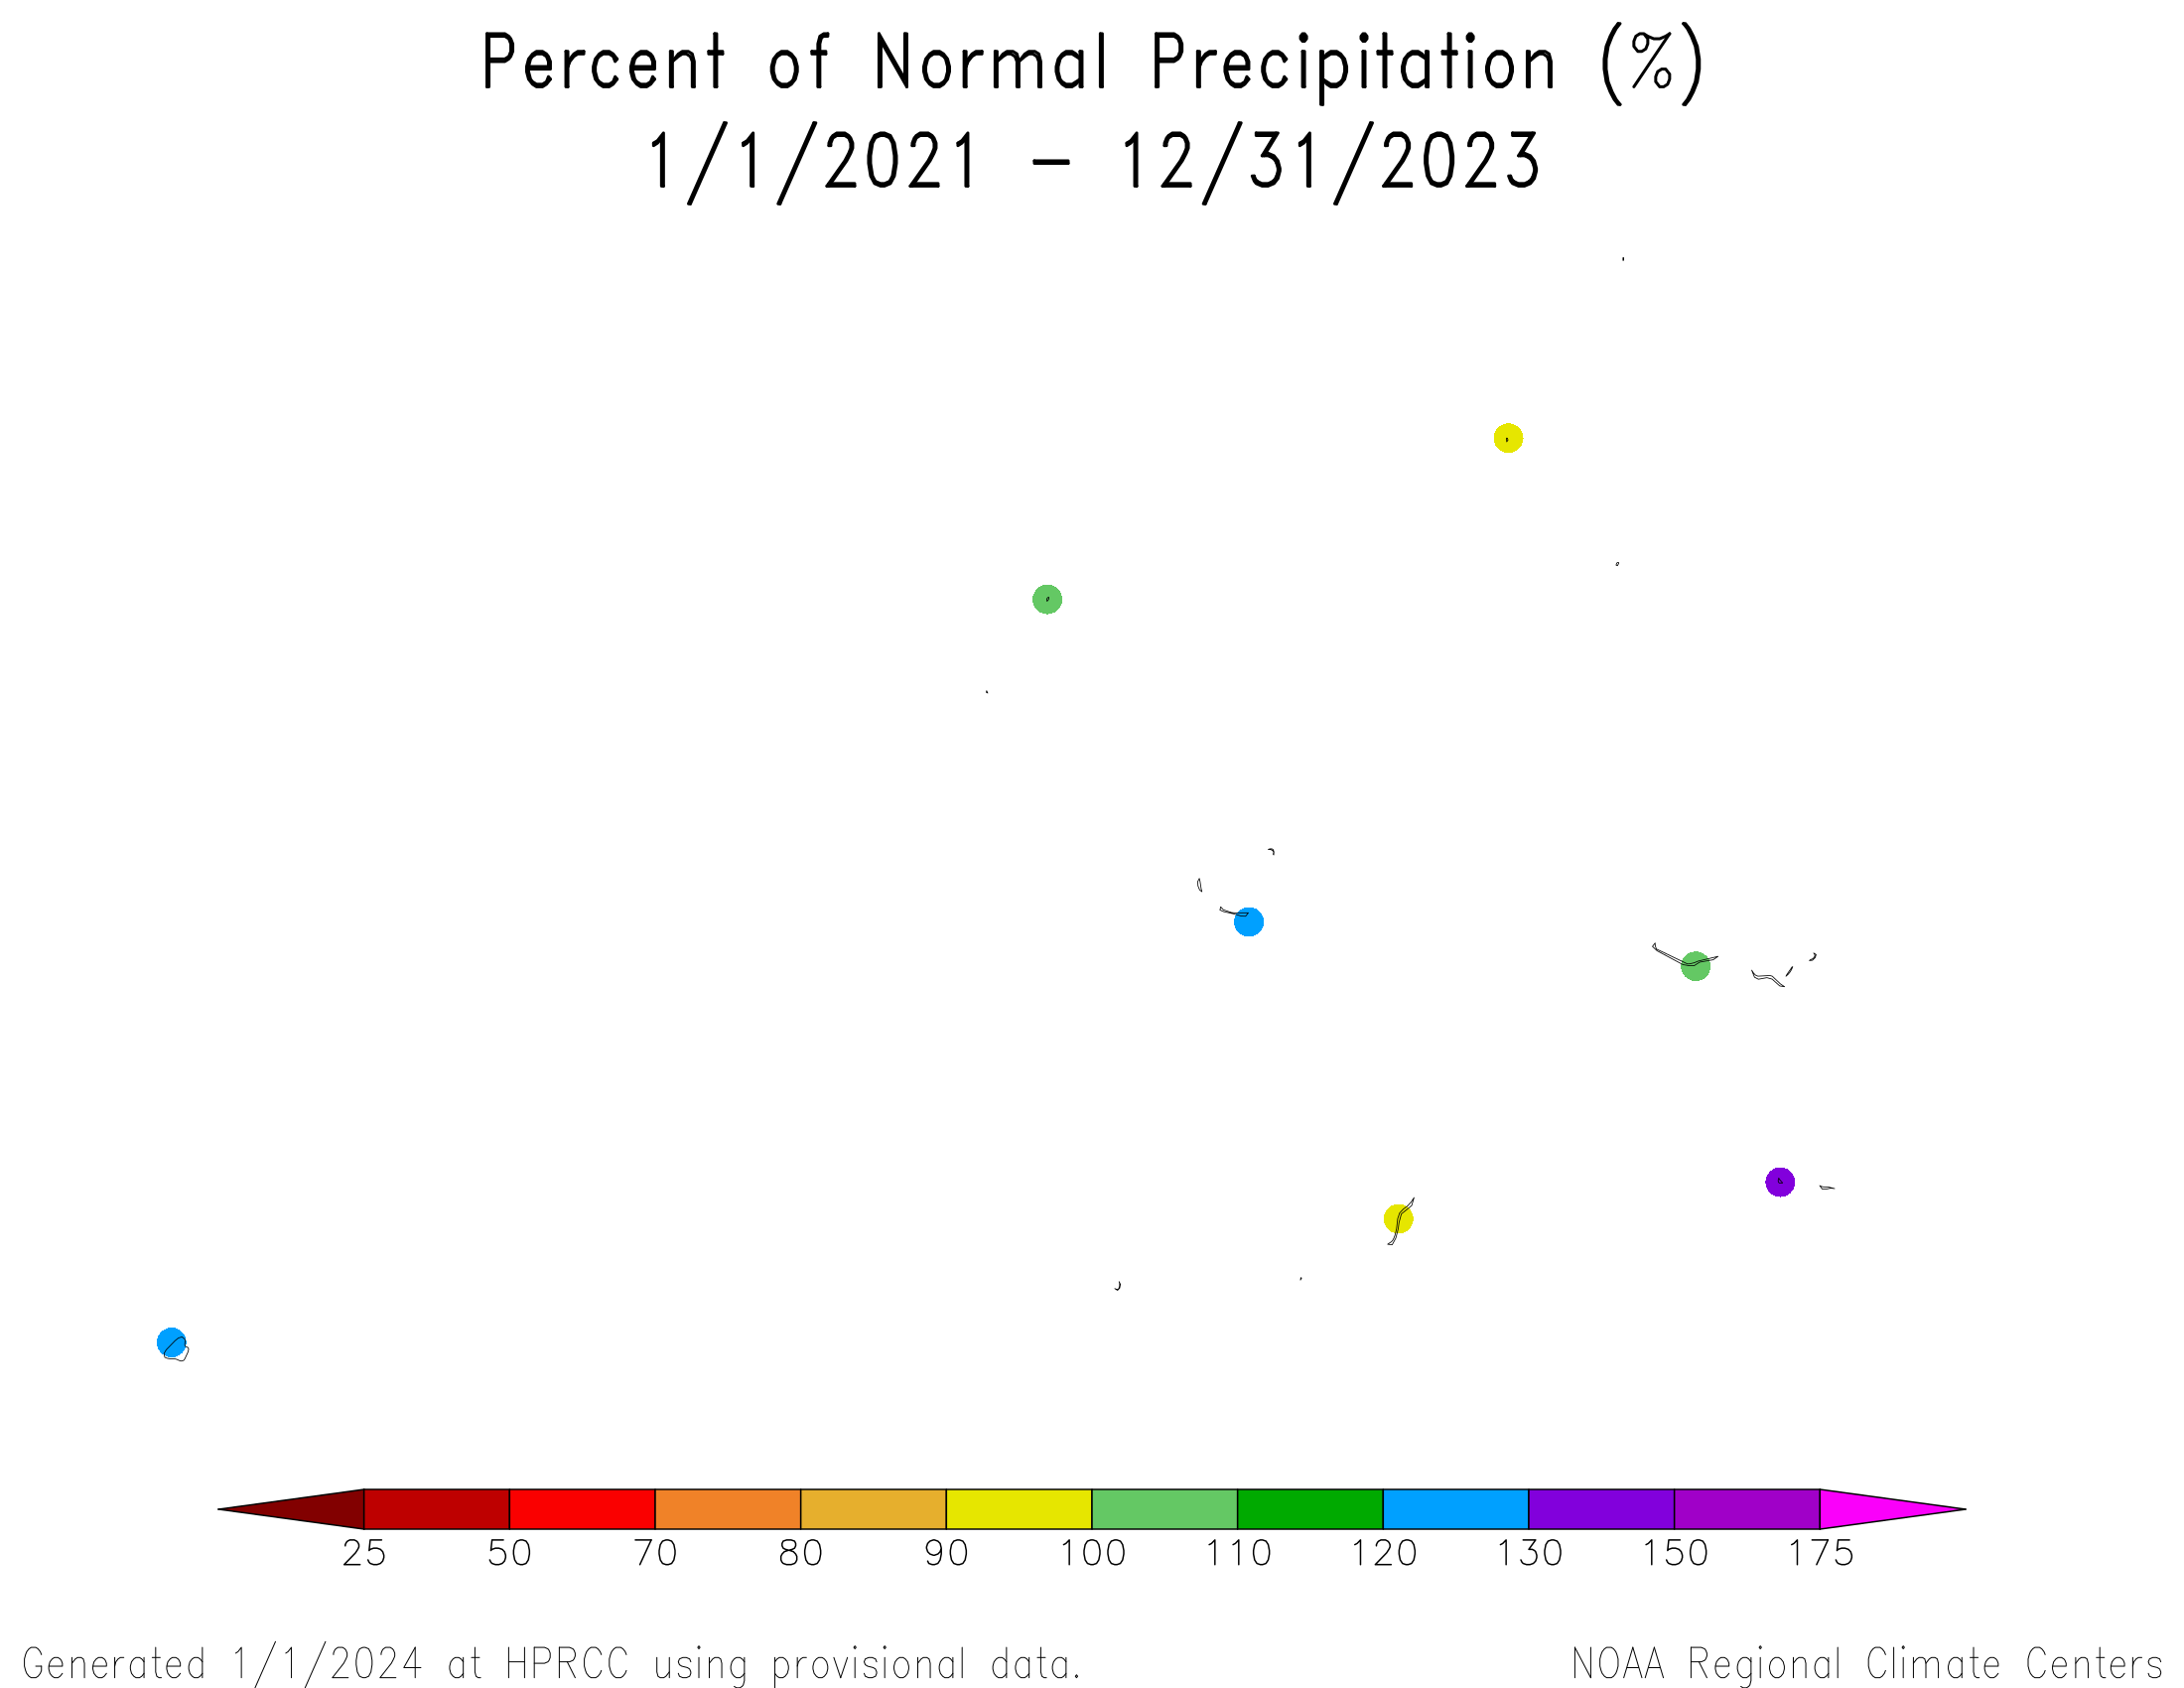
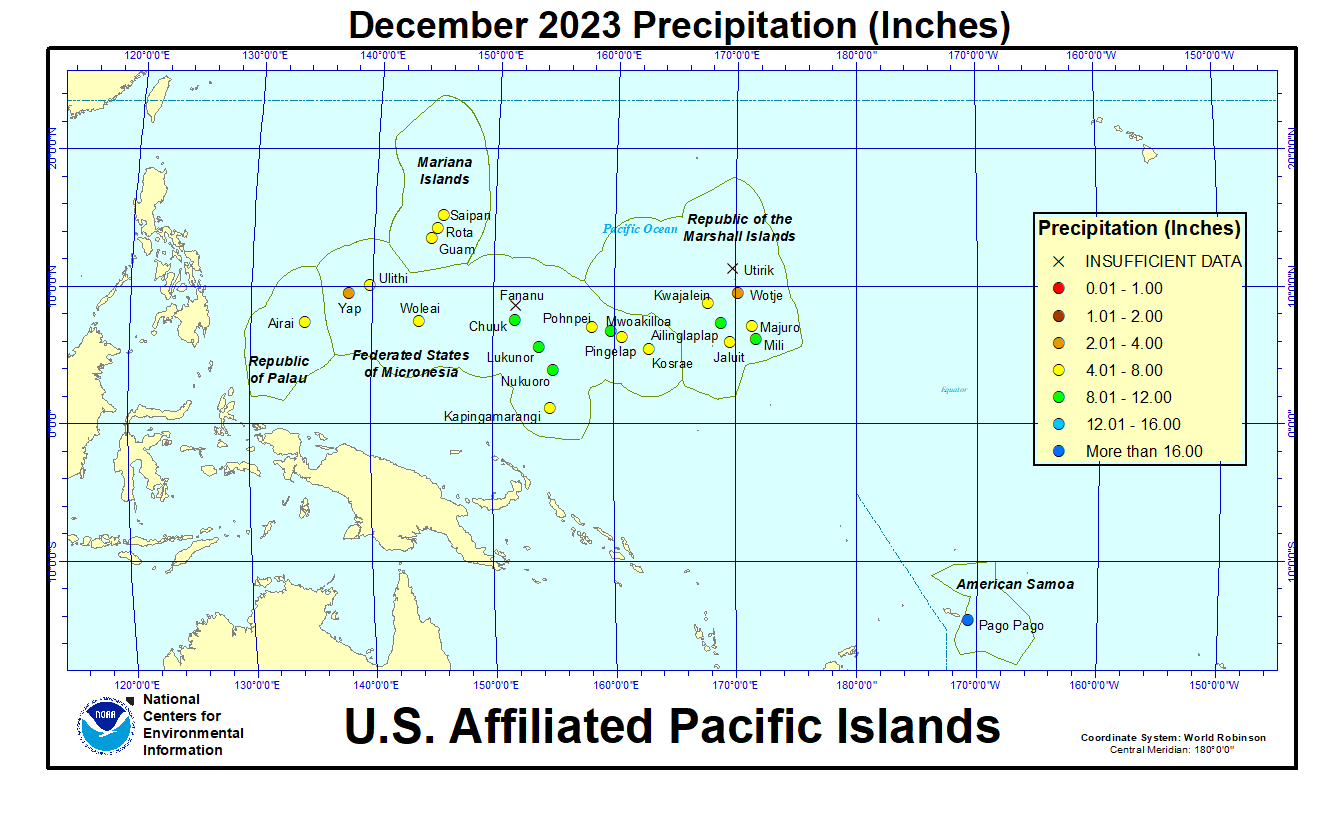
In the U.S. Affiliated Pacific Islands (USAPI) (maps — Federated States of Micronesia [FSM], Northern Mariana Islands, Marshall Islands [RMI], Republic of Palau [ROP], American Samoa, basinwide), December 2023 was drier than normal in Palau, the FSM, and parts of the Marshalls, but near to wetter than normal in the Marianas, American Samoa, and other parts of the Marshalls.
Monthly precipitation amounts were below the monthly minimum needed to meet most water needs (4 inches in the Marianas and Pago Pago, and 8 inches elsewhere) at Airai (Republic of Palau); in western, southern, and eastern parts of the FSM (Yap, Ulithi, Woleai, Kapingamarangi, Pohnpei, Pingelap, and Kosrae); and in parts of the Marshalls (Jaluit, Kwajalein, Majuro, and Wotje). December precipitation was above the monthly minimums at the rest of the stations across the USAPI. The 4- and 8-inch thresholds are important because, if monthly precipitation falls below the threshold, then water shortages or drought become a concern.
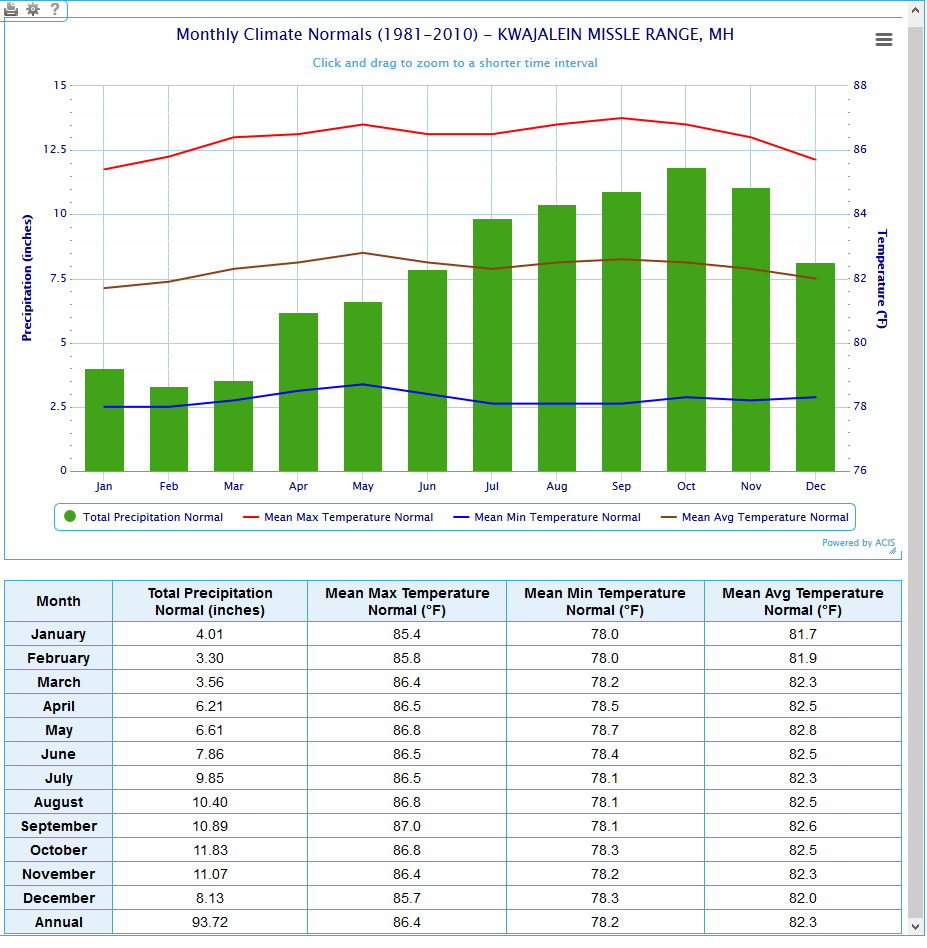
The tropical Pacific climatology can experience extremes in precipitation, from very low precipitation during the dry season to very high precipitation during the wet season. This can result in monthly normal precipitation values that are different from the monthly minimum needed to meet most water needs, and this can lead to percent of normal values that seem odd. This was the case during December 2023, which is in the wet season for American Samoa, Pohnpei, and Kosrae, and in the dry season for Palau, Guam, and most of the FSM. Precipitation was below the monthly minimum but above normal (1981-2010 normal) at:
- Kwajalein: December 2023 precipitation 7.42 inches, December normal mean 8.13 inches, December normal median 6.66 inches.
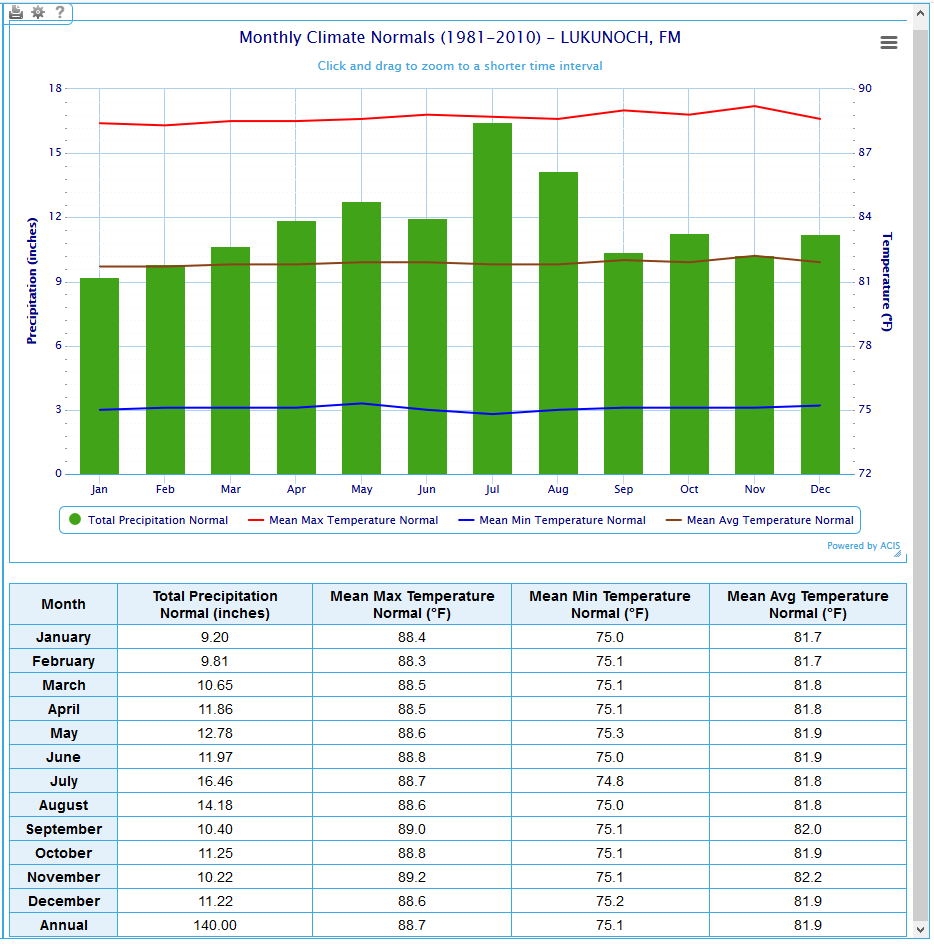
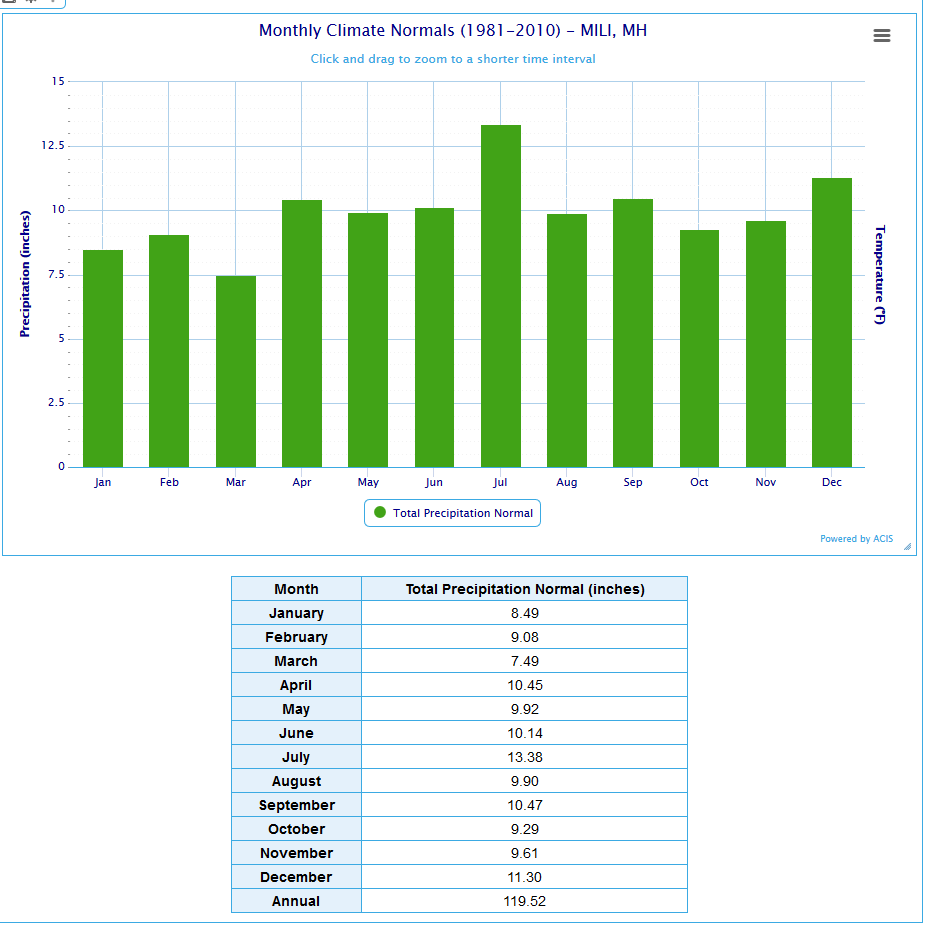
Precipitation was above the monthly minimum but below normal (1981-2010 normal), because the normals are high, at:
- Lukunor: December 2023 precipitation 10.54 inches, December normal mean 11.22 inches, December normal median 11.27 inches.
- Ailinglaplap: December 2023 precipitation 8.37 inches, December normal mean 9.28 inches.
- Mili: December 2023 precipitation 8.98 inches, December normal mean 11.30 inches.
In the table below, the station identified as Koror is Palau International Airport (Airai).
| Station Name | Jan 2023 | Feb 2023 | Mar 2023 | Apr 2023 | May 2023 | Jun 2023 | Jul 2023 | Aug 2023 | Sep 2023 | Oct 2023 | Nov 2023 | Dec 2023 | Jan- Dec |
|---|---|---|---|---|---|---|---|---|---|---|---|---|---|
| Chuuk | 92% | 215% | 85% | 137% | 191% | 118% | 130% | 118% | 112% | 110% | 141% | 100% | 122% |
| Guam NAS | 350% | 188% | 263% | 198% | 916% | 146% | 86% | 132% | 98% | 152% | 84% | 107% | 141% |
| Kapingamarangi | 166% | 47% | 116% | 141% | 137% | 145% | 162% | 121% | 256% | 117% | 153% | 74% | 122% |
| Koror | 187% | 102% | 185% | 77% | 165% | 77% | 145% | 125% | 130% | 108% | 85% | 67% | 110% |
| Kosrae | 131% | 188% | 67% | 120% | 87% | 166% | 132% | 104% | 123% | 153% | 163% | 44% | 101% |
| Kwajalein | 224% | 50% | 189% | 188% | 345% | 143% | 45% | 81% | 61% | 103% | 156% | 111% | 123% |
| Lukonor | 124% | 68% | 96% | 77% | 61% | 116% | 75% | 74% | 115% | 136% | 81% | 94% | 81% |
| Majuro | 157% | 138% | 169% | 151% | 102% | 105% | 70% | 95% | 56% | 86% | 101% | 70% | 101% |
| Pago Pago | 114% | 110% | 106% | 152% | 168% | 109% | 102% | 42% | 156% | 91% | 36% | 195% | 104% |
| Pohnpei | 136% | 146% | 109% | 141% | 145% | 121% | 148% | 219% | 156% | 83% | 178% | 48% | 131% |
| Saipan | 441% | 118% | 138% | 192% | 225% | 92% | 46% | 142% | 109% | 92% | 133% | 158% | 125% |
| Yap | 133% | 118% | 137% | 104% | 131% | 121% | 168% | 145% | 70% | 88% | 79% | 41% | 107% |
| Station Name | Jan 2023 | Feb 2023 | Mar 2023 | Apr 2023 | May 2023 | Jun 2023 | Jul 2023 | Aug 2023 | Sep 2023 | Oct 2023 | Nov 2023 | Dec 2023 | Jan- Dec |
|---|---|---|---|---|---|---|---|---|---|---|---|---|---|
| Chuuk | 9.34" | 15.60" | 7.09" | 17.14" | 21.57" | 13.73" | 15.56" | 15.23" | 13.07" | 12.70" | 14.93" | 11.22" | 167.18" |
| Guam NAS | 14.02" | 5.69" | 5.45" | 5.01" | 31.15" | 9.00" | 8.69" | 19.47" | 12.46" | 17.40" | 6.18" | 5.49" | 140.01" |
| Kapingamarangi | 15.23" | 4.37" | 13.24" | 19.19" | 16.59" | 20.04" | 22.86" | 9.87" | 25.45" | 9.55" | 14.14" | 7.33" | 177.86" |
| Koror | 19.04" | 8.74" | 13.74" | 5.60" | 19.53" | 13.44" | 26.81" | 16.86" | 15.26" | 12.80" | 9.65" | 7.46" | 168.93" |
| Kosrae | 21.87" | 24.25" | 10.81" | 21.08" | 15.41" | 24.30" | 19.67" | 14.72" | 17.52" | 16.79" | 22.60" | 7.06" | 216.08" |
| Kwajalein | 7.08" | 1.32" | 4.43" | 9.87" | 23.18" | 9.93" | 4.45" | 7.86" | 6.60" | 11.46" | 17.65" | 7.42" | 111.25" |
| Lukonor | 10.45" | 6.08" | 8.92" | 8.68" | 7.13" | 13.55" | 11.89" | 10.33" | 11.63" | 15.43" | 7.40" | 10.54" | 122.03" |
| Majuro | 12.14" | 9.51" | 11.12" | 14.23" | 10.35" | 11.56" | 7.87" | 11.07" | 6.27" | 10.98" | 13.51" | 7.96" | 126.57" |
| Pago Pago | 15.19" | 13.19" | 11.34" | 14.25" | 16.19" | 5.81" | 5.64" | 2.26" | 10.18" | 8.45" | 3.69" | 25.00" | 131.19" |
| Pohnpei | 17.94" | 13.99" | 14.29" | 25.90" | 29.02" | 17.94" | 22.76" | 31.21" | 19.57" | 12.71" | 26.39" | 7.76" | 239.48" |
| Saipan | 11.16" | 3.05" | 2.61" | 5.05" | 5.35" | 3.34" | 4.13" | 18.62" | 11.03" | 9.80" | 7.44" | 6.07" | 87.65" |
| Yap | 8.51" | 6.11" | 6.26" | 5.86" | 10.28" | 14.59" | 25.35" | 21.43" | 9.46" | 10.74" | 6.95" | 3.53" | 129.07" |
| Station Name | Jan 2023 | Feb 2023 | Mar 2023 | Apr 2023 | May 2023 | Jun 2023 | Jul 2023 | Aug 2023 | Sep 2023 | Oct 2023 | Nov 2023 | Dec 2023 | Jan- Dec |
|---|---|---|---|---|---|---|---|---|---|---|---|---|---|
| Chuuk | 10.10" | 7.25" | 8.32" | 12.47" | 11.30" | 11.66" | 11.98" | 12.86" | 11.71" | 11.51" | 10.61" | 11.25" | 136.77" |
| Guam NAS | 4.01" | 3.03" | 2.07" | 2.53" | 3.40" | 6.18" | 10.14" | 14.74" | 12.66" | 11.44" | 7.38" | 5.11" | 99.09" |
| Kapingamarangi | 9.15" | 9.27" | 11.43" | 13.64" | 12.08" | 13.78" | 14.15" | 8.13" | 9.93" | 8.19" | 9.27" | 9.84" | 145.85" |
| Koror | 10.18" | 8.56" | 7.44" | 7.32" | 11.83" | 17.48" | 18.53" | 13.50" | 11.77" | 11.84" | 11.39" | 11.16" | 152.90" |
| Kosrae | 16.67" | 12.93" | 16.06" | 17.51" | 17.75" | 14.64" | 14.91" | 14.22" | 14.22" | 10.94" | 13.83" | 16.11" | 213.87" |
| Kwajalein | 3.16" | 2.64" | 2.35" | 5.26" | 6.72" | 6.93" | 9.87" | 9.74" | 10.74" | 11.18" | 11.28" | 6.66" | 90.41" |
| Lukonor | 8.41" | 8.93" | 9.26" | 11.31" | 11.69" | 11.65" | 15.93" | 14.04" | 10.15" | 11.32" | 9.08" | 11.27" | 151.36" |
| Majuro | 7.74" | 6.88" | 6.58" | 9.42" | 10.11" | 11.01" | 11.17" | 11.69" | 11.17" | 12.73" | 13.44" | 11.39" | 125.25" |
| Pago Pago | 13.34" | 12.00" | 10.68" | 9.39" | 9.66" | 5.33" | 5.55" | 5.38" | 6.53" | 9.26" | 10.14" | 12.84" | 125.57" |
| Pohnpei | 13.18" | 9.55" | 13.17" | 18.41" | 19.96" | 14.81" | 15.43" | 14.26" | 12.55" | 15.27" | 14.83" | 16.08" | 182.36" |
| Saipan | 2.53" | 2.59" | 1.89" | 2.63" | 2.38" | 3.62" | 8.91" | 13.13" | 10.09" | 10.62" | 5.61" | 3.85" | 70.25" |
| Yap | 6.39" | 5.19" | 4.56" | 5.63" | 7.85" | 12.04" | 15.08" | 14.82" | 13.50" | 12.18" | 8.83" | 8.51" | 120.31" |
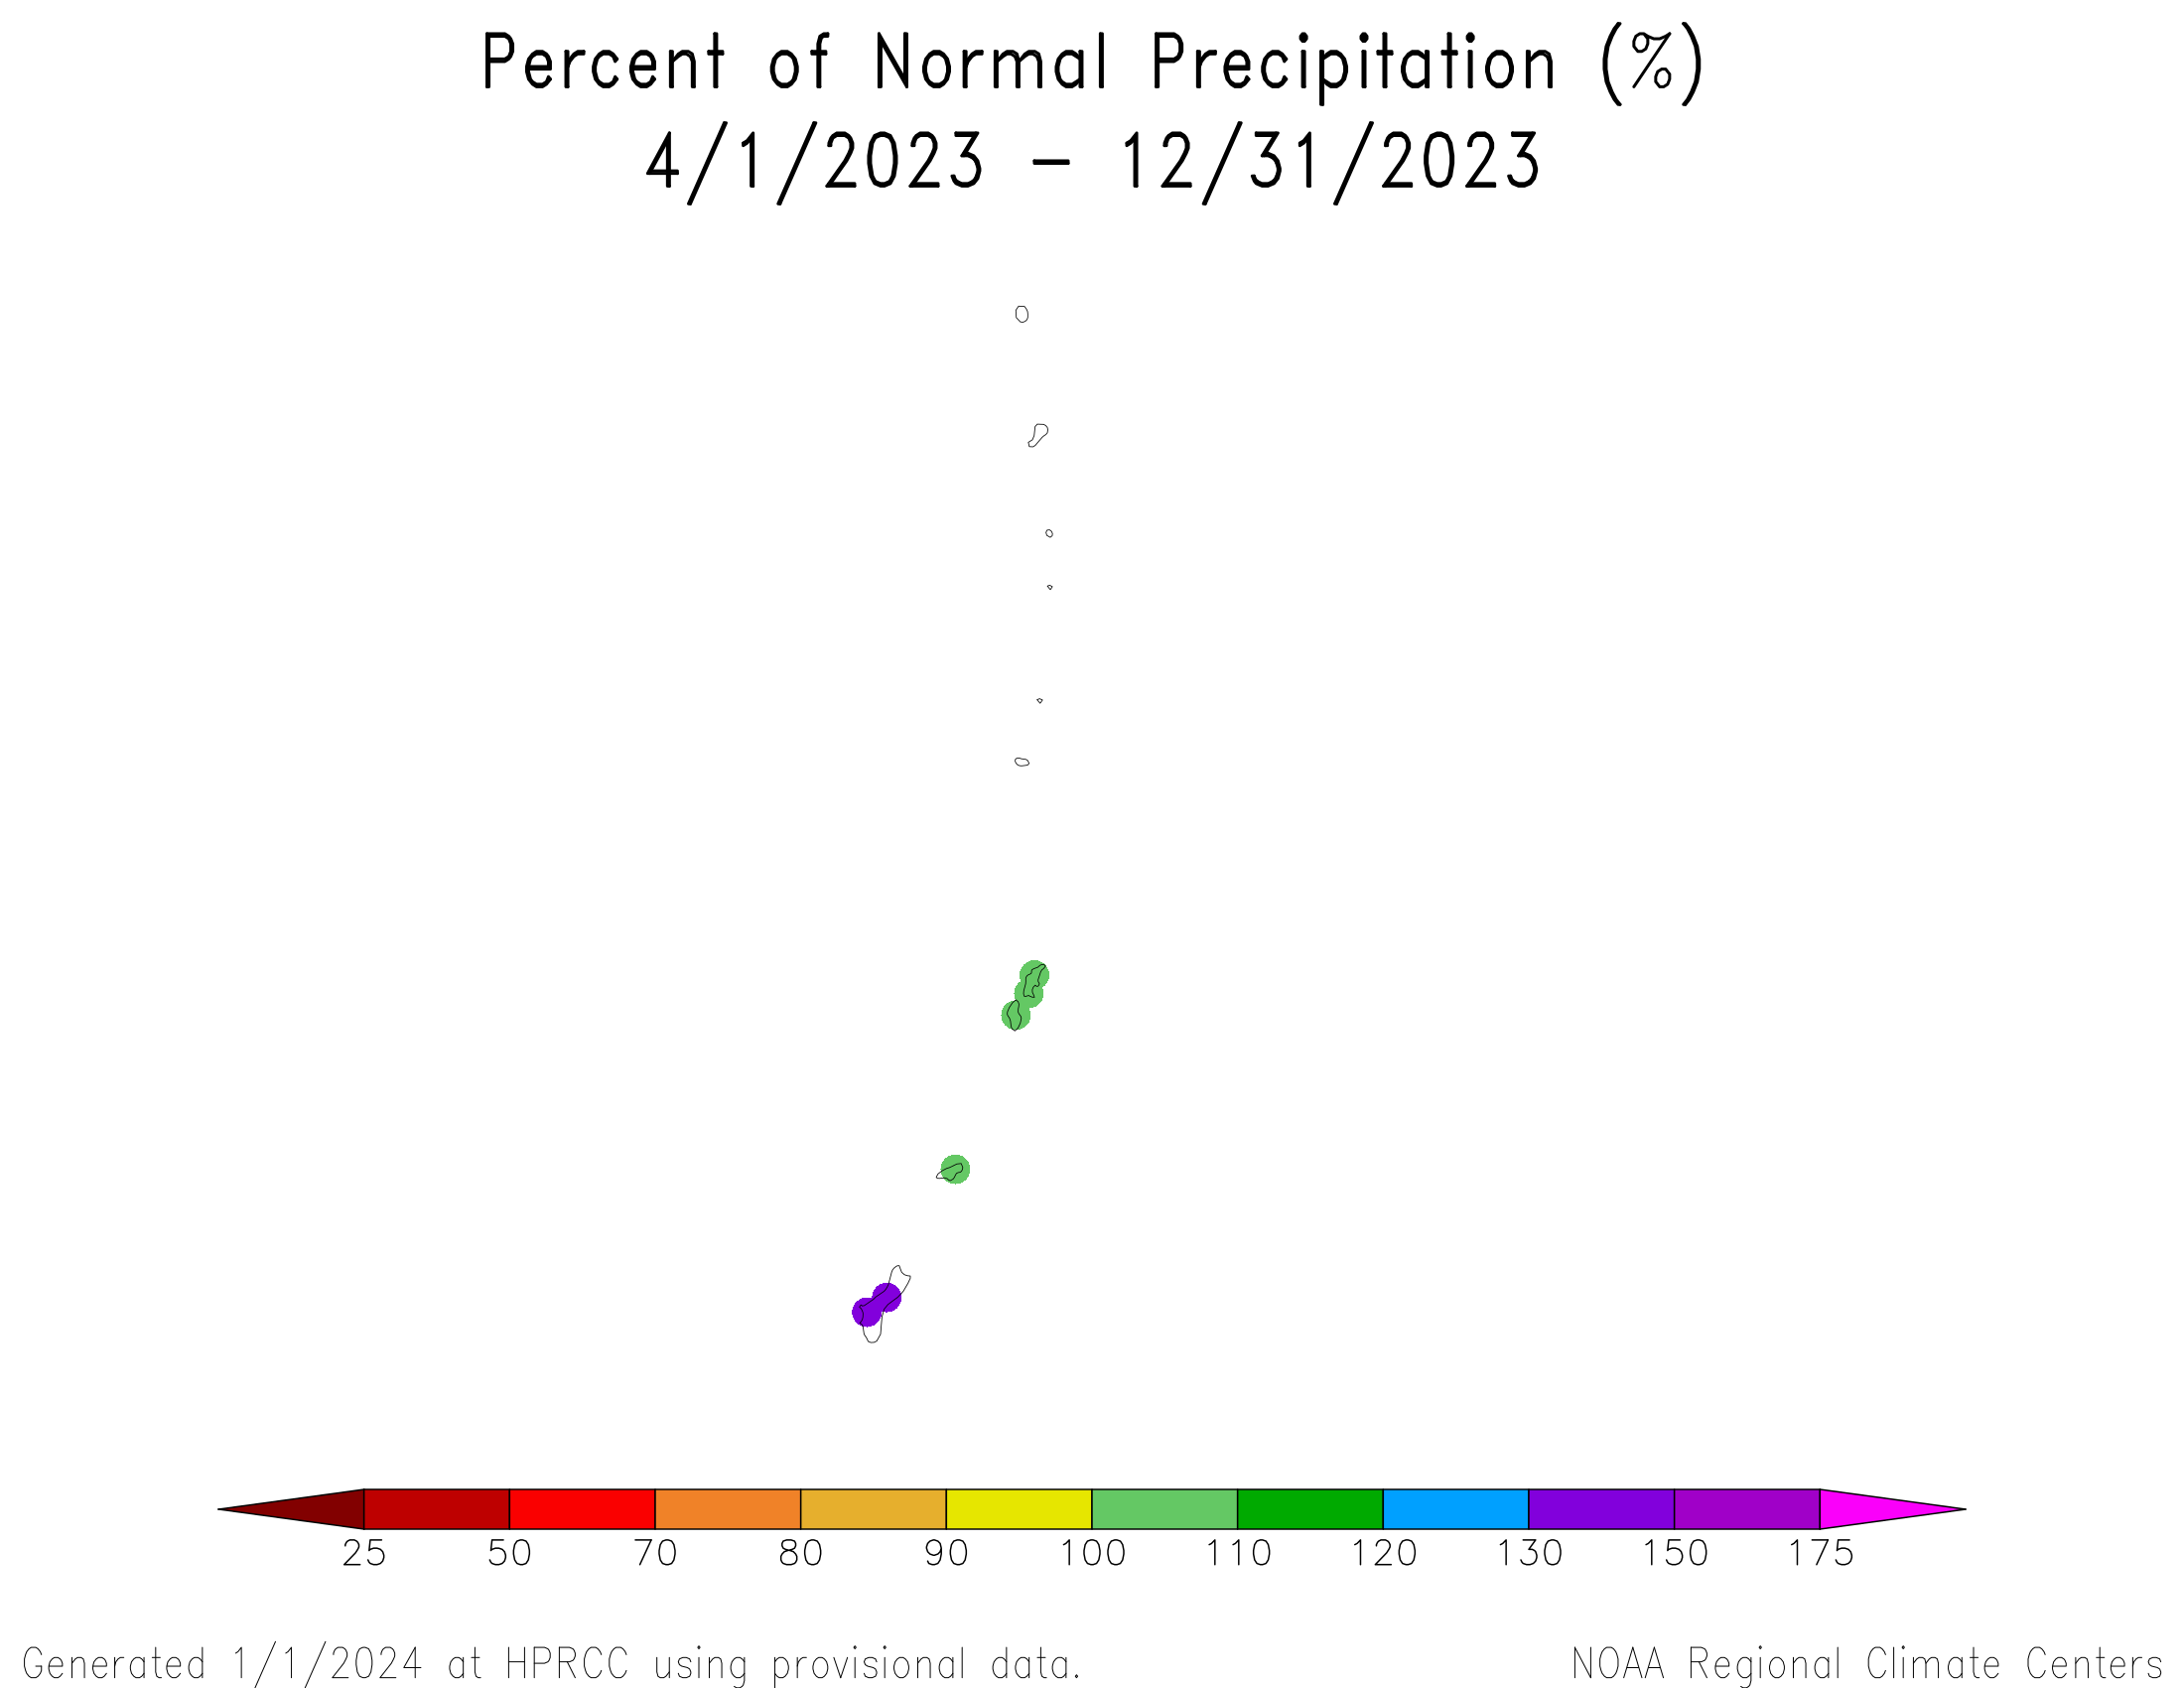
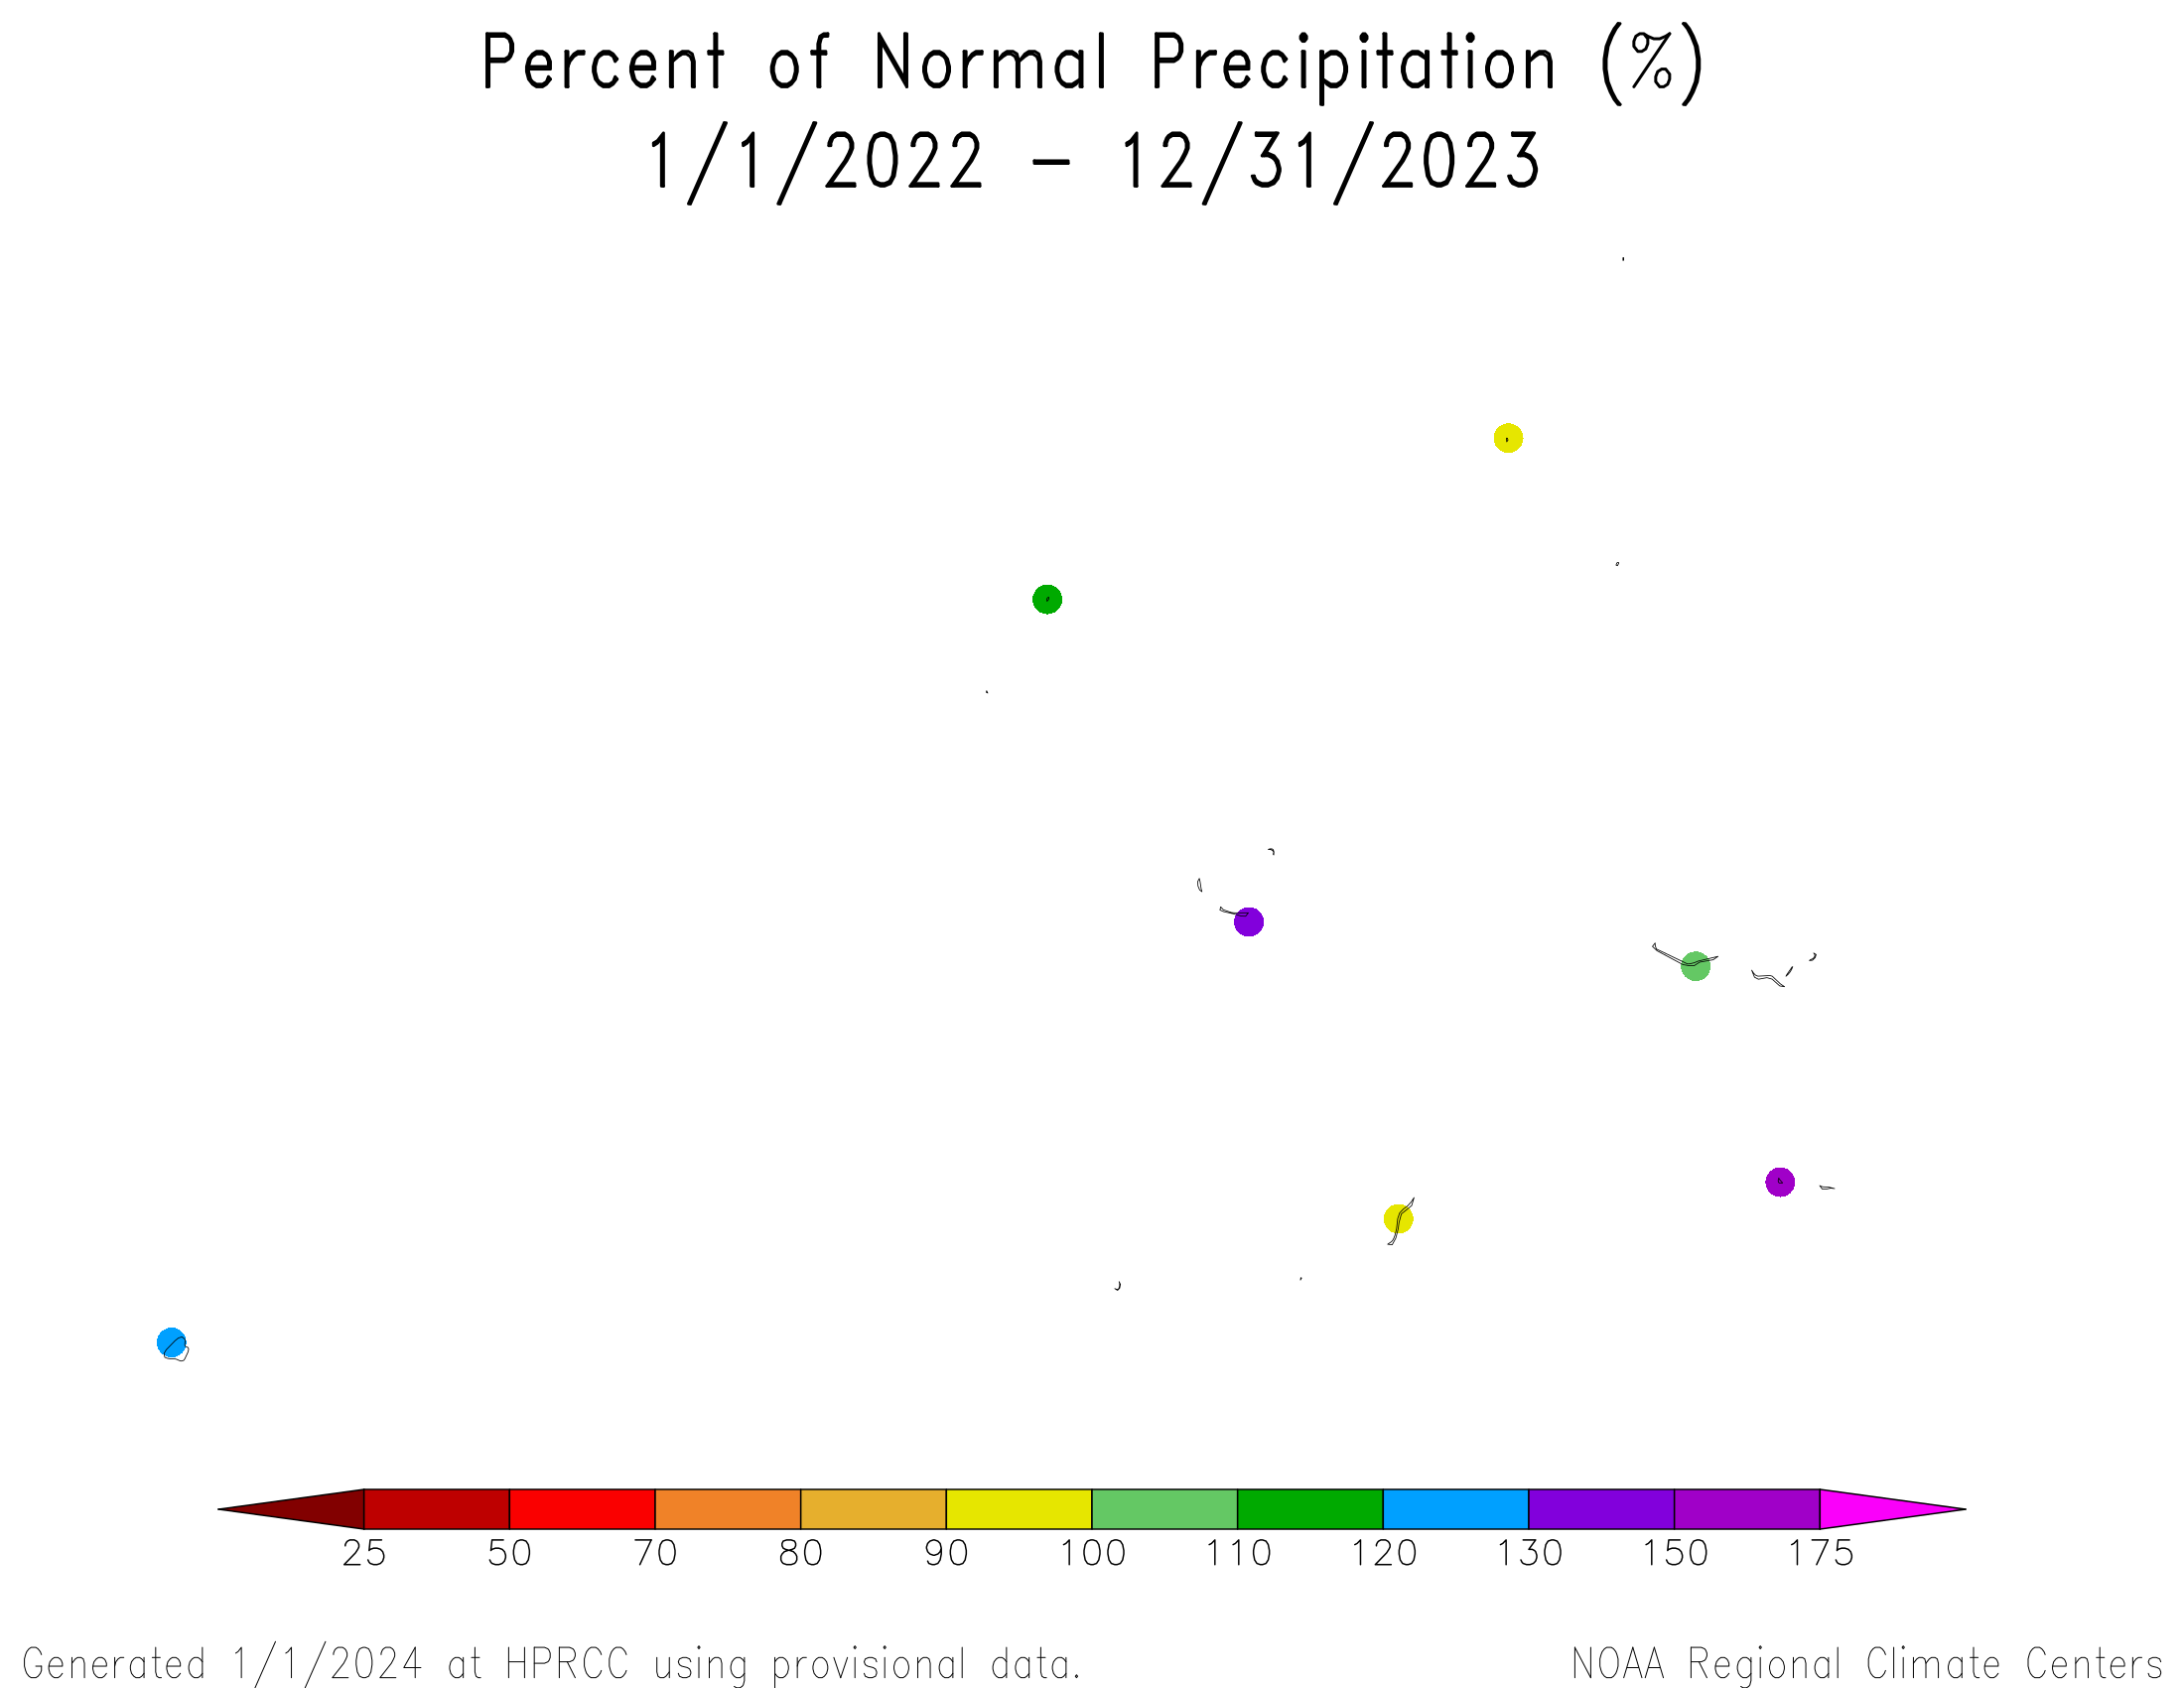
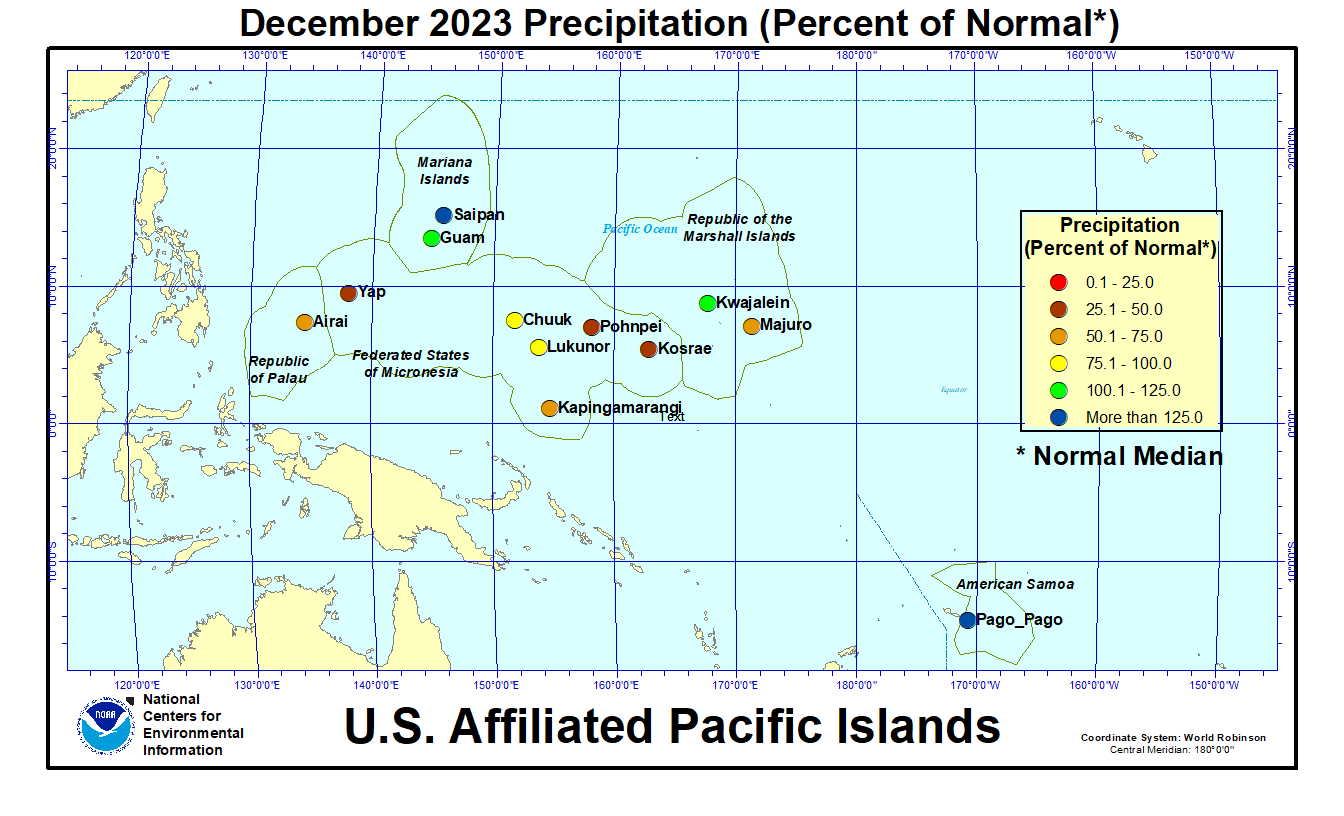
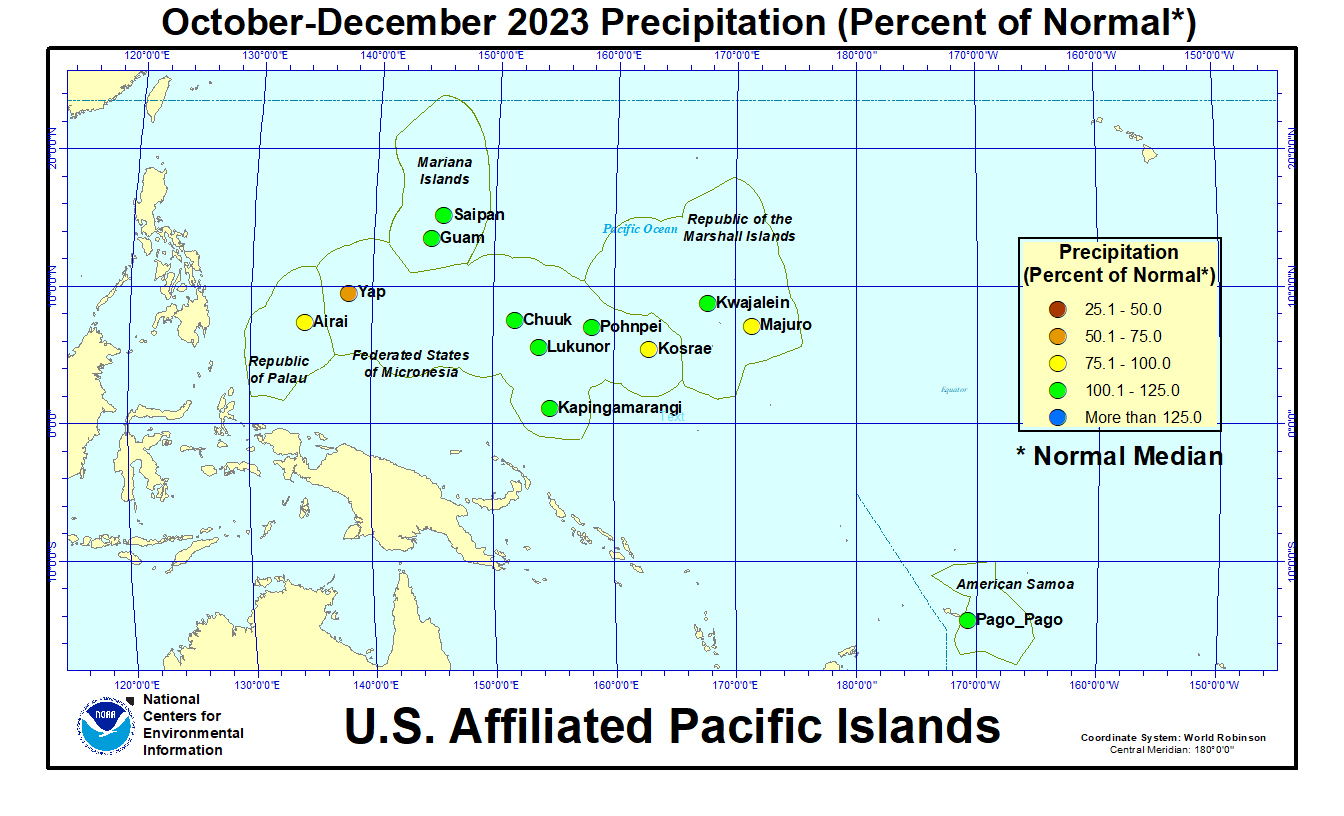
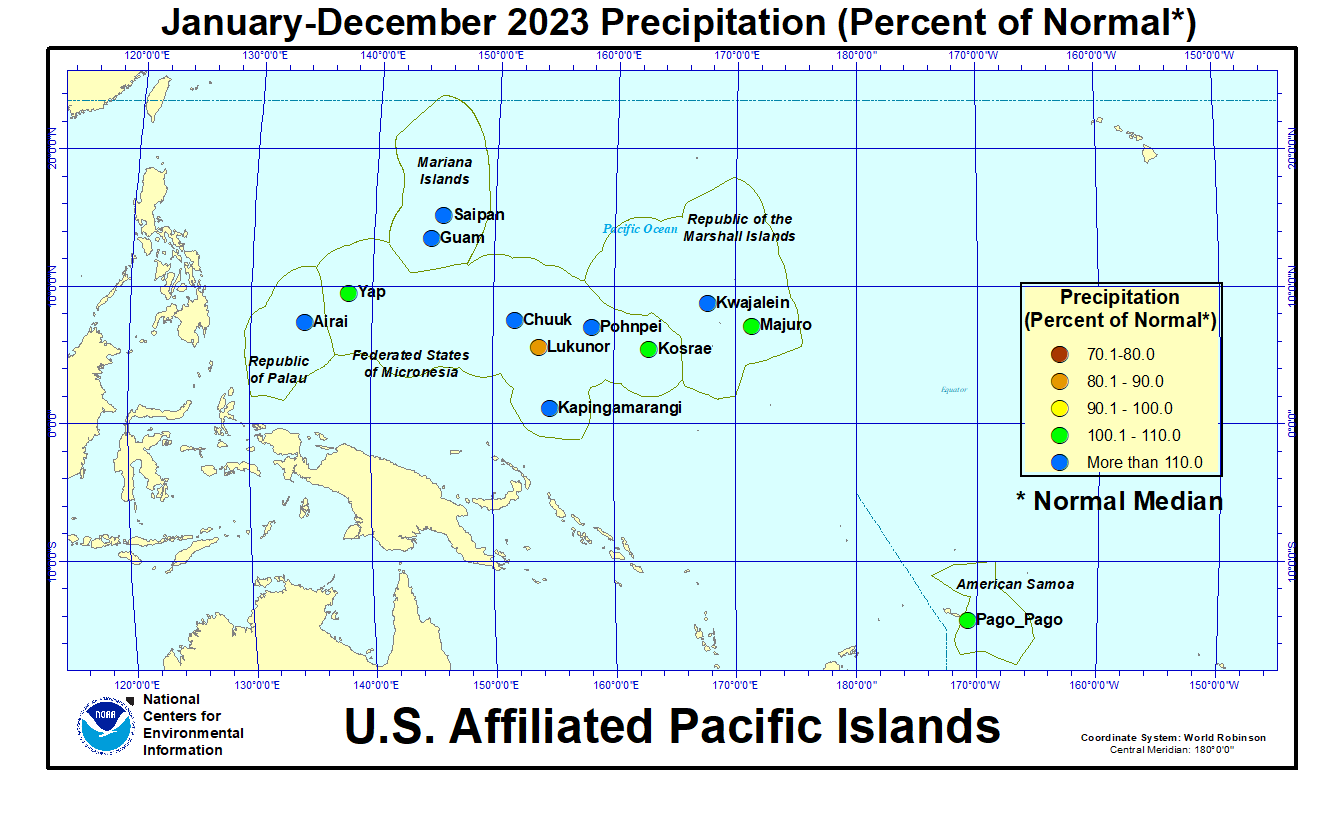
As measured by percent of normal precipitation, no station was drier than normal at all time scales in the short term (December and the last 3 months [October-December]) and long term (last 12 months [January-December 2023]). Lukunor was drier than normal for December and the last 12 months but near normal for the last 3 months. Airai, Majuro, and Yap were drier than normal in the short term but near to wetter than normal in the long term. Kapingamarangi, Kosrae, and Pohnpei were drier than normal for December but near to wetter than normal at the other time scales. Chuuk, Guam, Kwajalein, Pago Pago, and Saipan were near to wetter than normal in the short term and long term.


Based on percent of normal average (instead of normal median values), in the Marianas Islands, December and November-December were wet at Rota but dry across Guam and Saipan. The last 3 to 6 months had a mixed precipitation anomaly pattern across the main islands. Wetter-than-normal conditions dominated at 9- to 24-month time scales, with a mixed anomaly pattern at longer time scales (percent of normal precipitation maps for the last 1, 2, 3, 4, 6, 9, 12, 24, 36, 48, 60 months).
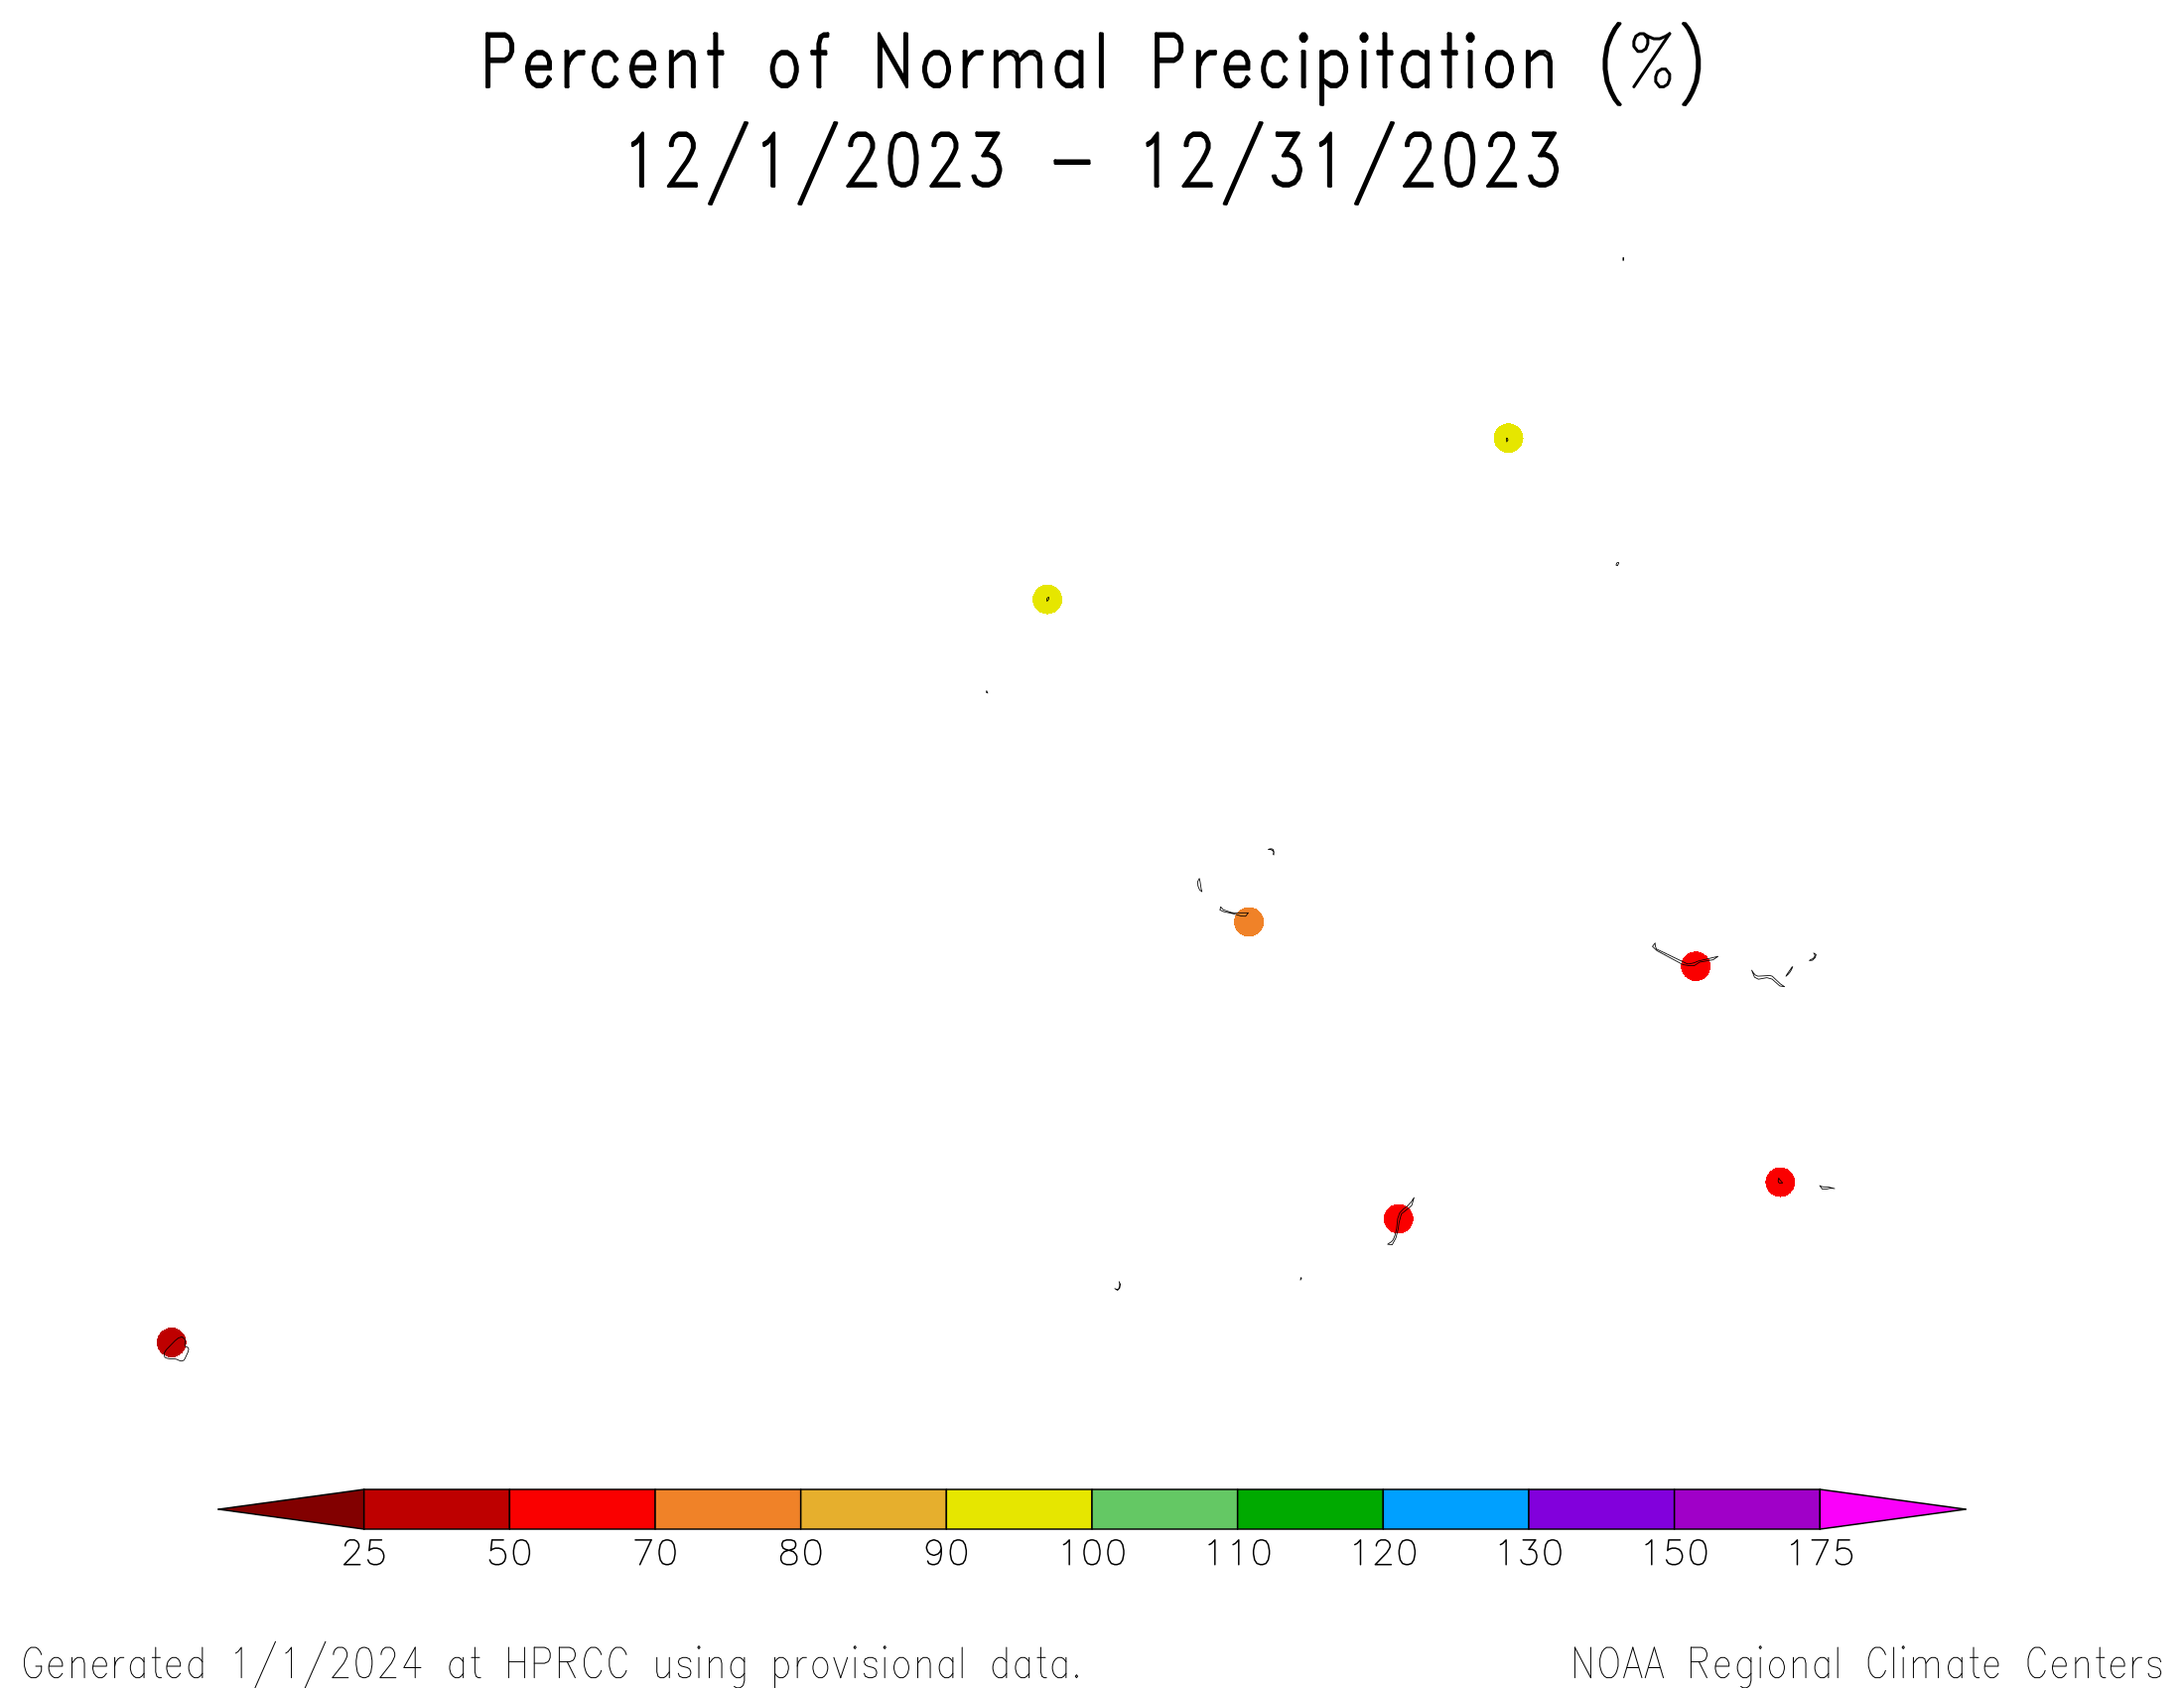


Based on percent of normal average (instead of normal median values), the Marshall Islands were drier than normal in December. A mixed precipitation anomaly pattern exists at longer time scales, with generally wetter-than-normal conditions in the southeast and west central islands and drier-than-normal conditions in the northeast and southwest islands, and occasionally northwest (percent of normal precipitation maps for the last 1, 2, 3, 4, 6, 9, 12, 24, 36, 48, 60 months).
According to the December 31 USDM produced for the USAPI, drought developed in the western FSM and northern Marshalls during December, with abnormal dryness spreading across the central to eastern FSM. At the end of December, Ulithi (FSM) had severe drought, Yap (FSM) and Wotje (Marshalls) had moderate drought, and it was abnormally dry at Lukunor, Nukuoro, Pohnpei, and Pingelap in the FSM. The rest of the USAPI stations were free of drought and abnormal dryness. At the end of November, there were 4 stations experiencing abnormal dryness. At the end of December, 4 stations were abnormally dry, 2 were experiencing moderate drought, and one was in severe drought. According to the National Weather Service, reports have been received of stressed or dying crops and struggling municipal water systems in Pohnpei, and low water wells and low or empty water tanks in Yap State.
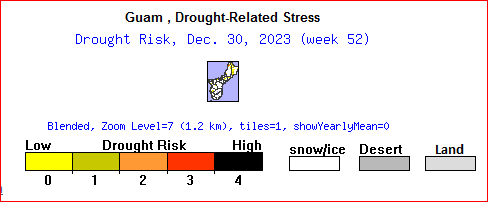
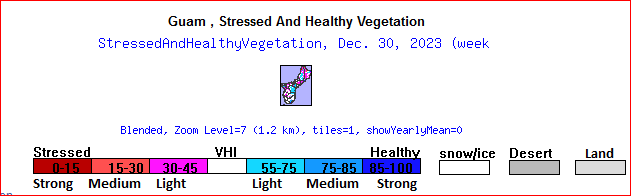
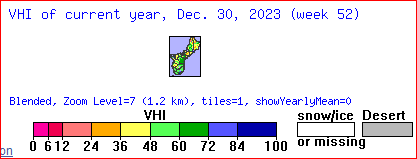
The level of the reservoir on Majuro increased during early December then fluctuated up and down around a modestly high level for the rest of the month. The minimum volume of 31.1 million gallons occurred on December 2 and the peak volume of 33.8 million gallons was reached on December 16. The reservoir stood at 32.9 million gallons at the end of the month, which is above the drought threshold value. If the reservoir dips below 28.8 million gallons, drought becomes a concern, so there is no issue with drought on Majuro at this time. Satellite observations of vegetative health (drought stress, stressed vegetation, VHI) indicated there were some areas of stressed vegetation on Guam.
December 2023 precipitation ranks ranged from very dry to very wet but were mostly in the dry to mid-range, based on data available at the time of this report. Long-term conditions also ranged between dry to very wet:
- Kosrae: second driest December (in a 56-year record).
- Pingelap: fourth driest December (38 years) and June-December, fifth driest August-December, and sixth driest May-December.
- Ulithi: eighth driest December (41 years) and third driest November-December, but fourth wettest January-December.
- Wotje: 17th driest December (39 years), but fifth driest August-December and July-December.
- Yap: third driest December (73 years) and September-December, fifth driest November-December, and seventh driest October-December.
- Jaluit: seventh driest December (40 years) and fourth driest June-December back to March-December, fifth driest July-December and February-December, and sixth driest January-December.
- Ponhpei: seventh driest December (73 years), but second wettest January-December.
- Majuro: fourth driest July-December (70 years).
At the wet end of the scale:
- Pago Pago had the fourth wettest December (58 years).
- Guam had the wettest January-December (66 years), May-December, and March-December.
- Mili had the wettest January-December (37 years), June-December, and May-December.
- Pohnpei (72 years) and Kapingamarangi (21 years) had the second wettest January-December.
- Saipan had the fourth wettest January-December (35 years).
The following analysis of historical data for the USAPI stations in the Global Historical Climatology Network-Daily (GHCN-D) dataset, augmented with fill-in data from the 1981-2010 Normals, helps put the current data into historical perspective by computing ranks based on the period of record. The table below lists the precipitation ranks for December 2023, July-December 2023 (last 6 months), and January-December 2023 (the last 12 months). Some stations have a long period of record and their dataset is fairly complete, while other stations have a shorter period of record and the dataset has some missing data.
| Station | December 2023 | Jul-Dec 2023 | Jan-Dec 2023 | Period of Record | |||
|---|---|---|---|---|---|---|---|
| Rank | Years | Rank | Years | Rank | Years | ||
| Ailinglaplap | 20 | 40 | 21 | 39 | 32 | 39 | 1981-2023 |
| Airai | 11 | 73 | 53 | 72 | 59 | 71 | 1951-2023 |
| Chuuk | 36 | 73 | 50 | 73 | 67 | 72 | 1951-2023 |
| Fananu | -- | 9 | -- | 5 | -- | 2 | 2003-2023 |
| Guam | 33 | 67 | 34 | 67 | 66 | 66 | 1957-2023 |
| Jaluit | 7 | 40 | 5 | 40 | 6 | 39 | 1981-2023 |
| Kapingamarangi | 12 | 33 | 23 | 23 | 20 | 21 | 1962-2023 |
| Kosrae | 2 | 56 | 26 | 43 | 22 | 37 | 1954-2023 |
| Kwajalein | 45 | 72 | 17 | 72 | 52 | 71 | 1952-2023 |
| Lukunor | 17 | 40 | 10 | 27 | 7 | 27 | 1981-2023 |
| Majuro | 20 | 70 | 4 | 70 | 30 | 69 | 1954-2023 |
| Mili | 10 | 39 | 36 | 37 | 37 | 37 | 1981-2023 |
| Nukuoro | 20 | 41 | 30 | 40 | 31 | 39 | 1981-2023 |
| Pago Pago | 55 | 58 | 27 | 58 | 38 | 57 | 1966-2023 |
| Pingelap | 4 | 38 | 6 | 37 | -- | 35 | 1981-2023 |
| Pohnpei | 7 | 73 | 72 | 73 | 71 | 72 | 1951-2023 |
| Saipan | 31 | 36 | 26 | 36 | 32 | 35 | 1981-2023 |
| Ulithi | 8 | 41 | 31 | 38 | 33 | 36 | 1981-2023 |
| Utirik | -- | 19 | -- | 8 | -- | 4 | 1985-2020 |
| Woleai | 12 | 43 | 17 | 31 | -- | 27 | 1968-2023 |
| Wotje | 17 | 39 | 5 | 38 | 23 | 38 | 1981-2023 |
| Yap | 3 | 73 | 50 | 73 | 47 | 72 | 1951-2023 |
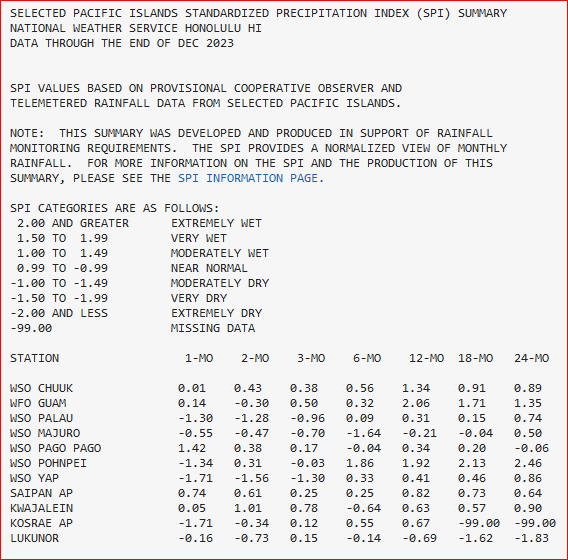
SPI values for seven time periods for Pacific Islands, computed by the Honolulu NWS office.
NOAA Regional Climate Centers
More information, provided by the NOAA Regional Climate Centers and others, can be found below.
Southeast
As noted by the Southeast Regional Climate Center, temperatures were mostly above average across the Southeast in December, and December precipitation was above average across much of the region. While much of the region was wetter than average, parts of central Alabama and Georgia largely missed out on the precipitation. Montgomery, AL recorded 1.58 inches (40 mm) of precipitation (32 percent of normal), while Columbus, GA recorded 1.86 inches (47 mm) of precipitation (39 percent of normal) for the month. Precipitation was also below average across much of Puerto Rico, though there were pockets of above average totals, including San Juan, which was nearly 3 inches (76 mm) above average for the month (159 percent of normal). Precipitation was above average on Saint Thomas and below average on Saint Croix.
Temperatures in 2023 were above average across much of the Southeast region. Annual precipitation totals were variable across the Southeast region in 2023. The driest locations were found across the western Panhandle of Florida, southern Alabama, southwest North Carolina, and northern Virginia. Below average precipitation was also observed across northern portions of Alabama and Georgia and eastern portions of North Carolina and Virginia. Precipitation was below average across the U.S. Virgin Islands. Saint Thomas recorded 25.46 inches (647 mm) for the year, which was the lowest annual precipitation total recorded across the entire Southeast region. The lowest total in the mainland Southeast was recorded in Tarpon Springs, FL, located north of Tampa, which observed its driest year on record (since 1892) with 25.50 inches (648 mm) of precipitation. Nearby Sarasota, FL also recorded its driest year on record (since 1911) with 27.13 inches (689 mm) of precipitation. In contrast, the wettest locations were found across southern and eastern Florida, the Big Bend region of Florida, southeastern Georgia, and central South Carolina. Above average precipitation was also observed across the eastern Panhandle of Florida and central portions of Alabama, Georgia, the Carolinas, and Virginia. Annual precipitation was generally below average across northern and interior portions of Puerto Rico and above average across the southern and eastern regions of the island.
December Drought Summary: The prodigious precipitation totals during the month led to improvements in drought conditions across much of the Southeast, with one to two category improvements in many places. The area of extreme (D3) drought contracted in the interior of the region, with just a few small areas remaining across central and northern portions of Alabama. A small area of extreme (D3) drought also persisted across the West Coast of Florida. Severe (D2) drought was largely eliminated across western and central portions of North Carolina and Virginia, but persisted across northern portions of Alabama, Georgia, and Virginia, as well as extreme southwest North Carolina. Drought was eliminated across the northern Gulf Coast, southern Georgia, and eastern portions of the Carolinas. Some abnormal dryness (D0) was introduced across central Georgia. In the Caribbean, small pockets of moderate (D1) drought persisted across Puerto Rico, with abnormal dryness (D0) persisting across much of the interior and south coastal regions of the island. Severe (D2) drought persisted on Saint Thomas, while moderate (D1) drought persisted on Saint Croix. Saint John remained drought-free.
Annual Drought Summary: January 2023 began with about 40 percent of the Southeast region in some designation of drought. Severe (D2) drought was found across the Florida Panhandle and extreme southern portions of Alabama and Georgia, while moderate (D1) drought and abnormal dryness (D0) were observed across central and southern portions of Alabama and Georgia, and eastern portions of Virginia and the Carolinas. Drought was largely absent across the Florida Peninsula and much of the interior of the region. Over the next several weeks, drought conditions were eliminated across much of the region, except across the Florida Peninsula, where moderate (D1) drought had emerged by the middle of February. Abnormal dryness (D0) emerged in Puerto Rico, while moderate (D1) emerged across the U.S. Virgin Islands. Over the next several weeks, abnormal dryness (D0) emerged across northwest Florida, southern portions of Alabama and Georgia, and central and eastern portions of North Carolina and Virginia, while severe (D2) and extreme (D3) drought emerged across the Florida Peninsula by early April. Moderate (D1) drought emerged across Puerto Rico, covering nearly half of the island by early April, while severe (D2) drought emerged on Saint Croix. Over the next several weeks, drought conditions would again improve across the Southeast, with a few pockets of abnormal dryness (D0) scattered across much of the region by the end of spring. The only exception was a narrow band of moderate (D1) and severe (D2) drought along the West Coast of Florida that would further narrow and intensify through the rest of the year. Drought coverage remained relatively low across the mainland Southeast (less than 10 percent of the region) for much of the summer while drought conditions worsened across the Caribbean. Severe (D2) drought emerged across Puerto Rico and Saint John, extreme (D3) drought emerged on Saint Thomas, and exceptional (D4) drought emerged on Saint Croix over the summer. Drought conditions eventually worsened again across the mainland Southeast. By mid-October, over 25 percent of the region was in at least moderate (D1) drought, mostly across the interior of the region. Extreme (D3) drought emerged across southern Alabama and northwest Florida, while severe (D2) drought was found across central and northern portions of Alabama, as well as the Shenandoah Valley of Virginia. Drought also worsened across the U.S. Virgin Islands, with exceptional (D4) drought emerging across Saint Croix and Saint Thomas, while some moderate (D1) drought persisted across Puerto Rico. By early November, exceptional (D4) drought had emerged across northern portions of Alabama and Georgia, while severe (D2) and extreme (D3) drought expanded along the northern Gulf Coast and across the interior of the region. Drought coverage across the mainland Southeast peaked in late November, with more than 60 percent of the region in at least moderate (D1) drought and over 40 percent of the region in at least severe (D2) drought. A wet December helped alleviate drought conditions across the interior of the region. By the end of the year, over 50 percent of the region was at least abnormally dry (D0), while a third of the region was in at least moderate (D1) drought. Severe (D2) drought remained across northern portions of Alabama, Georgia, and Virginia, while small areas of extreme (D3) drought persisted across northern Alabama and the West Coast of Florida. Abnormal dryness (D0) covered about 50 percent of Puerto Rico, with just a small area of moderate (D1) drought on the northwest corner of the island. Severe drought (D2) was found on Saint Thomas, while moderate (D1) drought prevailed on Saint Croix. Saint John was drought-free at the end of the year.
South
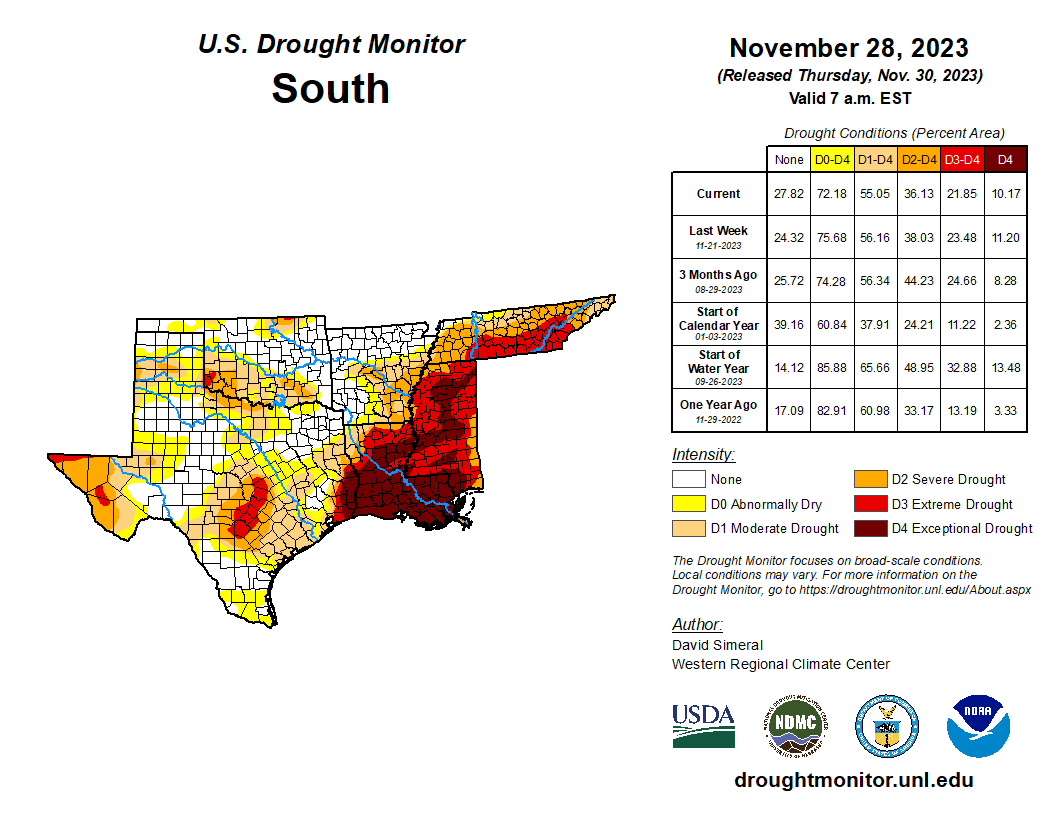
As explained by the Southern Regional Climate Center, temperatures were near normal to above normal across the Southern region during December, and December precipitation was near or below normal, except for central Oklahoma, the Gulf Coasts of Louisiana and Mississippi, and the Oklahoma and Texas Panhandles where precipitation was 150 percent to 400 percent of normal. The year 2023 was a record setting warm year across the Southern region, ranking warmest out of 129 years of weather records. The Southern region as a whole recorded its 33rd driest (34.38 inches) year on record.
December Drought Summary: During December, the Southern region saw continued drought and degradation of drought conditions across much of Louisiana, Mississippi, Arkansas, central and western Tennessee, and portions of deep east Texas. Isolated pockets of Extreme and Severe drought are still present in central Texas and far west Texas. Two to three class improvements, according to the USDM, in drought conditions were observed along the Gulf Coast extending from near Corpus Christi, Texas north and east along the coast through Mississippi. The eastern third of Tennessee, along with isolated areas of Texas and Oklahoma, saw one to two classes of improvement. Dry conditions in the lower Mississippi River Basin have contributed to continued low flows and snarled barge traffic on the Mississippi River south of St. Louis, Missouri. As we move into 2024, monitoring soil moisture for the upcoming growing season is key. Currently, soil moisture values are in the 1st (lowest) percentile according to the Climate Prediction Center's soil moisture model across northcentral Louisiana, much of Mississippi, portions of Tennessee, and the Big Bend area of Texas. The only area of the region averaging above the 70th percentile for soil moisture is western Oklahoma.
Annual Drought Summary: In the first week of 2023, about 38 percent of the Southern region was in drought, including 11 percent in Extreme Drought and 2 percent in Exceptional Drought. Drought in early 2023 was confined to Texas and Oklahoma, with areas of Extreme and Exceptional Drought in central and western Oklahoma, portions of the Texas panhandle and central Texas. Throughout winter 2023, the spatial pattern of drought in the region remained steady, with winter precipitation chipping away at the edges of Exceptional and Extreme drought in Oklahoma. By the end of February, a patch of Extreme Drought emerged in deep south Texas. March saw the expansion of drought conditions on the southern boundaries of the region, with the expanding Extreme Drought in south Texas and the southeast Louisiana coast. Water levels and flows along much of the lower Mississippi River remained well below historical means, with the exceptions being Memphis, Tennessee and Greenville, Mississippi where above average heights were observed.
Again, in April the spatial extent of drought remained stable, with improvements limited to deep south and eastern Texas. In the areas experiencing drought the primary impacts are low reservoir levels, low streamflow, and poor conditions of pasture and crops. As of April 30th, 61 percent of the winter wheat in Oklahoma and 57 percent of winter wheat in Texas was rated as Poor to Very Poor condition. During May the spatial extent and intensity of drought improved in many areas across the Southern region, particularly in the Texas Panhandle, central Texas, and western and central Oklahoma. The percentage of the region experiencing moderate drought (D1) or worse decreased from 35 percent on May 2nd to 24 percent on May 30th. During June the spatial extent and intensity of drought saw improvements in the Texas Panhandle, western Oklahoma, and portions of central Tennessee, while conditions along the southeast Louisiana Gulf Coast, central Texas, and deep south Texas saw worsening drought conditions. Despite improvements in drought status in many areas, areas that have experienced substantial drought continued to see impacts, particularly in the agriculture sector.
As of July 2nd, the percentage of land with short to very short topsoil moisture in Texas and Louisiana was 70 percent and 55 percent. Pasture and rangelands in Texas, Arkansas, and Louisiana continued to show stress with only 26 percent, 38 percent, and 39 percent being rated as good to excellent. During July the Southern region saw improvement of drought conditions across the Texas Panhandle, much of Oklahoma, northern Arkansas, northern Mississippi, and much of Tennessee. In the southern portions of the region degradation of drought status was common, particularly in far west Texas and central Texas where some areas saw as much as three categories of degradation. In contrast to dry conditions across Louisiana and Texas, heavy rain events throughout the month led to reports of flash flooding in Oklahoma, Arkansas, Mississippi, and Tennessee. During August the Southern region saw degradation of drought conditions across a majority of the region, the exceptions being northern Oklahoma, northern Arkansas, and isolated areas of Tennessee and deep south Texas. As of August 29th, northern Oklahoma, most of Arkansas, northern Mississippi, and much of Tennessee remained drought free. Extreme and exceptional drought, according to the USDM, expanded significantly across the region during August with much of that expansion occurring from central Texas across through coastal Mississippi. Drought conditions, exacerbated by record hot temperatures, led to short to very short topsoil conditions across much of the Southern region, the exception being Tennessee. Dry and hot conditions led to burn bans, water restrictions, and low streamflow in areas affected by drought. In the Highland Lakes in Texas, the lowest inflows on record were recorded in August, with records dating back to 1942. During September, degradation of drought conditions were common in the eastern portion of the Southern region, particularly Mississippi where the central part of the state saw three classes of degradation from August 29th to September 26th. Southern Oklahoma and northern Texas also experienced degradation of drought conditions. Texas experienced some improvement in isolated areas that received much needed rain during September. Low flows on the Mississippi River began to snarl barge traffic and contributed to saltwater intrusion creeping up the Mississippi that stopped just south of New Orleans, Louisiana. Rangeland and pasture conditions in the western portions of the region continued to suffer, and there were increased reports of ranchers reducing the size of their herds due to feed and water limitations.
During October the Southern region saw improvement in drought conditions across its western portions, particularly the reduction of extreme or exceptional drought from central Texas north through southern Oklahoma. The USDA Crop Progress Report for October 29th reported that the cotton crops in Texas and Oklahoma were only reporting ten and three percent of crops to be in Good to Excellent condition, while Louisiana, Mississippi, Arkansas, and Tennessee fared much better with 48 percent, 45 percent, 74 percent, and 83 percent being rated as Good to Excellent respectively. In early October, the lower Mississippi River was essentially closed to barge traffic due to low flows, reopening on October 10th. In November the Southern region saw continued drought and degradation of drought conditions across much of Louisiana, Mississippi, Tennessee, and southeastern Arkansas. Texas, on the other hand, saw a broad improvement of drought conditions across the state, though drought persisted in central Texas and southeast Texas. In December the Southern region saw continued drought and degradation of drought conditions across much of Louisiana, Mississippi, Arkansas, central and western Tennessee, and portions of deep east Texas. Isolated pockets of Extreme and Severe drought are still present in central Texas and far west Texas. In the last week of 2023, 46% of the Southern region was in drought, including 5% in Exceptional Drought and an additional 13% in Extreme Drought.
Midwest
As described by the Midwest Regional Climate Center, the average December temperature for the Midwest was 36.3 degrees F (2.4 degrees C), which was 8.6 degrees F (4.8 degrees C) above the 1991-2020 normal. December precipitation totaled 2.36 inches (60 mm) for the Midwest, which was 0.17 inch (4 mm) above normal, or 108 percent of normal. Precipitation was variable across the region with conditions generally transitioning from wet in the northwest to dry in the southeast. For the year, the preliminary annual average temperature for the Midwest in 2023 was 51.1 degrees F (10.6 degrees C), which was 2.1 degrees F (1.2 degrees C) above the 1991-2020 normal. Preliminary rankings indicate 2023 was the 4th warmest year since 1895 for the Midwest. The entire region experienced warm conditions. Annual precipitation for the Midwest was 32.77 inches (832.4 mm), which was 5.19 inches (131.8 mm) below the 1991-2020 normal, or 86 percent of normal. Most areas had below-normal precipitation with the exception of southern Michigan and a few isolate pockets across the region. A large swath of the western and southern Midwest had annual precipitation deficits of 6-15 inches (152.4-381 mm) for the year, with the greatest deficits in Iowa and Missouri.
December Drought Summary: Drought persisted during December with some areas showing modest improvements and others having modest declines. Overall, the month ended with about 77 percent of the region abnormally dry or in drought, which was 1 percent more than at the start of the month. The most intense drought conditions remained parked over Iowa, with 35 percent of the state in extreme (D3) drought on the USDM map. Drought intensified in southwest Iowa and along a swath from southern Missouri to northwest Ohio. Conditions improved slightly in central Minnesota, far western Missouri, and the northern half of Illinois.
Annual Drought Summary: The year was defined by large hydrologic swings throughout the Midwest starting with very wet conditions before drought rapidly onset mid-year and then ebbed and flowed to close the year. Abnormal dryness and drought covered 57 percent of the region in early January, affecting all nine states but with the most severe conditions in western Iowa. Widespread above-normal precipitation from January to early April reduced dryness and drought coverage to just 18 percent by late April, with dryness confined to west of the Mississippi River. Conditions started to rapidly decline across the region as the growing season ramped up. By late June, drought and dryness were widespread, covering 93 percent of the region and impacting all nine states. By July, exceptional (D4) drought spread across a multi-county stretch of central Missouri and extreme (d3) drought was present in Missouri, Iowa, and Wisconsin according to the U.S. Drought Monitor map. Conditions started to improve in the southeastern Midwest and into the central Midwest throughout July and August while lingering elsewhere. Drought severity peaked in the northwest in mid-September, with D4 drought affecting portions of Iowa, Minnesota, and Wisconsin before conditions started to gradually improve during the fall. Regional improvements stalled in the northwest and began to wane across the lower Midwest in November and December. The year ended with dryness and drought affecting 77 percent of the region, including all nine states, with the most intense drought in Iowa and across the lower Midwest from central Missouri eastward through Kentucky.
Northeast
As summarized by the Northeast Regional Climate Center, December featured above-normal temperatures and little snowfall, with a precipitation pattern that resembled a "typical" El Niño winter: drier than normal in the interior Northeast and wetter than normal in coastal areas. The Northeast experienced its second warmest and seventh wettest December since recordkeeping began in 1895. West Virginia was the lone drier-than-normal state, seeing 59 percent of normal precipitation. The Northeast experienced its second warmest and 17th wettest year in 2023.
December Drought Summary: The USDM from December 7 showed less than one percent of the Northeast in severe drought, six percent in moderate drought, and 19 percent as abnormally dry. Wetter-than-normal conditions during December in eastern West Virginia, Maryland, much of Pennsylvania, Delaware, and New Jersey allowed drought and dryness to contract or ease. For instance, severe and moderate drought were erased from Maryland, while abnormal dryness was removed from Delaware and New Jersey. Interior locations saw less precipitation, allowing drought and dryness to persist in spots such as western New York, northwestern Pennsylvania, and southwestern West Virginia. Additionally, moderate drought was introduced on Nantucket and Martha's Vineyard, Massachusetts. The USDM from December 26 showed one percent of the Northeast in severe drought, three percent in moderate drought, and 11 percent as abnormally dry. At times during December, USGS 7-day average streamflow and/or groundwater levels were below normal or lower in western New York, western Pennsylvania, southern West Virginia, and an area from eastern West Virginia through Maryland and southern Pennsylvania into southern New Jersey, with a couple of gauges reporting record low flows or levels. Some water suppliers in Pennsylvania continued to urge customers to conserve water, with a few having mandatory water use restrictions in place. Lingering deficits of precipitation, streamflow, groundwater levels, and soil moisture prompted the Interstate Commission on the Potomac River Basin to issue another special Water Supply Outlook in early December.
Annual Drought Summary: The USDM from January 3, 2023, showed less than 1 percent of the Northeast in moderate drought and 9 percent as abnormally dry. This included a sliver of moderate drought on Long Island and pockets of abnormal dryness in seven of the 12 Northeast states. Most areas saw improving conditions in January and February, with drought erased from the region and the overall footprint of abnormal dryness contracting. In fact, New Hampshire became free of drought and dryness for the first time since May 2020. The USDM from March 7 showed 2 percent of the Northeast as abnormally dry including small parts of southern Pennsylvania, southern New Jersey, and New York's Long Island. During March and April, increasing precipitation deficits, below-normal streamflow, and declining soil moisture led to the introduction and expansion of moderate drought and abnormal dryness in portions of the Mid-Atlantic, southeastern New York, and southern New England. The USDM from April 25 showed 6 percent of the Northeast in moderate drought and 22 percent as abnormally dry. After conditions briefly improved in early May, widespread deterioration occurred between late May and mid-June as below-normal precipitation led to little soil moisture, low streamflow, and declining groundwater levels. Severe drought was introduced in south-central Pennsylvania and central Maryland, while moderate drought and/or abnormal dryness expanded to include parts of ten of the 12 states. The USDM from June 20 showed 34 percent of the Northeast in drought and 37 percent as abnormally dry. From late June through July, locally heavy rainfall chipped away at drought and dryness across much of the region. Drought and/or abnormal dryness was removed from New England and contracted in the Mid-Atlantic states and New York. The USDM from August 1 showed 4 percent of the Northeast in drought and 11 percent as abnormally dry. During August and September, drought and abnormal dryness persisted in parts of New York and the Mid-Atlantic, expanding in some areas and contracting in other areas. The USDM from October 3 showed 2 percent of the Northeast in drought and 15 percent as abnormally dry. Below-normal precipitation, decreased streamflow and groundwater levels, and reduced soil moisture were a few factors that led to deteriorating conditions in the Northeast during October and November. Drought and dryness expanded in the Mid-Atlantic and New York, with pockets of severe drought developing in western New York, central Maryland, and eastern West Virginia. The USDM from December 5 showed 6 percent of the Northeast in drought and 19 percent as abnormally dry. Wetter-than-normal conditions during December in eastern West Virginia, Maryland, much of Pennsylvania, Delaware, and New Jersey allowed drought and dryness to contract or ease. For instance, severe and moderate drought were erased from Maryland, while abnormal dryness was removed from Delaware and New Jersey. Interior locations saw less precipitation, allowing drought and dryness to persist in spots such as western New York, northwestern Pennsylvania, and southwestern West Virginia. Additionally, moderate drought was introduced on Nantucket and Martha's Vineyard, Massachusetts. The USDM from December 26 showed one percent of the Northeast in severe drought, three percent in moderate drought, and 11 percent as abnormally dry.
The most notable and widespread impacts from the drought and dryness seemed to be on water resources. Record low streamflow and/or groundwater levels were noted in western New York and parts of the Mid-Atlantic, particularly an area stretching from eastern West Virginia into Maryland and southern Pennsylvania across to southern New Jersey, at various times from June through December. Water conservation was encouraged by water suppliers in several of these areas, with mandatory water use restrictions implemented in parts of Maryland, including Emmitsburg and Myersville, and Pennsylvania, including Lock Haven and parts of York County. In June, daily drought monitoring operations began along the Potomac River, which supplies portions of the Mid-Atlantic including much of the Washington, D.C., metro area with water. At that time, below-normal streamflow on the river contributed to an abundance of algae that altered the taste and smell of the drinking water in some areas. After a brief hiatus, daily drought monitoring resumed along the Potomac River in late August and continued through much of autumn. In early September, low water levels caused boat tours to be cancelled along the historic Chesapeake and Ohio (C&O) Canal, which runs along the Potomac River. The Interstate Commission on the Potomac River Basin issued two special Water Supply Outlooks, one in early November and one in early December, due to ongoing dry conditions in the basin. During November, wells ran dry for at least 100 homes, as well as some businesses and farms, in part of western New York. Some residents utilized fill stations in neighboring communities or tanker trucks that were brought in to then haul water to their homes, with a dairy farm trucking in 60,000 gallons a day for its cows. Dry conditions also affected the agriculture industry during the growing season. Some growers began irrigating crops as early as May and relied on irrigation to keep plants growing; however, it increased operation costs. During June, farmers in Pennsylvania noted that emergence of some crops such as corn and soybeans was slow, there were issues such as uneven corn fill, it was difficult for newly planted crops to establish roots, and some pastures turned brown. However, the conditions were favorable for haymaking and allowed for plenty of fieldwork. Seeds failed to germinate and grass grew slowly in some eastern West Virginia locations, while growers in parts of Maryland noted stunted corn and soybean crops and slow growth of hay. For the week ending June 18, topsoil moisture was rated very short (the lowest rating) for 71 percent of Maryland and was rated short (the second lowest rating) for just under 50 percent of Pennsylvania and West Virginia. For the same period, pasture and range conditions were rated very poor or poor for just under half of Pennsylvania and around a quarter of Maryland. In September, crops such as apples and corn were harvested earlier than usual in south-central Pennsylvania due to dry conditions. There were also impacts on wildfire activity. From April through June, there was an increased risk of wildfires, with multiple fires in states such as Pennsylvania, New York, and New Jersey. In April, West Virginia issued a week-long ban on all outdoor burning. During June, several municipalities and counties in central Pennsylvania enacted burn bans and state officials temporarily prohibited open fires in all state forests. Between January 1 and mid-June, New Jersey had seen at least 10 major fires, with two large fires in June caused by lightning, an uncommon occurrence in the state. Pennsylvania also saw an uptick in wildfires. During fall, low water levels in ponds and creeks in southern Pennsylvania and western New York affected rural firefighting operations. Dry conditions increased fire danger during West Virginia's fall fire season and contributed to multiple wildfires, including one in the New River Gorge National Park and Preserve that burned over 2,000 acres. Similar conditions were found in Virginia, which saw multiple large wildfires. Smoke from these fires produced poor air quality and smoky skies in parts of the Northeast, particularly mid-November as drought conditions generally peaked in that state.
High Plains
As discussed by the High Plains Regional Climate Center, December ended in a similar fashion to both October and November. Exceptionally warm temperatures dominated the High Plains region, with a cold front pushing through late in the month but unable to prevent record warmth. It was a dry month for much of the region.
For the year, climate-wise, 2023 was the opposite of 2022, which was marked by dryness and extreme drought. This year brought ample to plentiful precipitation to much of the region, which greatly improved drought conditions. While the precipitation was beneficial to mitigate drought conditions, it was too late to help some crops to recover. In August, a blistering heatwave further impacted all facets of life including agriculture. This heatwave led to a warm end to the year, culminating in a record-breaking December. Overall, annual temperatures this year were slightly above normal for most of the region. Precipitation came in spurts this year, with extreme amounts of precipitation occurring during several months.
December Drought Summary: Drought conditions improved this month, even though the amount of abnormal dryness (D0) slightly increased. The heavy snowfall in Kansas towards the end of November was noticeable, with large improvements in the state. Overall, abnormally dry to exceptional drought (D0-D4) conditions were reduced by over 3 percent. Eastern Kansas greatly benefited from the heavy snow, with severe to exceptional drought (D2-D4) reduced by 23 percent. Currently, a little over 19 percent of the state is experiencing D2-D4, the lowest percentage since the beginning of February 2022. The dryness in Wyoming has begun to take its toll, with D0 increasing by nearly 14 percent this month. D0 was also increased by nearly 10 percent in South Dakota, however, the heavy precipitation towards the end of December should lead to improvements.
Annual Drought Summary: According to the USDM, overall drought coverage dramatically improved across the region. Heavy precipitation occurred this year primarily over areas plagued by drought coming into 2023. Undoubtedly, the biggest winner in 2023 was Kansas. Entering the year, close to 57 percent of the state was under extreme to exceptional drought (D3-D4) conditions. That number is down to 3 percent heading into 2024, a significant and much overdue improvement. While much of the state is still dealing with drought or abnormally dry (D0) conditions, the outlook is much more optimistic heading into the new year. Nebraska also improved significantly this year, however, the drought that does remain is intense. In the beginning of January, 99.75 percent of the state was affected by moderate to exceptional drought (D1-D4). By the end of the year, it was reduced by 73 percent with only the southeastern part of the state remaining under significant drought. The Dakotas also experienced noticeable improvements, with both states experiencing a 60 percent reduction in D1-D4 conditions over the year. South Dakota is also primed to have further reductions to drought conditions early in the new year after a winter storm impacted the state around Christmas. In a reversal from last year, drought conditions are in manageable and decent condition heading into 2024. Overall, 21 percent of the High Plains was in D1-D4 at the end of the year, the lowest percentage since May 2020.
Despite the beneficial and significant amounts of precipitation this year, the precipitation came too late to improve winter wheat yields. Kansas harvested its lowest bushel count since 1966, with numerous fields abandoned due to the dry fall in 2022. Corn production was aided by the rains; however, the heatwave in August burnt many stalks to a crisp. North Dakota also recorded its largest cattle anthrax outbreak since 2005 due to a dry to suddenly wet pattern. The mild fall this year allowed the disease to linger, with a case reported in December.
West
As summarized by the Western Regional Climate Center, a strong blocking ridge of high pressure persisted for much of December centered over the Upper Midwest and southern Canada (Saskatchewan and Winnipeg) stretching into the Western U.S. This blocked storms from reaching the interior West, where precipitation was well below normal, and forced storm tracks northward into the Pacific Northwest and southward to southern California, Arizona, and New Mexico. Temperatures were well above normal with record December warmth found in several states. Low precipitation combined with warm temperatures led to below normal snowpack by the end of December for most mountain areas in the region.
For the year, the large-scale weather patterns across the West in 2023 were partially driven by a transition from three straight years of La Niña, ending in summer, to a moderate strength El Niño that developed by late Autumn. In California, the Great Basin, and Rocky Mountains, cold and wet conditions with a deep snowpack (record breaking for some) was the highlight for the first half of the year and ended a three-year drought for the region with replenished surface water supply by summer. Extreme heat and a weak monsoon during summer contributed to a warm and dry year for most of Arizona and New Mexico. Autumn and early winter (September-December) were warm and relatively dry leading to widespread snow drought conditions developing by the end of the year.
December Drought Summary: According to the USDM at the end of December, 24 percent of the West was in drought. Areas of extreme (D3) and exceptional (D4) drought are found in Arizona and New Mexico. The biggest improvements to drought conditions were found along the Oregon coast and in parts of Washington where two USDM class improvements were made over the past month. Moderate drought (D1) expanded to parts of southwest Montana.
Annual Drought Summary: April 1 snowpack was at record high levels based on the SNOTEL network throughout the Sierra Nevada, Great Basin, Arizona, and West Slope of Colorado. Snow water equivalent (SWE) was 200-300 percent of normal. Some snow course in the Sierra Nevada broke April 1 SWE records going back 90-100 years; Mammoth Pass, in the central Sierra Nevada, California, had 104.5 inches of SWE marking it the highest April 1 value in 93 years of records. The wet and snowy winter helped to eliminate drought across much of the West; in early January, 62 percent of the West was in drought with extreme drought (D3) or worse in six states while only 24 percent of the West was in drought at the end of 2023 with D3 and exceptional drought (D4) confined to Arizona and New Mexico. A weak monsoon and hot summer helped drive drought expansion in Arizona and New Mexico and, the Pacific Northwest was another region with drought expansion in 2023.
Alaska: December temperatures were above normal in the Panhandle (anomalies +3-6 degrees Fahrenheit), North Slope (anomalies +5-8 degrees Fahrenheit), and parts of the Interior (anomalies +1-4 degrees Fahrenheit). For South Central and Western Alaska temperatures were 2-7 degrees Fahrenheit below normal. Most monitored locations in Alaska saw above normal precipitation for the month. Annual temperatures in Alaska were warmer than normal in the Panhandle, North Slope, and most of the Interior, colder than normal in West, and near normal in South Central. Most of the state had a wetter than normal year except for the Aleutian Islands and much of the Kenai Peninsula.
Hawaii: December precipitation was below normal for most of Hawaii. On the Big Island, Hilo received 7.62 inches of precipitation (63 percent of normal) and most long-term stations on the Big Island saw 50-70 percent of normal precipitation. On Maui, Kahului recorded 1.00 inch of rain, just 36 percent of normal for the month. Honolulu logged 0.88 inches of rain (40 percent of normal) for December. At the end of December, 22 percent of the state was in drought based on the USDM with no extreme (D3) or exceptional (D4) drought remaining.
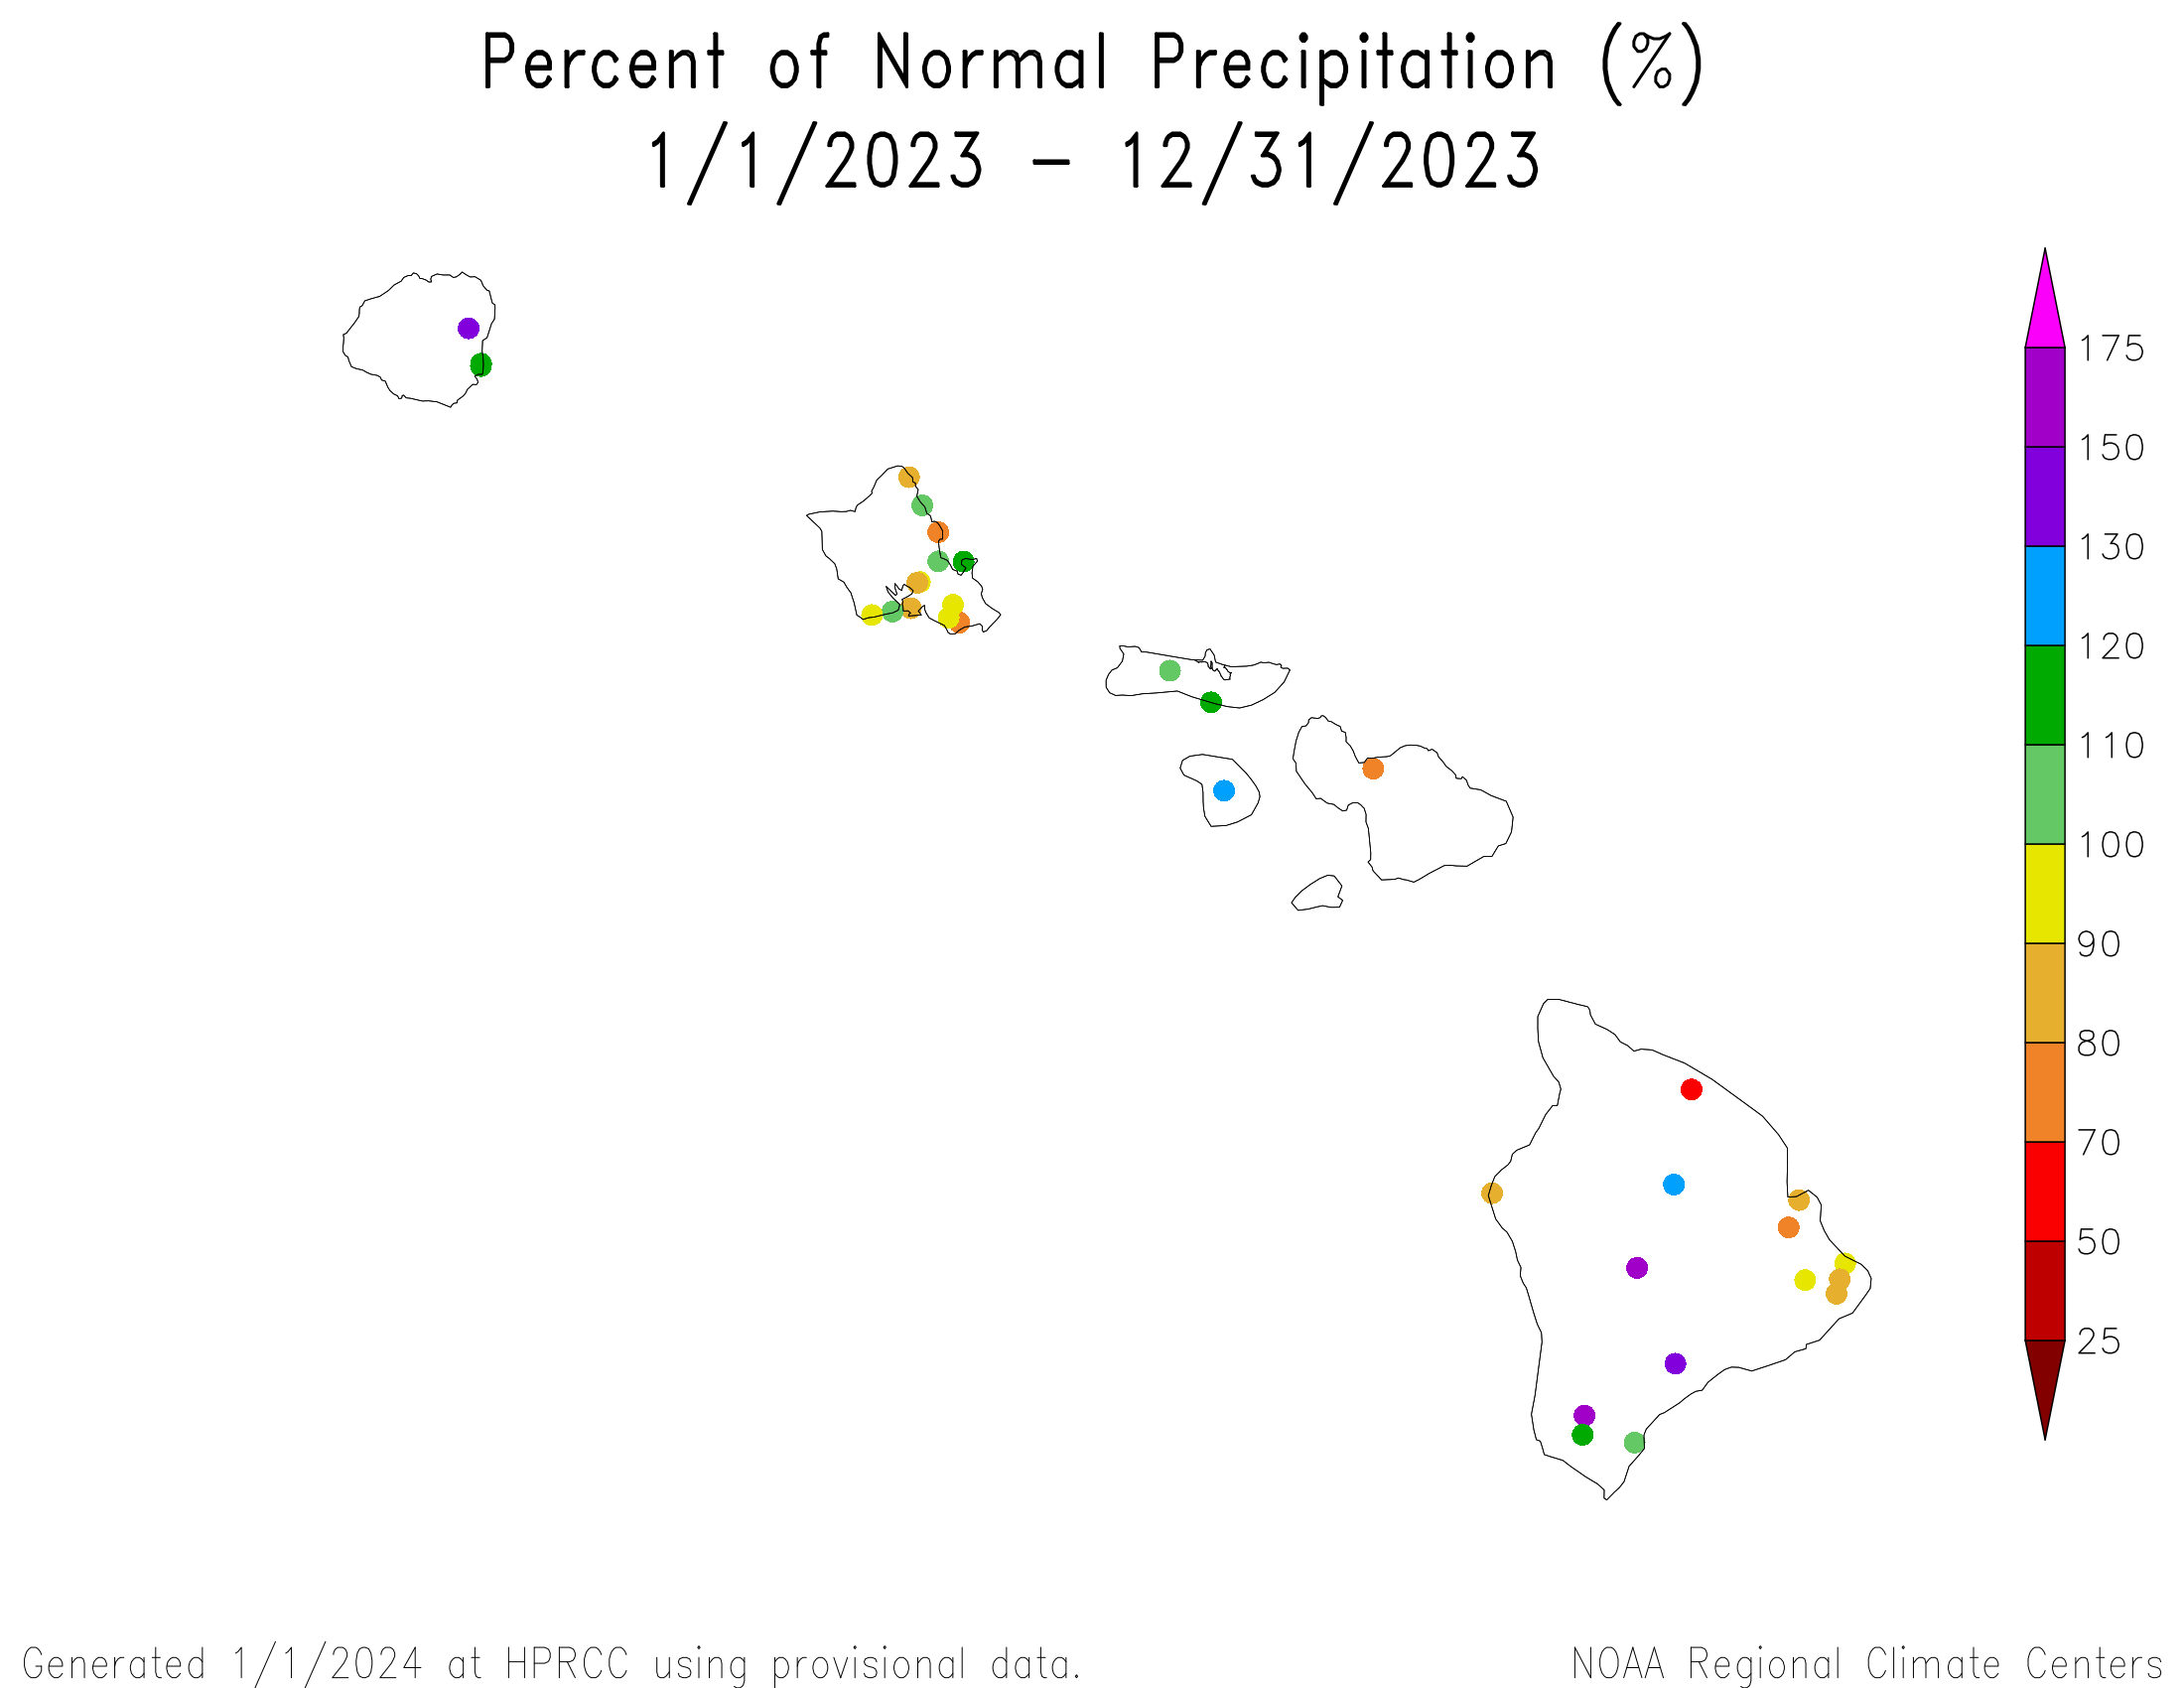
Annual precipitation across Hawaii was mixed with some regions above normal and others below. It was a generally dry year when considering the entire state with drought conditions developing in early summer and peaking in mid-November when 93 percent of the state was in drought with 12 percent in extreme drought. Dry conditions played a factor in the devastating Lahaina fires, on the Island of Maui, that occurred in early August. Kahului, on the Island of Maui, received 11.04 inches of precipitation (68 percent of normal) in 2023. Kauai was one of the Islands with above normal annual precipitation; Lihue recorded 42.88 inches of precipitation (118 percent of normal). Temperatures were generally near-to-slightly above normal across the state in 2023.
Upcountry, part of Maui County, moved to a stage 2 water shortage in October due to worsening drought conditions. Daily water demand is exceeding supply by 20 percent and restrictions have been put in place to reduce use. The restrictions include irrigation, watering lawns, washing vehicles, and other nonessential activities. Shortage restrictions will remain in place until conditions change.