Issued 13 February 2023


Please note that the values presented in this report are based on preliminary data. They will change when the final data are processed, but will not be replaced on these pages.
National Drought Highlights
- Based on the Palmer Drought Index, severe to extreme drought affected about 9% of the contiguous United States as of the end of January 2023, a decrease of about 2% from last month. About 2% of the contiguous U.S. fell in the severely to extremely wet categories.
- About 20% of the contiguous U.S. fell in the moderate to extreme drought categories (based on the Palmer Drought Index) at the end of January.
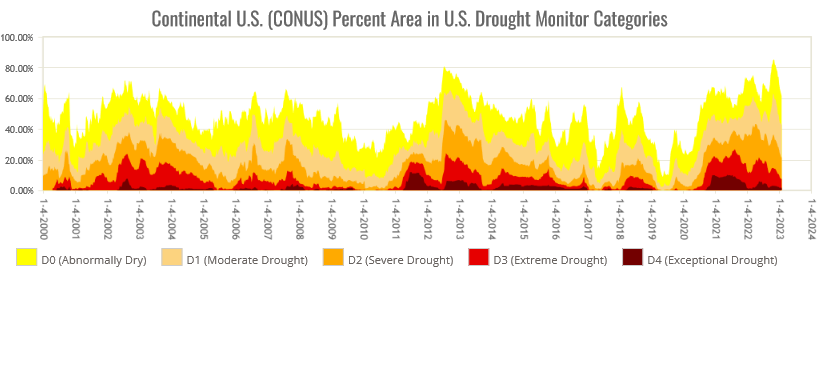
- On a broad scale, the 1980s and 1990s were characterized by unusual wetness with short periods of extensive droughts, the 1930s and 1950s were characterized by prolonged periods of extensive droughts with little wetness, and the first two decades of the 2000s saw extensive drought and extensive wetness (moderate to extreme drought graphic, severe to extreme drought graphic).
- A file containing the national monthly percent area severely dry and wet from 1900 to present is available for the severe to extreme and moderate to extreme categories.
- Historical temperature, precipitation, and Palmer drought data from 1895 to present for climate divisions, states, and regions in the contiguous U.S. are available at the Climate Division: Temperature-Precipitation-Drought Data page. These filenames begin with "climdiv".
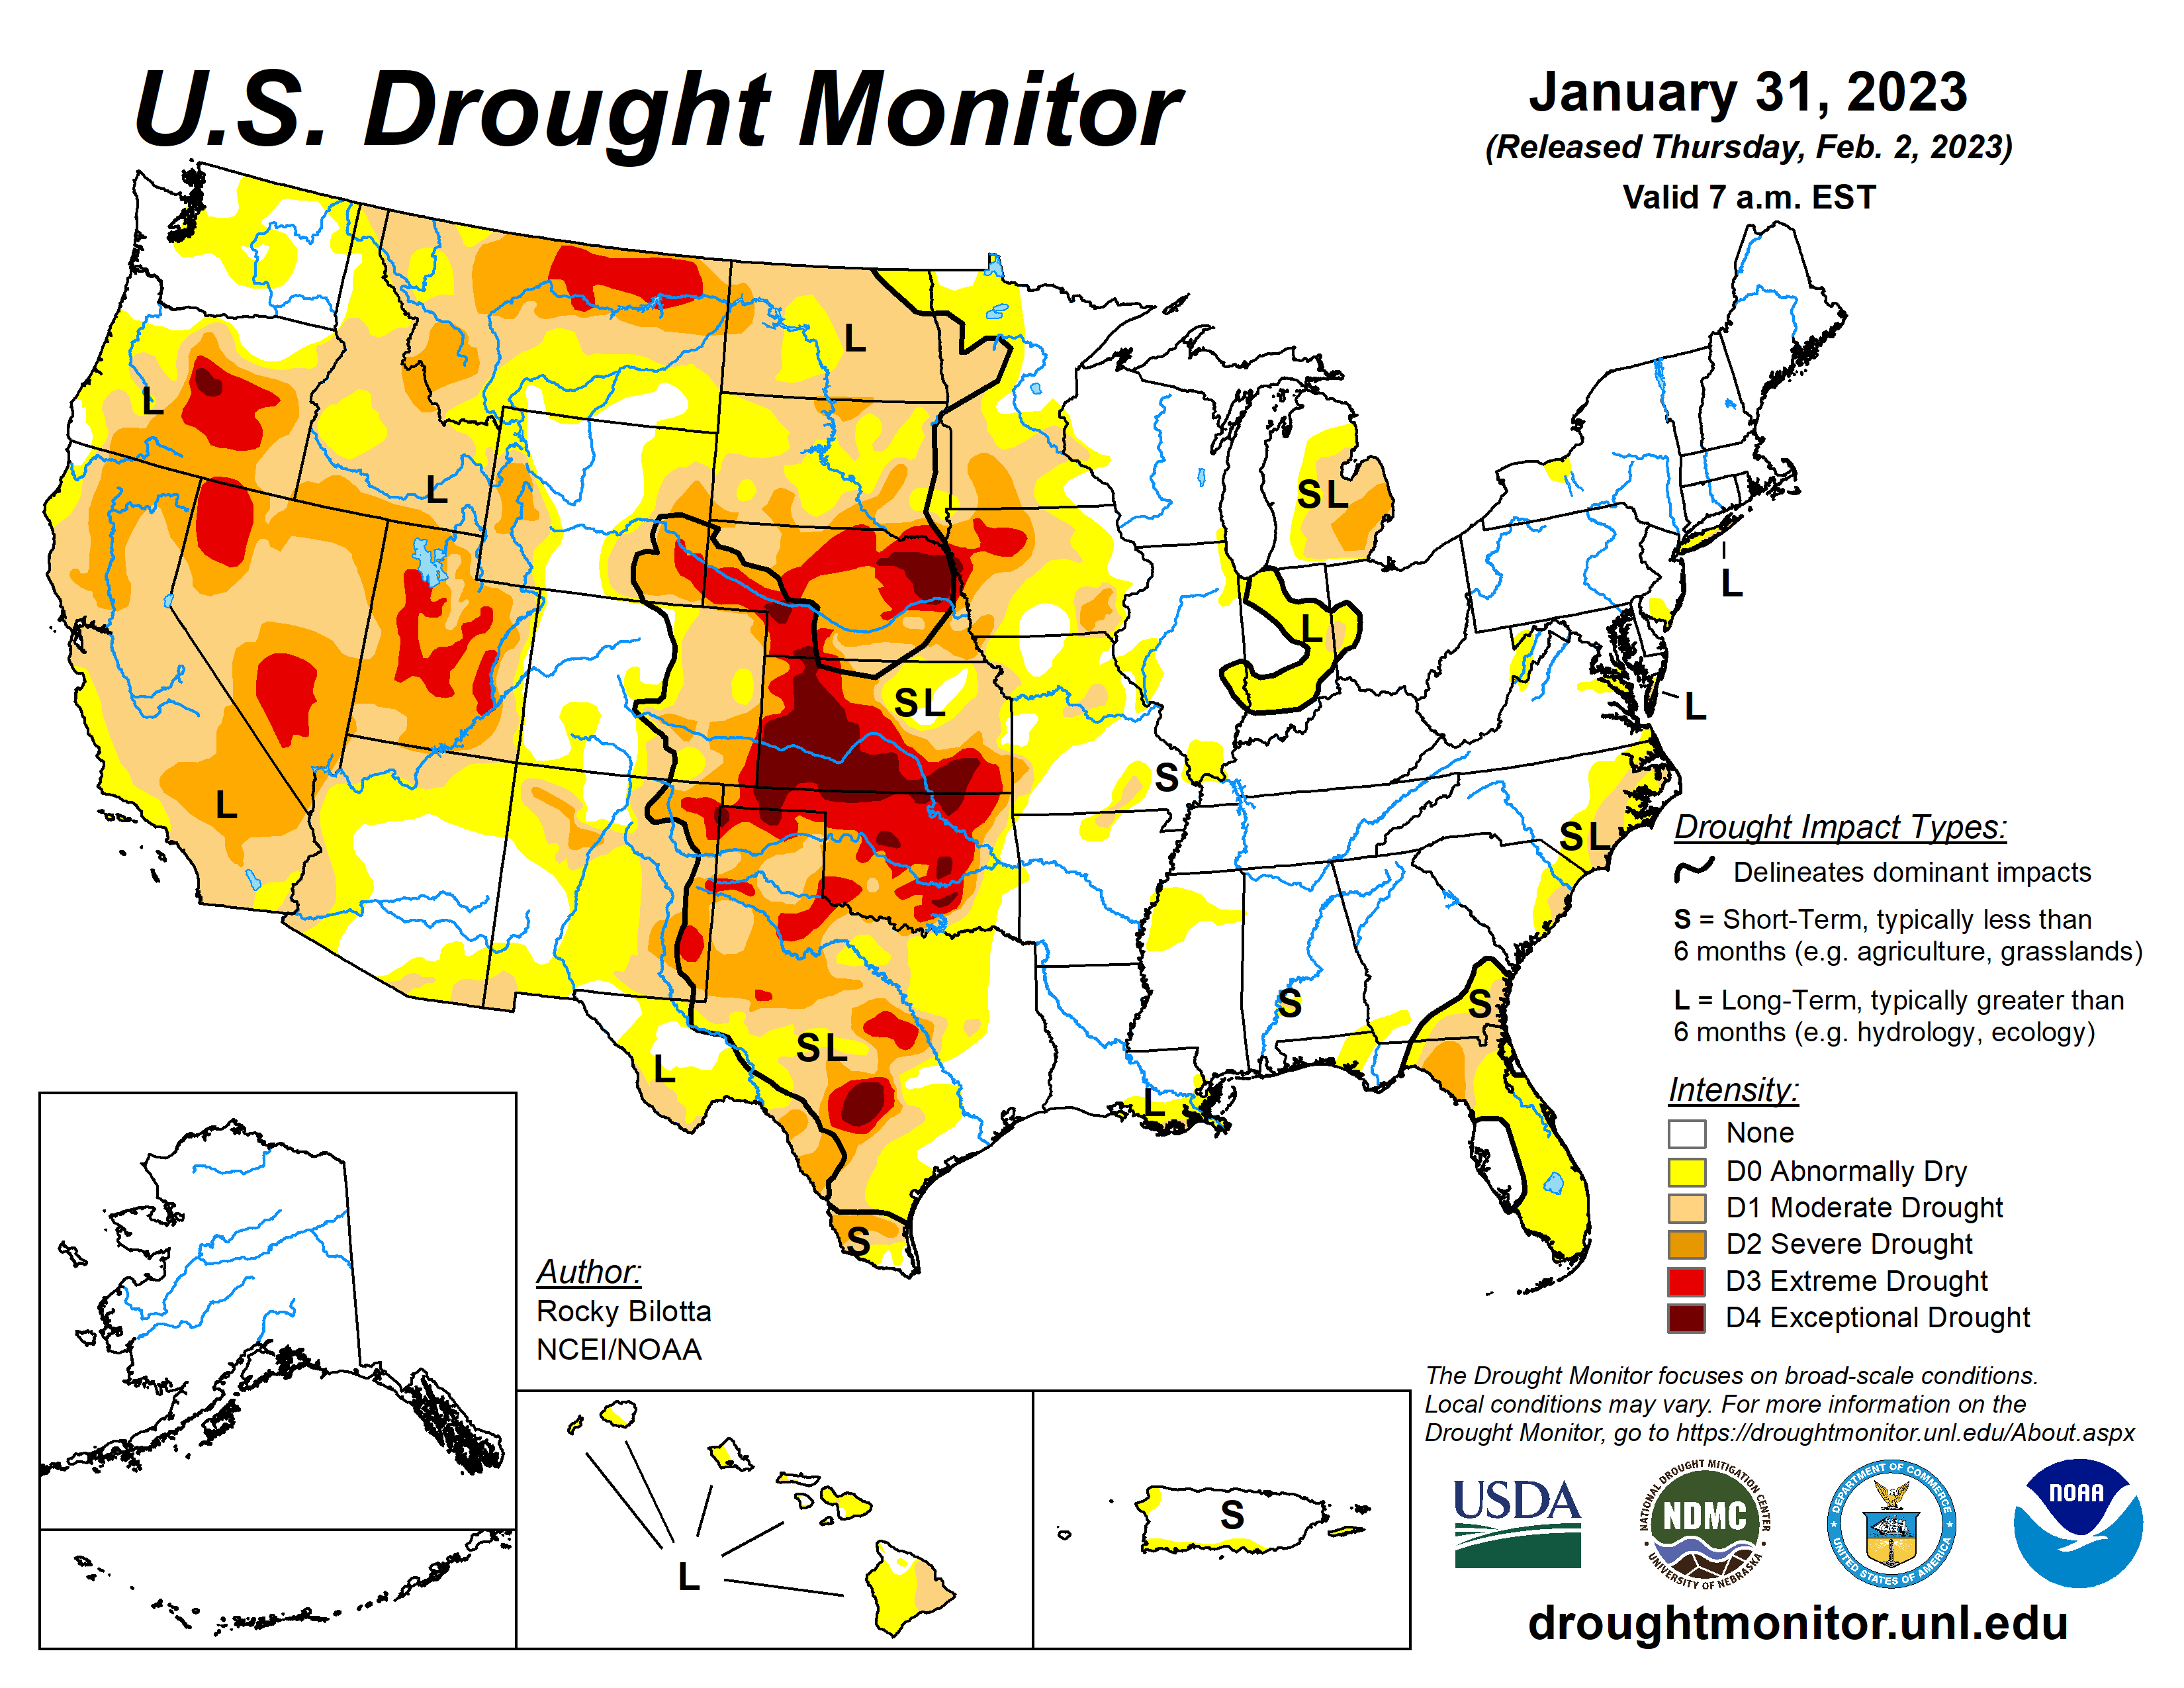
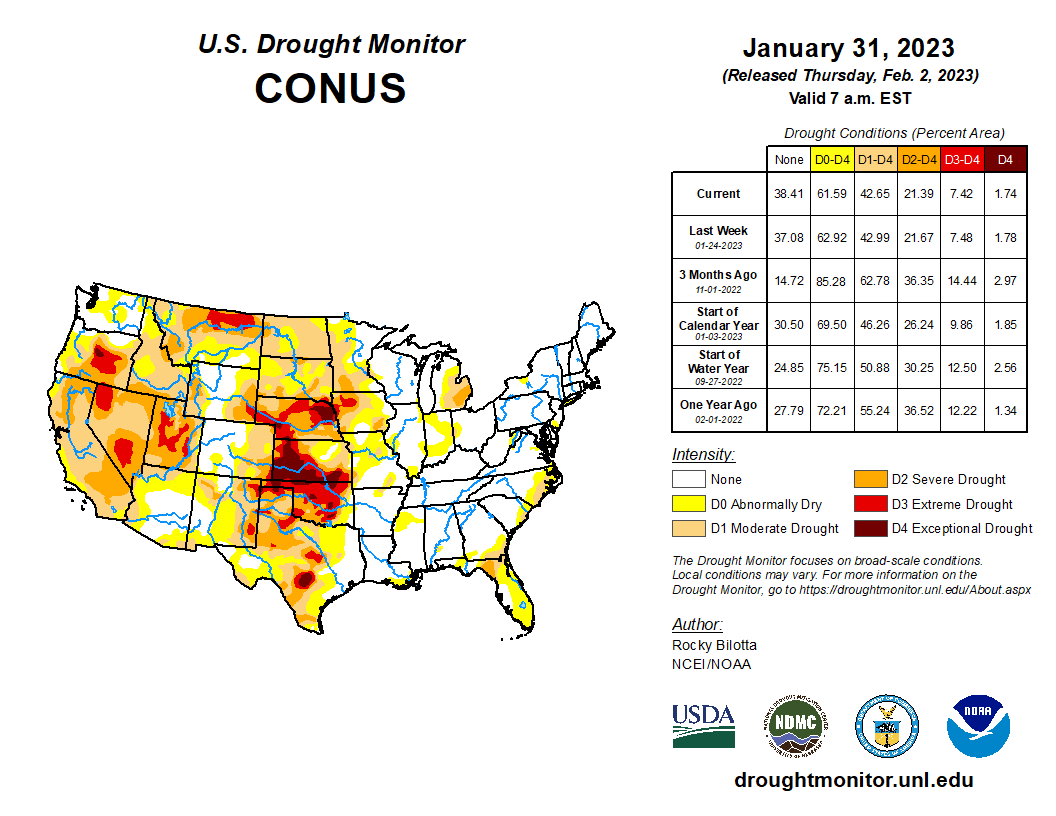
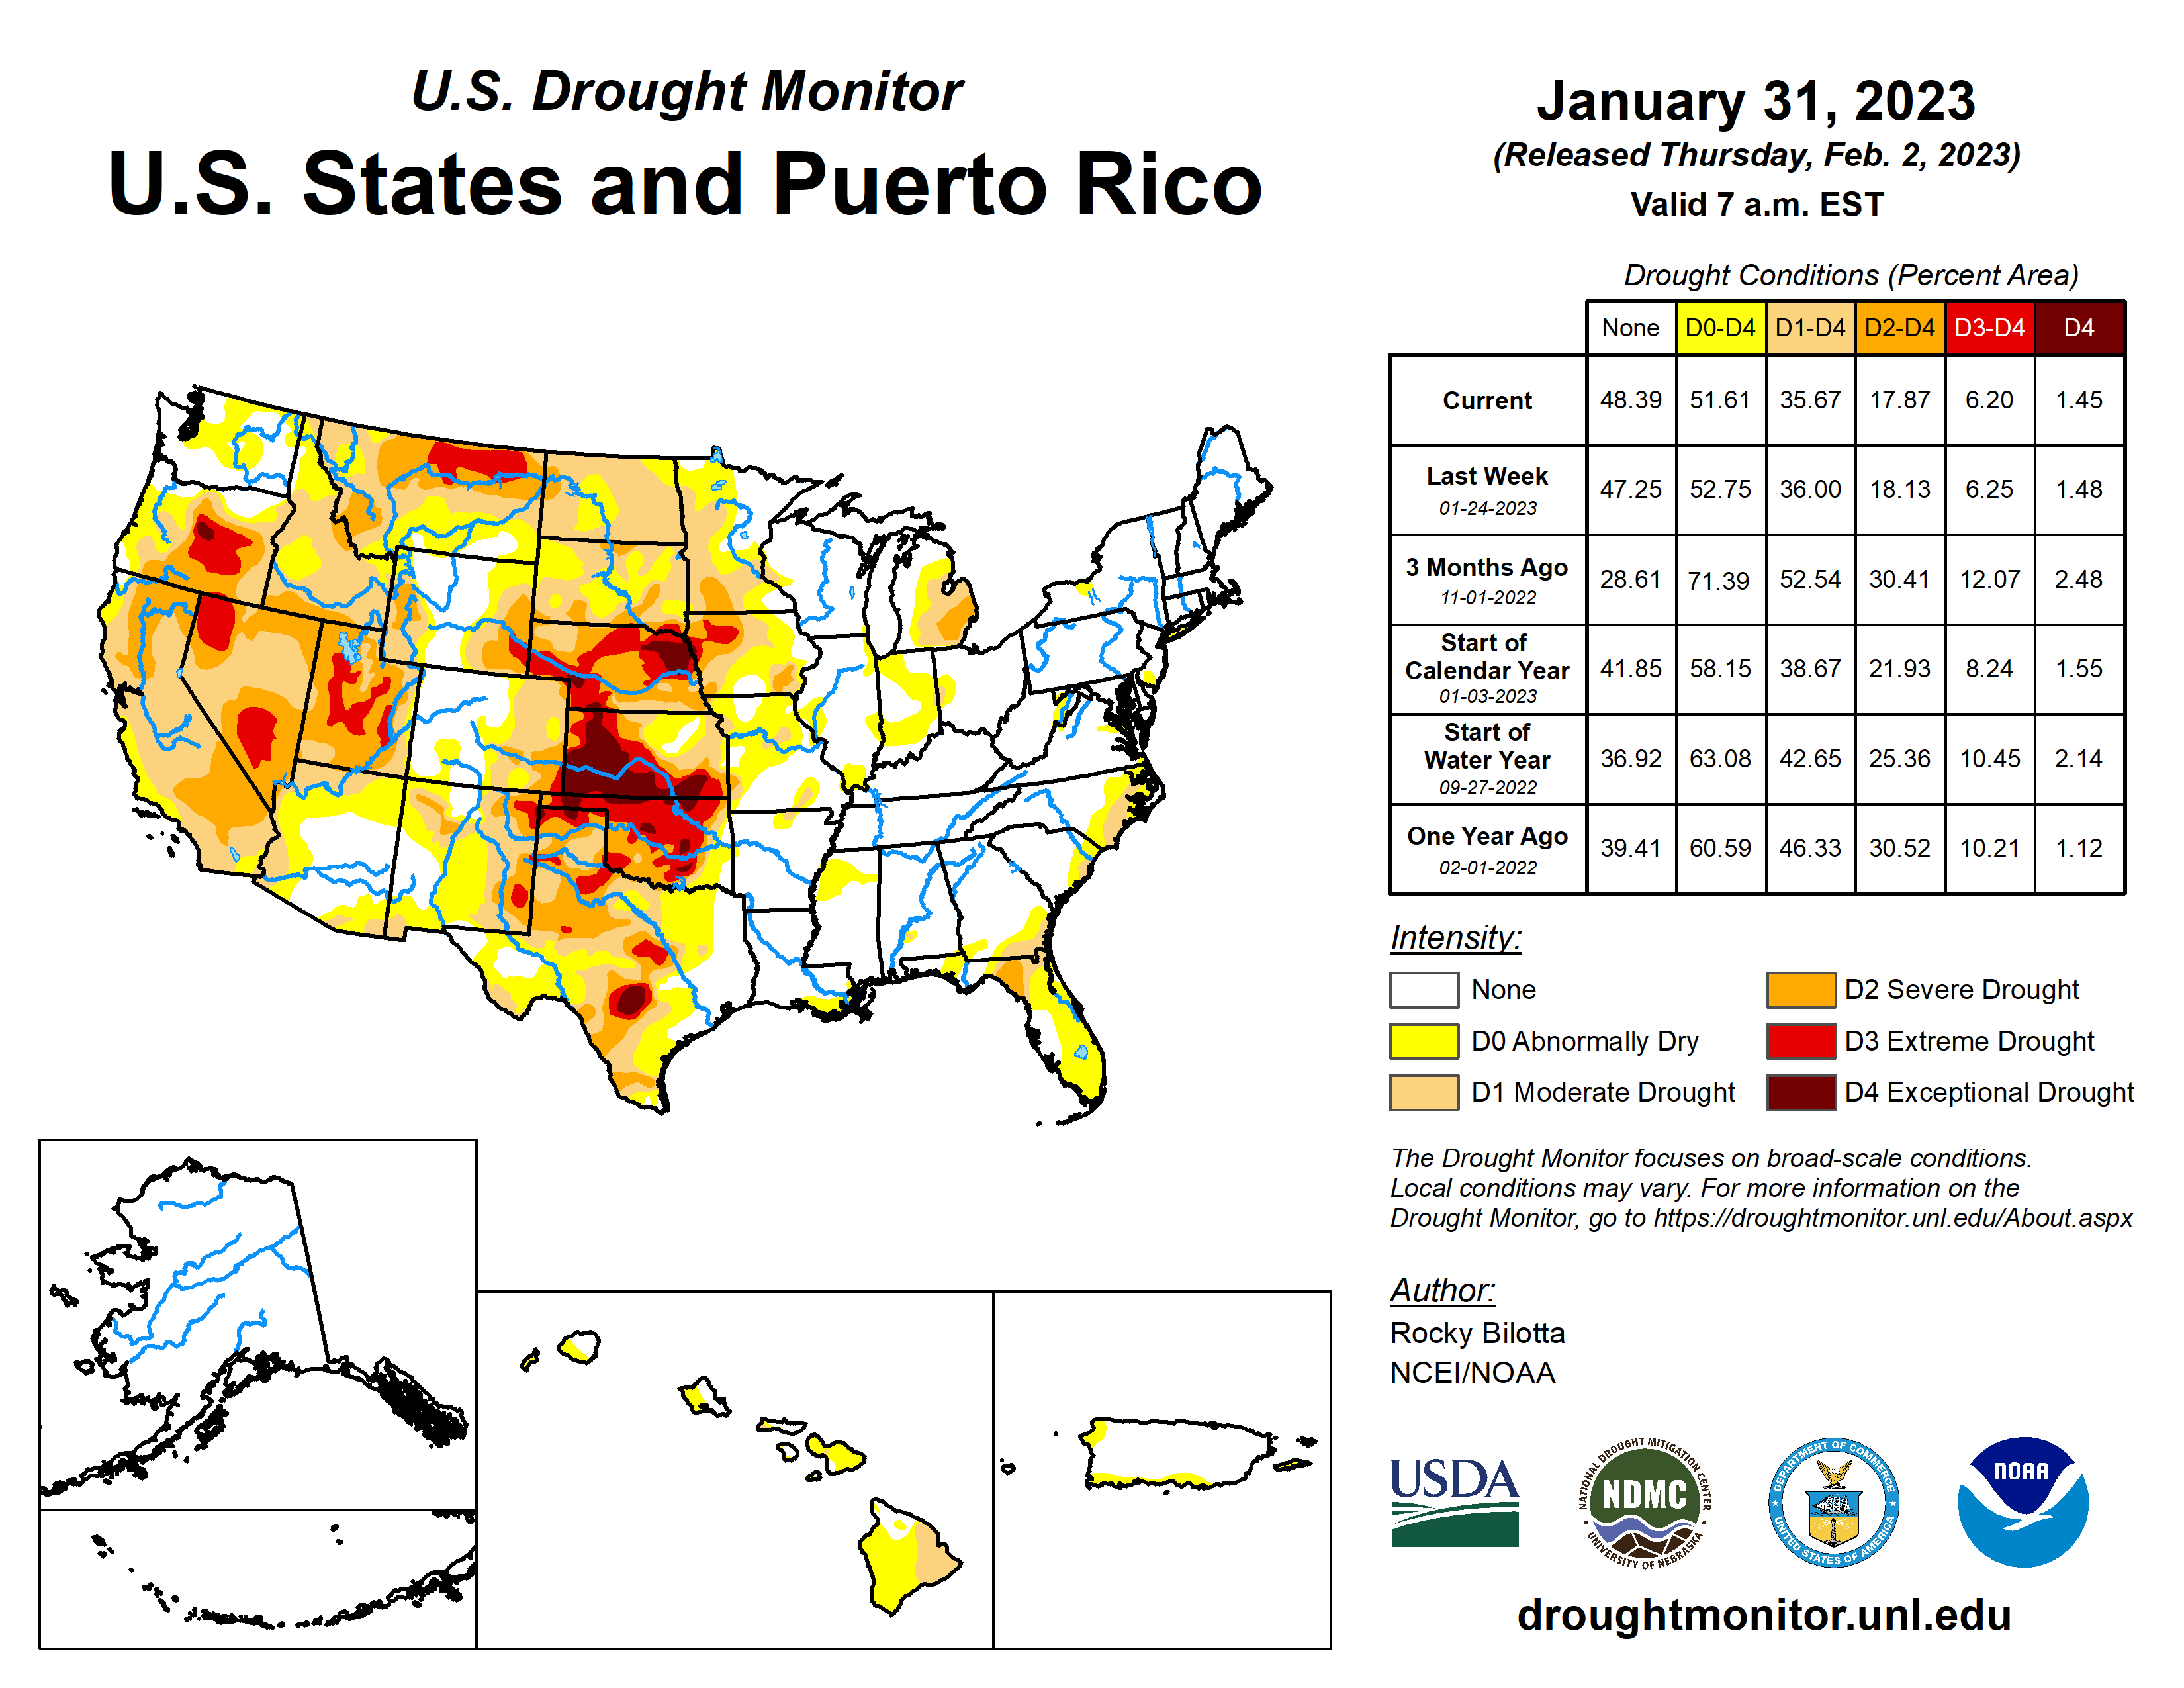
- According to the weekly U.S. Drought Monitor (USDM), as of January 31, 2023, 42.65% of the contiguous U.S. (CONUS) (35.67% of the U.S. including Alaska, Hawaii, and Puerto Rico) was classified as experiencing moderate to exceptional (D1-D4) drought.
Detailed Drought Overview
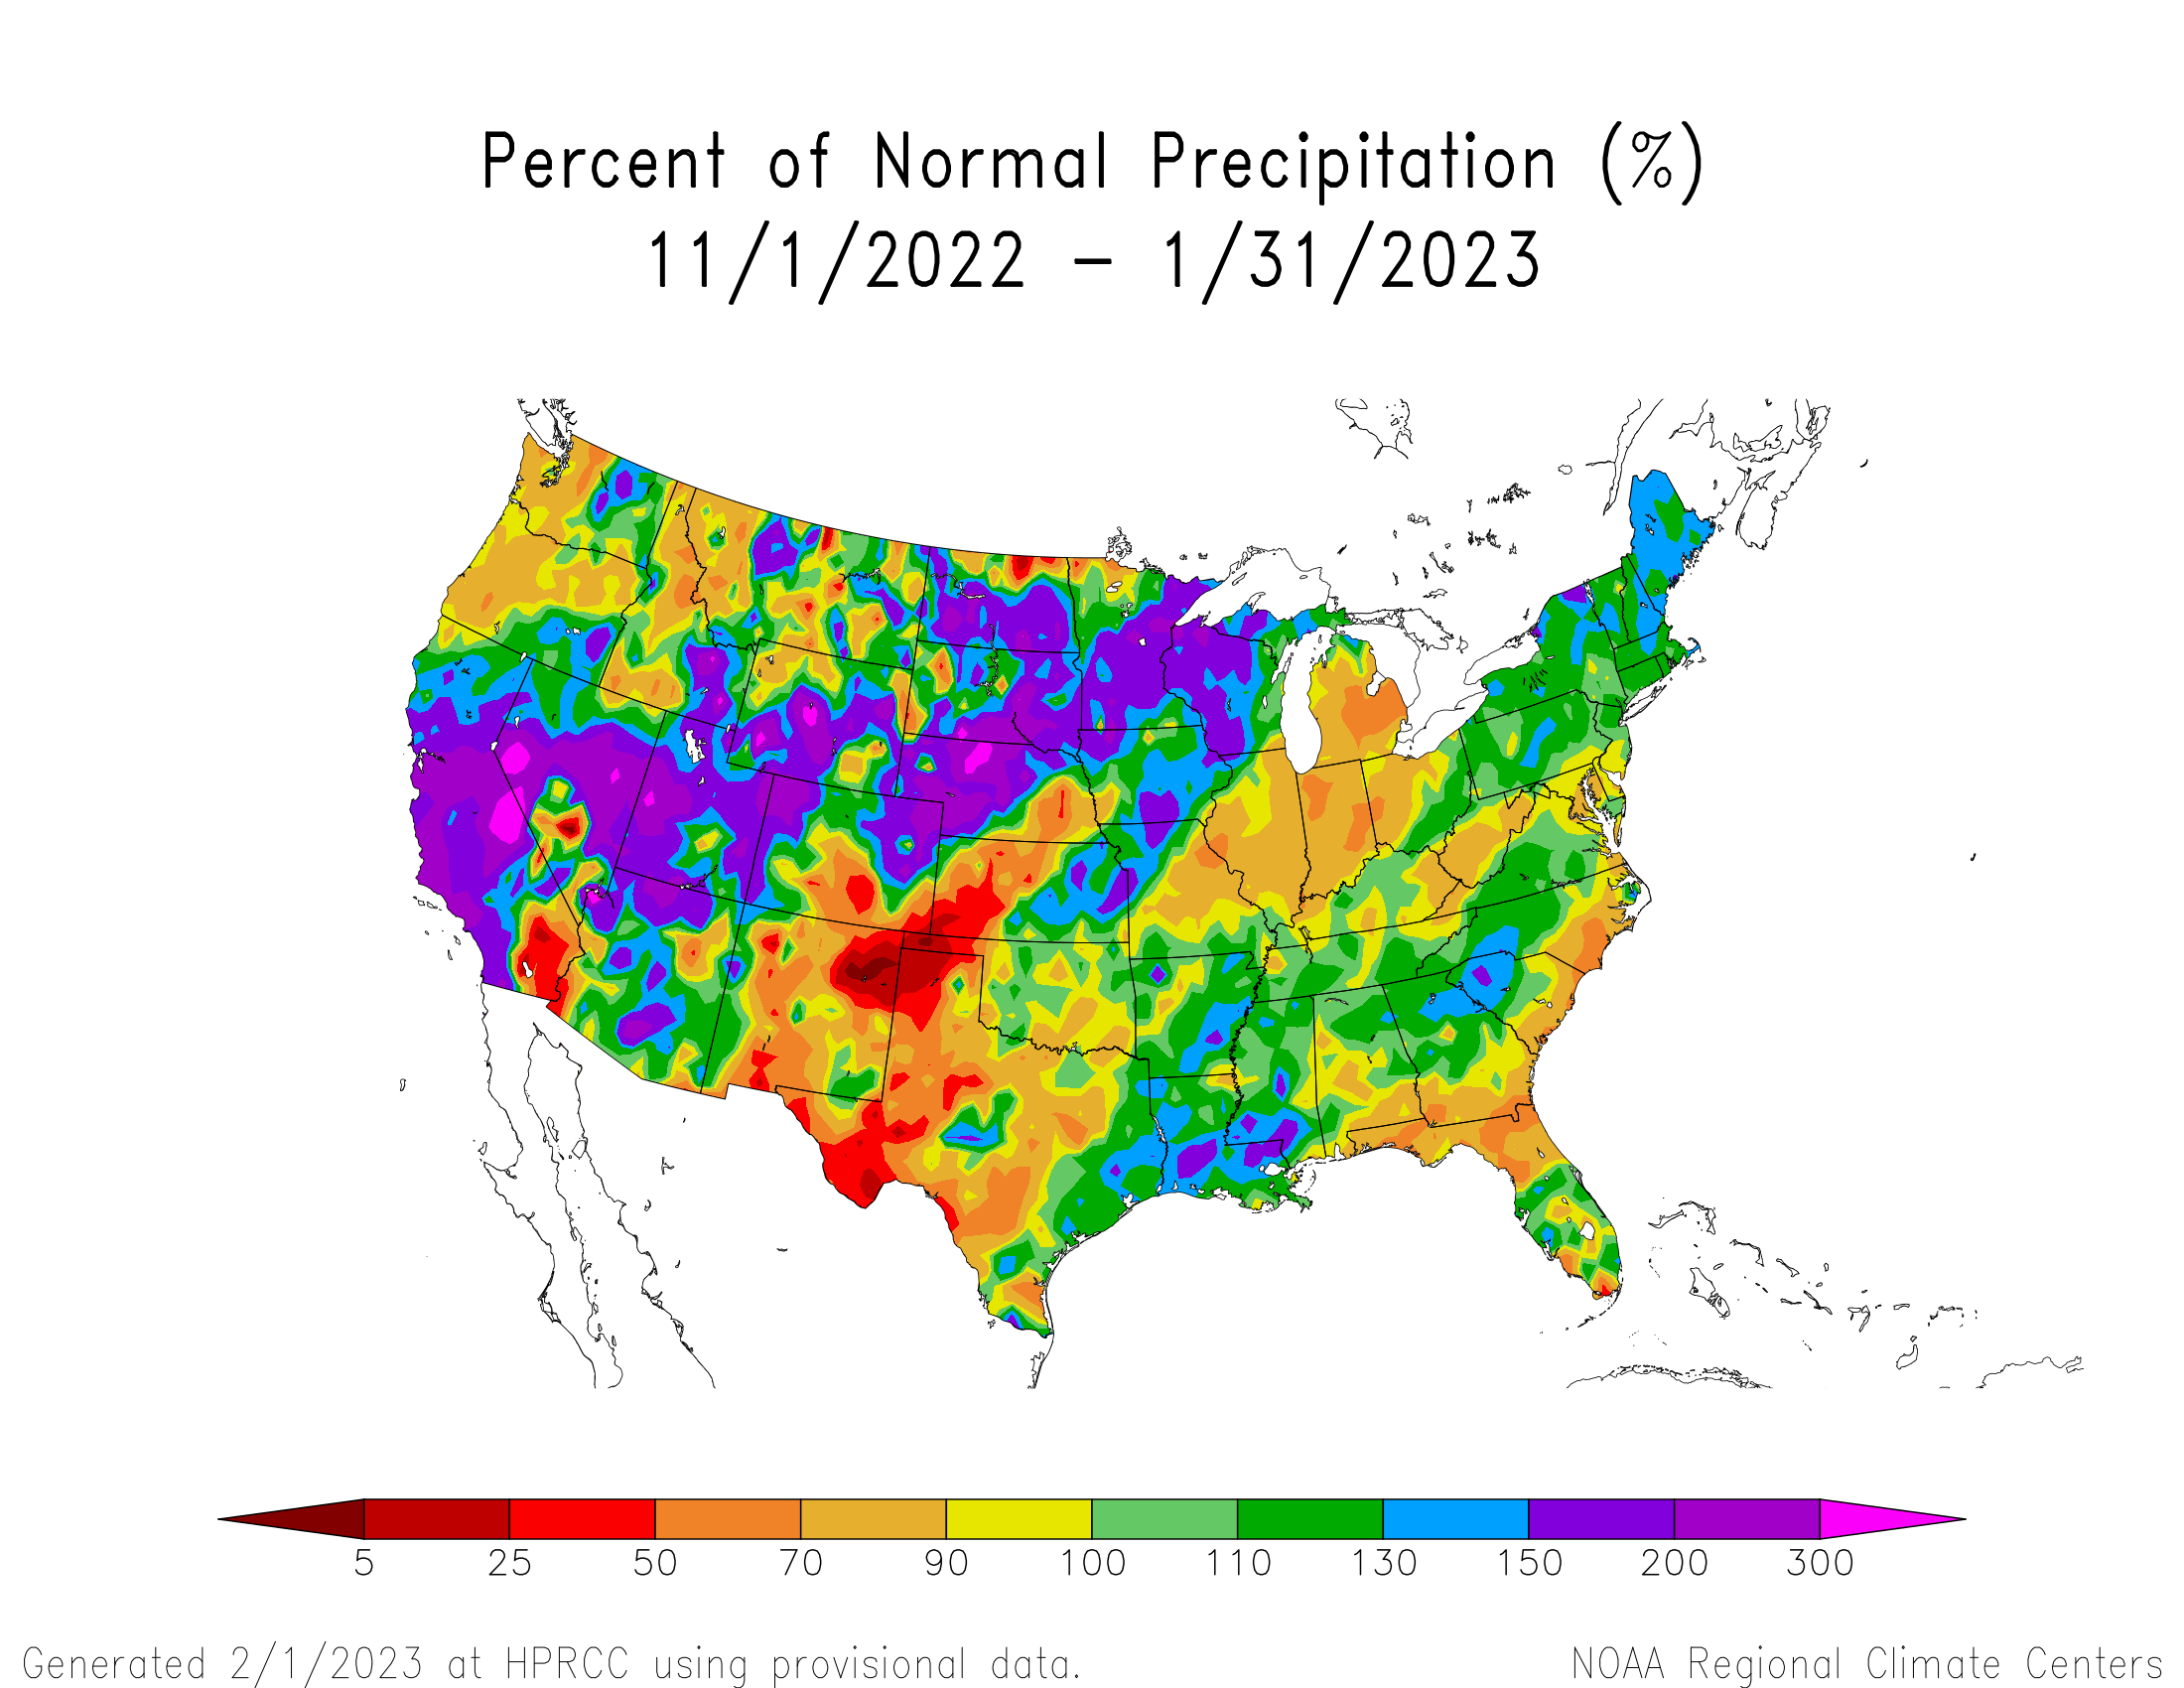
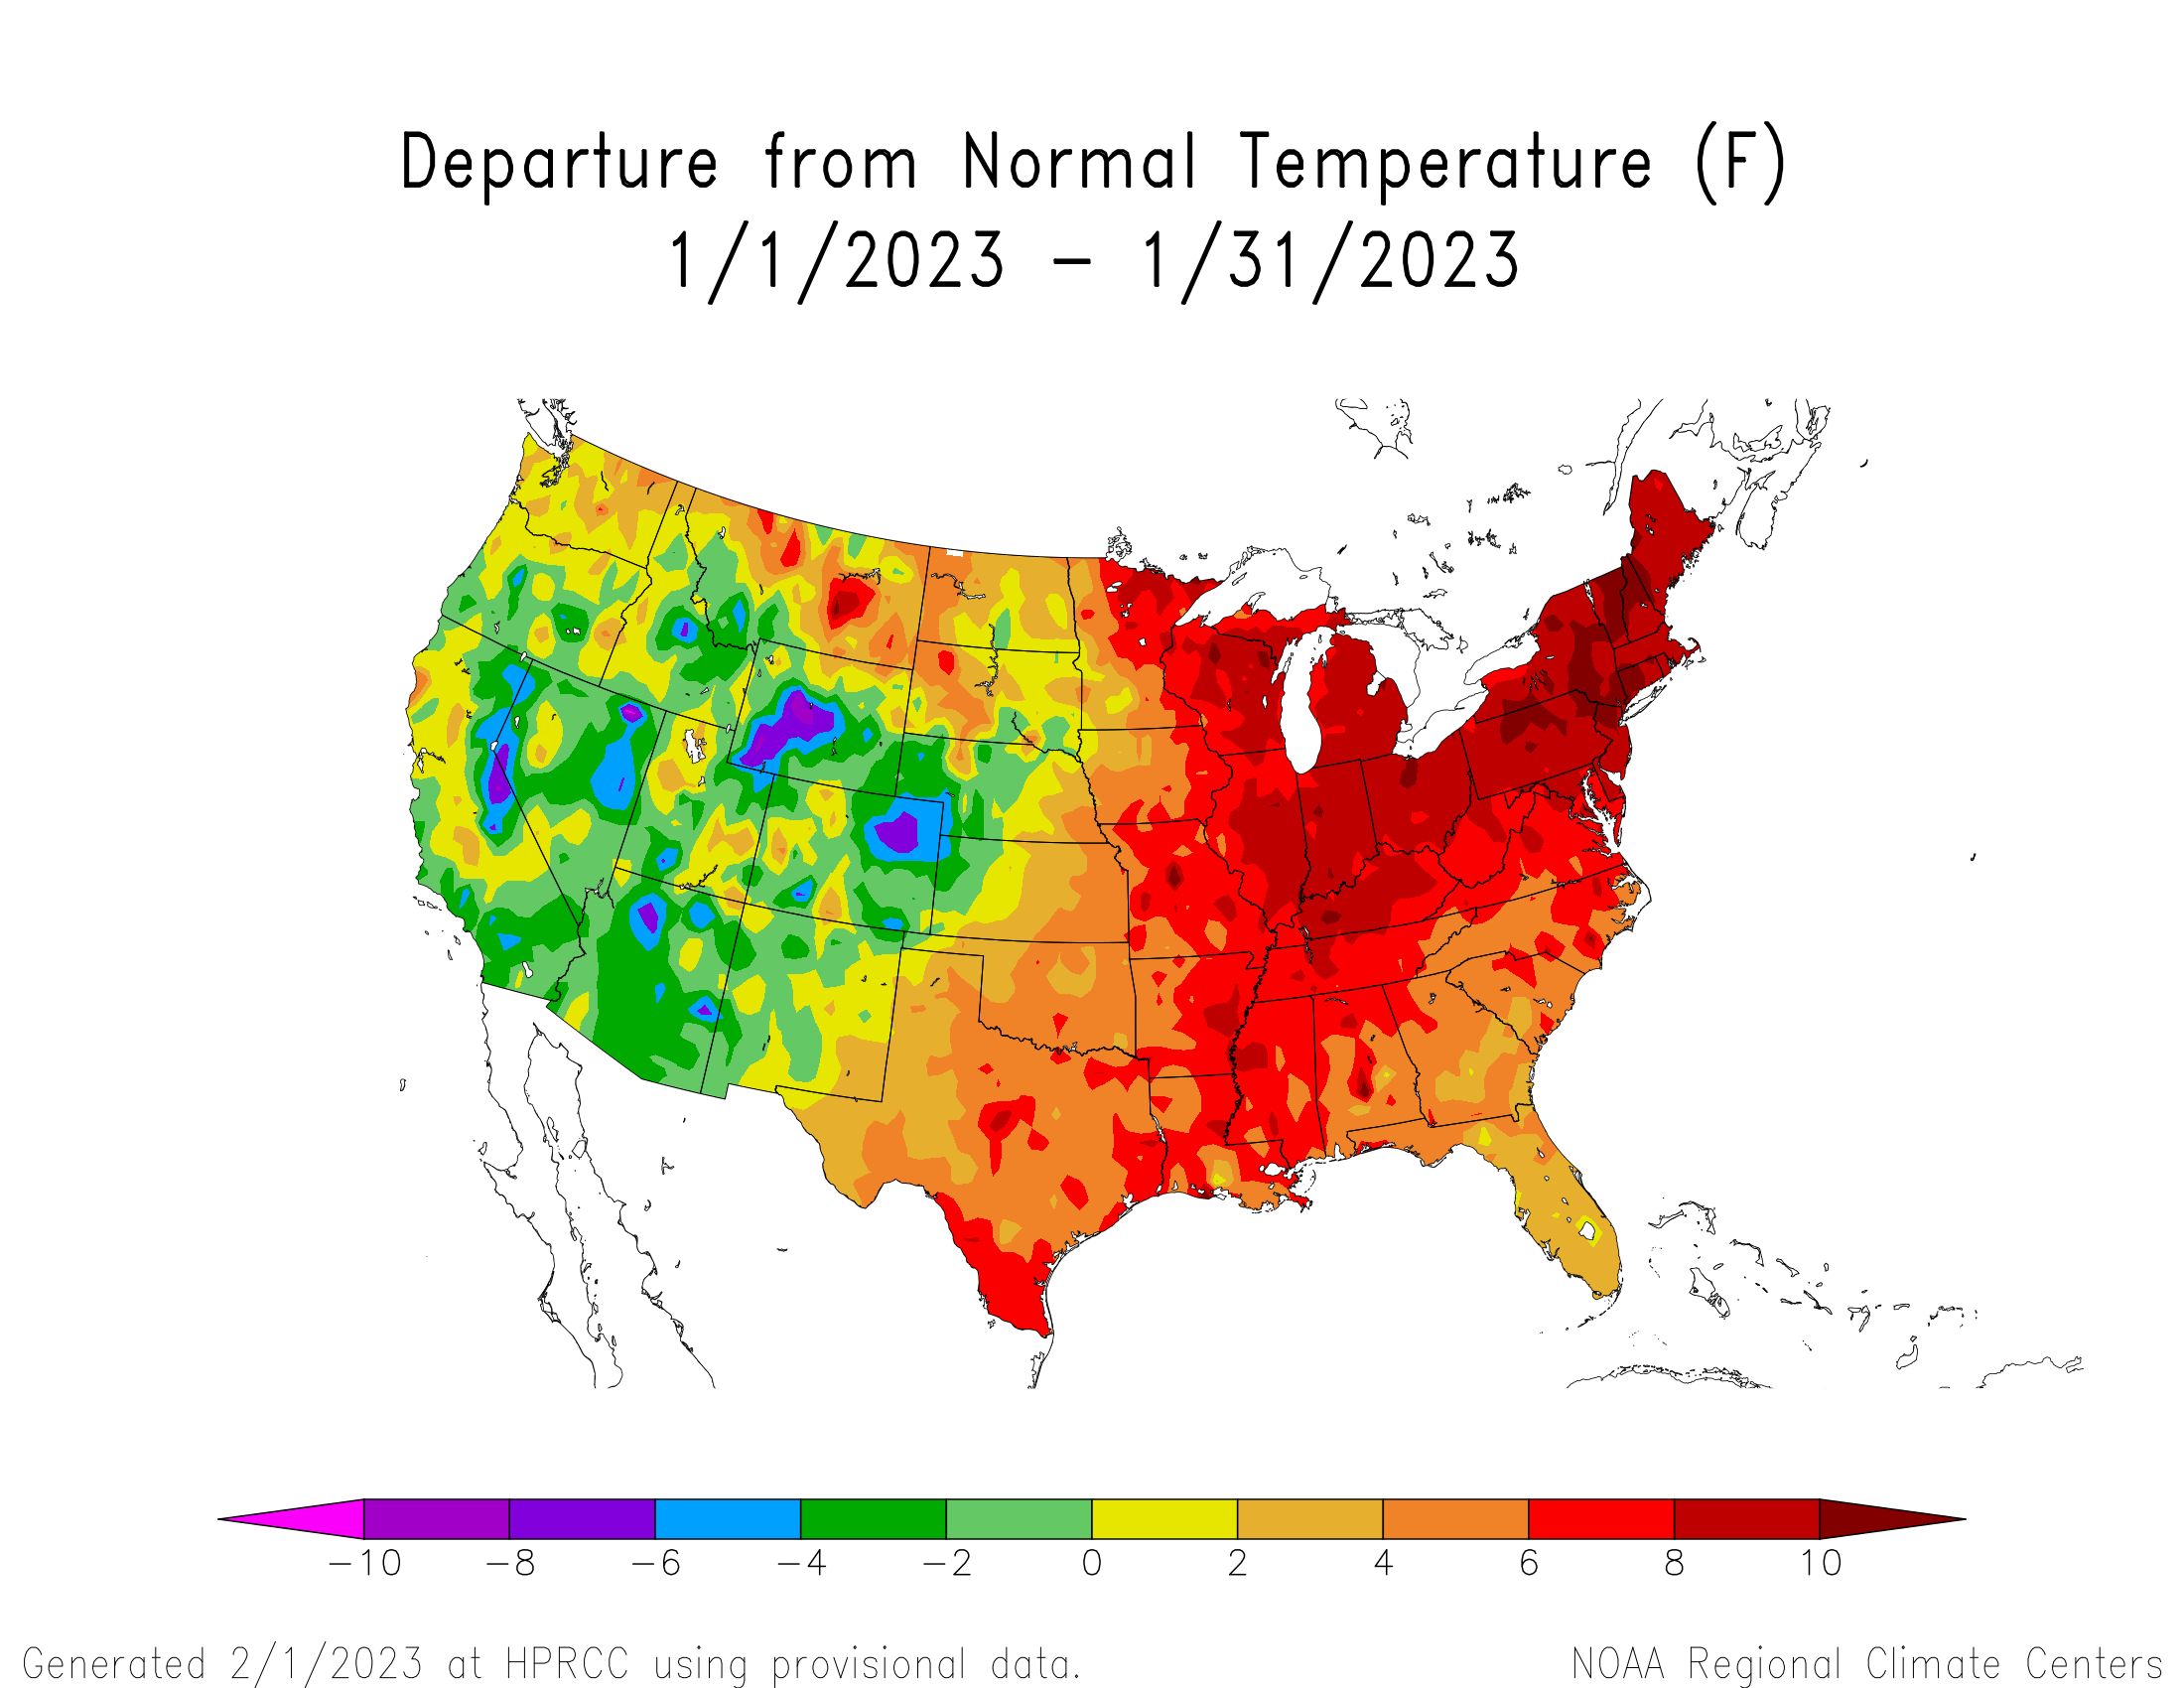
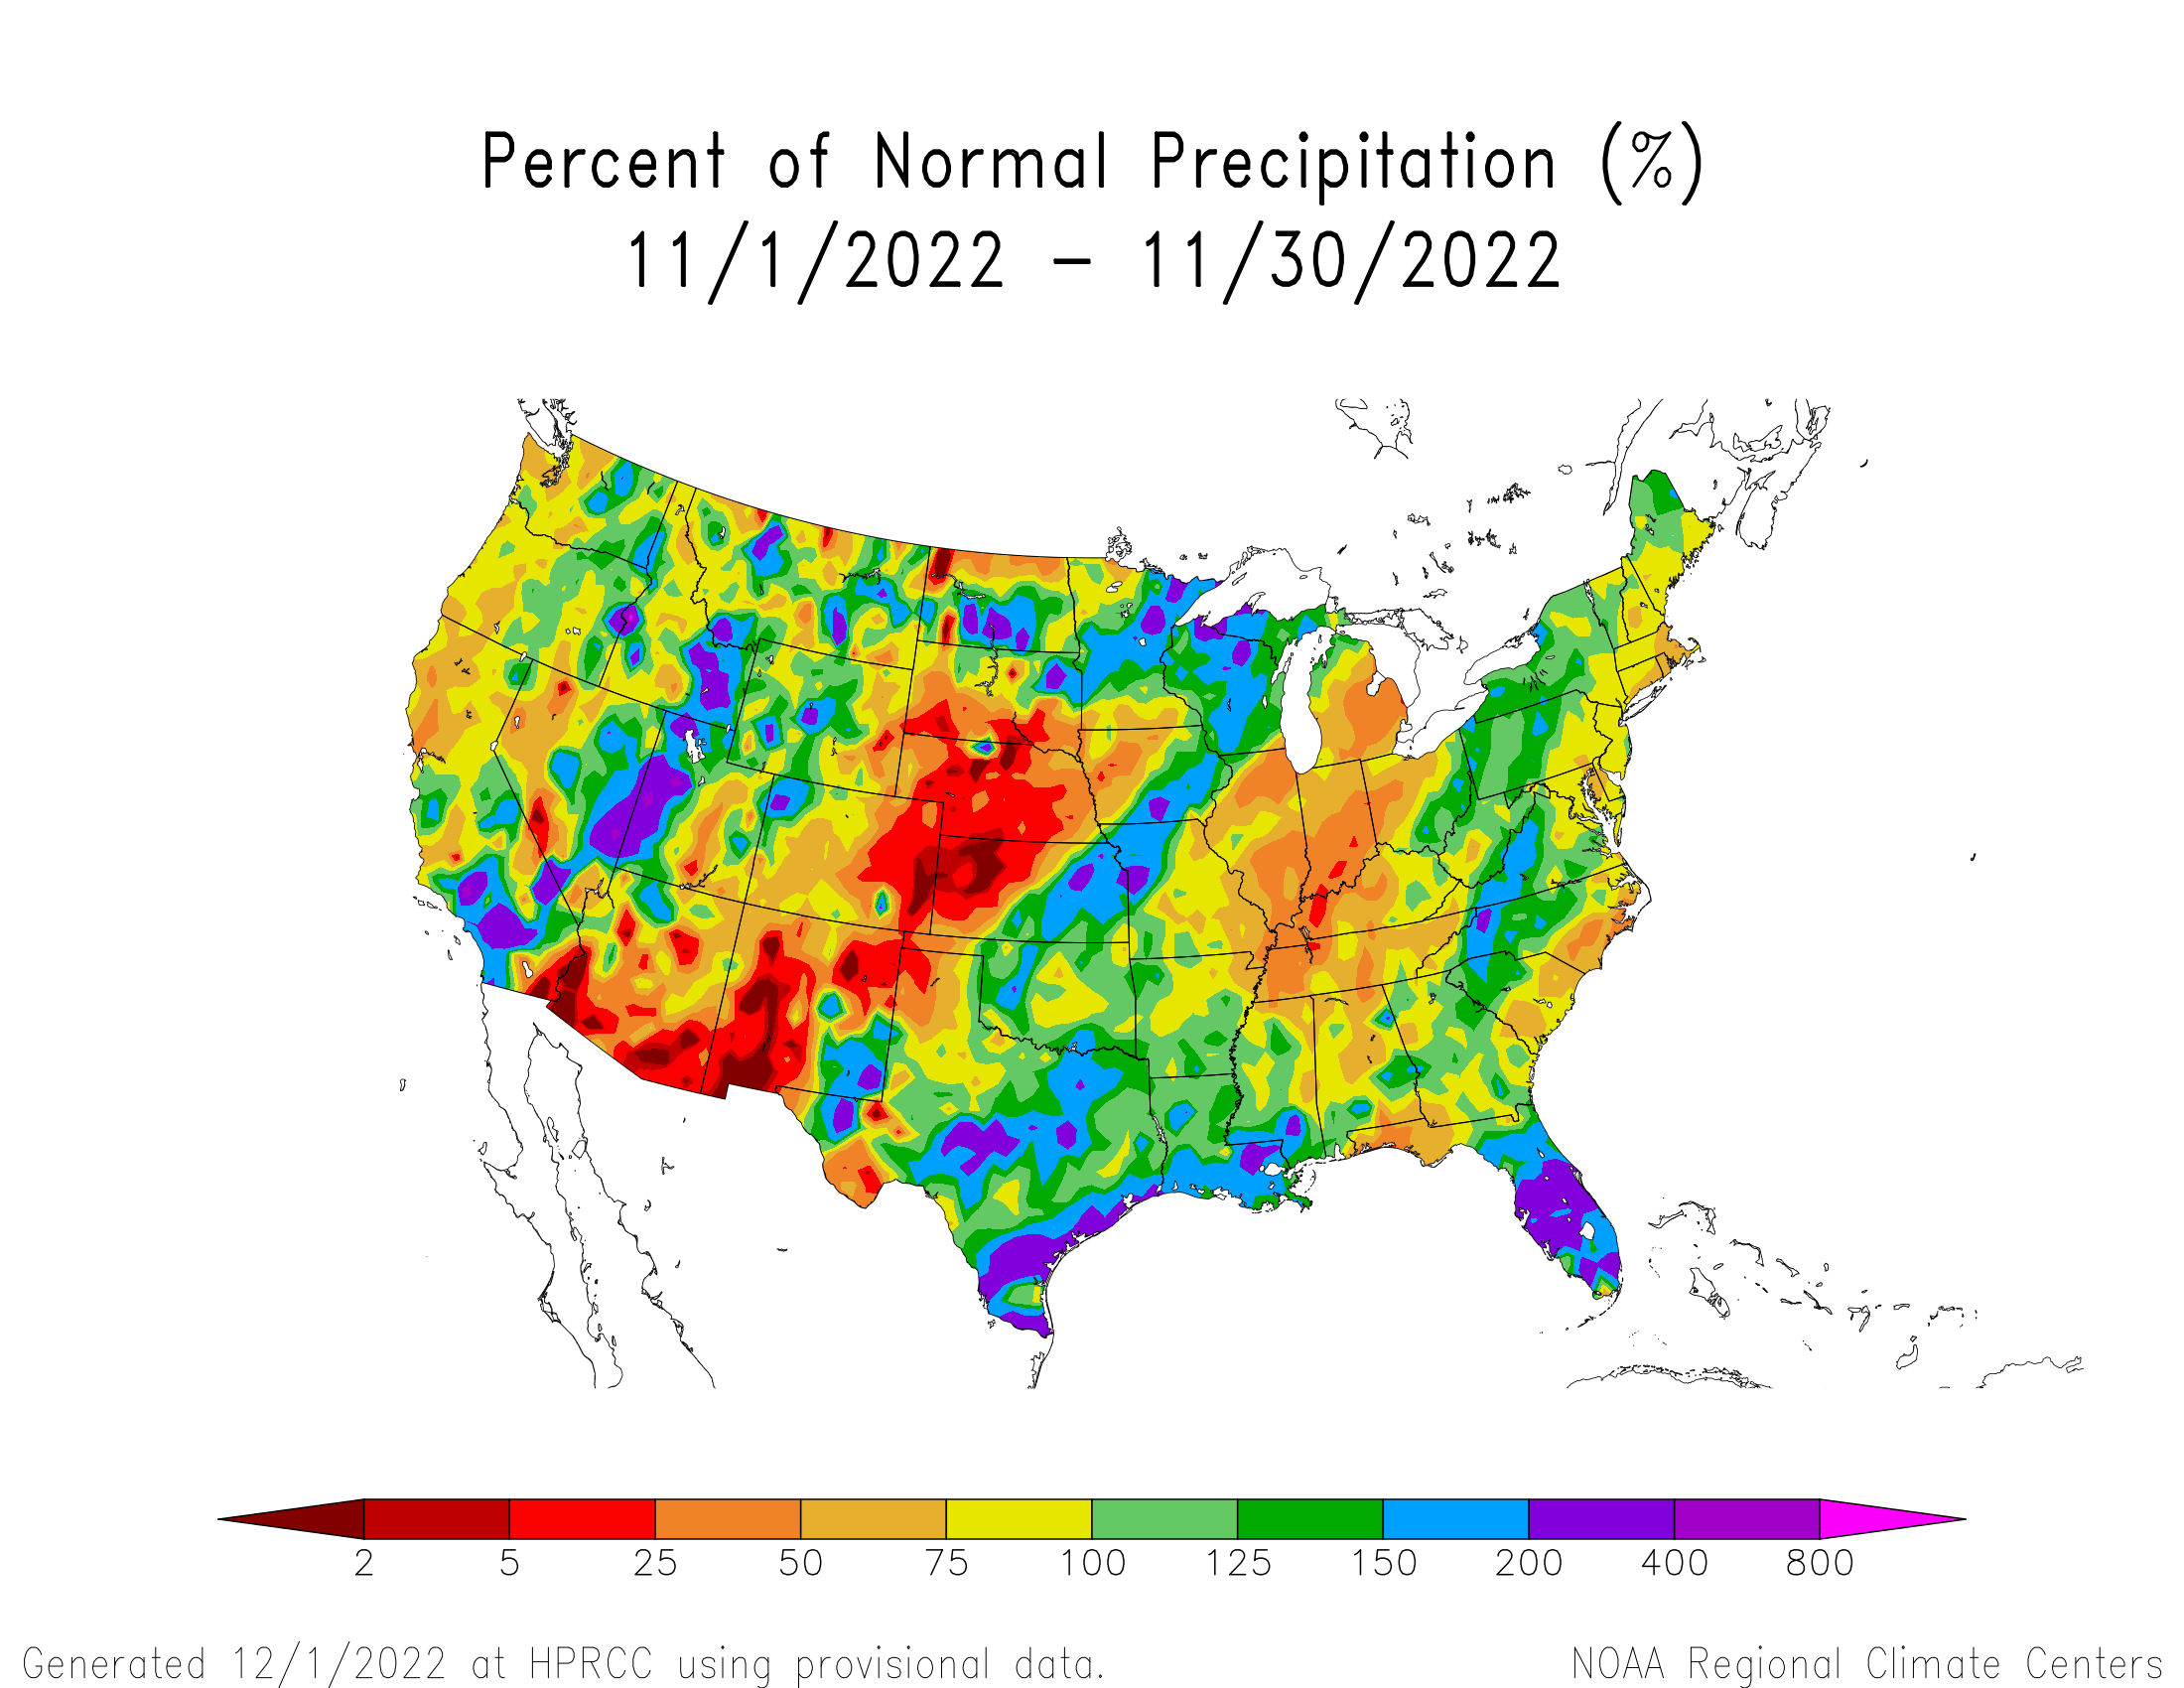
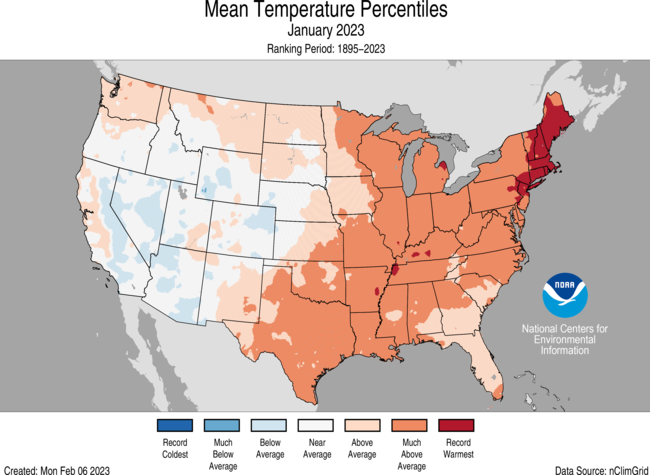
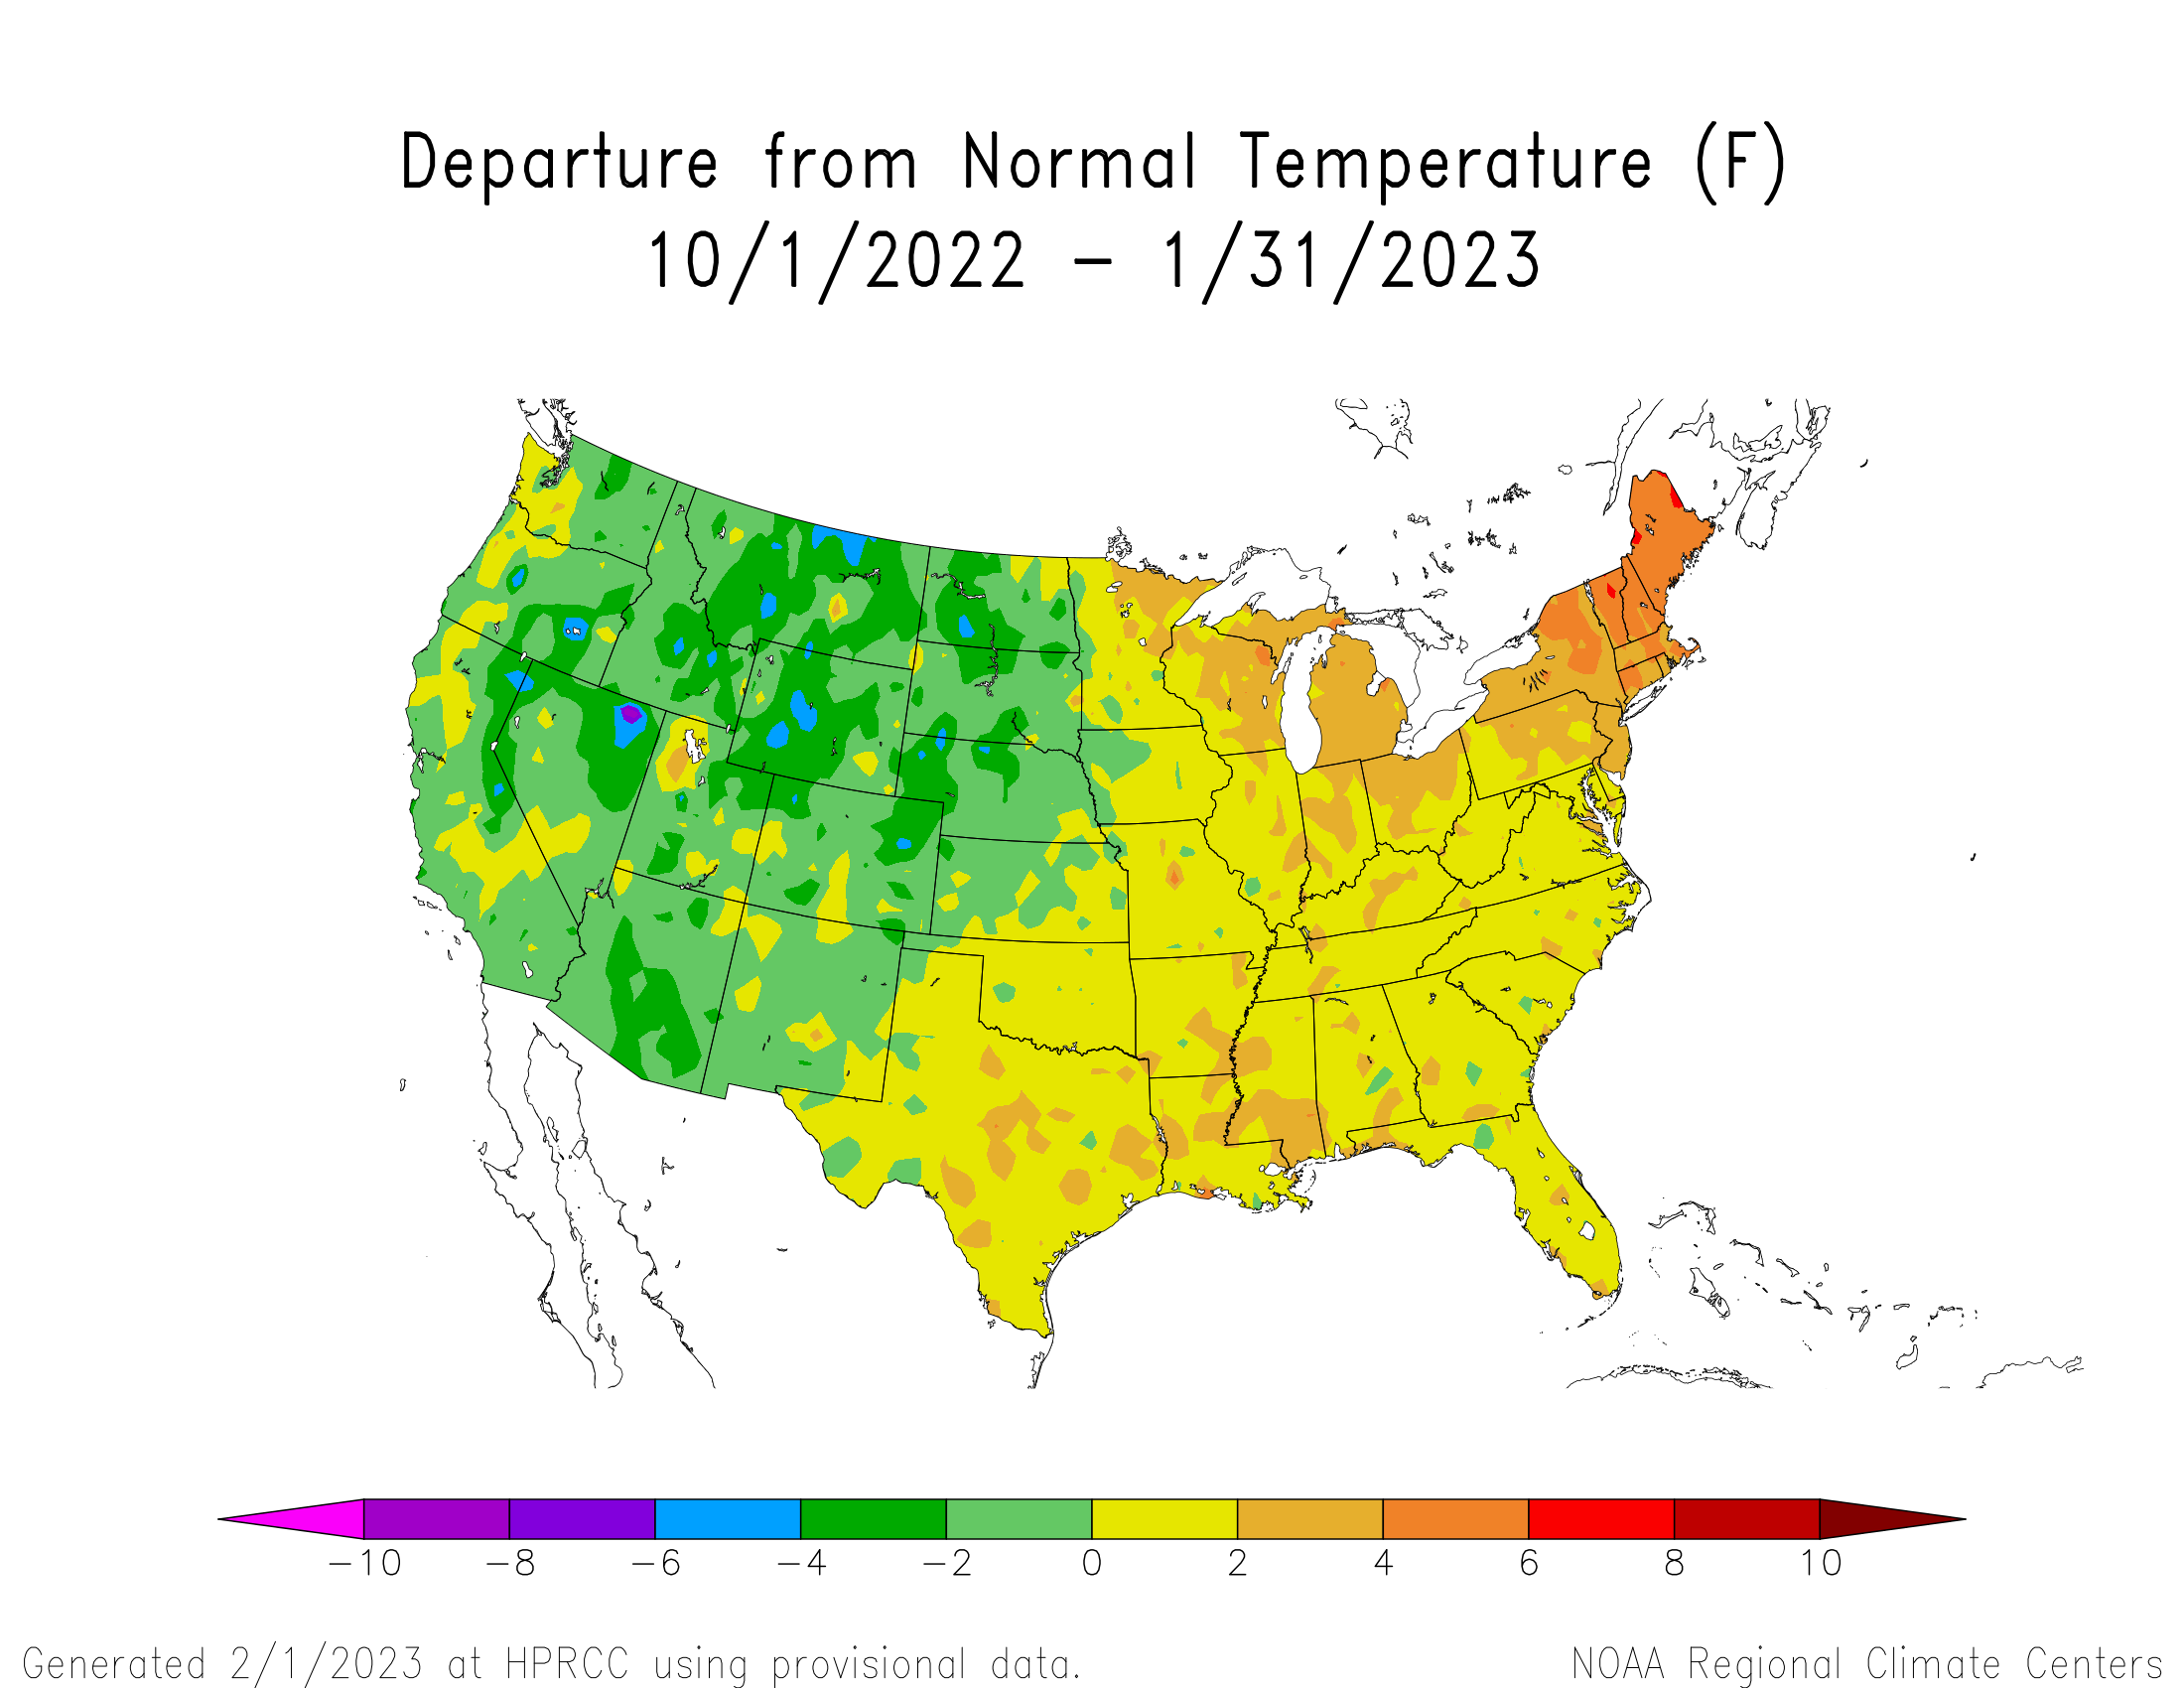
The atmospheric circulation over North America was very active during January 2023. Numerous upper-level shortwave troughs and closed lows moved through the jet stream flow throughout the month, dragging Pacific fronts and surface lows with them. These weather systems were fed by "atmospheric rivers" of very moist Pacific air that gave large parts of the West — from California to the Great Basin and beyond — episodes of very heavy rain and snow, especially during the first half of the month. The fronts and surface lows spread the above-normal precipitation and snow from the central Rockies into the adjacent Great Plains and Upper Mississippi Valley. Some of the fronts penetrated deep into the South where they tapped Gulf of Mexico moisture to spread above-normal precipitation in bands from the Lower Mississippi Valley to New England and across the interior Southeast. The storm track mostly missed the Pacific Northwest, northern Plains, southern Plains, and Florida, so these areas were drier than normal for the month. When averaged over the month, the circulation pattern consisted of an upper-level ridge over western Canada with a trough over the western CONUS. This classic "split flow" weakened Pacific systems over the Northwest, accounting for its below-normal precipitation. The western trough gave much of the West near to cooler-than-normal monthly temperatures, while a compensating southerly flow resulted in a warmer-than-normal month for most of the country east of the Rockies.
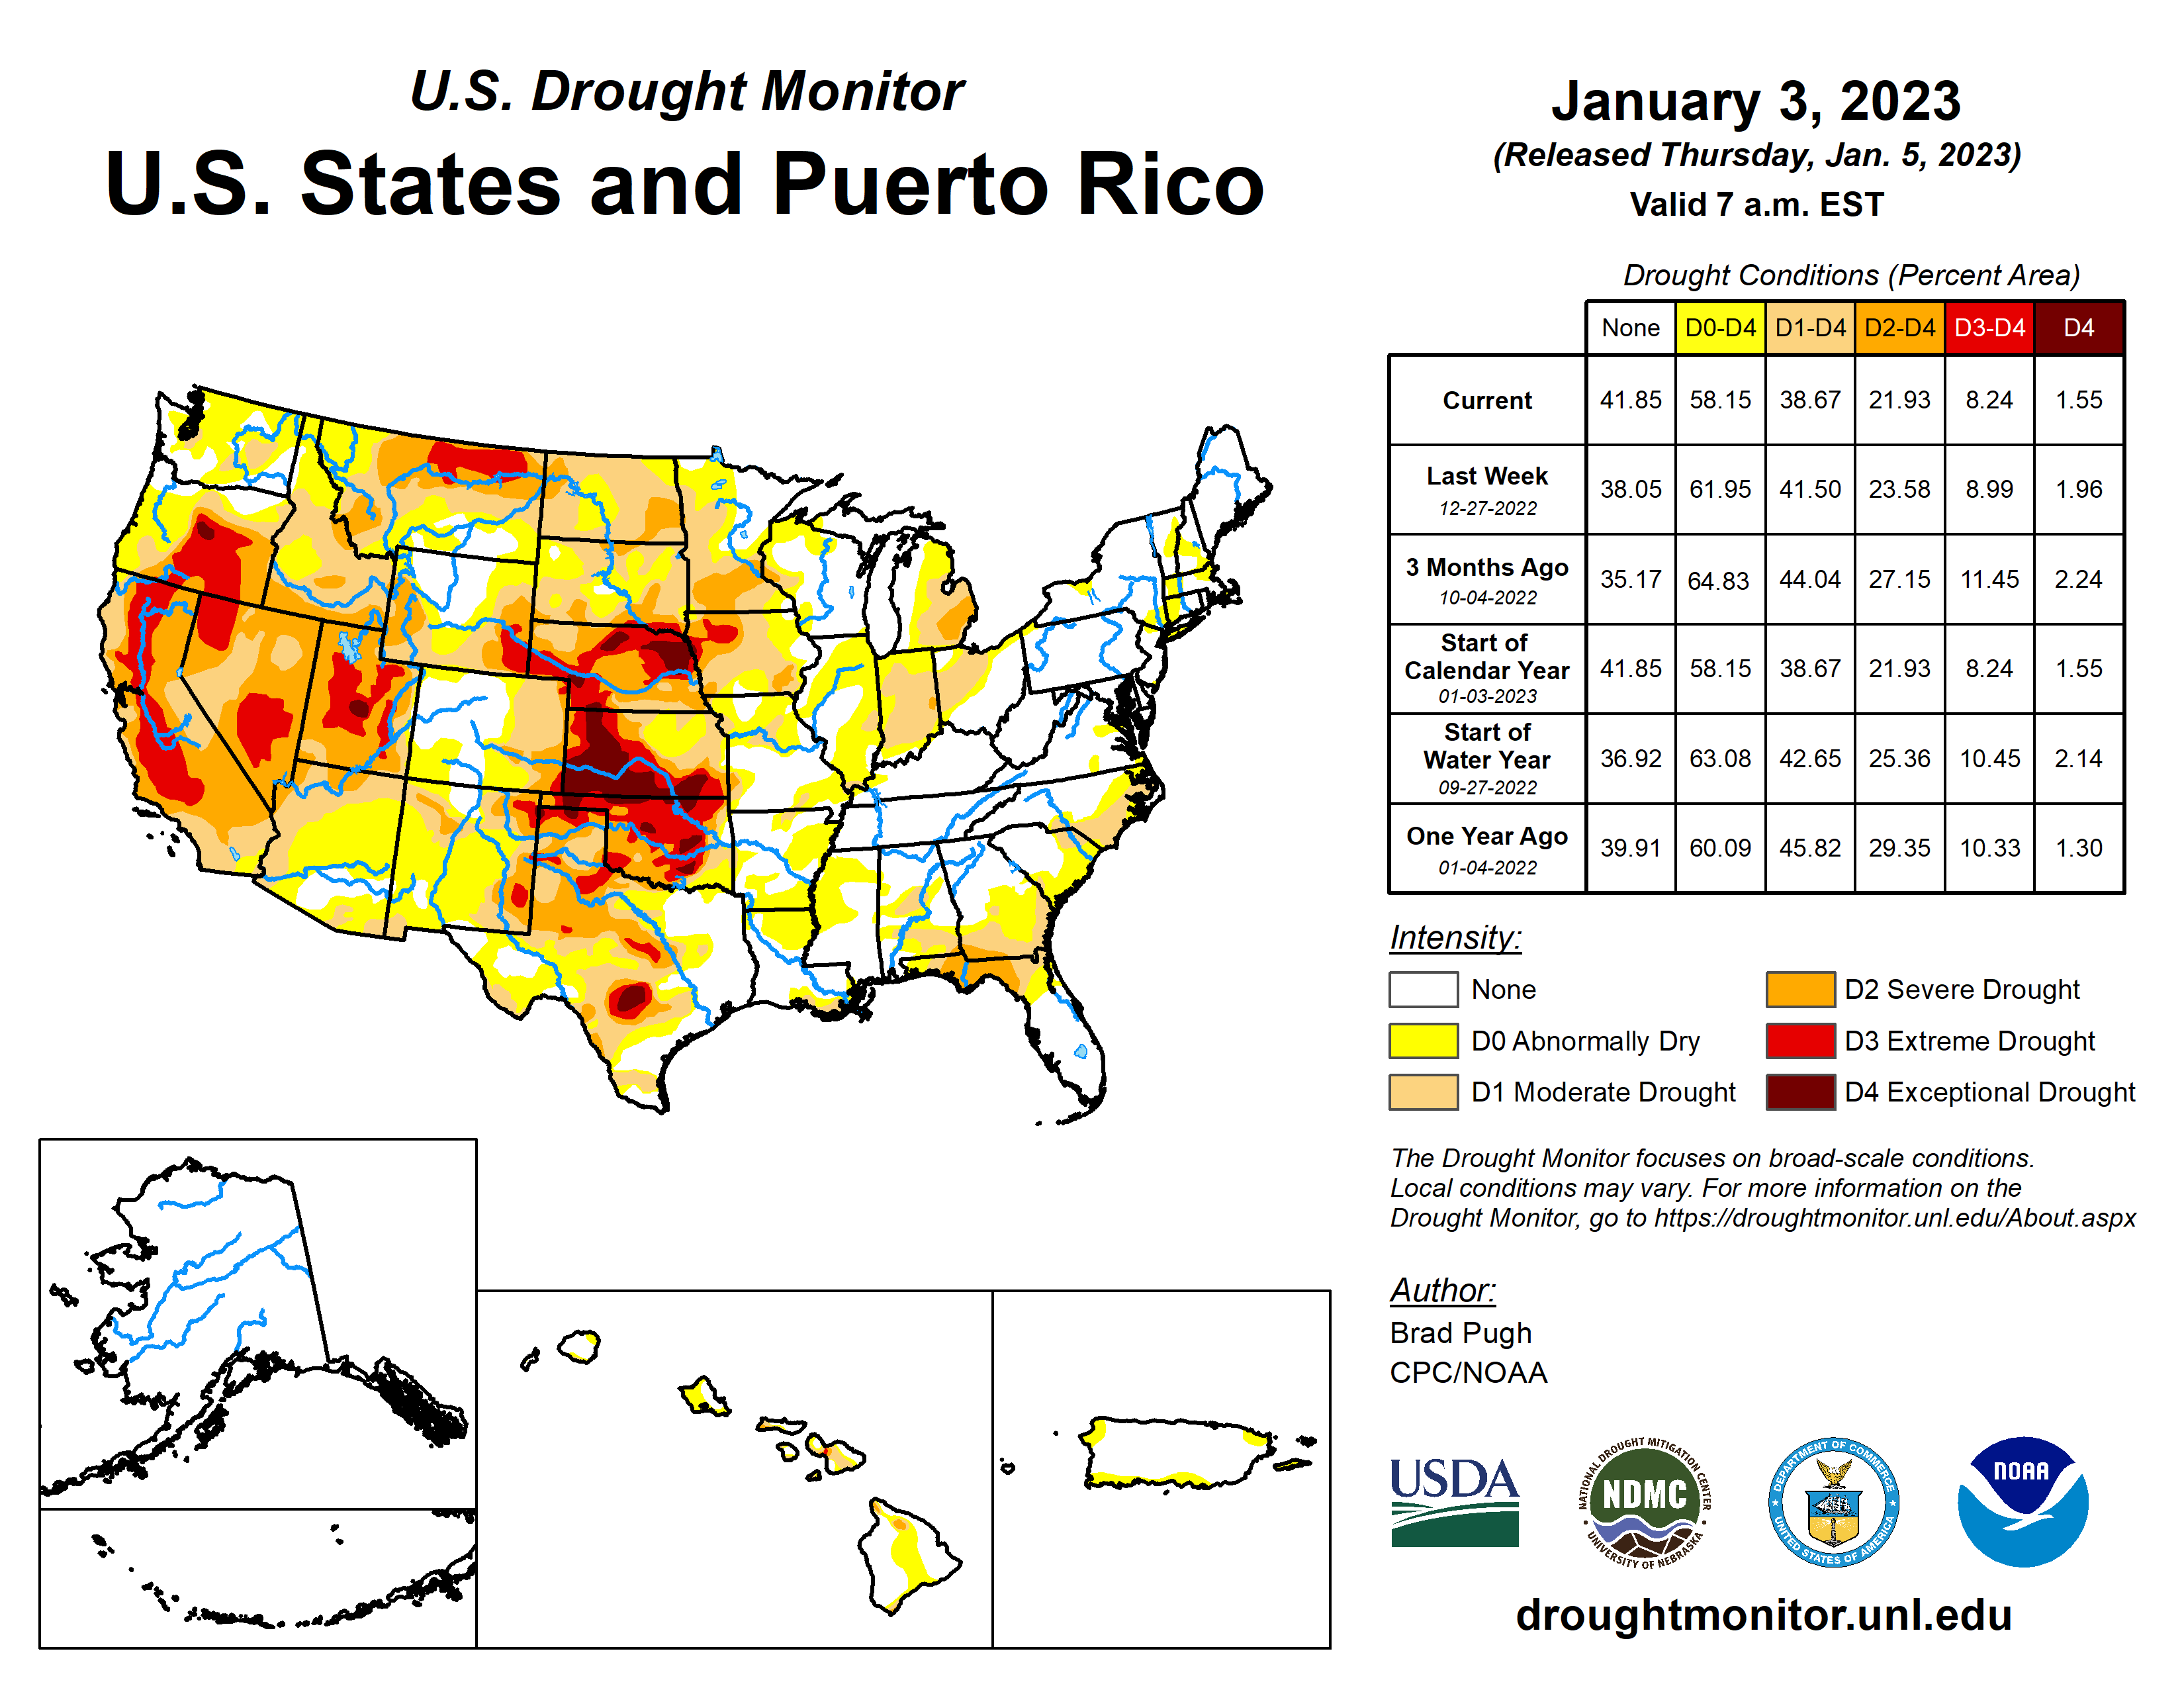
The above-normal precipitation and snowpack resulted in contraction or reduction of the intensity of drought over large parts of the West. Above-normal precipitation also contracted or reduced drought intensity across the Mississippi and Ohio Valleys, along the coastal Southeast, and parts of the Plains and Northeast. But areas experiencing a drier-than-normal month saw drought expansion or intensification. These areas included a few parts of the Pacific Northwest, southern Plains, Florida, and Hawaii. Drought contraction greatly exceeded expansion with the USDM-based national moderate-to-exceptional drought footprint across the CONUS decreasing from 46.3% at the end of December to 42.7% at the end of January (from 38.7% to 35.7% for the 50 states and Puerto Rico). According to USDM statistics, 40% or more of the CONUS has been in moderate drought or worse for the last 123 weeks. This is a record in the 22-year USDM history. The previous record was 68 consecutive weeks (June 19, 2012 to October 1, 2013).
According to the Palmer Drought Index, which goes back to the beginning of the 20th century, about 20.3% of the CONUS was in moderate to extreme drought at the end of January, which is a slight drop compared to the end of December.
Drought conditions at the end of January, as depicted on the January 31, 2023 USDM map, included the following core drought and abnormally dry areas:
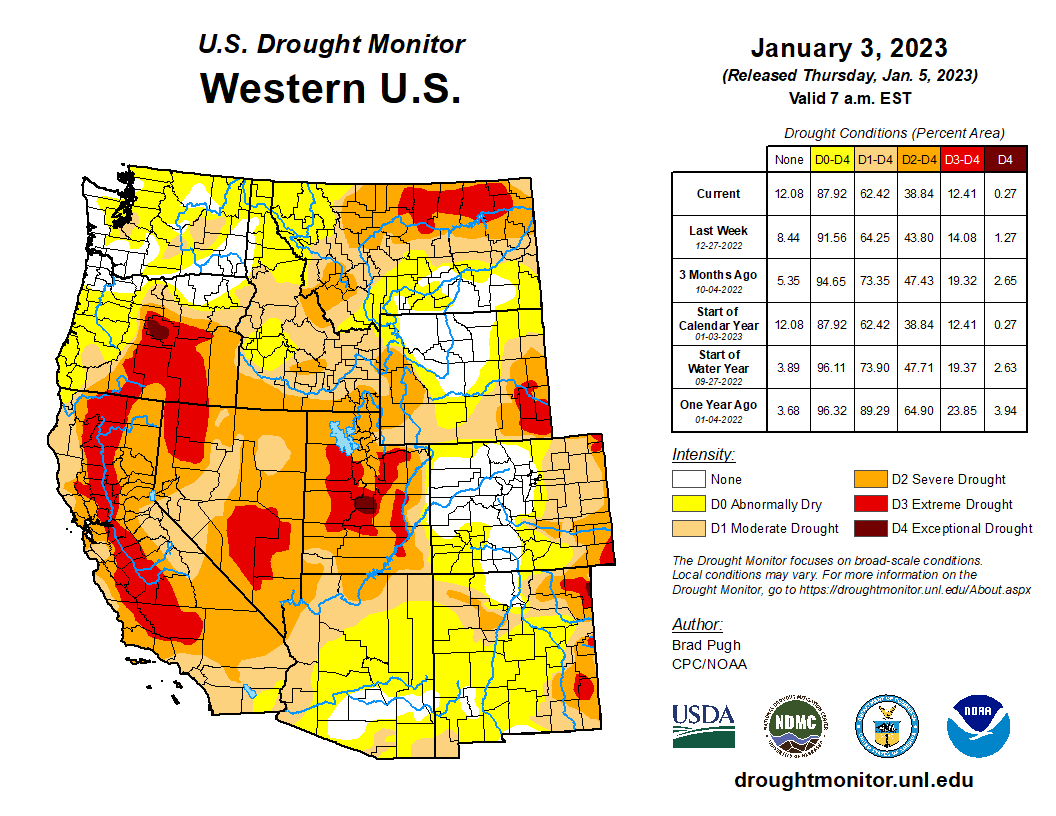
- Moderate (D1) to severe (D2) drought extended from the West Coast to Great Basin and Montana, with areas of extreme (D3) and a few pockets of exceptional (D4) drought. The unusually wet conditions in January (combined with those in November and December) further contracted or reduced the intensity of drought in many parts of the West. The percent area of the Western U.S. experiencing moderate to exceptional drought, according to USDM statistics, decreased from 62.4% at the end of December to 60.6% at the end of January.
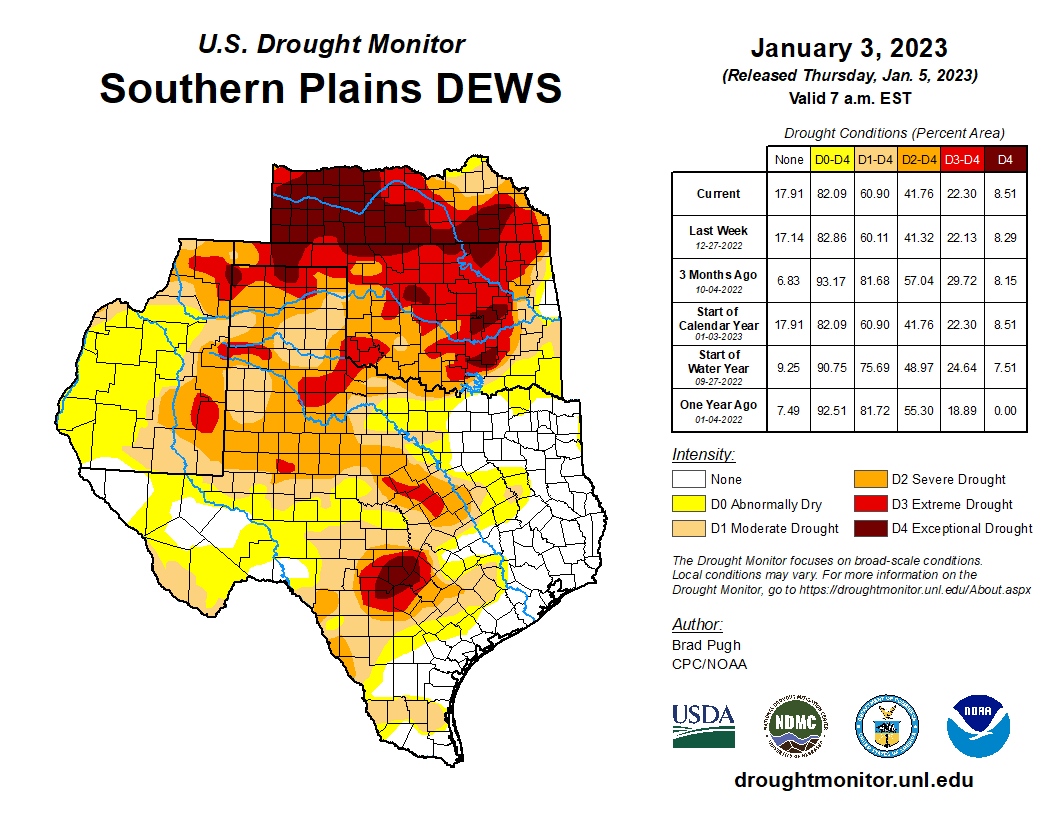
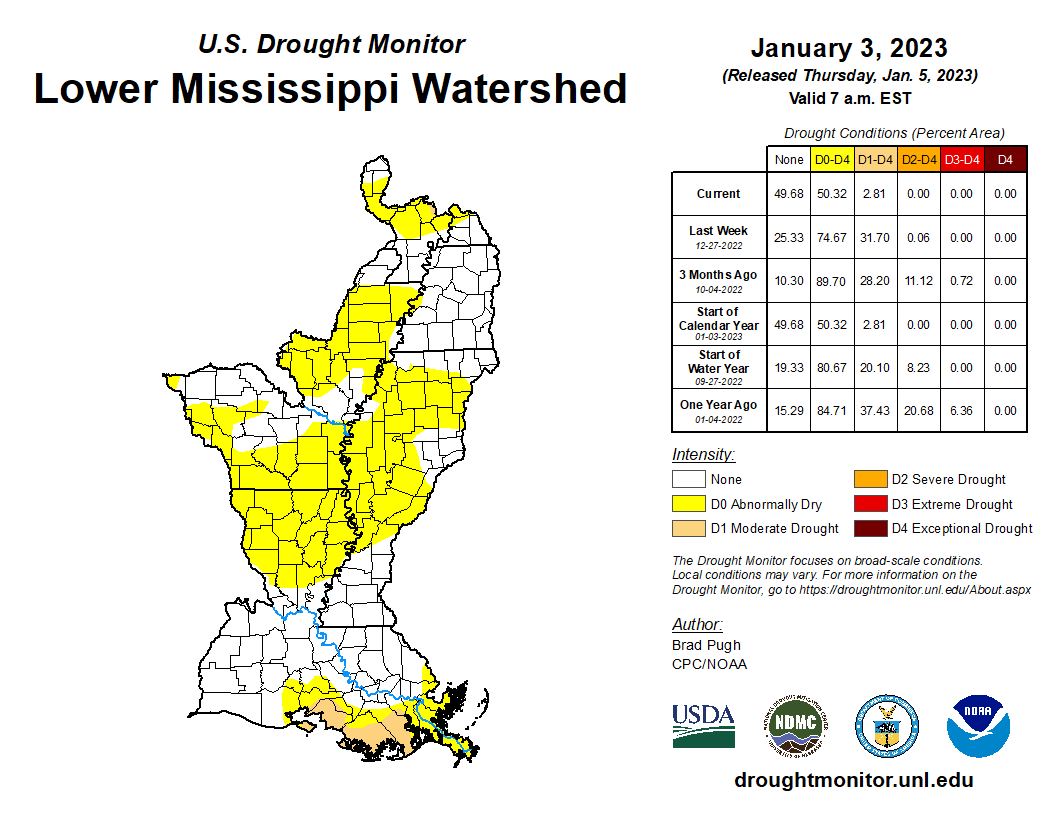
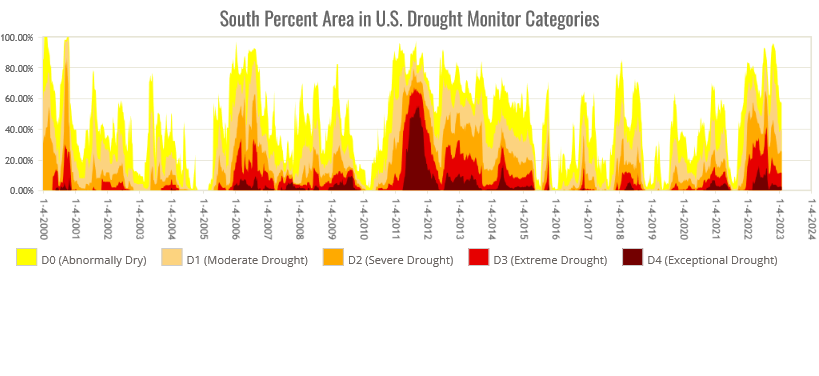
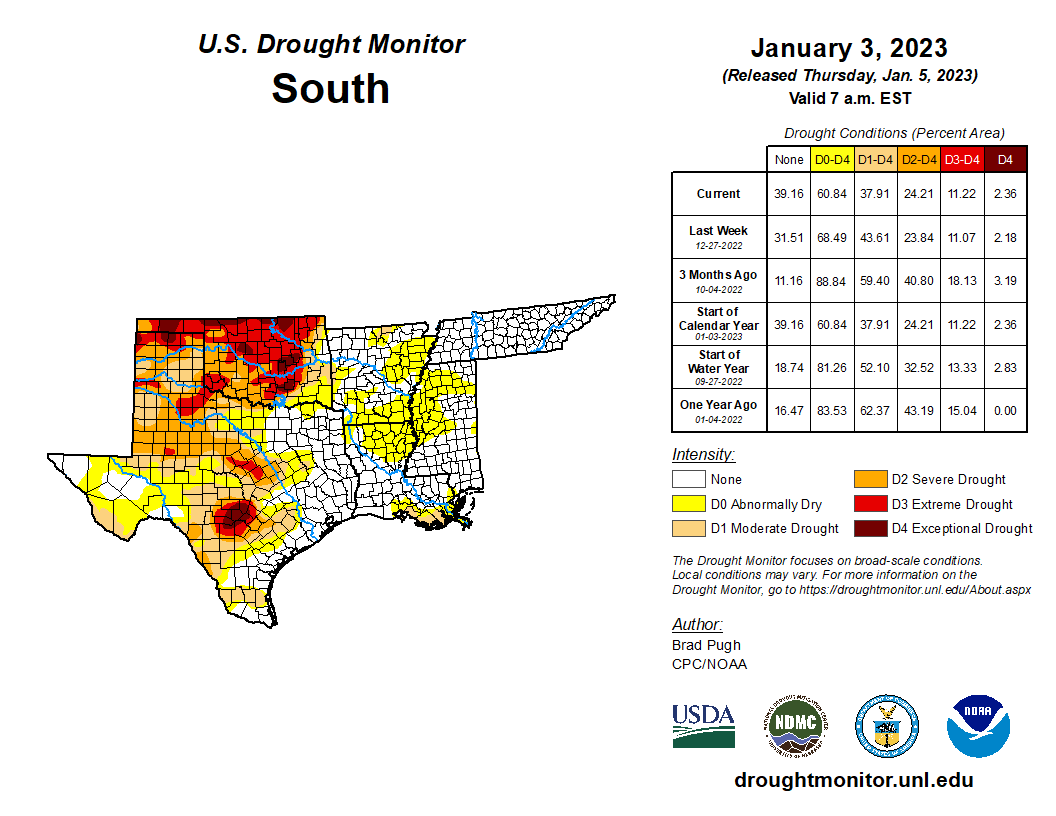
- Moderate to exceptional drought continued in the Great Plains. Beneficial January precipitation contracted drought in some areas, while continued dry weather intensified/expanded drought in other areas. In the central to northern Plains, the moderate to exceptional drought area fell from 66.4% of the region at the end of December to 64.7% of the region at the end of January. In the southern Plains, the moderate to exceptional drought area increased from 60.9% at the end of December to 64.0% at the end of January. In the Lower Mississippi Valley, wet weather has virtually eliminated drought, further shrinking the drought area from 2.8% of moderate drought at the end of December to 0.6% of moderate drought at the end of January. Taken together, the southern Plains, Lower Mississippi Valley, and Tennessee (South Region) saw moderate to exceptional drought rise slightly from 37.9% at the end of December to 38.5% at the end of January, due to expansion in the southern Plains.
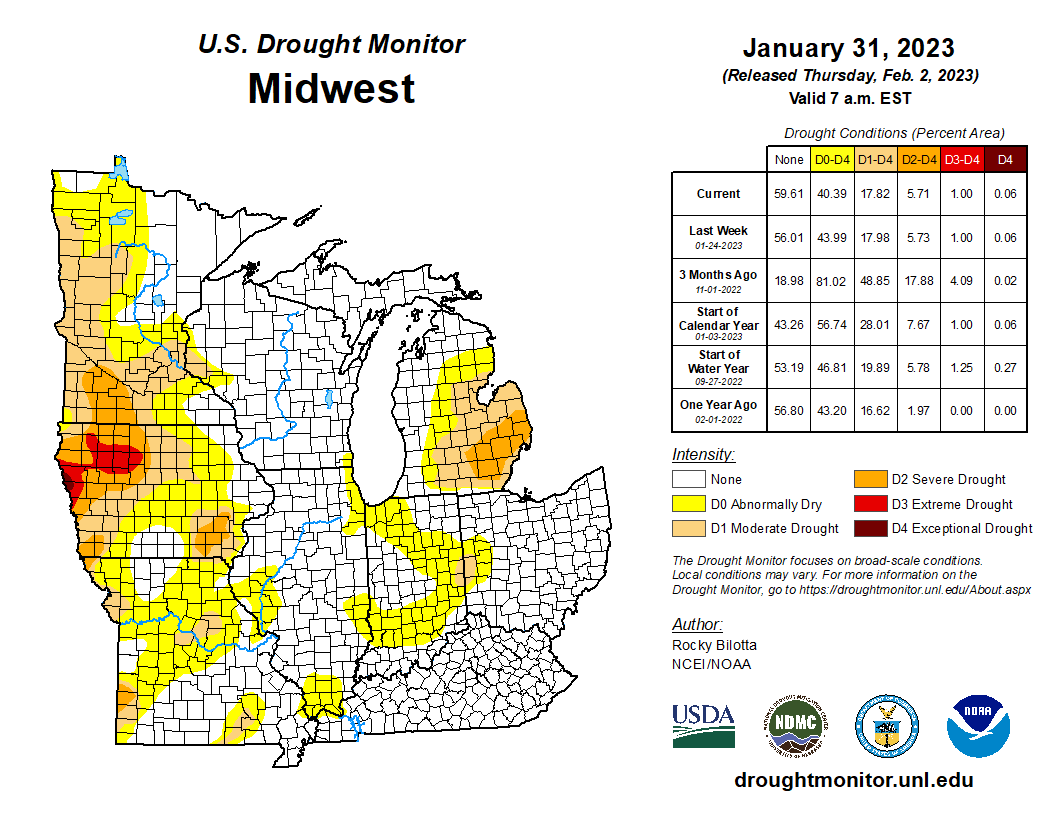
- Drought contracted in the Midwest. The Midwest region's drought area decreased from 28.0% at the end of December to 17.8% at the end of January. The most intense area of drought was in northwestern Iowa, with severe drought in areas to the south and in Lower Michigan.
- Expansion and contraction occurred in the Southeast, with contraction winning. The moderate to severe drought area shrank from 20.6% at the end of December to 8.3% at the end of January. The most severe area of drought was centered around northern Florida with moderate drought extending north along the coast to the Carolinas and Virginia.
- A small area of moderate drought continued in the Northeast, on Long Island. The drought area continued at 0.2% at the end of January.
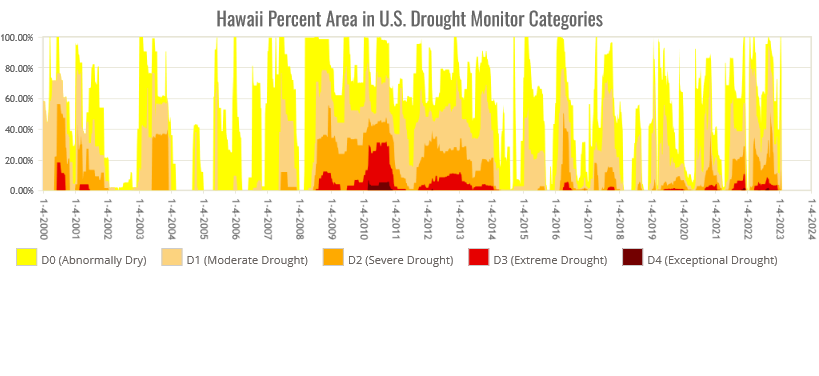
- Drought expanded in Hawaii this month. The drought area grew from 11.4% at the end of December to 19.0% at the end of January.
- In the U.S.-Affiliated Pacific Islands (USAPI), compared to last month, wet conditions during January ended abnormal dryness (D0) in the Marshall Islands at Alinglaplap, Jaluit, and Kwajalein and in the FSM at Lukunor, Ulithi, and Fananu. Severe drought (D2) improved to moderate drought (D1) at Kapingamarangi in the FSM. The rest of the region remained free of drought and abnormal dryness.
Palmer Drought Index
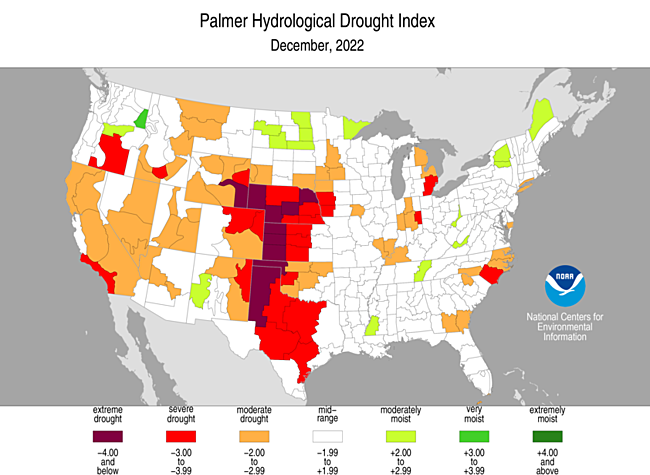
The Palmer drought indices measure the balance between moisture demand (evapotranspiration driven by temperature) and moisture supply (precipitation). The Palmer Z Index depicts moisture conditions for the current month, while the Palmer Hydrological Drought Index (PHDI) and Palmer Drought Severity Index (PDSI) depict the current month's cumulative moisture conditions integrated over the last several months.

While both the PDSI and PHDI indices show long-term moisture conditions, the PDSI depicts meteorological drought while the PHDI depicts hydrological drought. The PDSI map may show less severe and extensive drought (as well as wet spell conditions) in some parts of the country than the PHDI map because the meteorological conditions that produce drought and wet spell conditions are not as long-lasting as the hydrological impacts.

Used together, the Palmer Z Index and PHDI maps show that short-term drought occurred in the Pacific Northwest, southern Plains, Florida, and the DelMarVa region, expanding or intensifying long-term drought (PHDI maps for January compared to December). Short-term drought also occurred part of the northern Plains and contracted long-term wetness there. Short-term wet conditions occurred over the Southwest to central Plains, Upper and Lower Mississippi Valley, Northeast, and southern Appalachians, contracting or reducing the intensity of long-term drought and expanding or introducing local areas of long-term wet conditions.
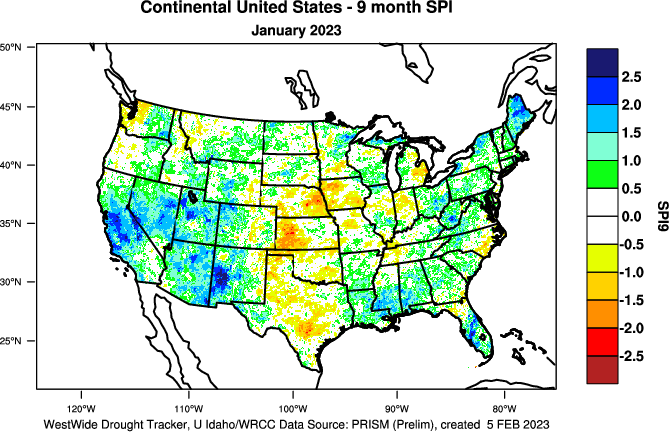
Standardized Precipitation Index
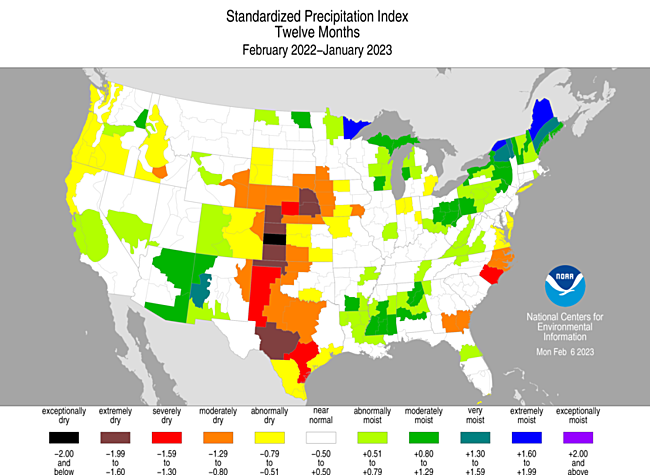
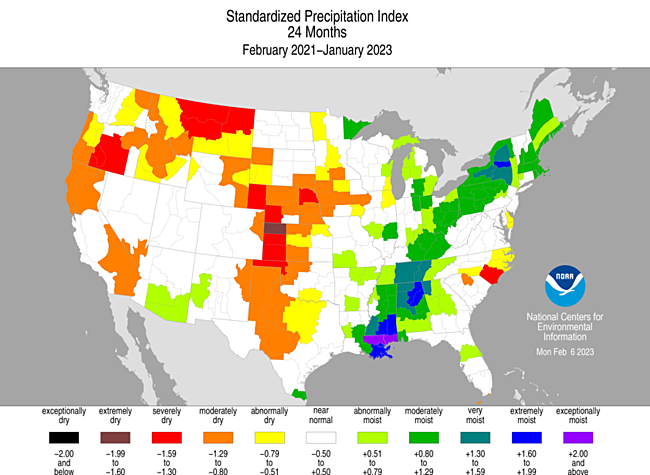
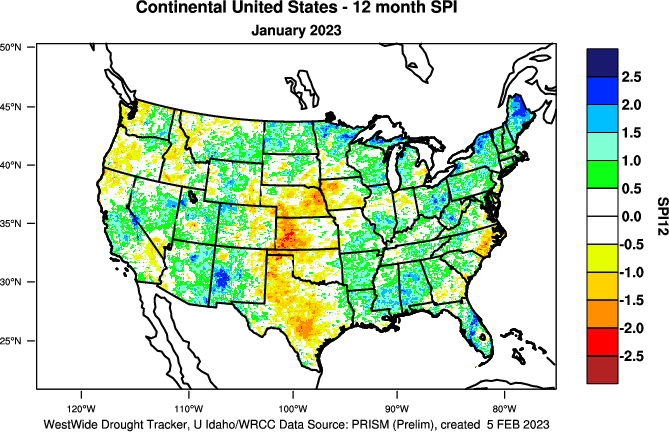
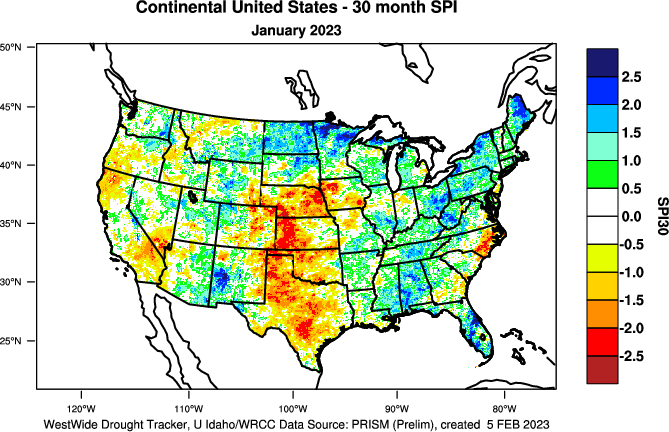
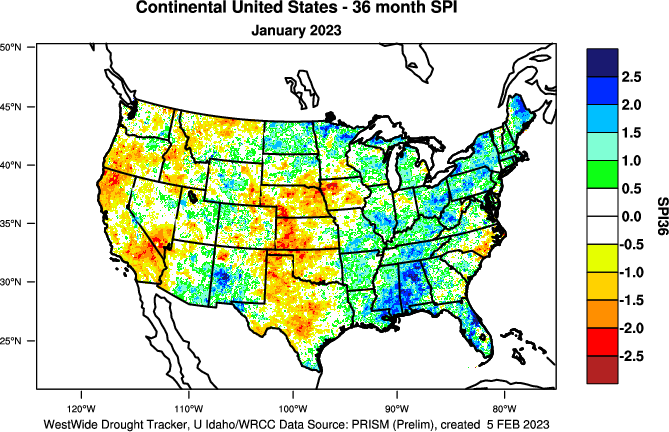
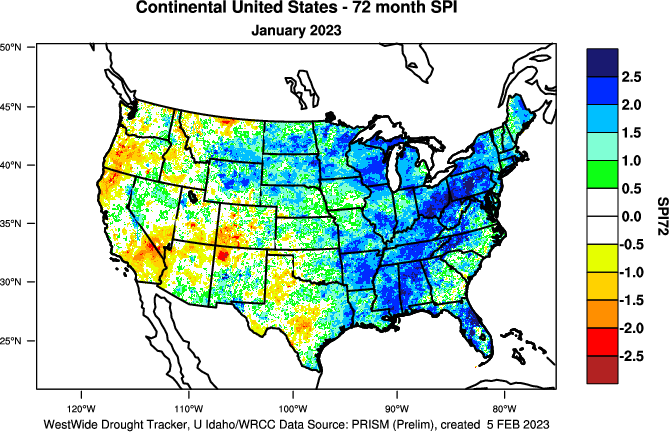
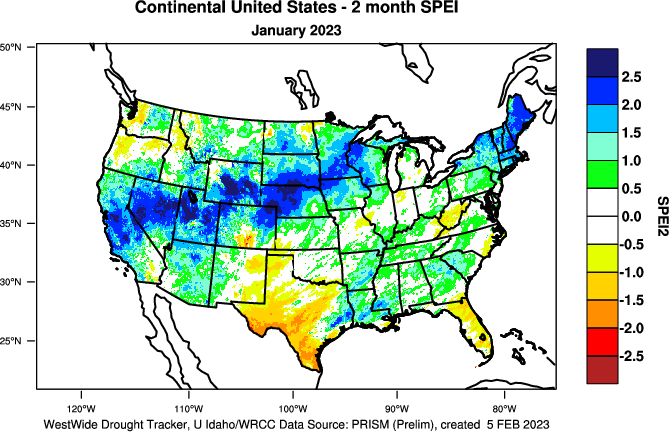
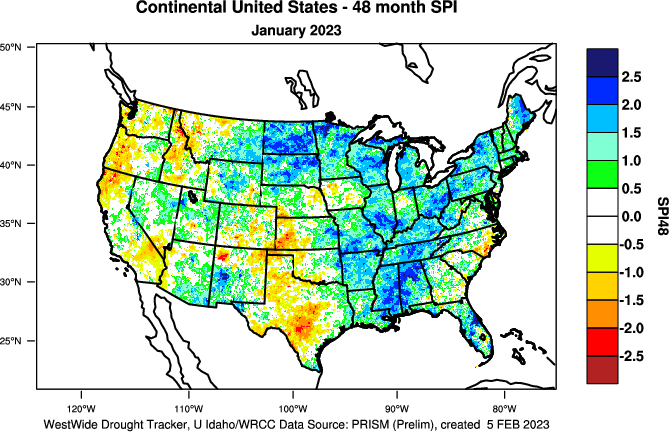
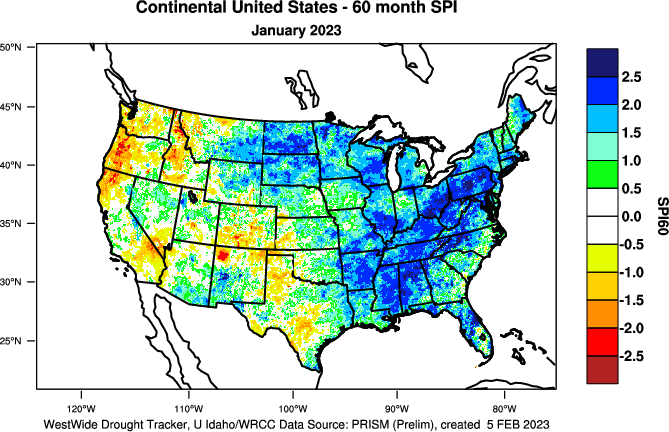
The Standardized Precipitation Index (SPI) measures moisture supply. The SPI maps here show the spatial extent of anomalously wet and dry areas at time scales ranging from 1 month to 24 months.

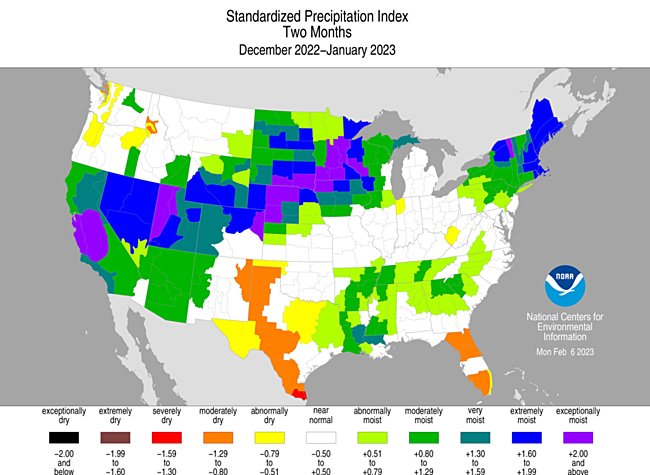
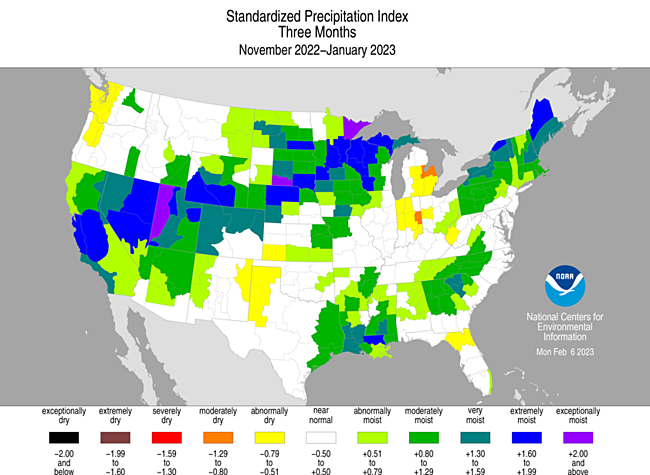

The SPI maps illustrate how moisture conditions have varied considerably through time and space over the last two years. Dryness is evident across much of the Pacific Northwest at the 1- and 24-month time scales and parts of the Pacific Northwest at the intervening time scales. The Florida Peninsula and the Rio Grande Valley are dry at the 1- and 2-month time scales. Parts of the Ohio Valley to southern Great Lakes are dry at 3 to 9 months. Parts of the northern Plains are dry at 1, 6, and 24 months; the central Plains has dryness at the 6- to 24-month time scales; and parts of the southern Plains are dry at 1 to 2 months and 9 to 24 months. California still has dryness in some areas at 24 months. The Mid-Atlantic coast is dry at the 1-month time scale and the southern Atlantic Coast at 6 to 24 months. Much of the Southwest is dry at the 1- to 9-month time scales. The central Plains is wet at 1 month and central Plains to western Great Lakes are wet at 2 to 3 months. The Lower Mississippi Valley and parts to most of the Northeast are wet at all time scales.

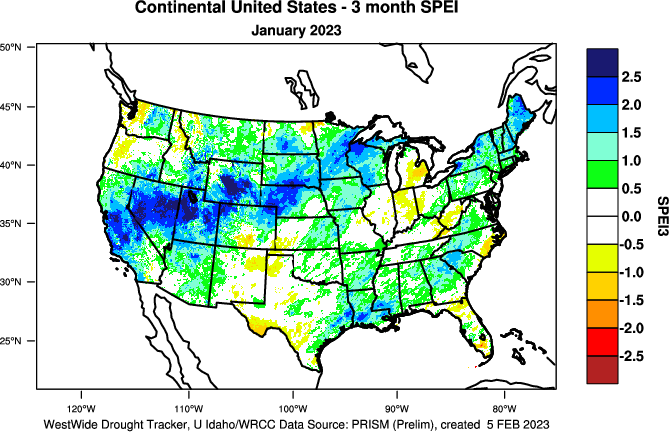
Standardized Precipitation Evapotranspiration Index
The SPI measures water supply (precipitation), while the SPEI (Standardized Precipitation Evapotranspiration Index) measures the combination of water supply (precipitation) and water demand (evapotranspiration as computed from temperature). Warmer temperatures tend to increase evapotranspiration, which generally makes droughts more intense.


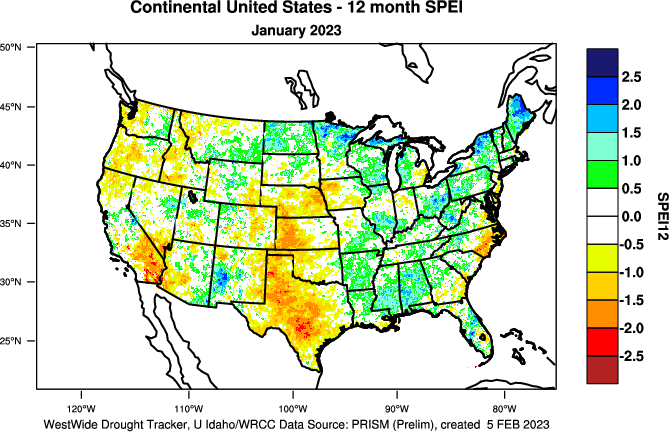
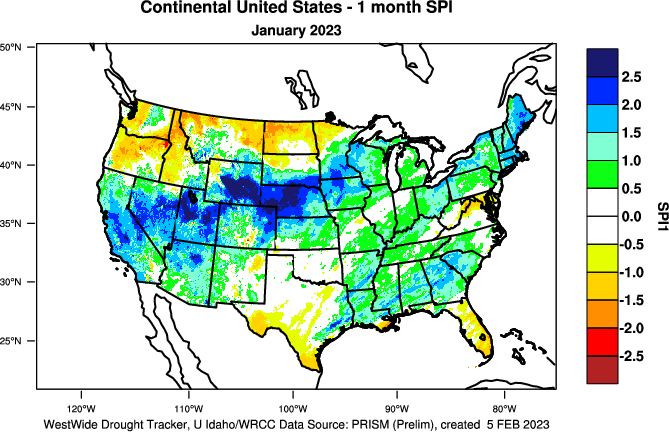

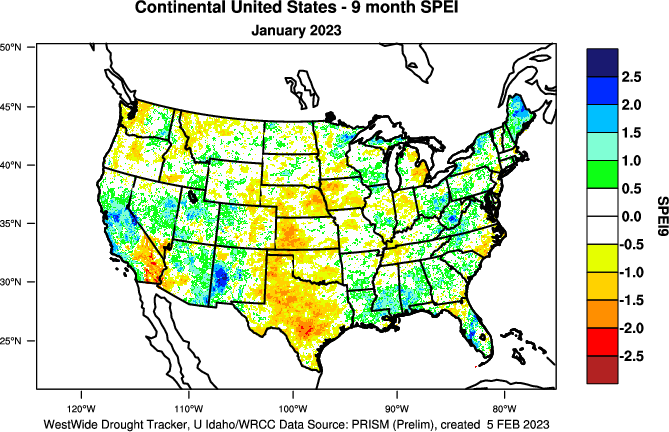
For the Northern Hemisphere, January marks the middle of climatological winter, which is the season when evapotranspiration is minimum. During January 2023, temperatures were much warmer than normal across most of the CONUS east of the Rockies. But much of this area was also wetter than normal. The 1-month SPEI was more more severe than the corresponding SPI in southwest Texas where it was warmer and drier than normal. But the seasonal reduction in evapotranspiration, plus the anomalously wet conditions east of the Rockies and near to below-normal temperatures in the West, resulted in January SPEI values that were of similar magnitude to the corresponding SPI values elsewhere in the CONUS. This was generally the case for the last 1 to 5 months. The SPEI was more extreme than the SPI in the Pacific Northwest at the 6- to 7-month time scales, and in the southern Plains at the 9- to 12-month time scales, where unusual dryness was accompanied by unusual warmth during those time periods (SPEI maps for the last 1, 2, 3, 6, 7, 9, 12 months) (SPI maps for the last 1, 2, 3, 6, 7, 9, 12 months).


The above-normal temperatures and below-normal precipitation dating back to summer 2022 resulted in a 7-month SPEI that ranked in the top 20 most extreme category for Oregon but a 7-month SPI that was barely drier than average.


The last ten to 20 years have been a period of unusually warm temperatures across the West. There have also been periods of extreme dryness westwide during this period. The combination of excessive heat and dryness has resulted in more extreme SPEI values than SPI values for the last six years (SPEI maps for last 12, 24, 30, 36, 48, 60, 72 months) (SPI maps for last 12, 24, 30, 36, 48, 60, 72 months).

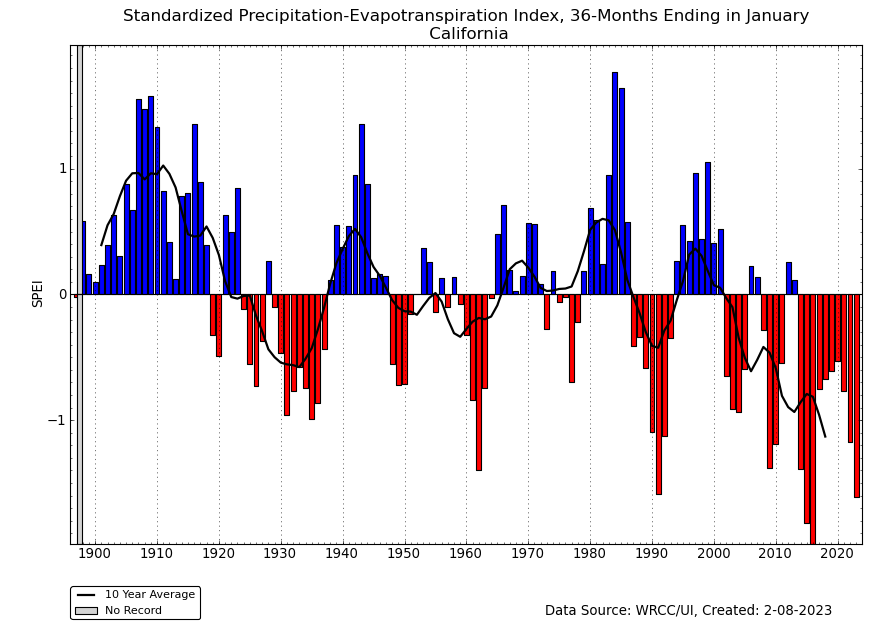
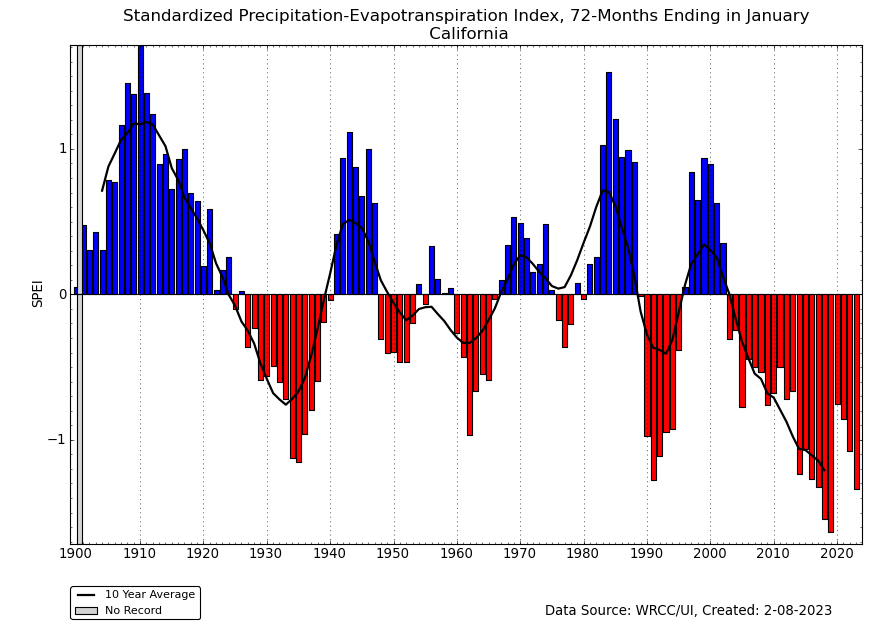
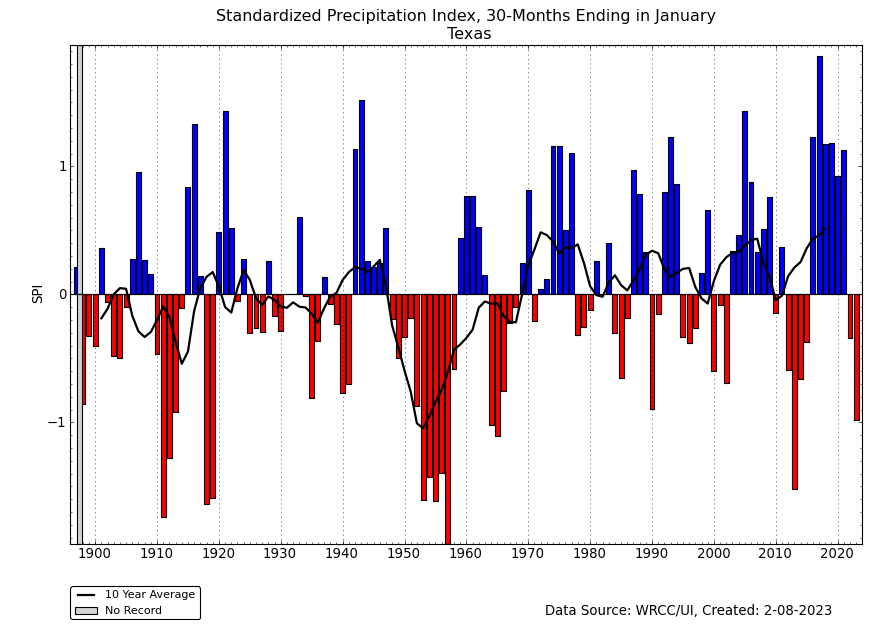


This has especially been the case for Texas and California:
- Texas had a 30-month January SPEI that ranked in the top 10 driest category and that was more extreme than the corresponding SPI that ranked in the top 20 driest category.
- California had the third most extreme 36-month January SPEI in the 1895-2023 record, while the corresponding SPI was only in the top 20 driest category.
- California's 72-month January SPEI was the third driest for this period, while the corresponding SPI was barely on the dry side of the long-term record.
Regional Discussion
Western United States

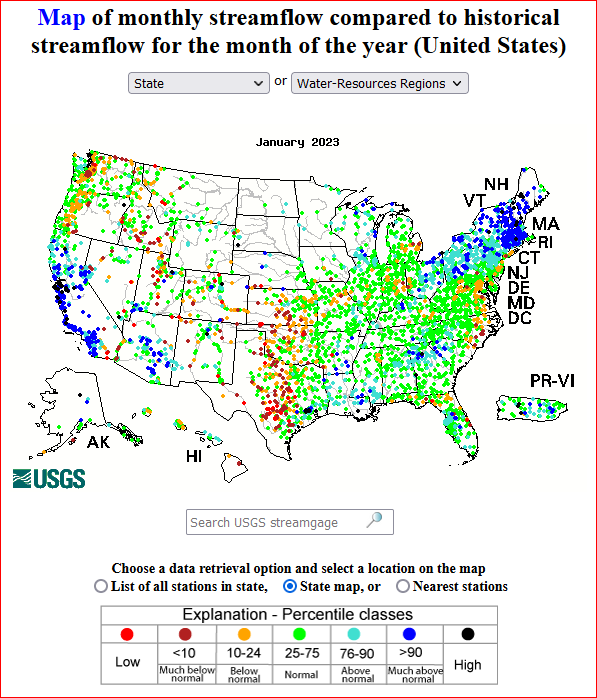
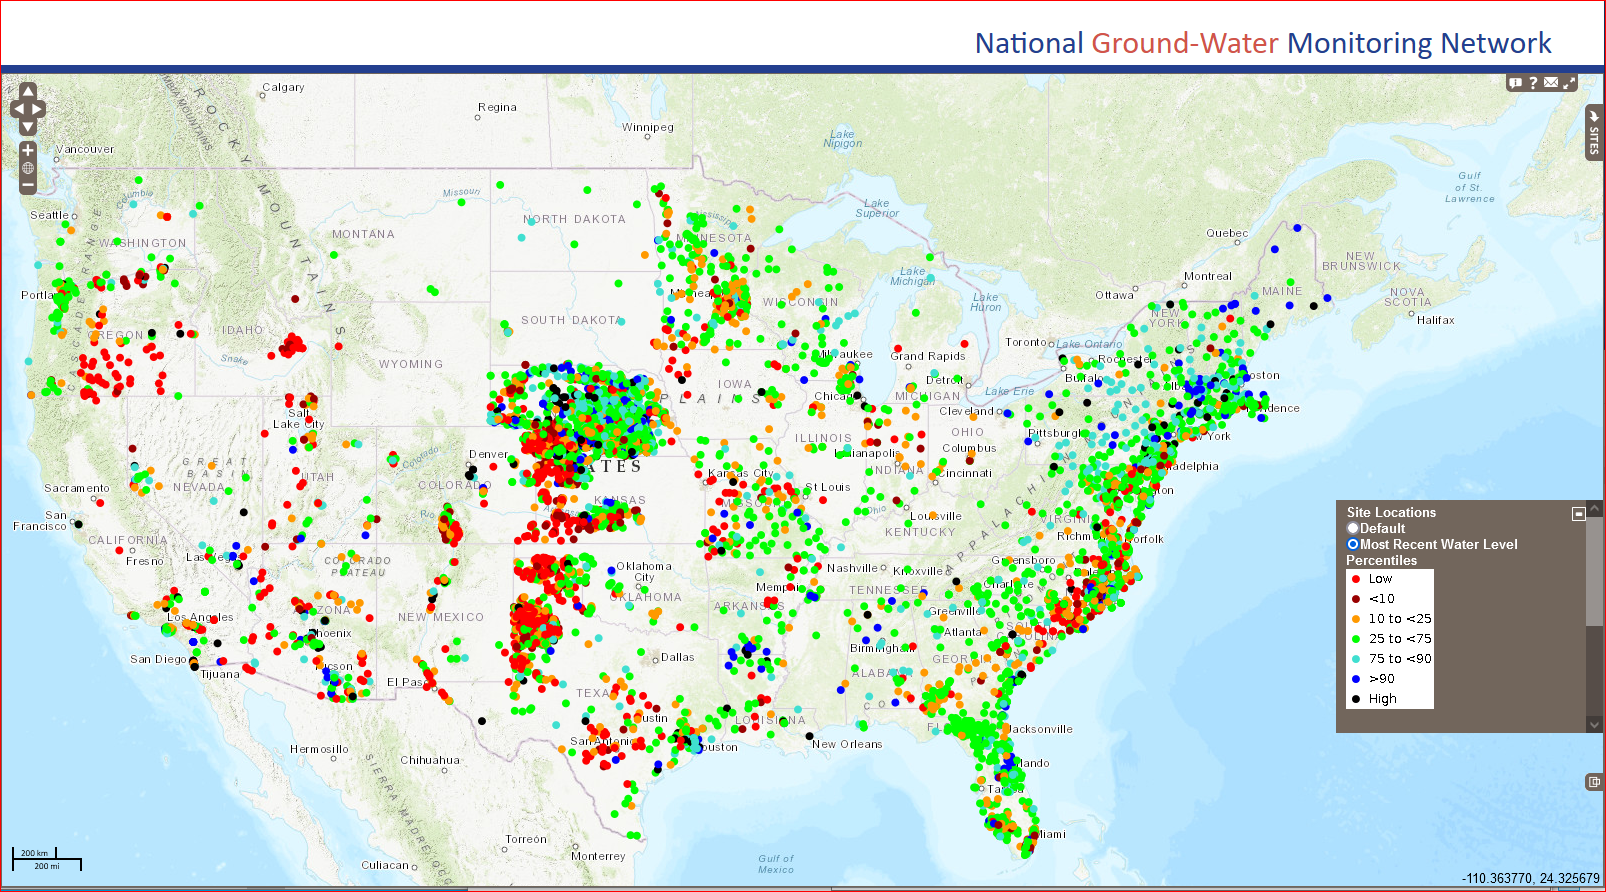

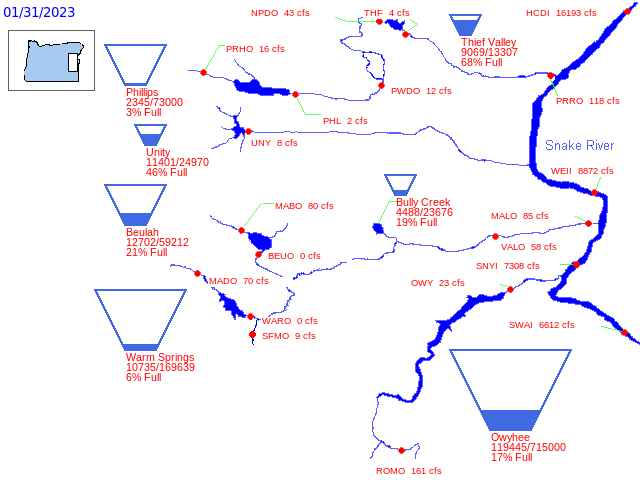
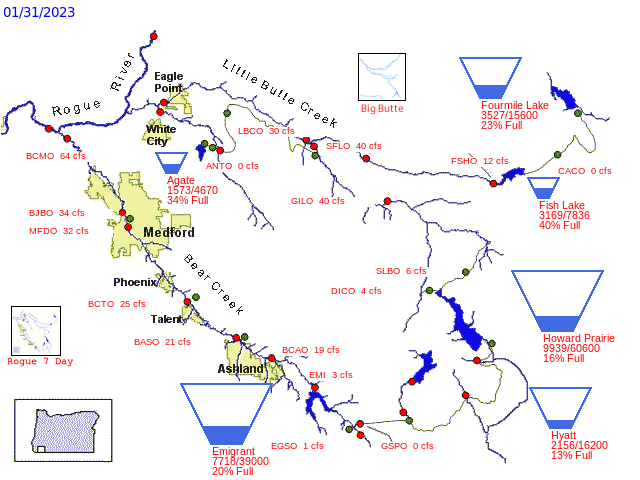
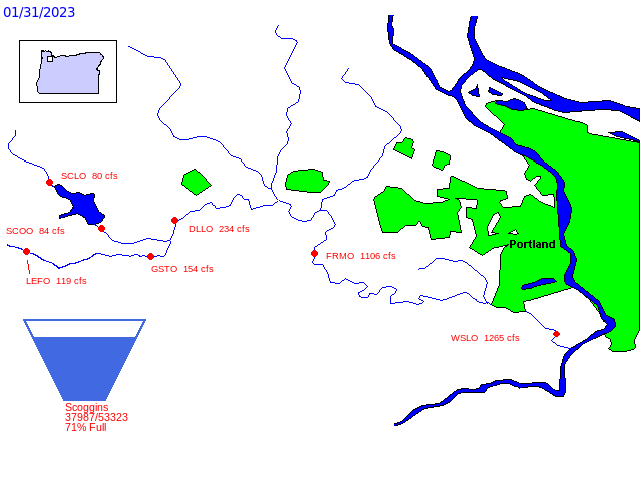
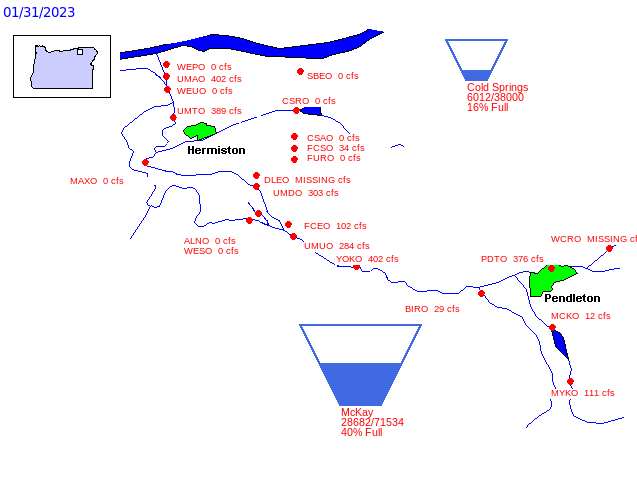
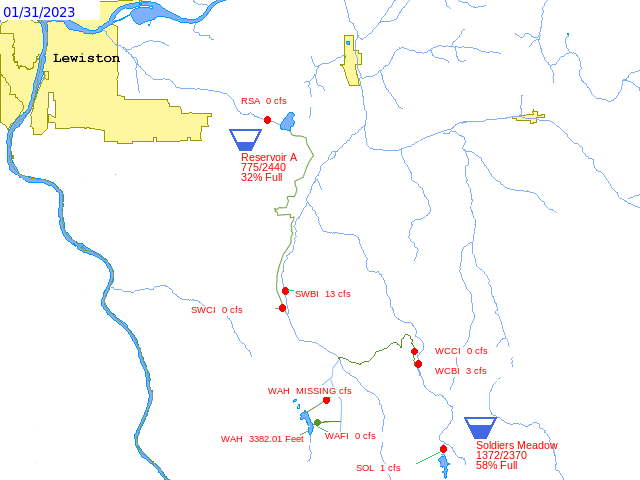
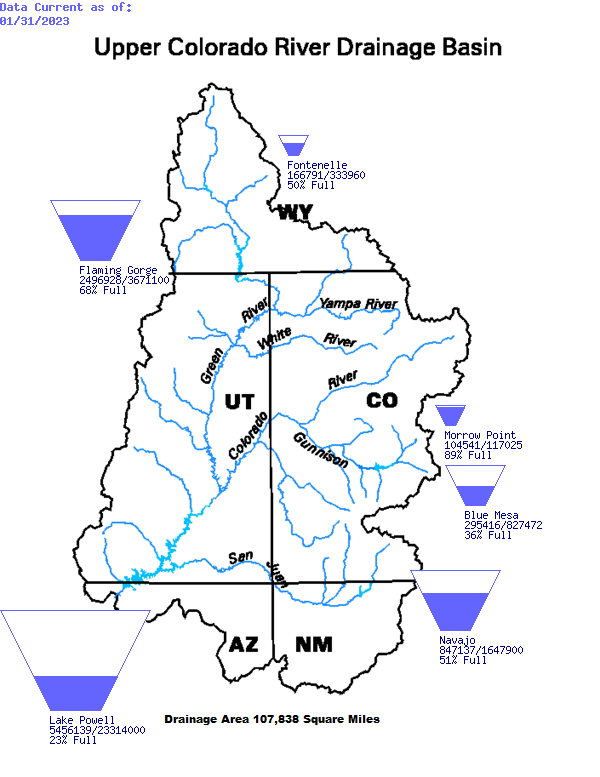
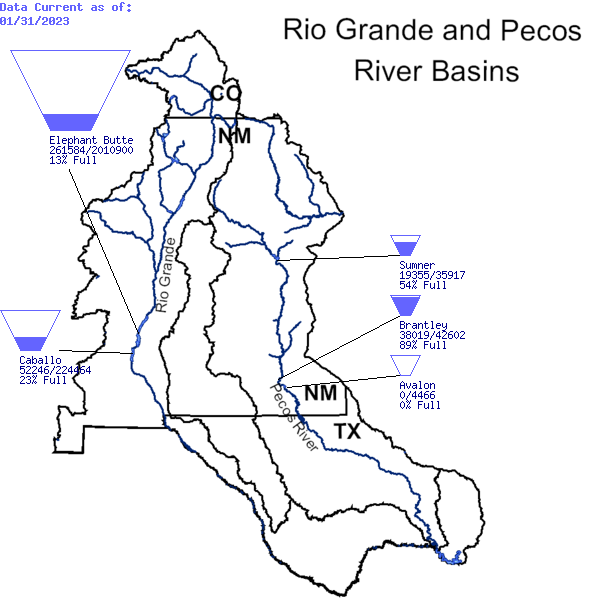
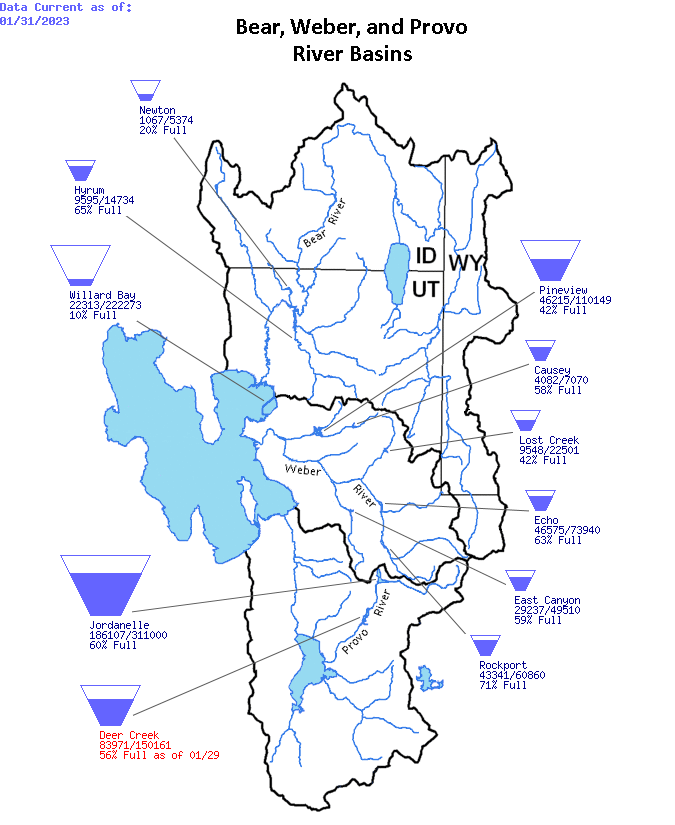
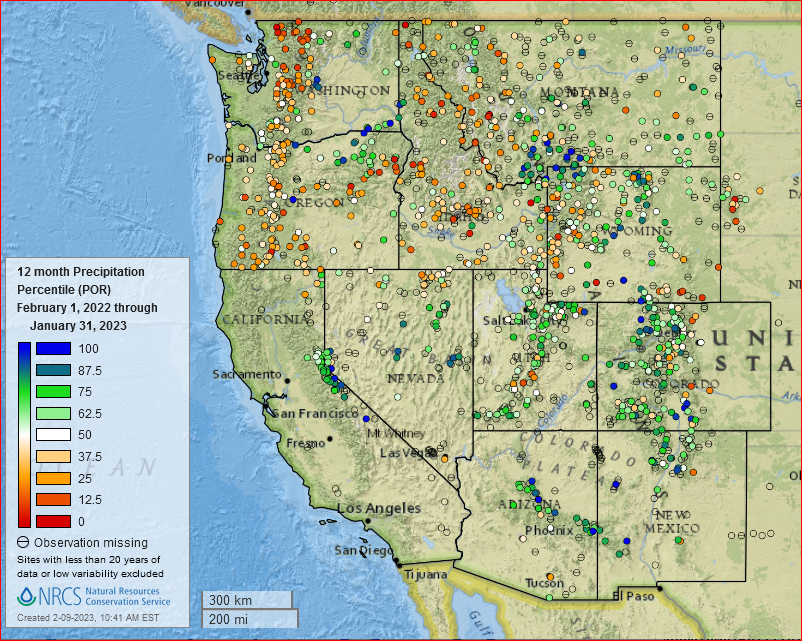
The last three months (January 2023 and November 2022-January 2023) have been wetter than normal for much of the western CONUS. Mountain snowpack has improved significantly, and monthly streamflow (a reasonable estimate of base flow) was well above normal, along the path of the atmospheric rivers. However, snowpack was still below normal at many sites in the Pacific Northwest and streamflow was below normal in parts of the Pacific Northwest and Great Basin. Groundwater and reservoir levels were still below normal across much of the West (reservoir maps for westwide; California; Oregon map 1, 2, 3, 4, 5; Idaho map 1, 2, 3; Southwest map 1, 2, 3, 4, 5). But previous months were extremely dry, so while things were improving in the short term, the precipitation was not enough to make up for long-term deficits — while parts of the West were near average for the last 12 months, much of the West was still drier than average at longer time scales, especially the last 36 months (SNOTEL station precipitation percentile maps for the last 1, 4, 12, 36 months).


Regionwide, the western U.S. (Rockies to West Coast) had the 30th wettest and 64th coolest January in the 1895-2023 record, and 21st wettest and 61st coolest December-January (the period of the atmospheric rivers). The last 12 months, February 2022-January 2023, ranked 61st driest and 18th warmest. But longer periods were much drier: the February-January 24-month period ranked 31st driest and 36-month period ranked fourth driest on record.
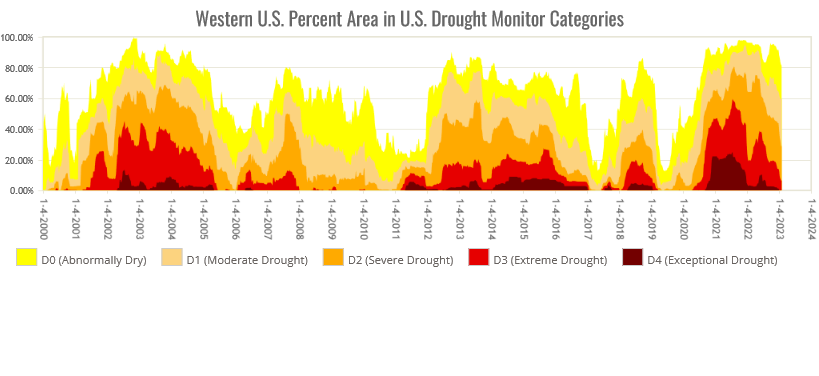


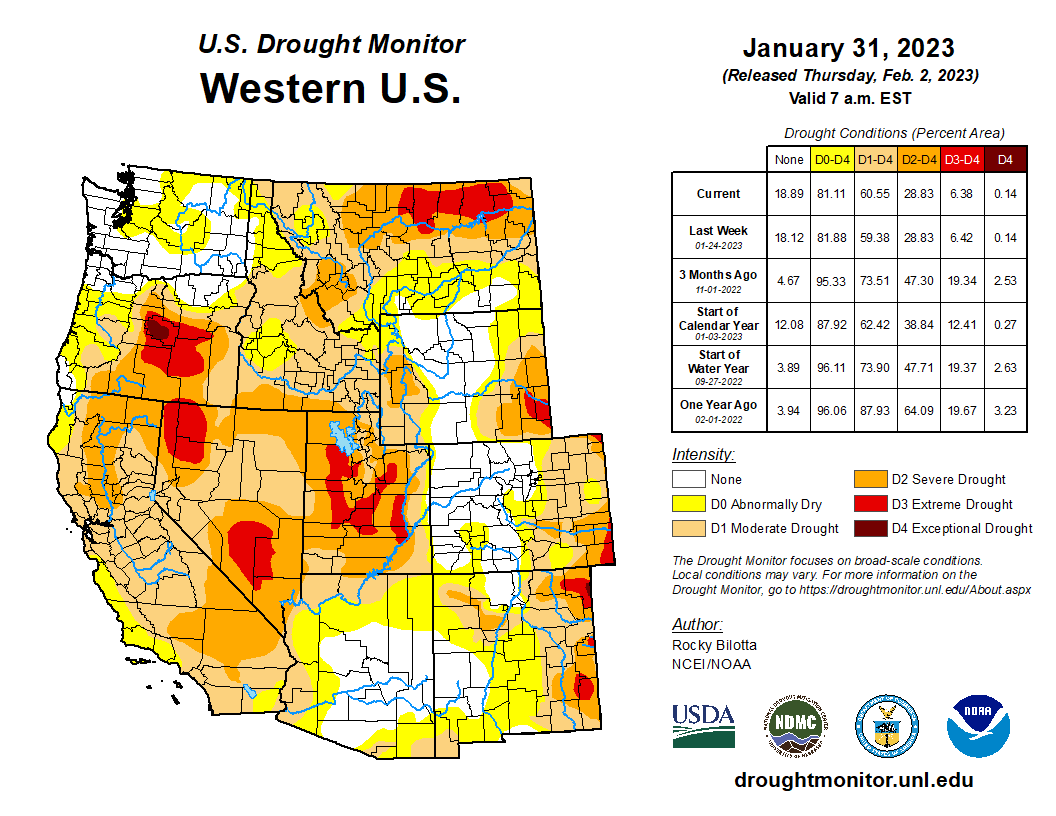
Based on the USDM, the percent area of the western U.S. in moderate to exceptional drought was 60.6% at the end of January. Some part of the western U.S. has been in drought for virtually the entire 23-year history of the USDM. Based on this data, there have been five major expansions of drought during this time period.
Based on the Palmer Drought Index, about 14.5% of the western U.S. was experiencing moderate to extreme drought at the end of January. This is a slight increase compared to the end of December, is based on the Palmer Drought Severity Index (PDSI), and reflects the change in atmospheric conditions from a dry circulation pattern to a wet circulation pattern. The PDSI is a meteorological drought index. The Palmer Hydrological Drought Index (PHDI) is a hydrological drought index that reflects hydrological conditions instead of changes in atmospheric circulation. The PHDI shows a little more drought remaining across the West than does the PDSI. Like the USDM, the Palmer Drought Index shows that much of the West has been in drought for the last 23 years and that the drought has had roughly five major expansions during this time period. Since the Palmer data go back to the beginning of the 20th century, they also show that the last two decades have had a greater spatial extent of persistent drought in the West than any other decades in the last 120 years.
Great Plains


The central to northern Great Plains have received above-normal precipitation during the last 1 to 3 months. Previous months have been quite dry. Regionwide, the Great Plains had the 29th wettest December-January, 40th wettest November-January, 17th driest February-January 12-month period, 17th driest February-January 24-month period, and 13th driest February-January 36-month period.
Hawaii
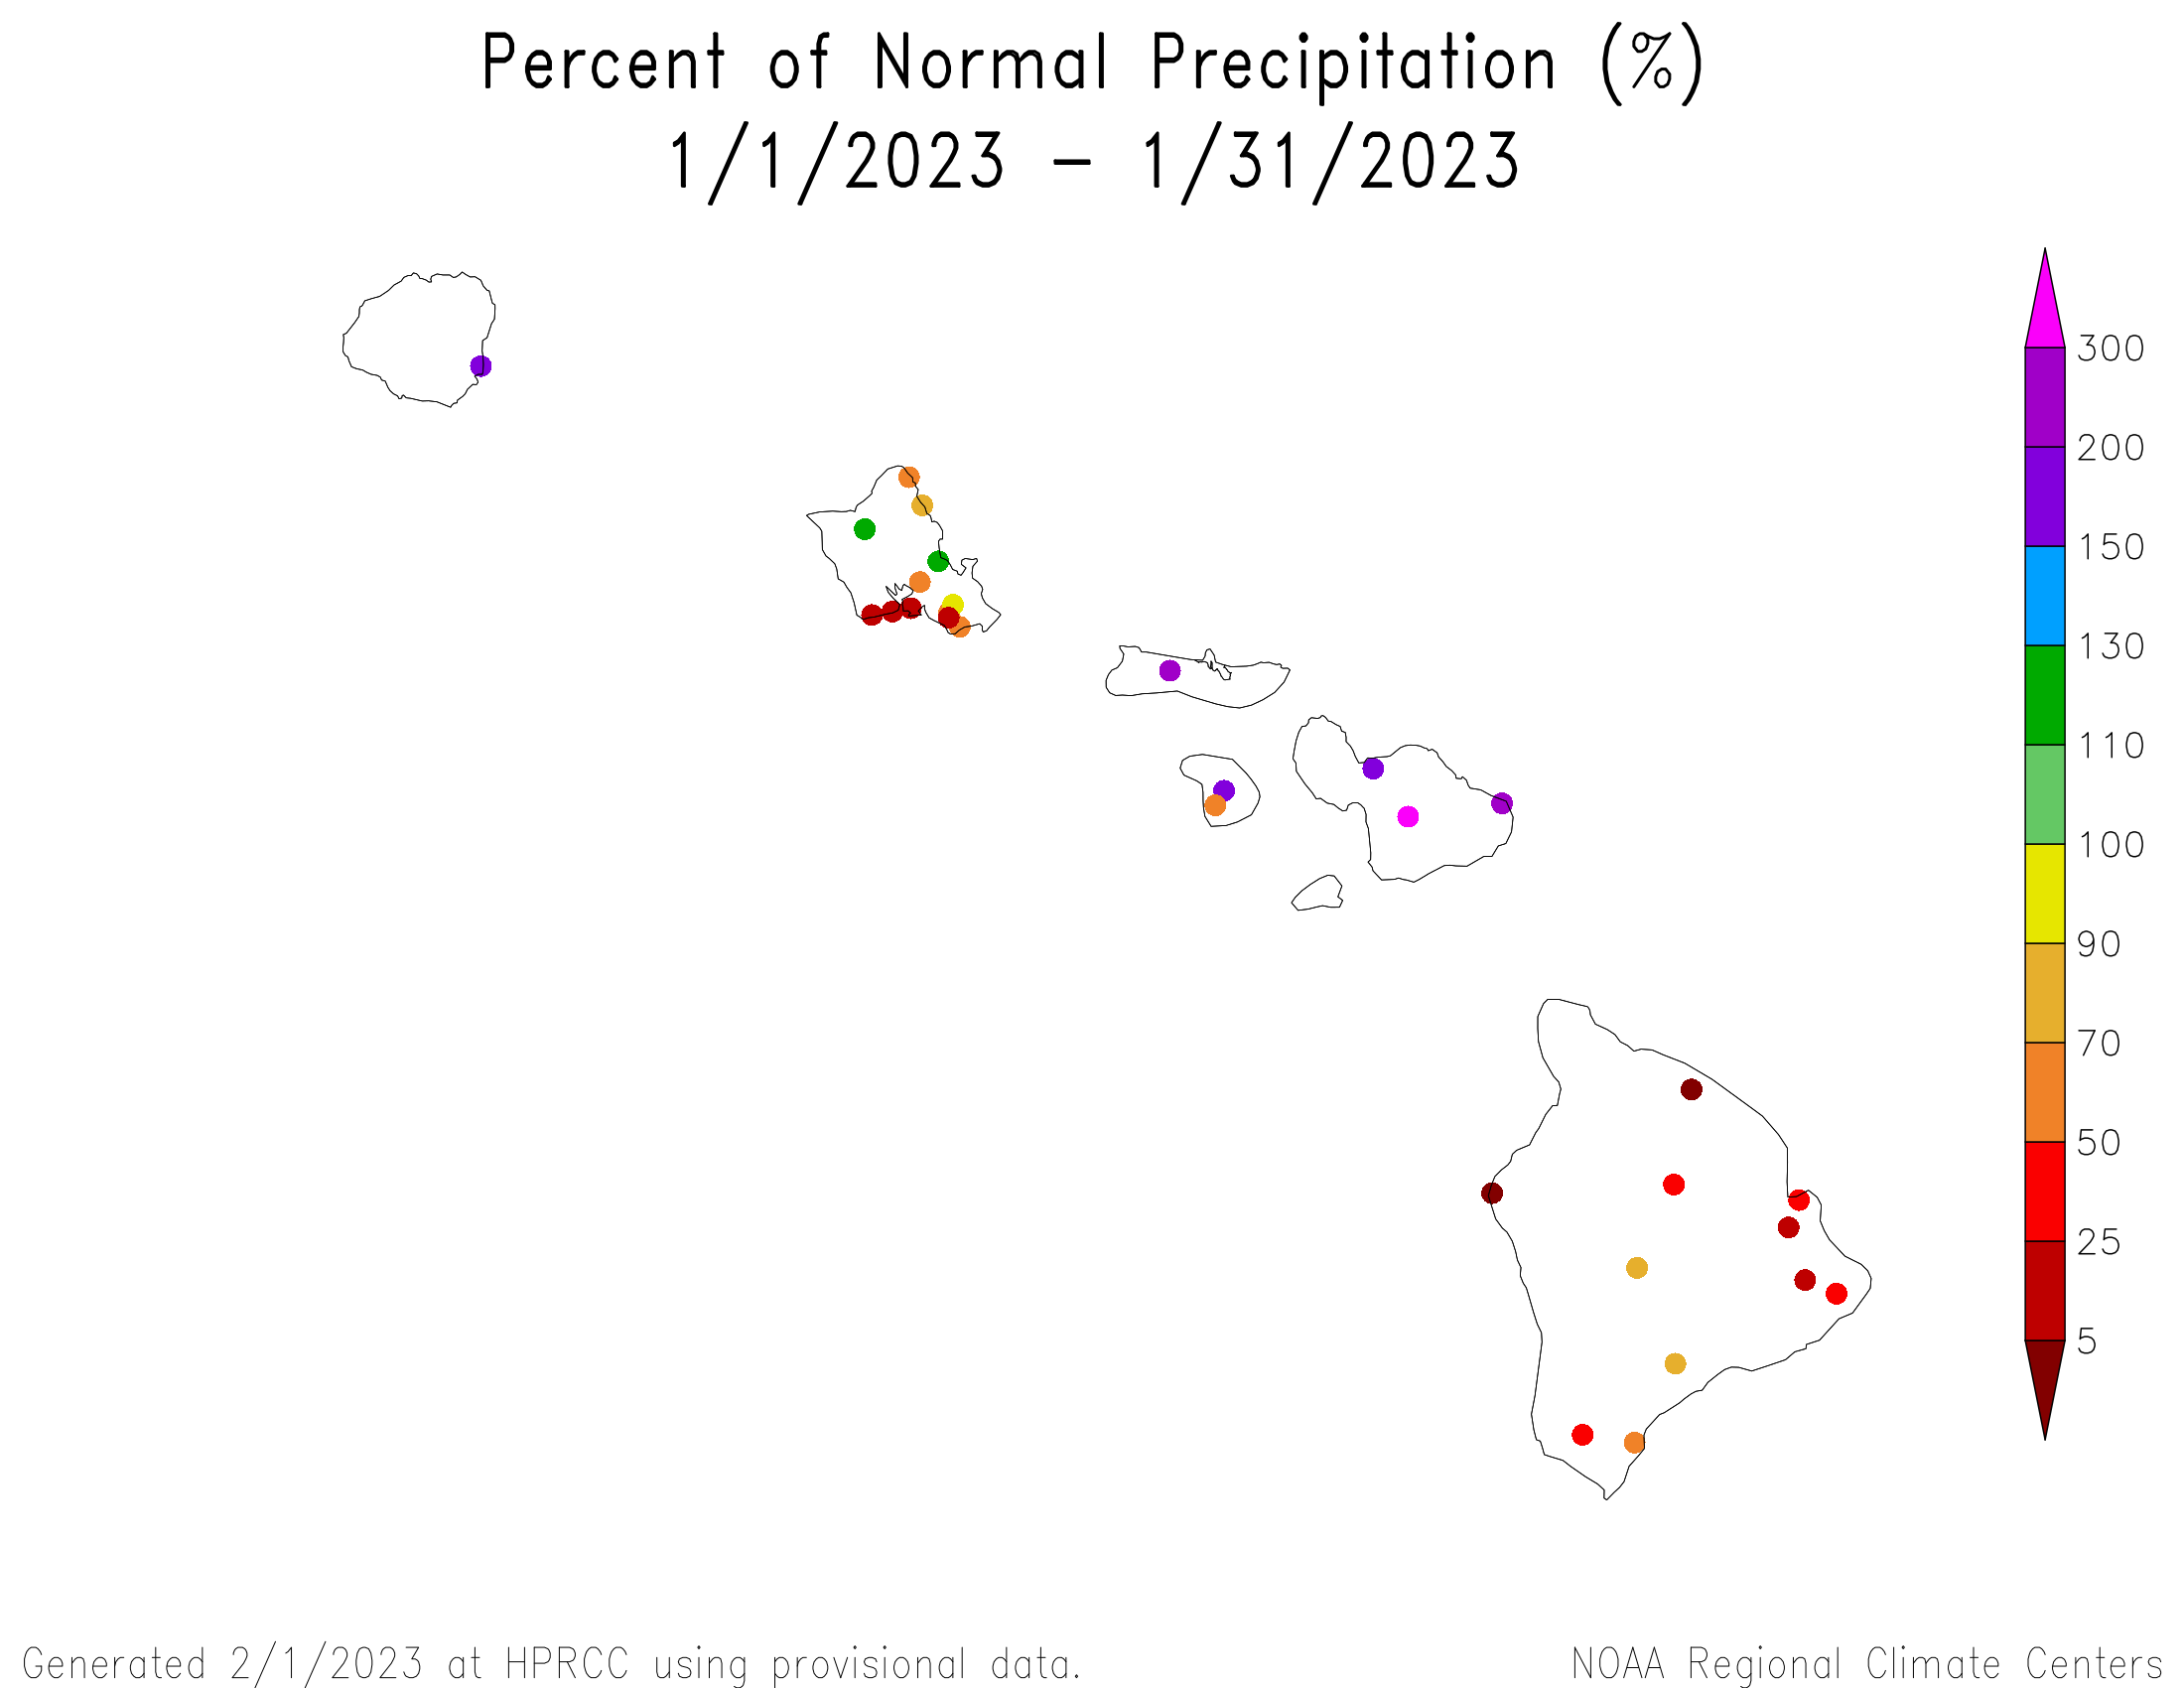

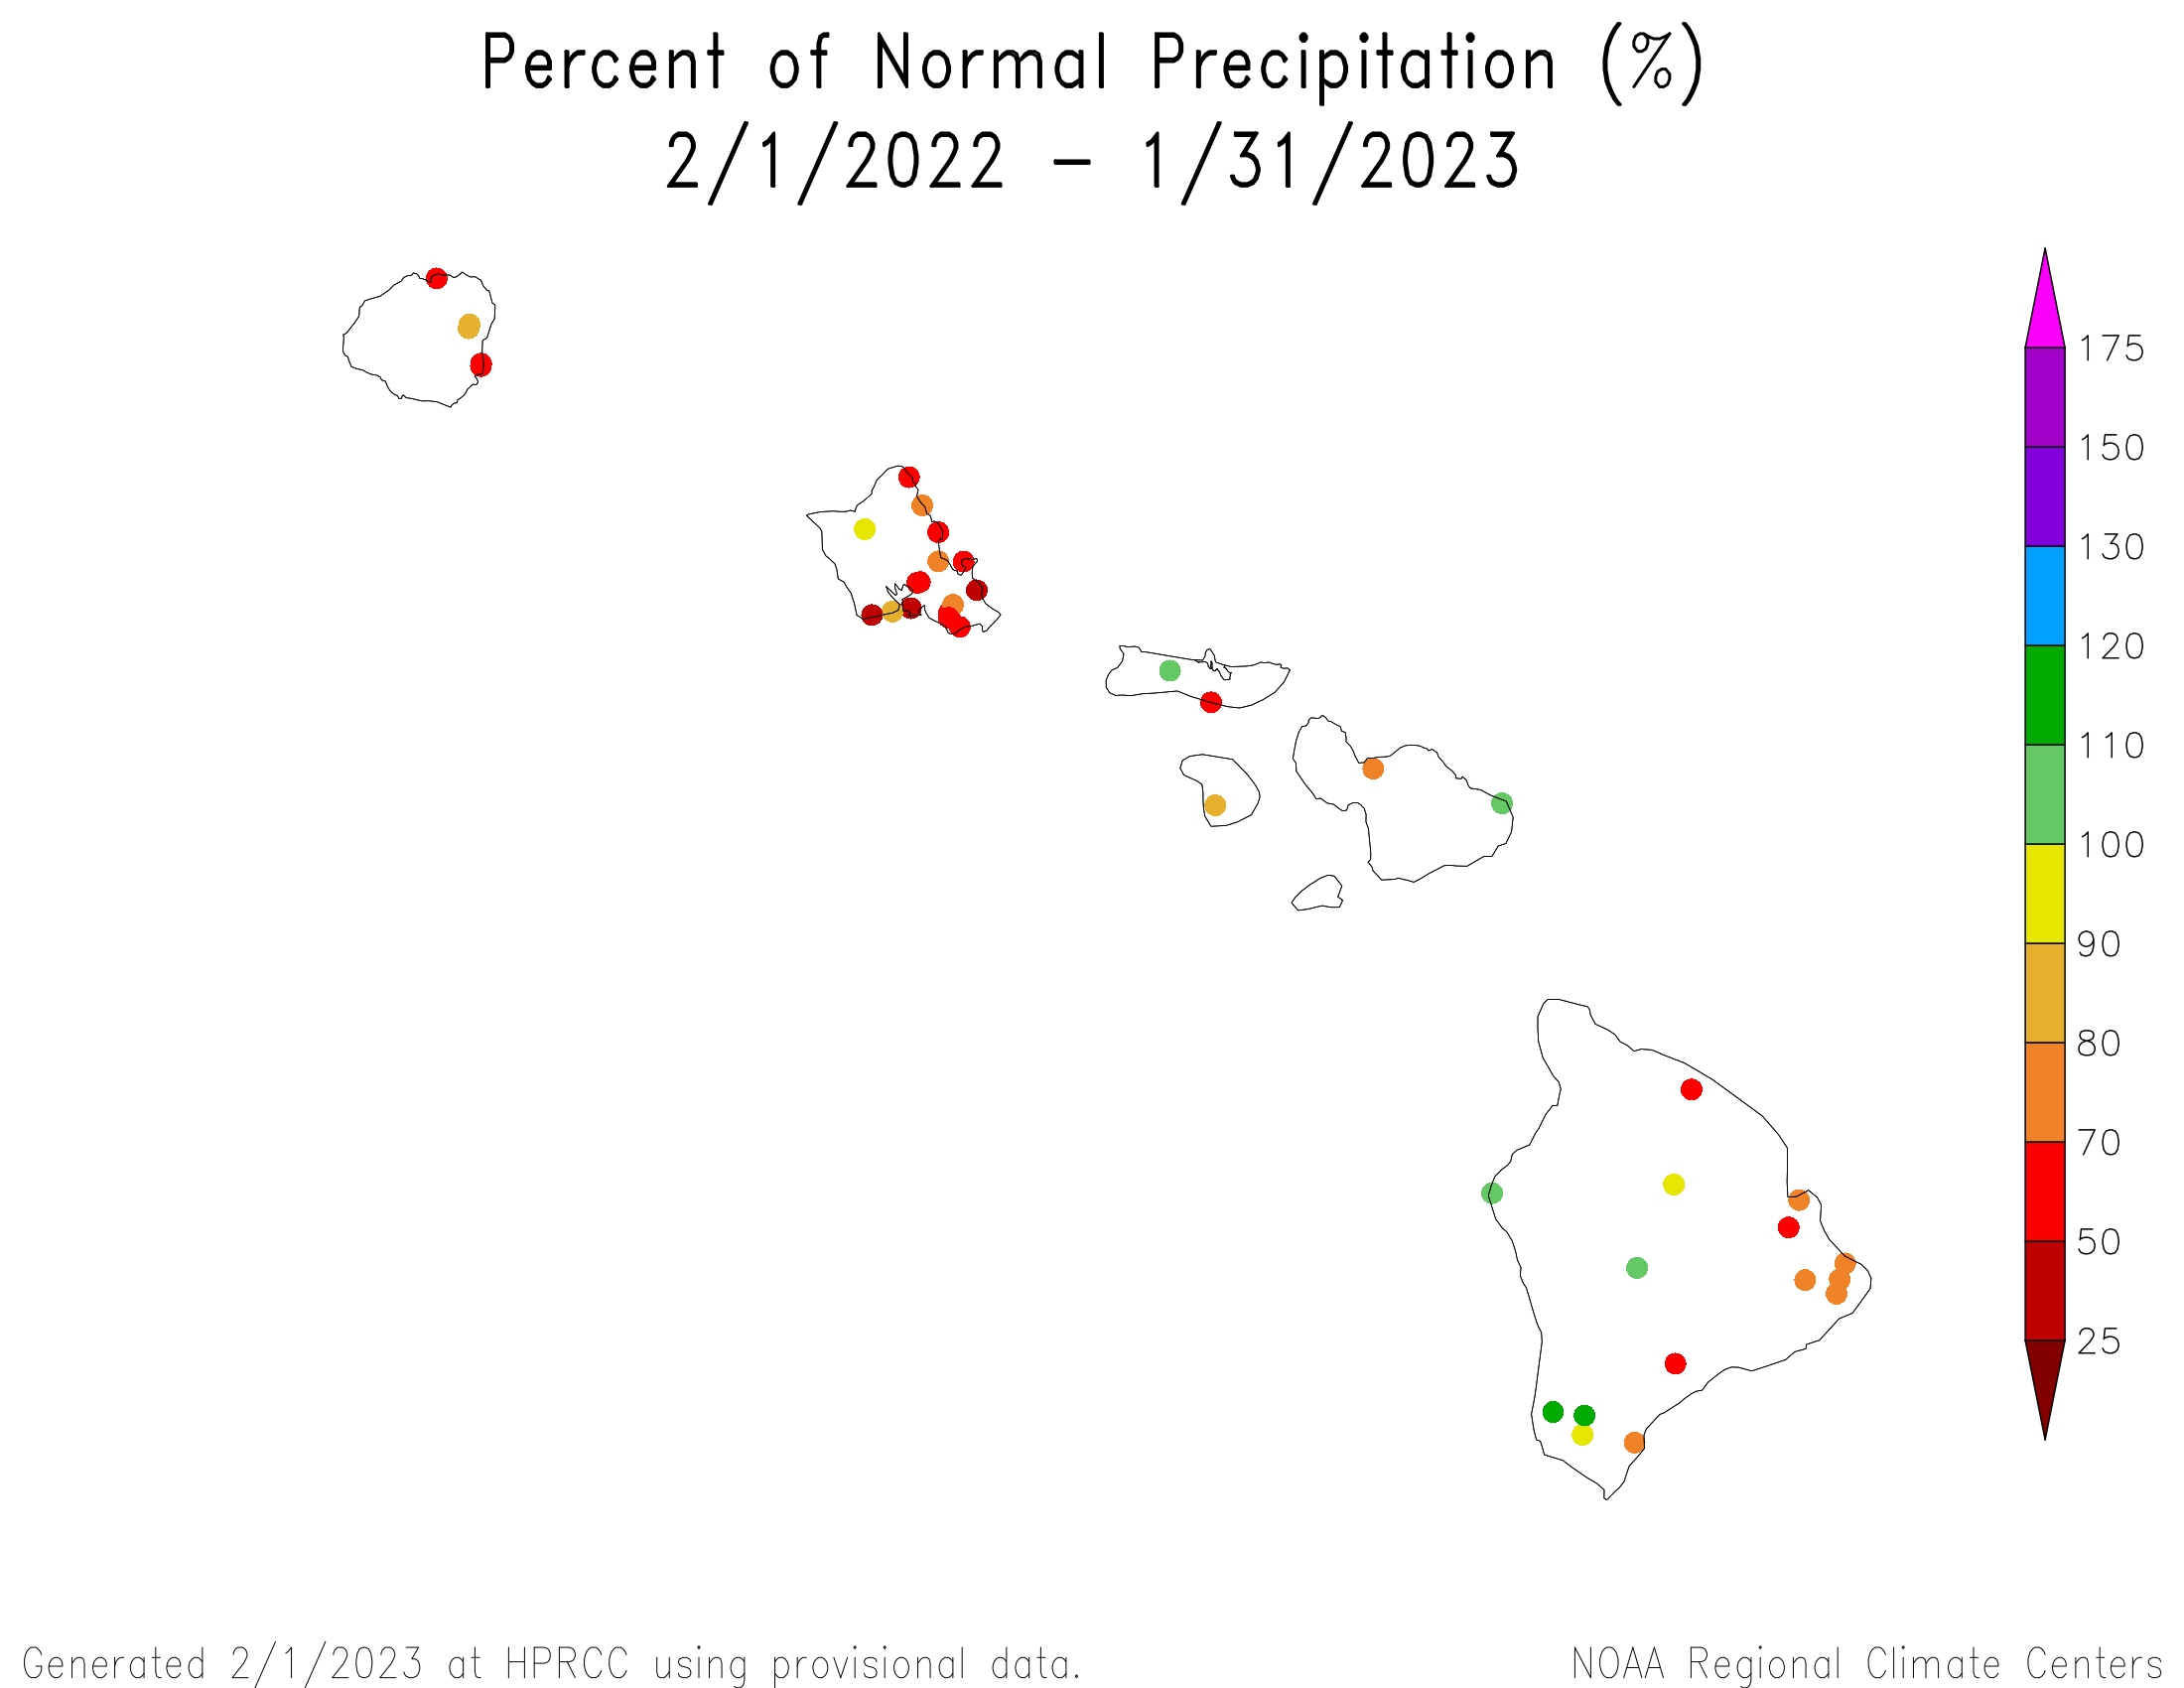
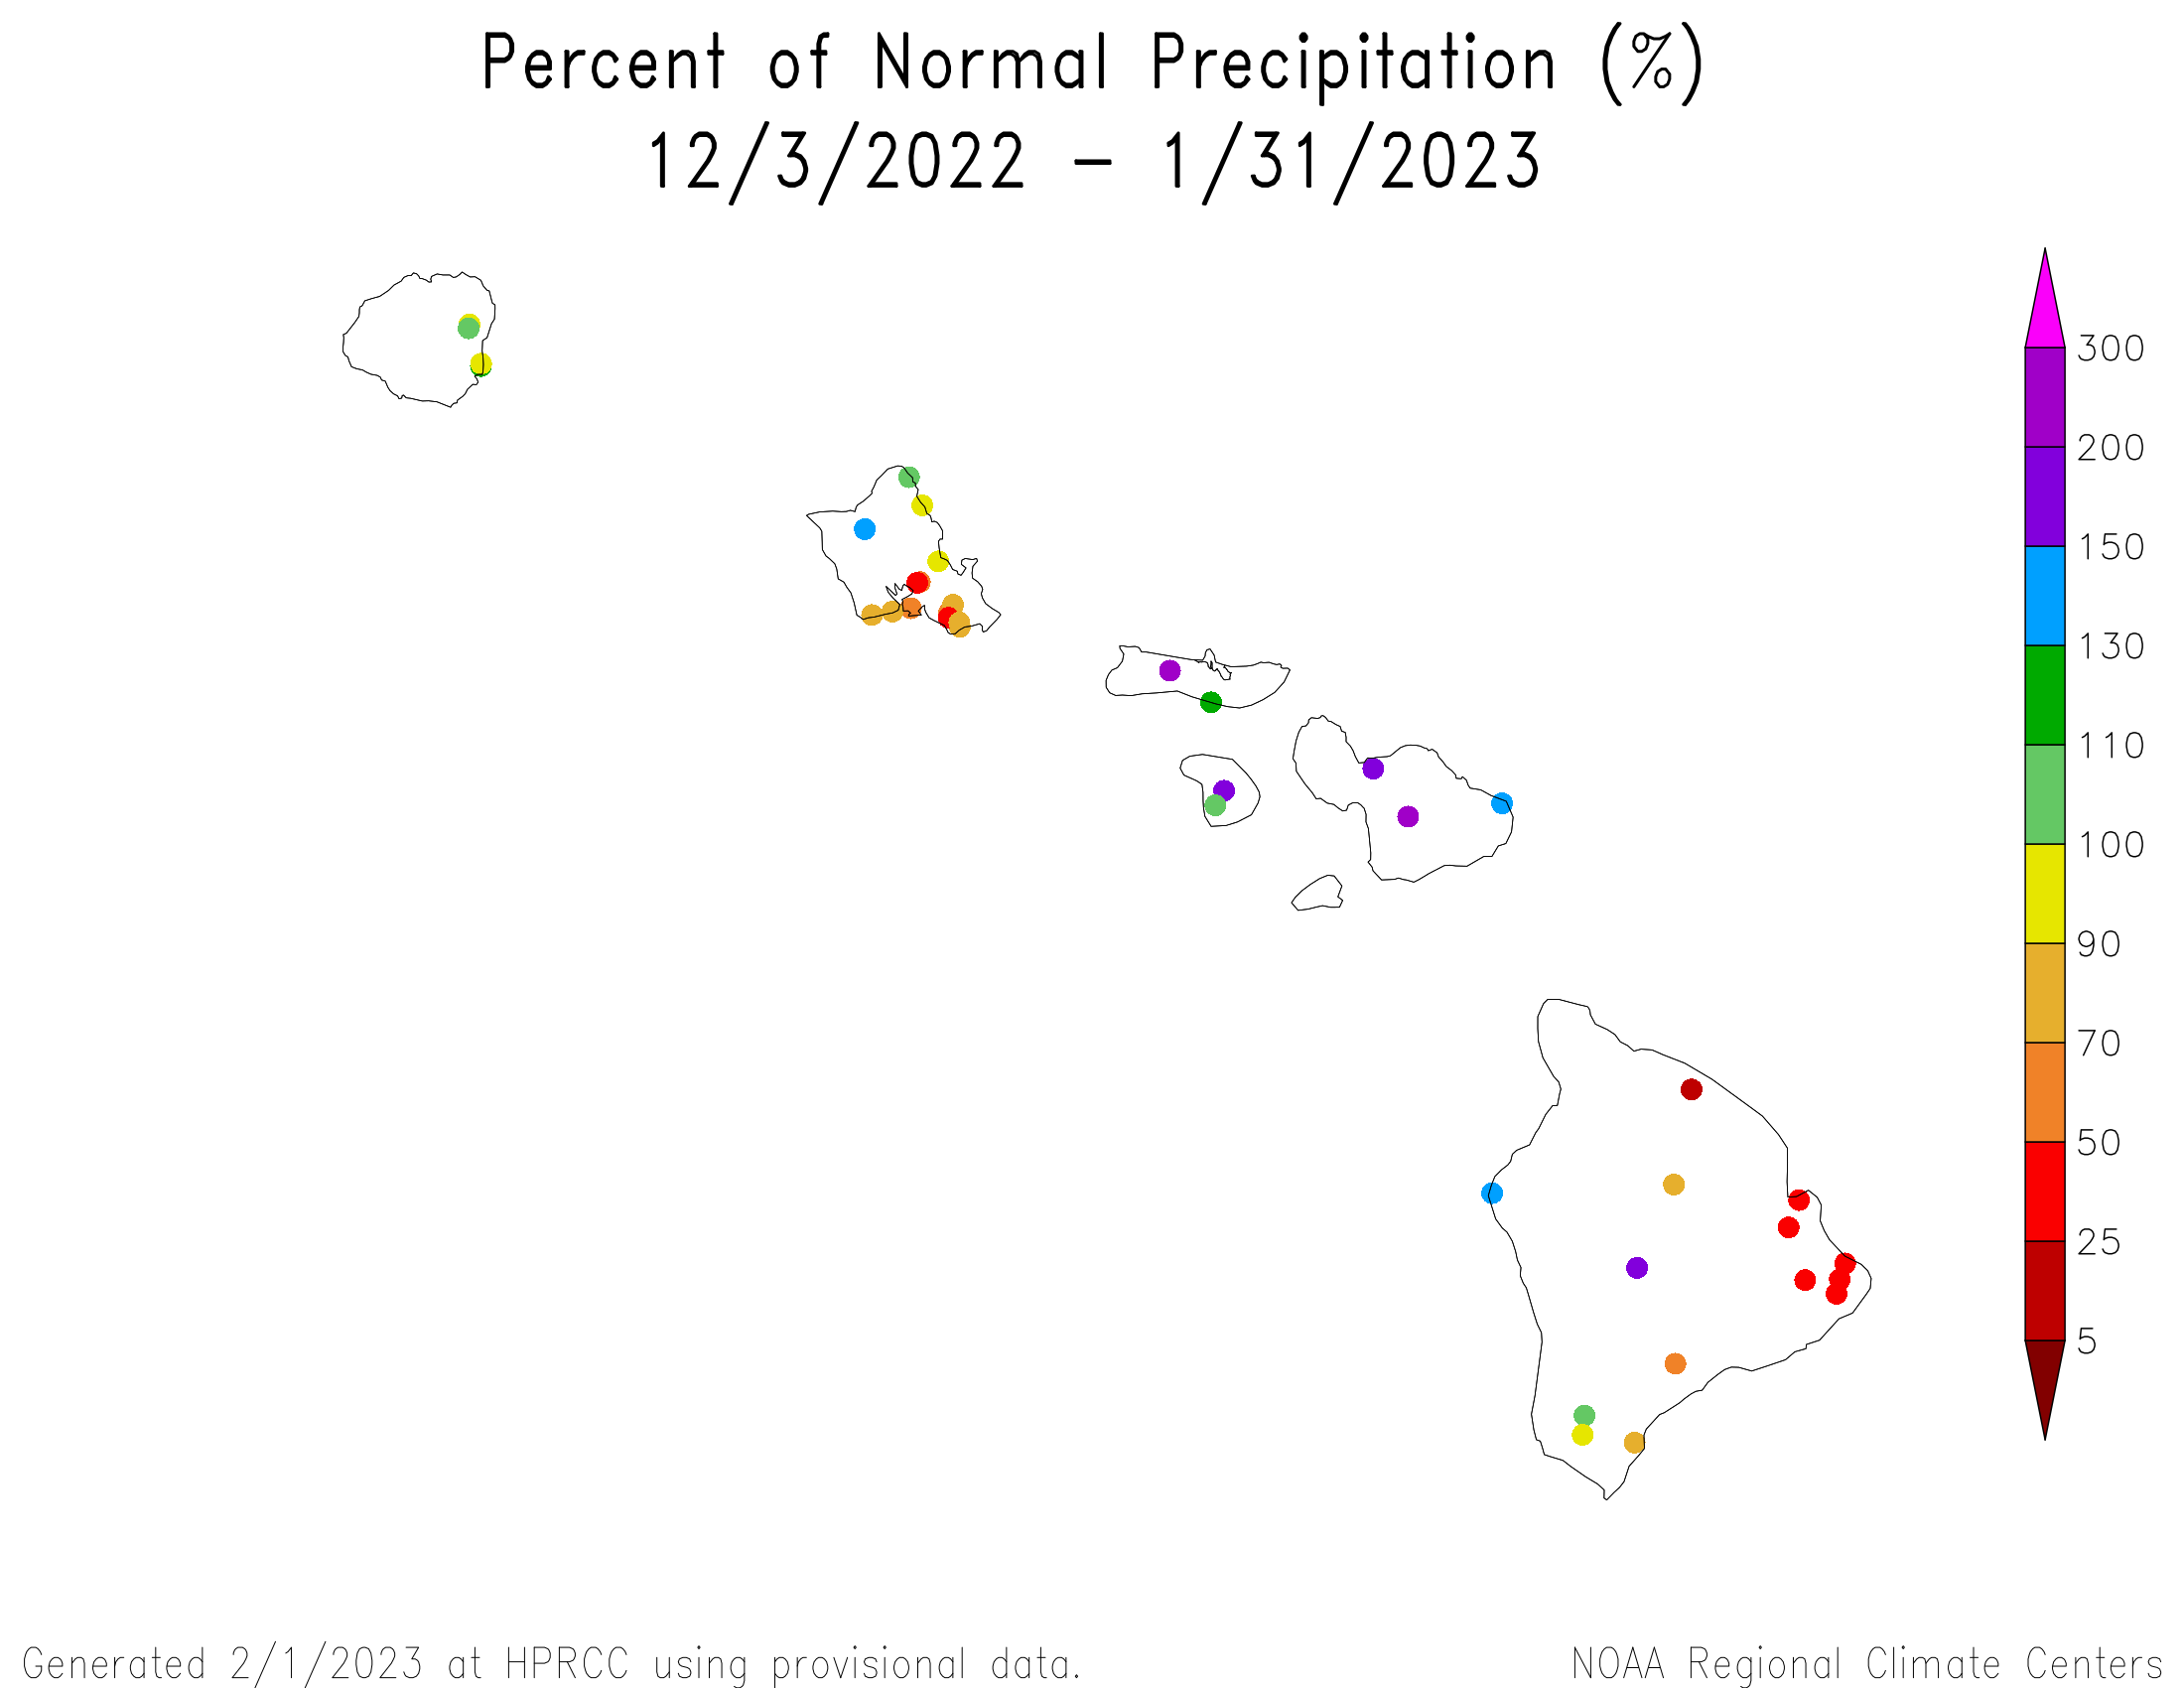
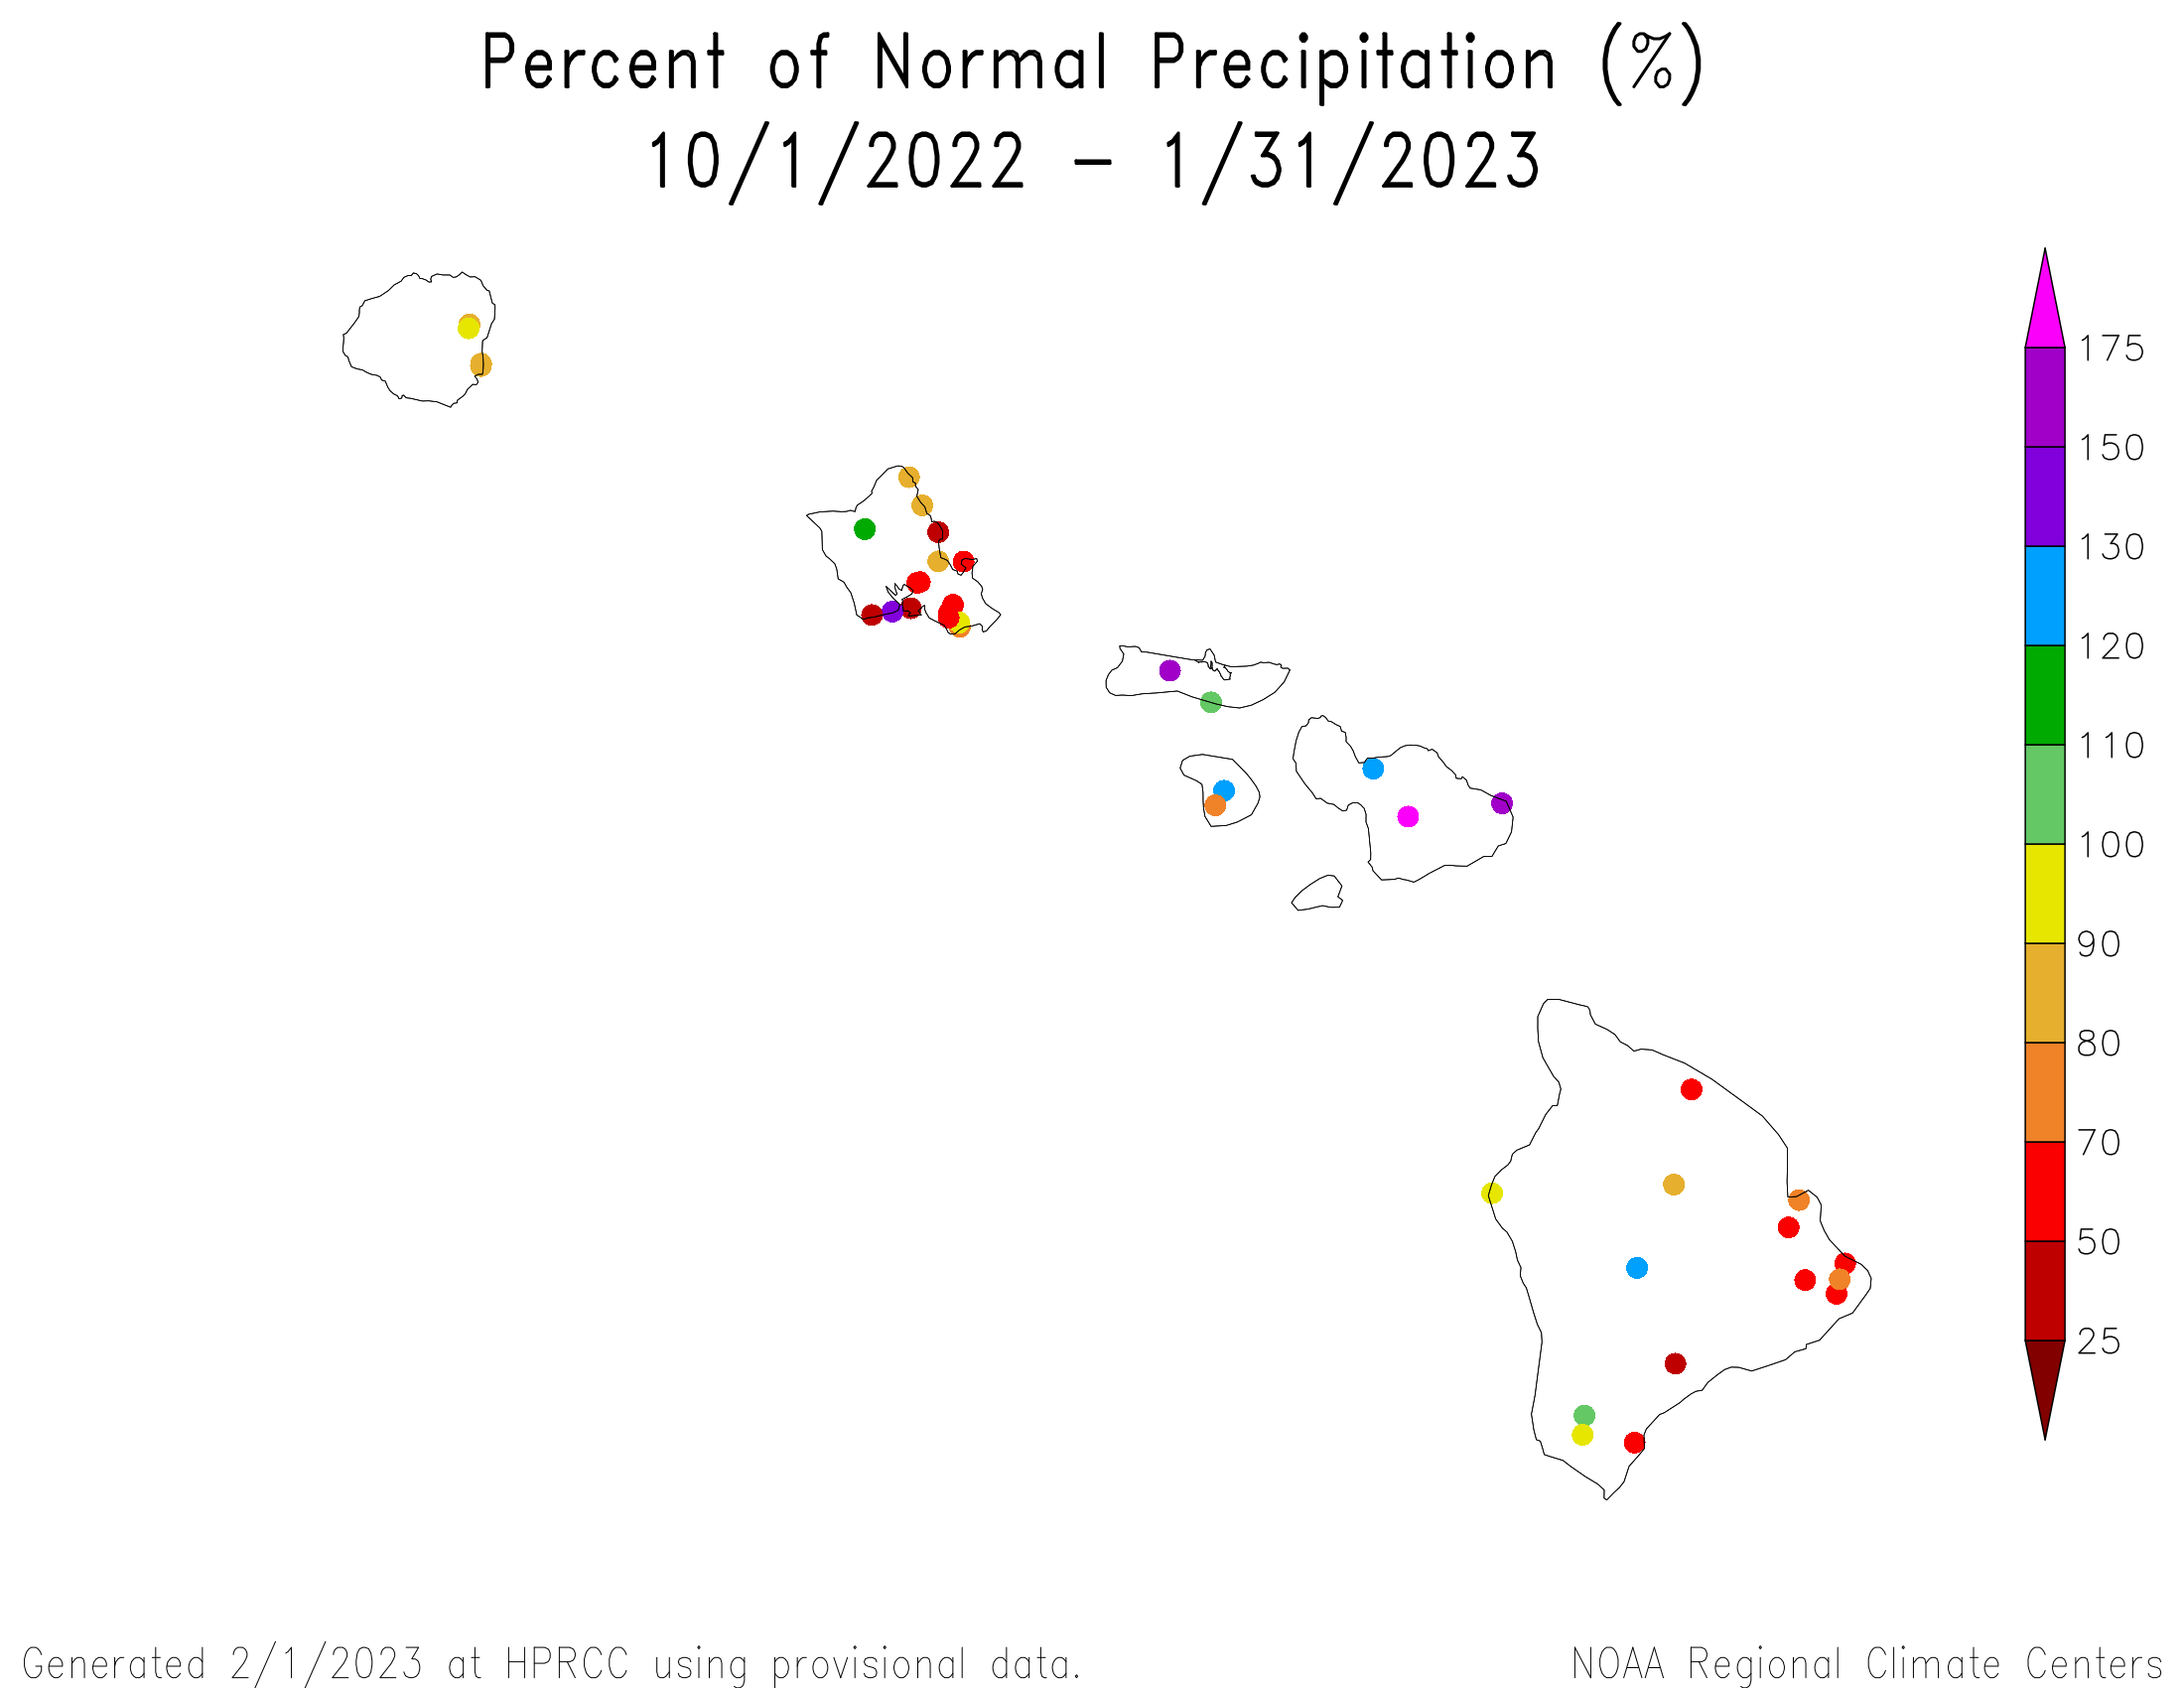
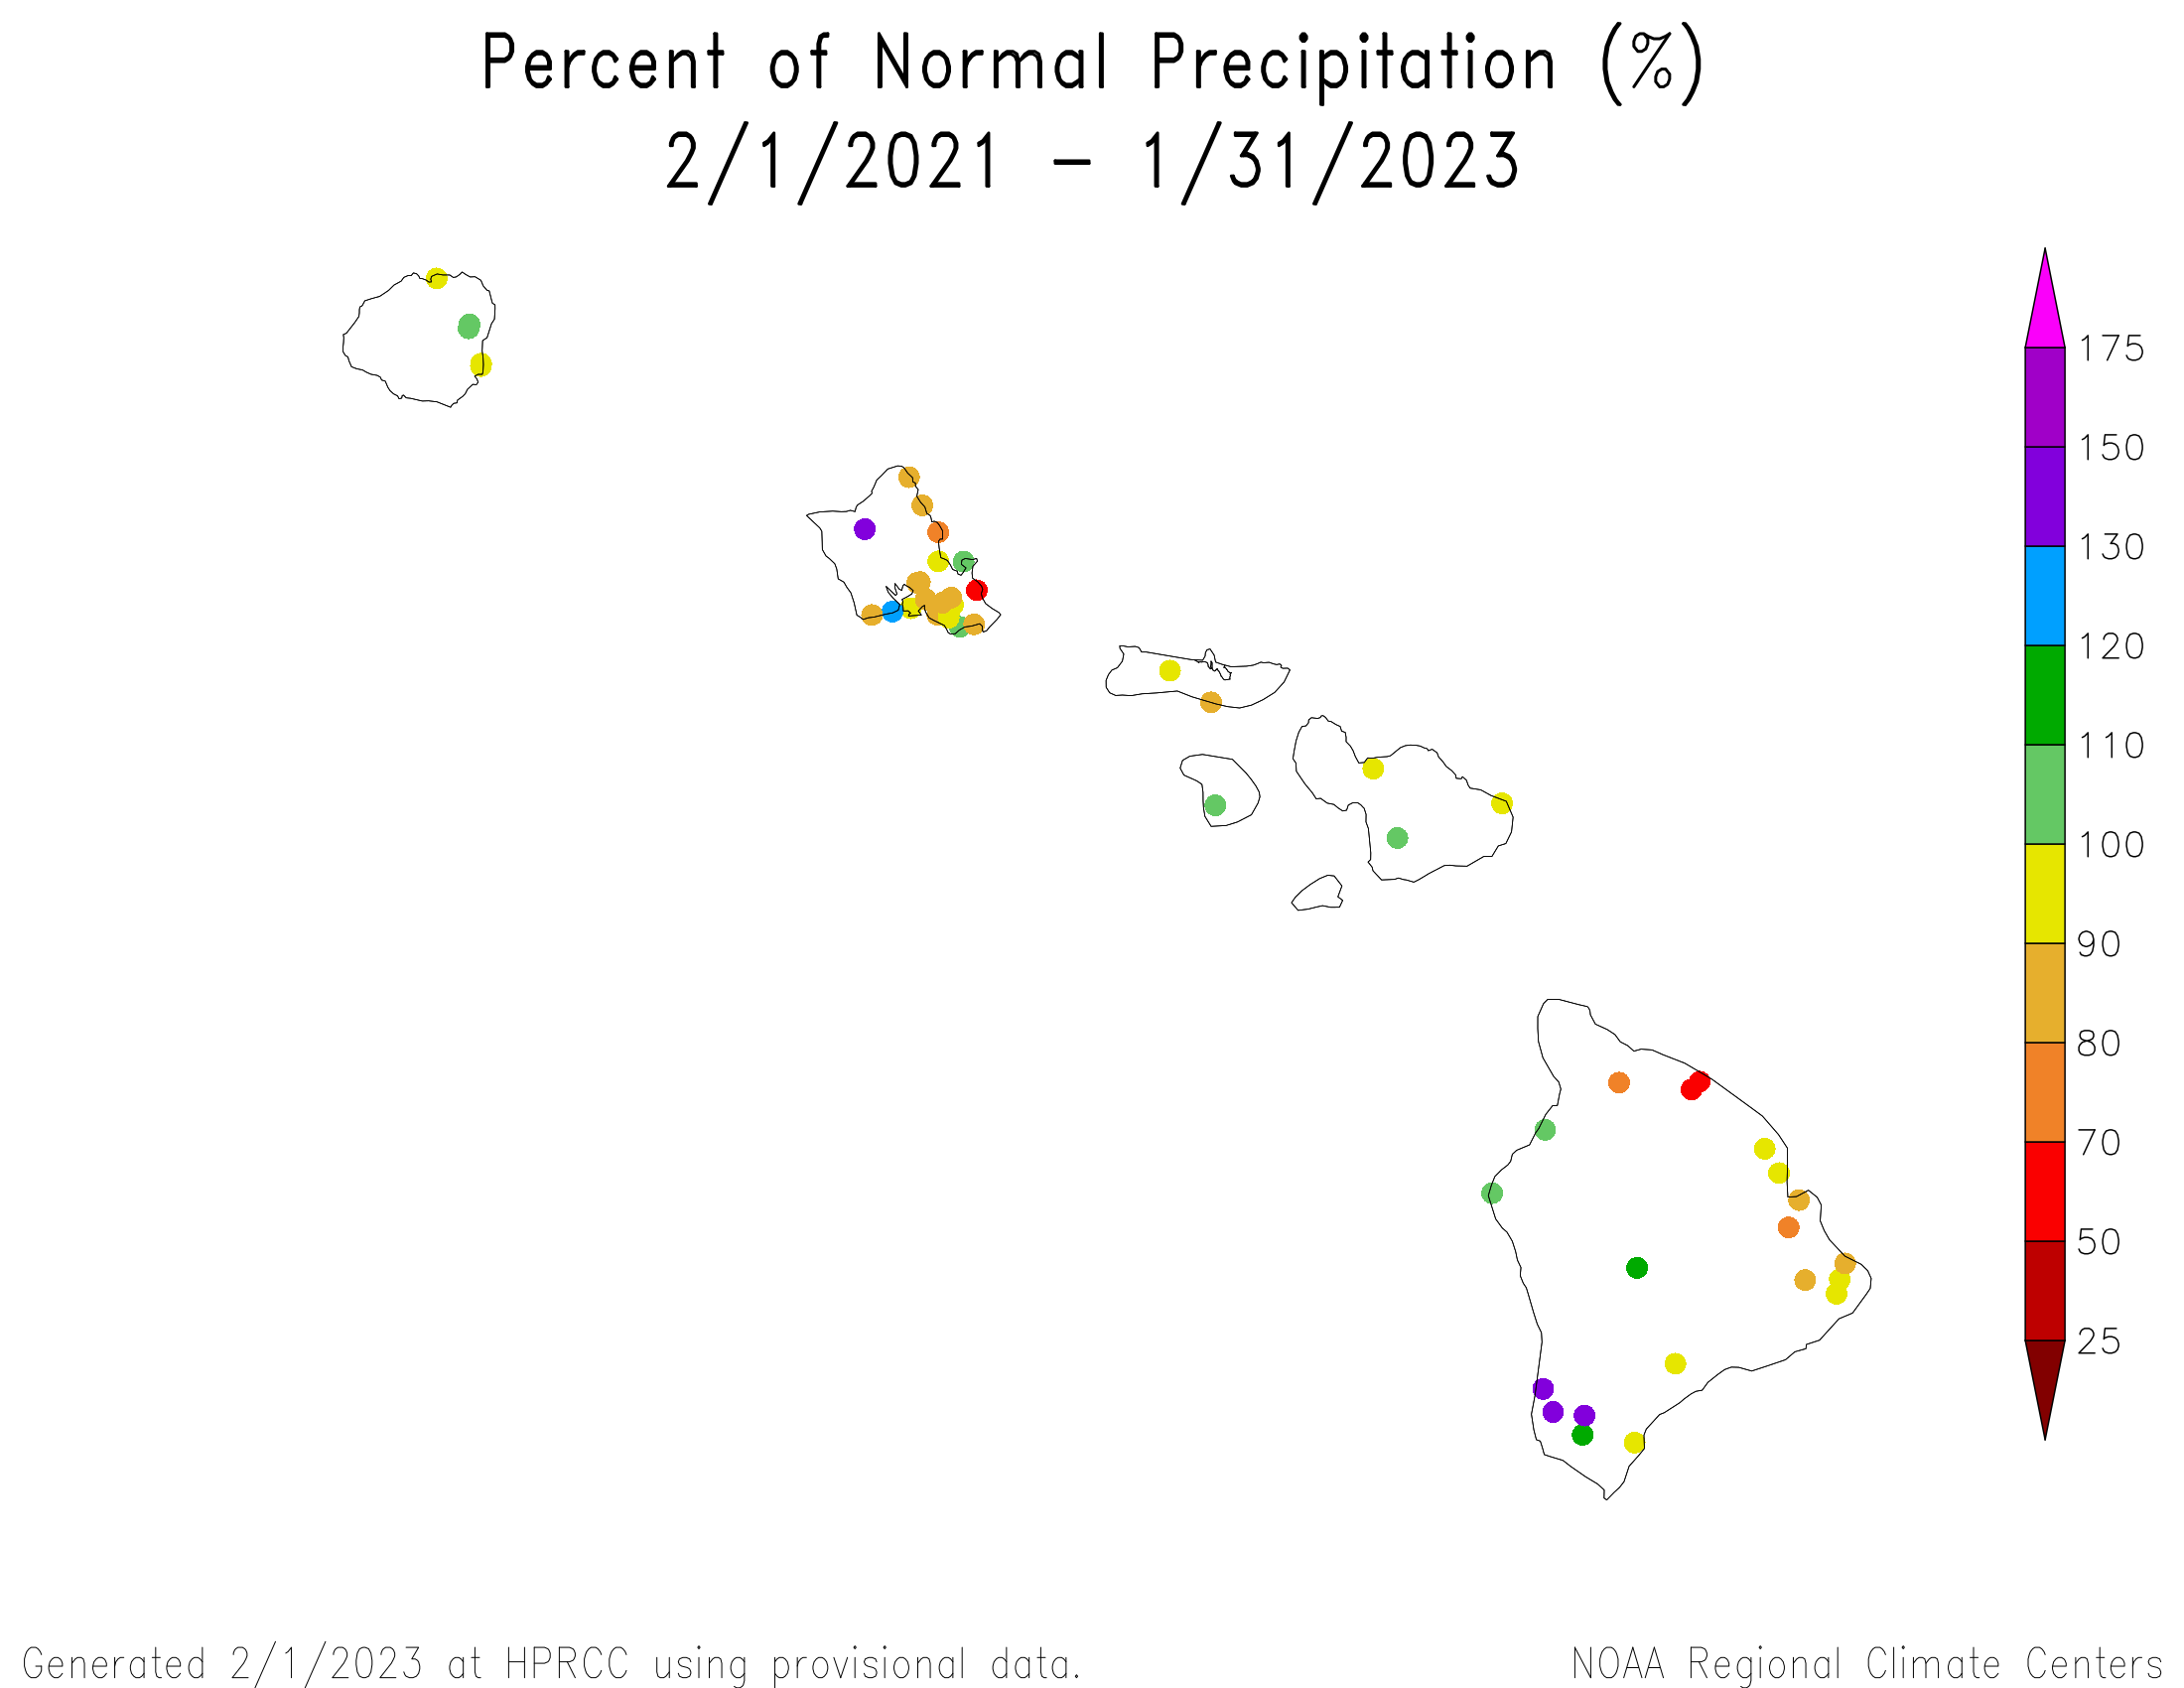
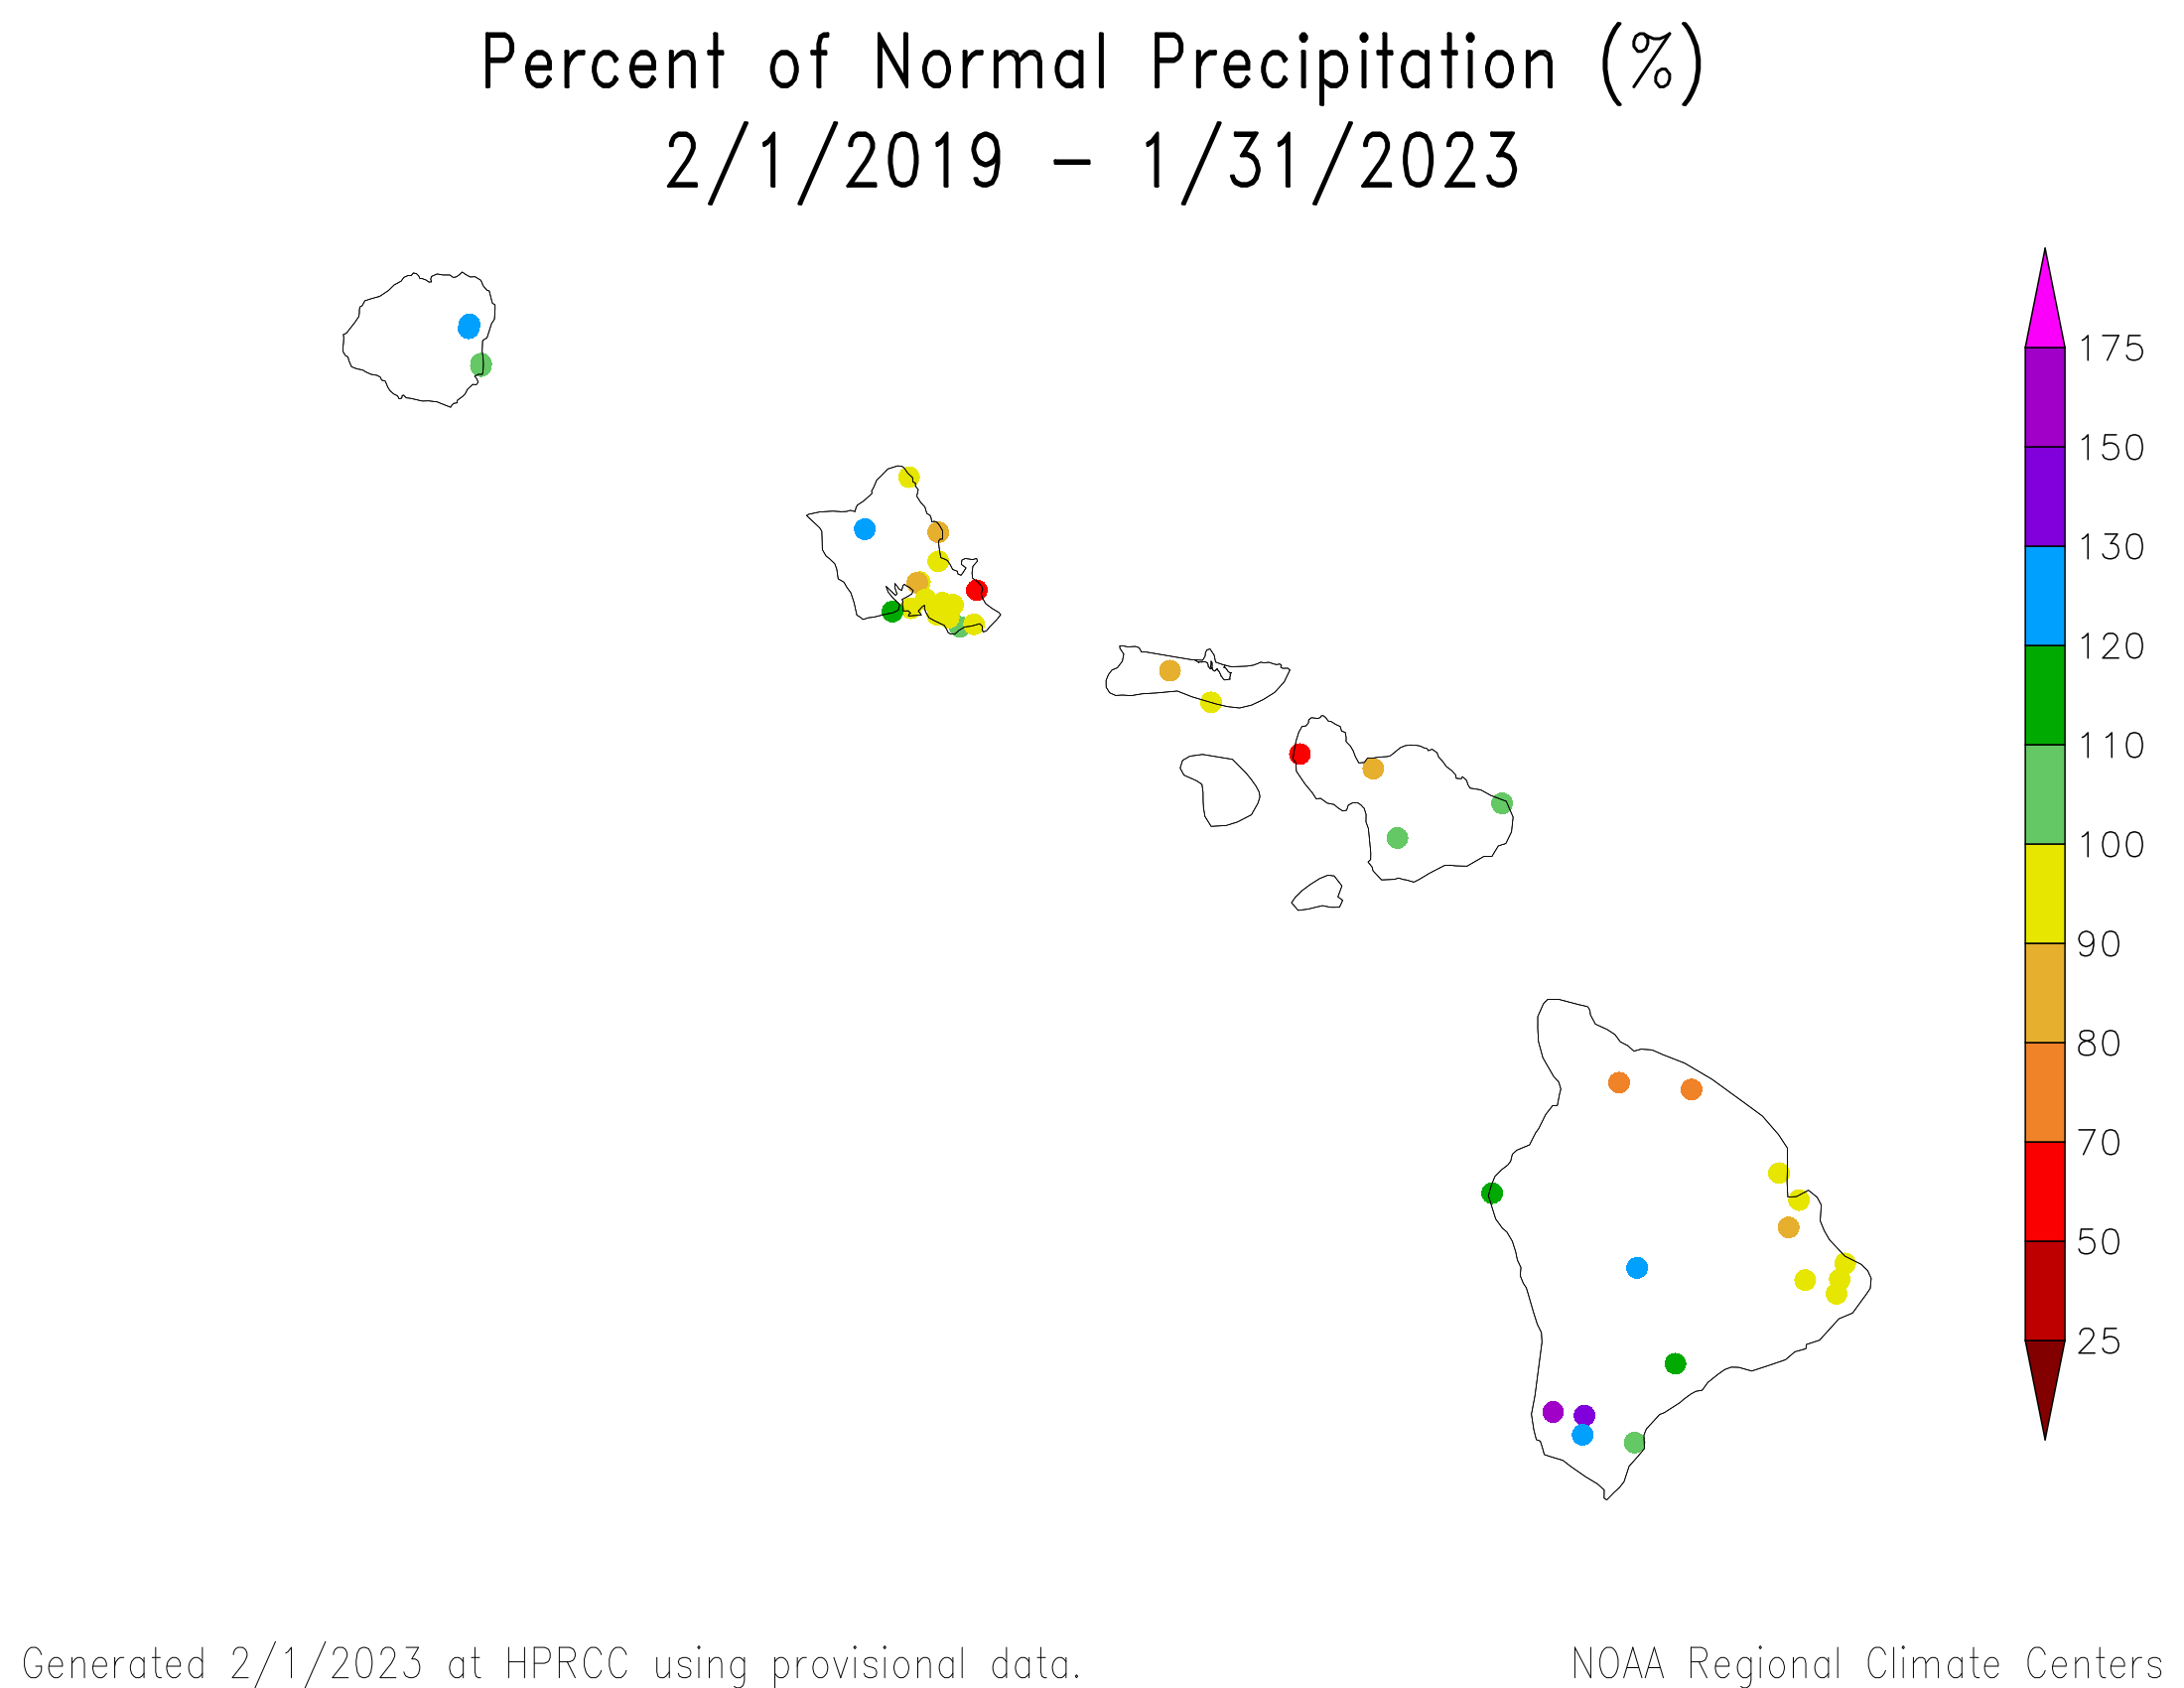
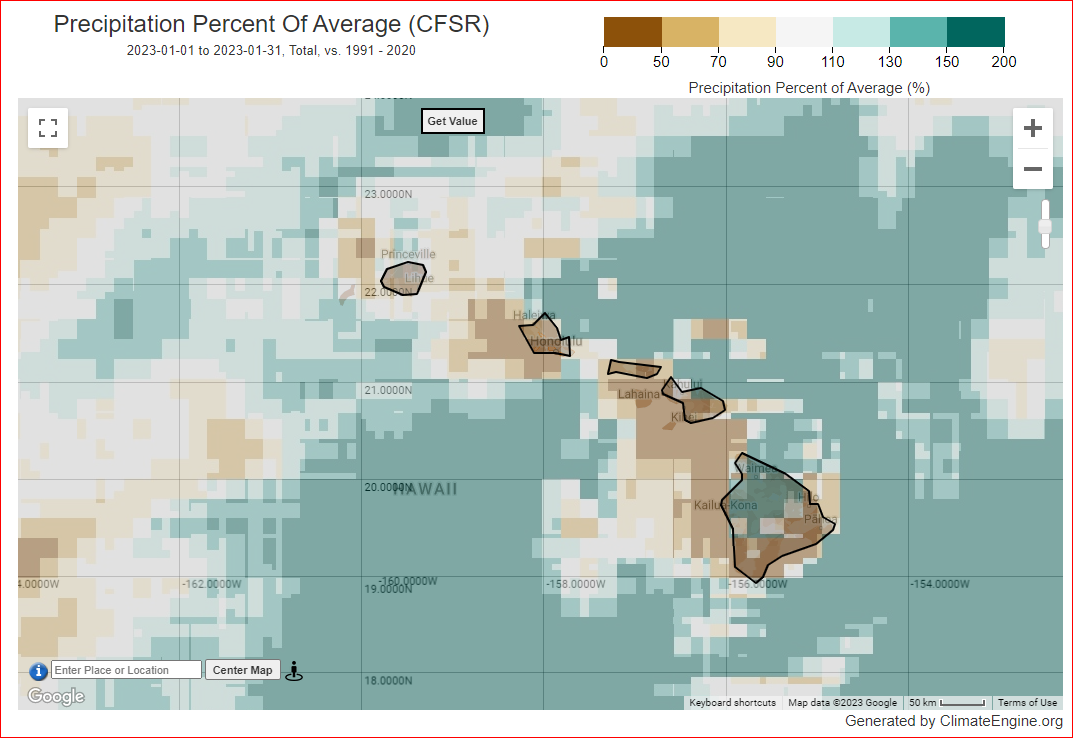
January 2023 was generally drier than normal over the Big Island and Oahu and wetter than normal over Kauai, Molokai, Lanai, and Maui. This anomaly pattern continued at the 2- to 6-month time scales, except Kauai became drier than normal. Drier-than-normal conditions began to dominate at 7 to 12 months, with wetter-than-normal conditions becoming dominant on the lee side of the Big Island. This anomaly pattern continued to 48 months, except Kauai became wetter than normal. At 60 months, wetter-than-normal conditions dominated across the islands (precipitation anomaly maps for the last 1, 2, 3, 4, 6, 7, 9, 10, 12, 24, 36, 48, 60 months) (climate engine model percent of normal precipitation map for the last month).
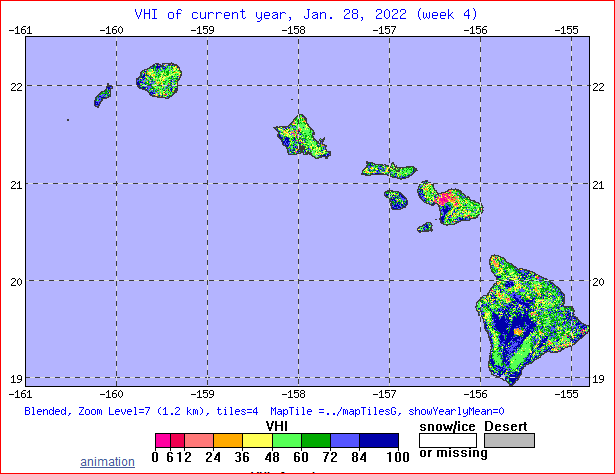
Monthly streamflow was below normal on on the windward side of the Big Island, but ranged from below to above normal on the other islands. There was considerably less stress on vegetation this month (satellite analyses of stressed vegetation, drought risk, VHI).
Drought and abnormal dryness expanded this month. Severe and extreme drought disappeared, with moderate drought remaining. The drought area increased from 11.4% at the end of December to 19.0% on the January 31, 2023 USDM map.
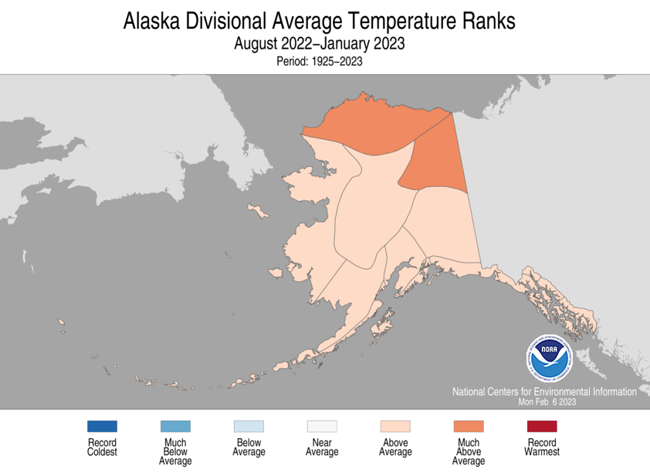
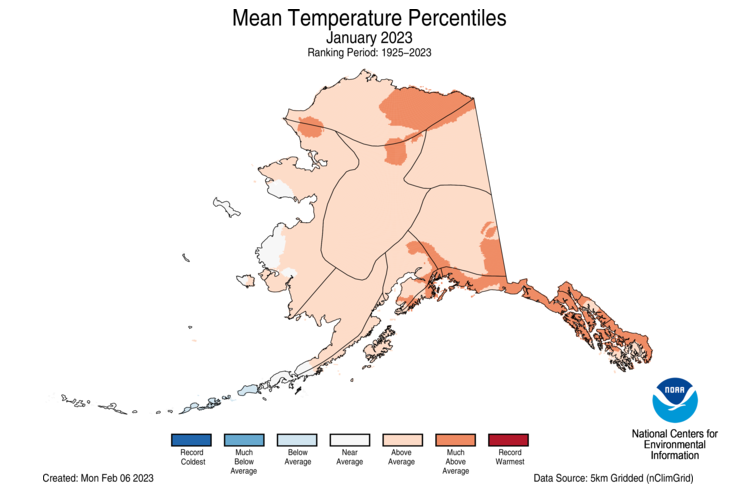
Alaska

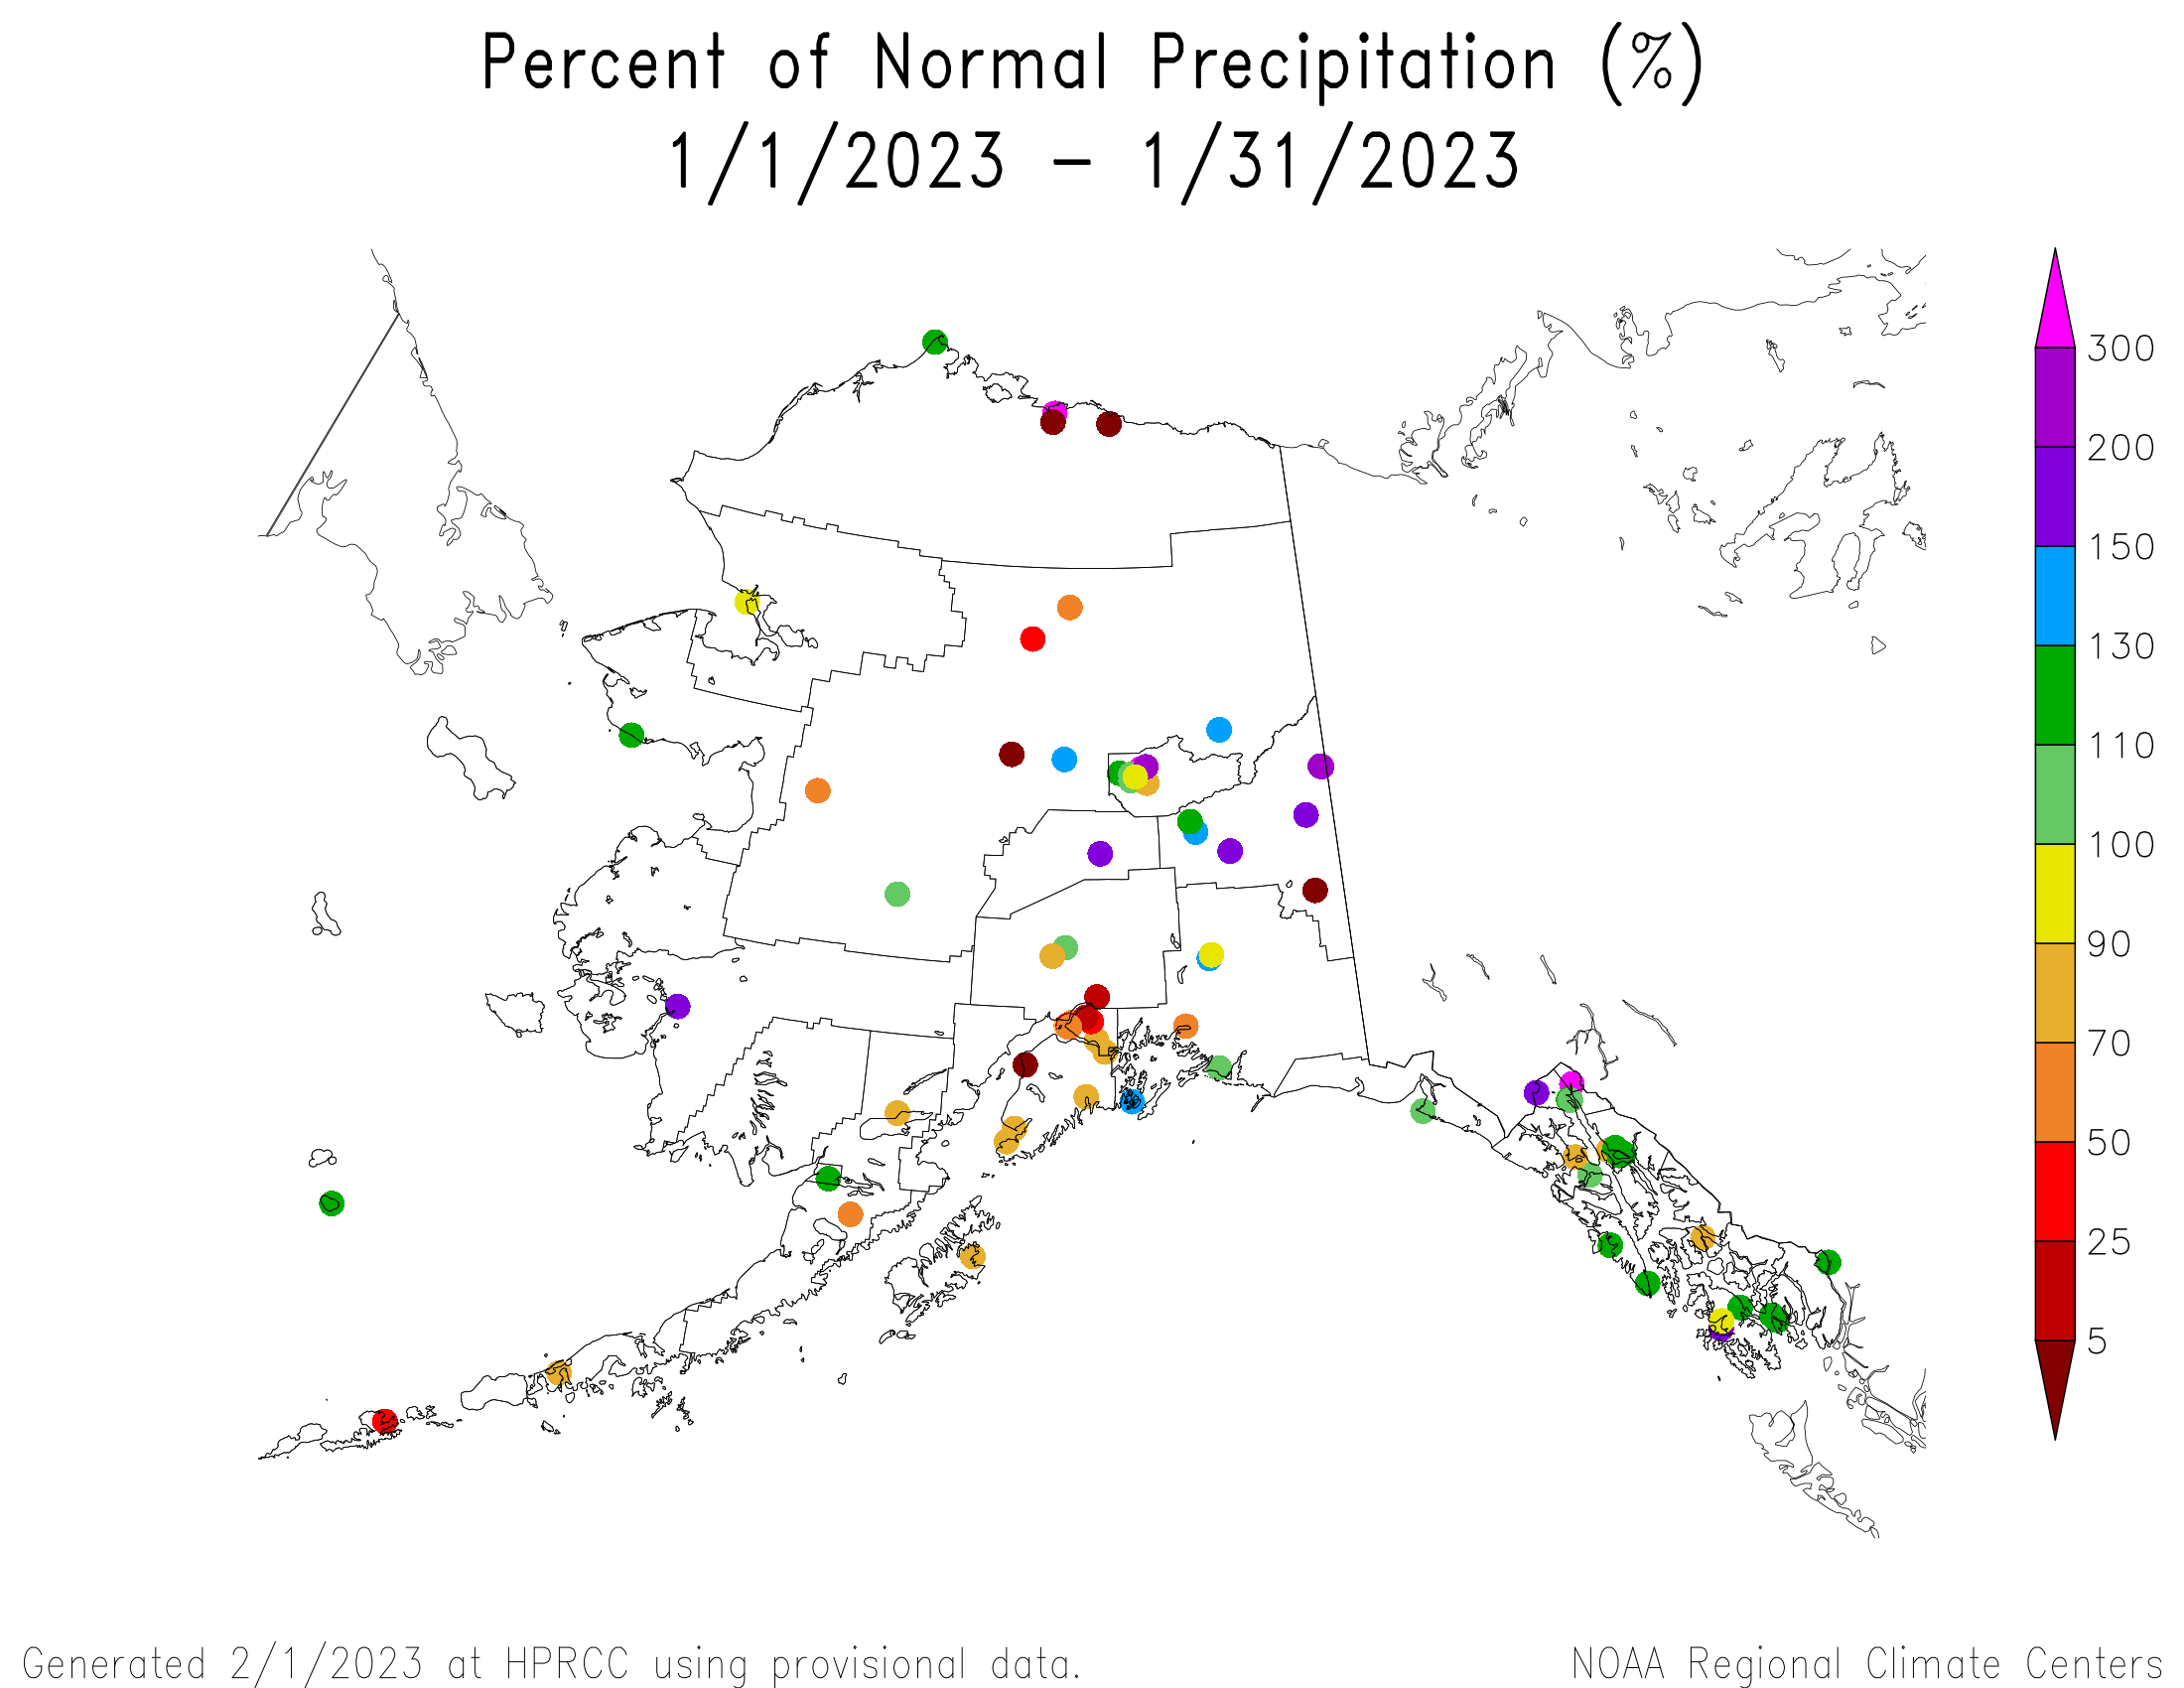


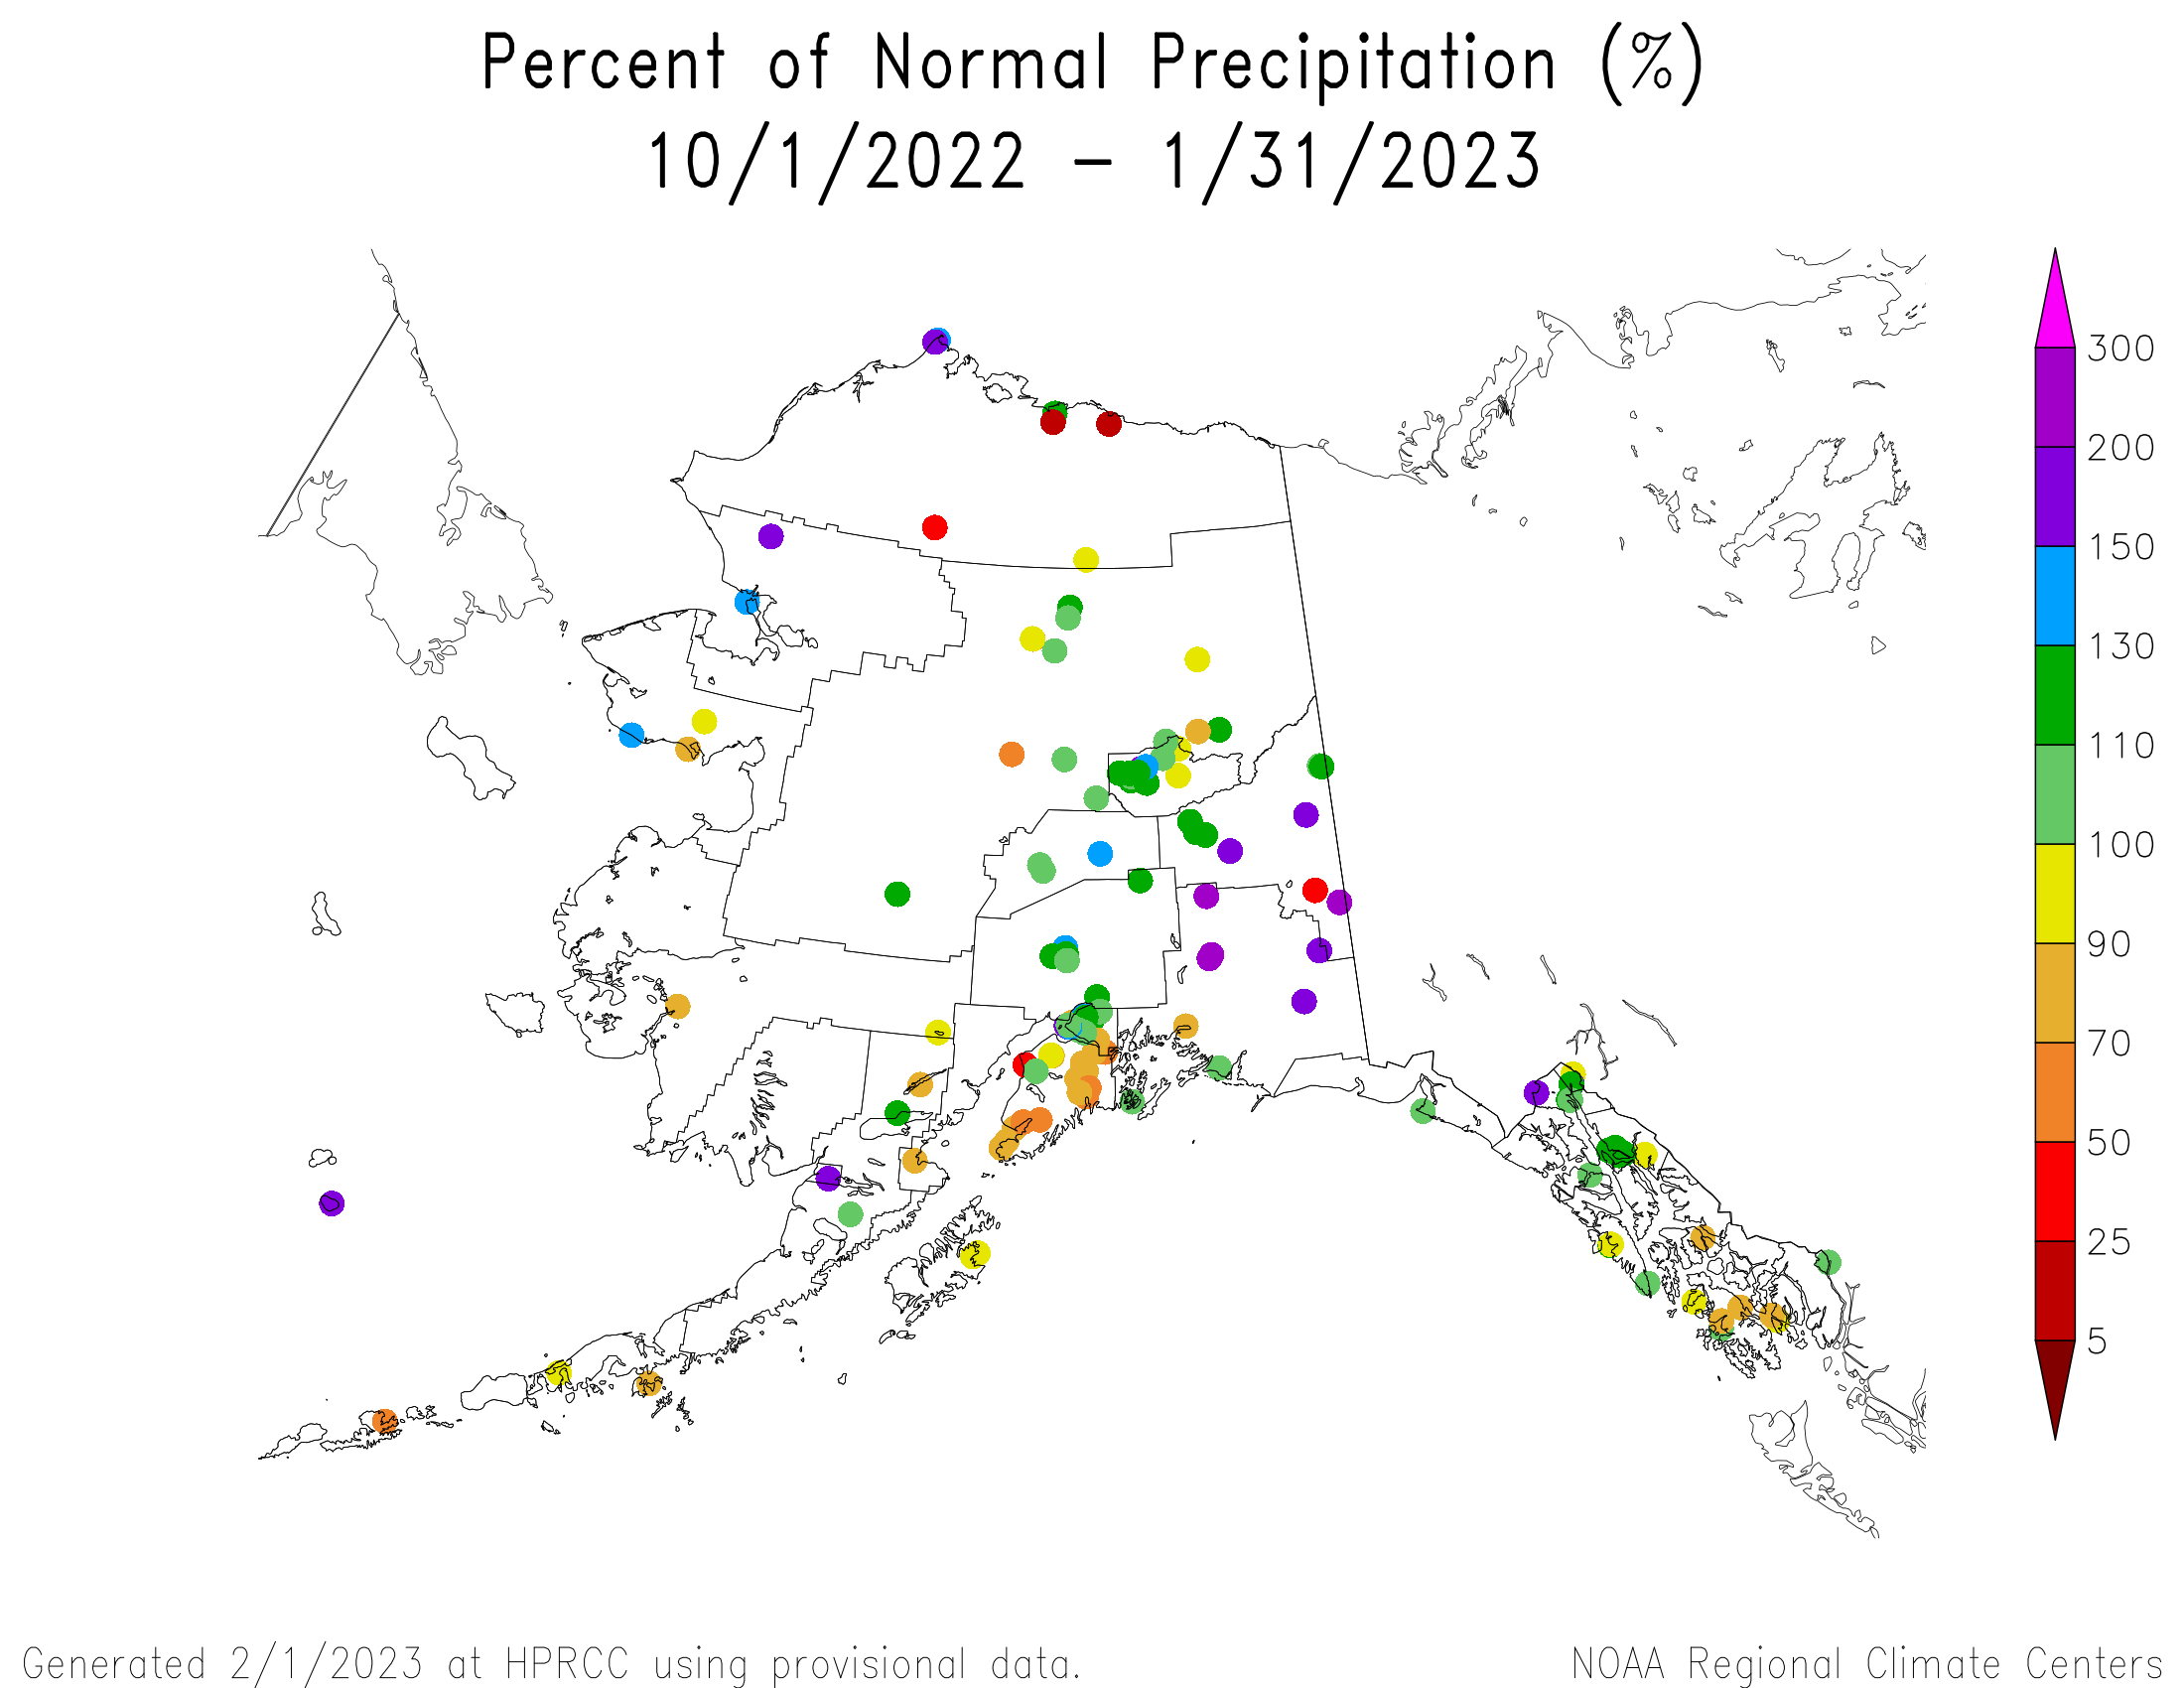
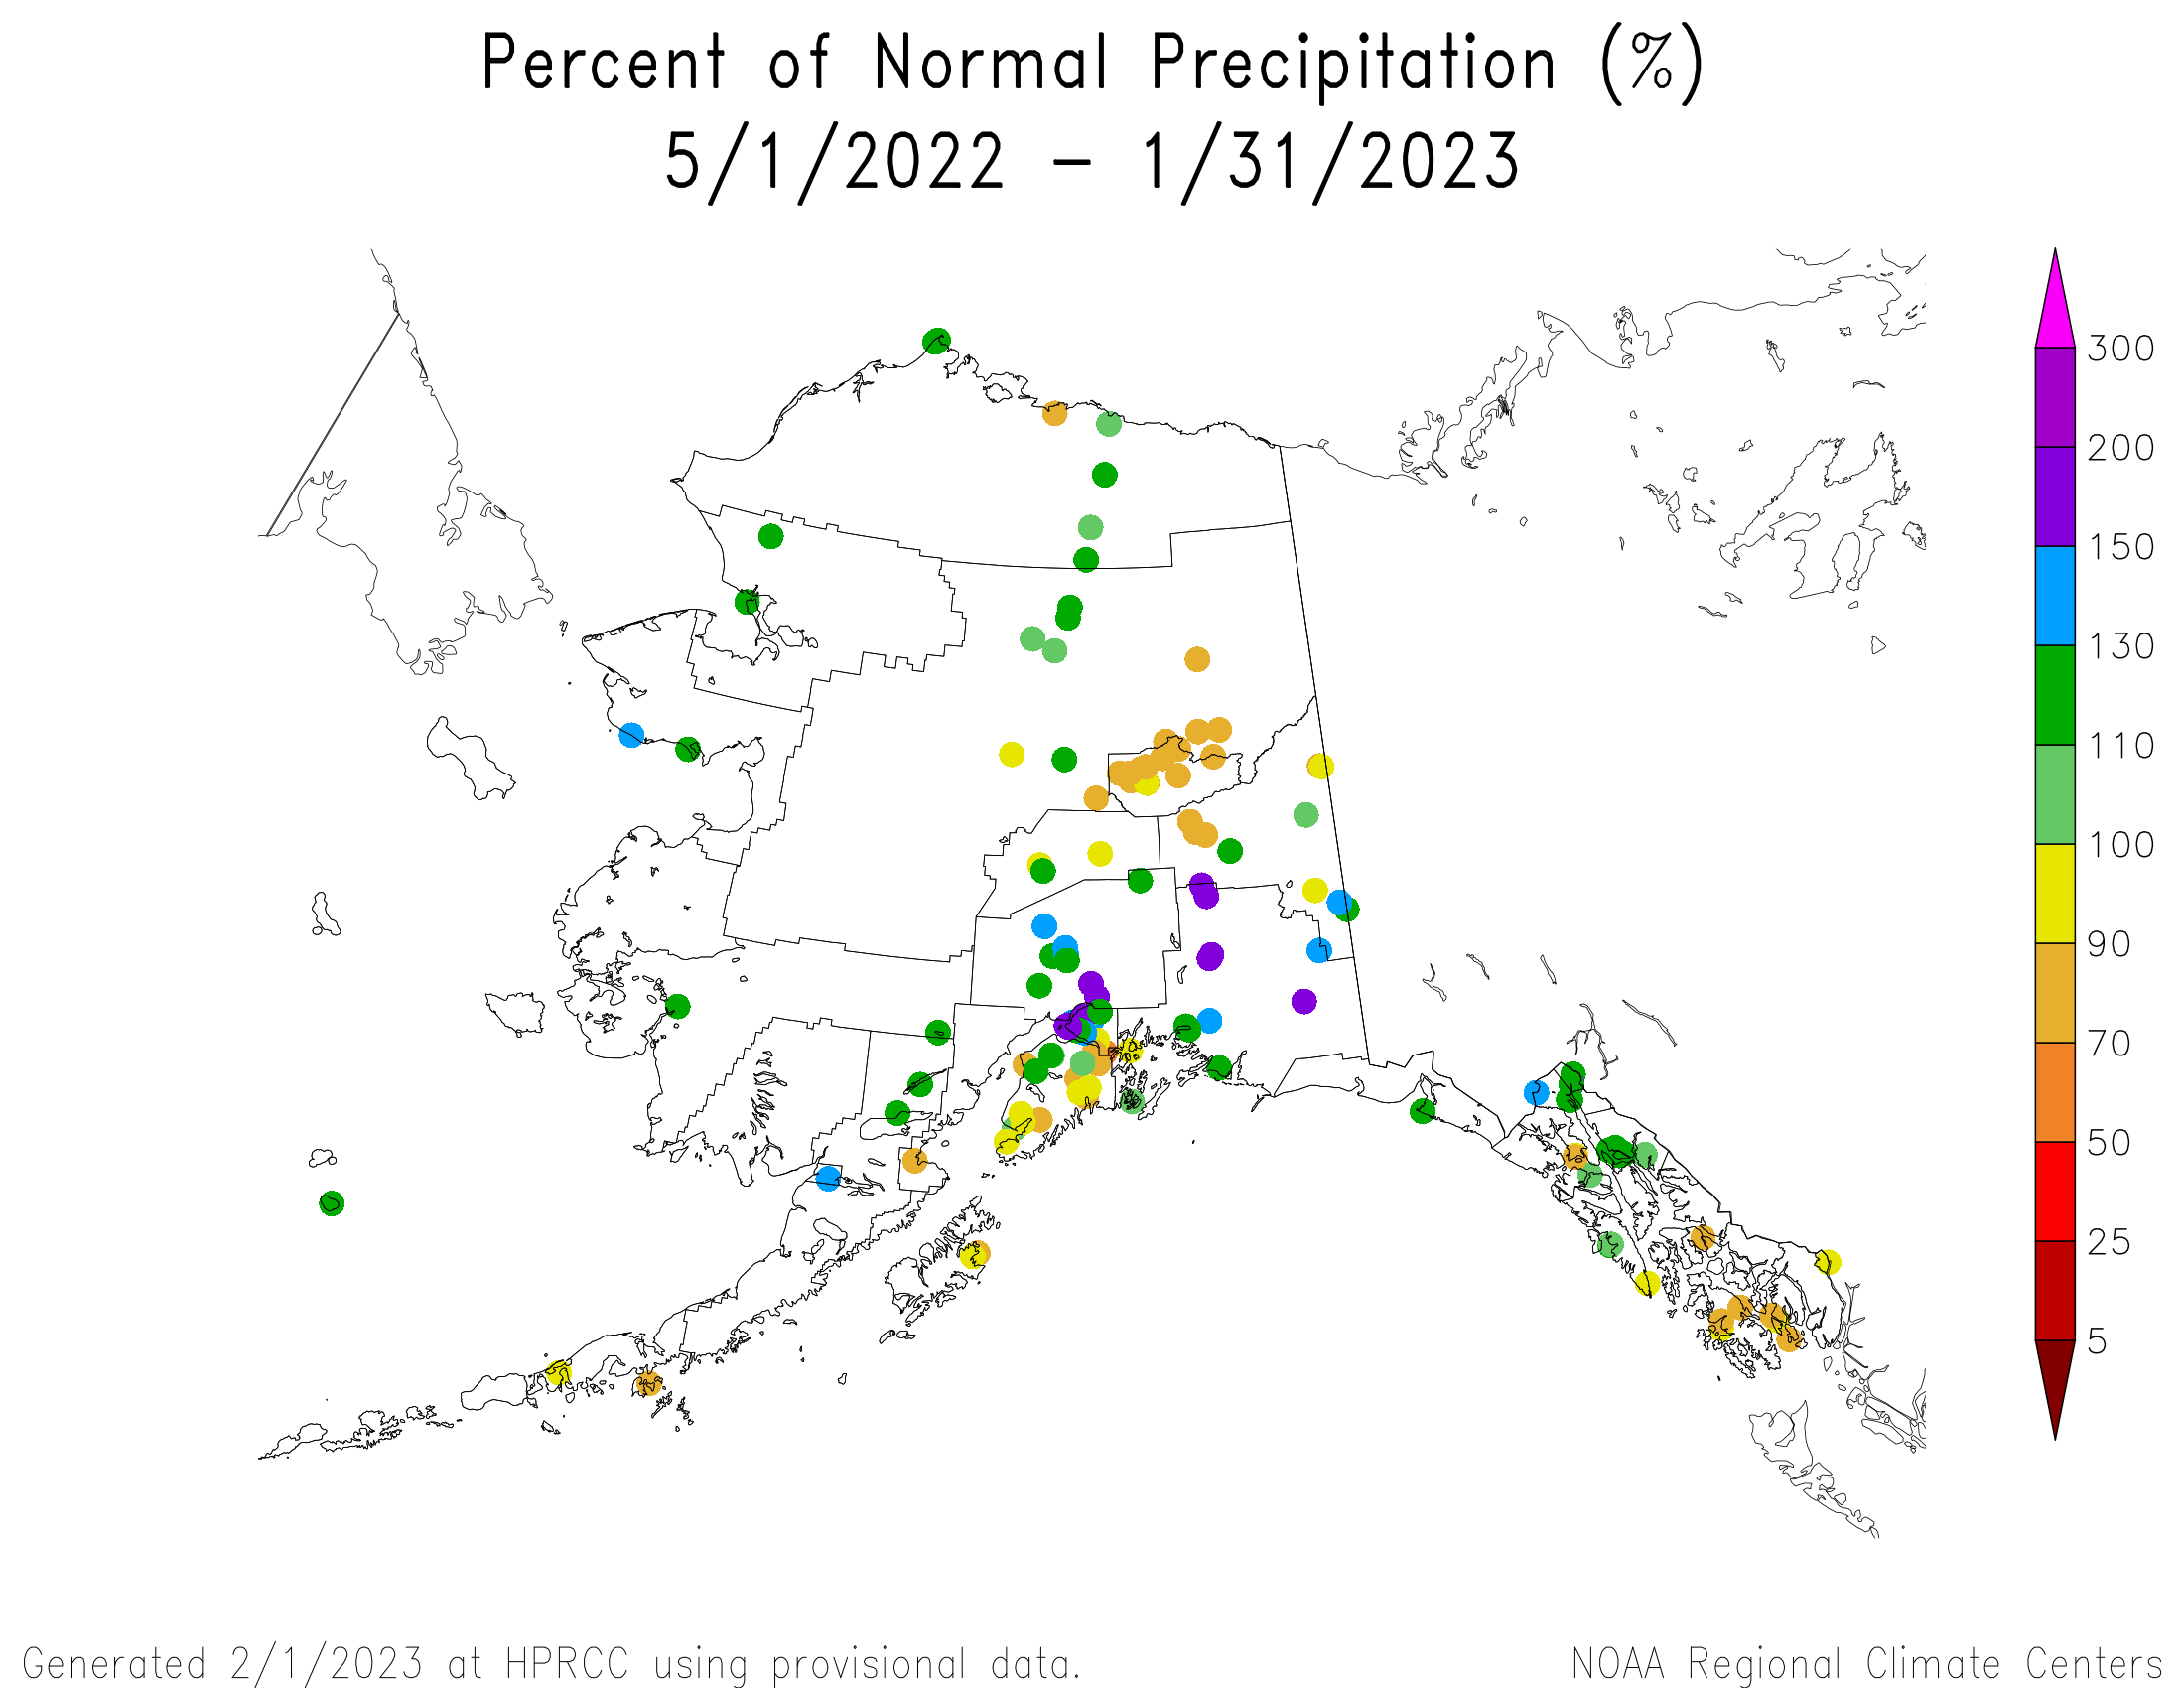
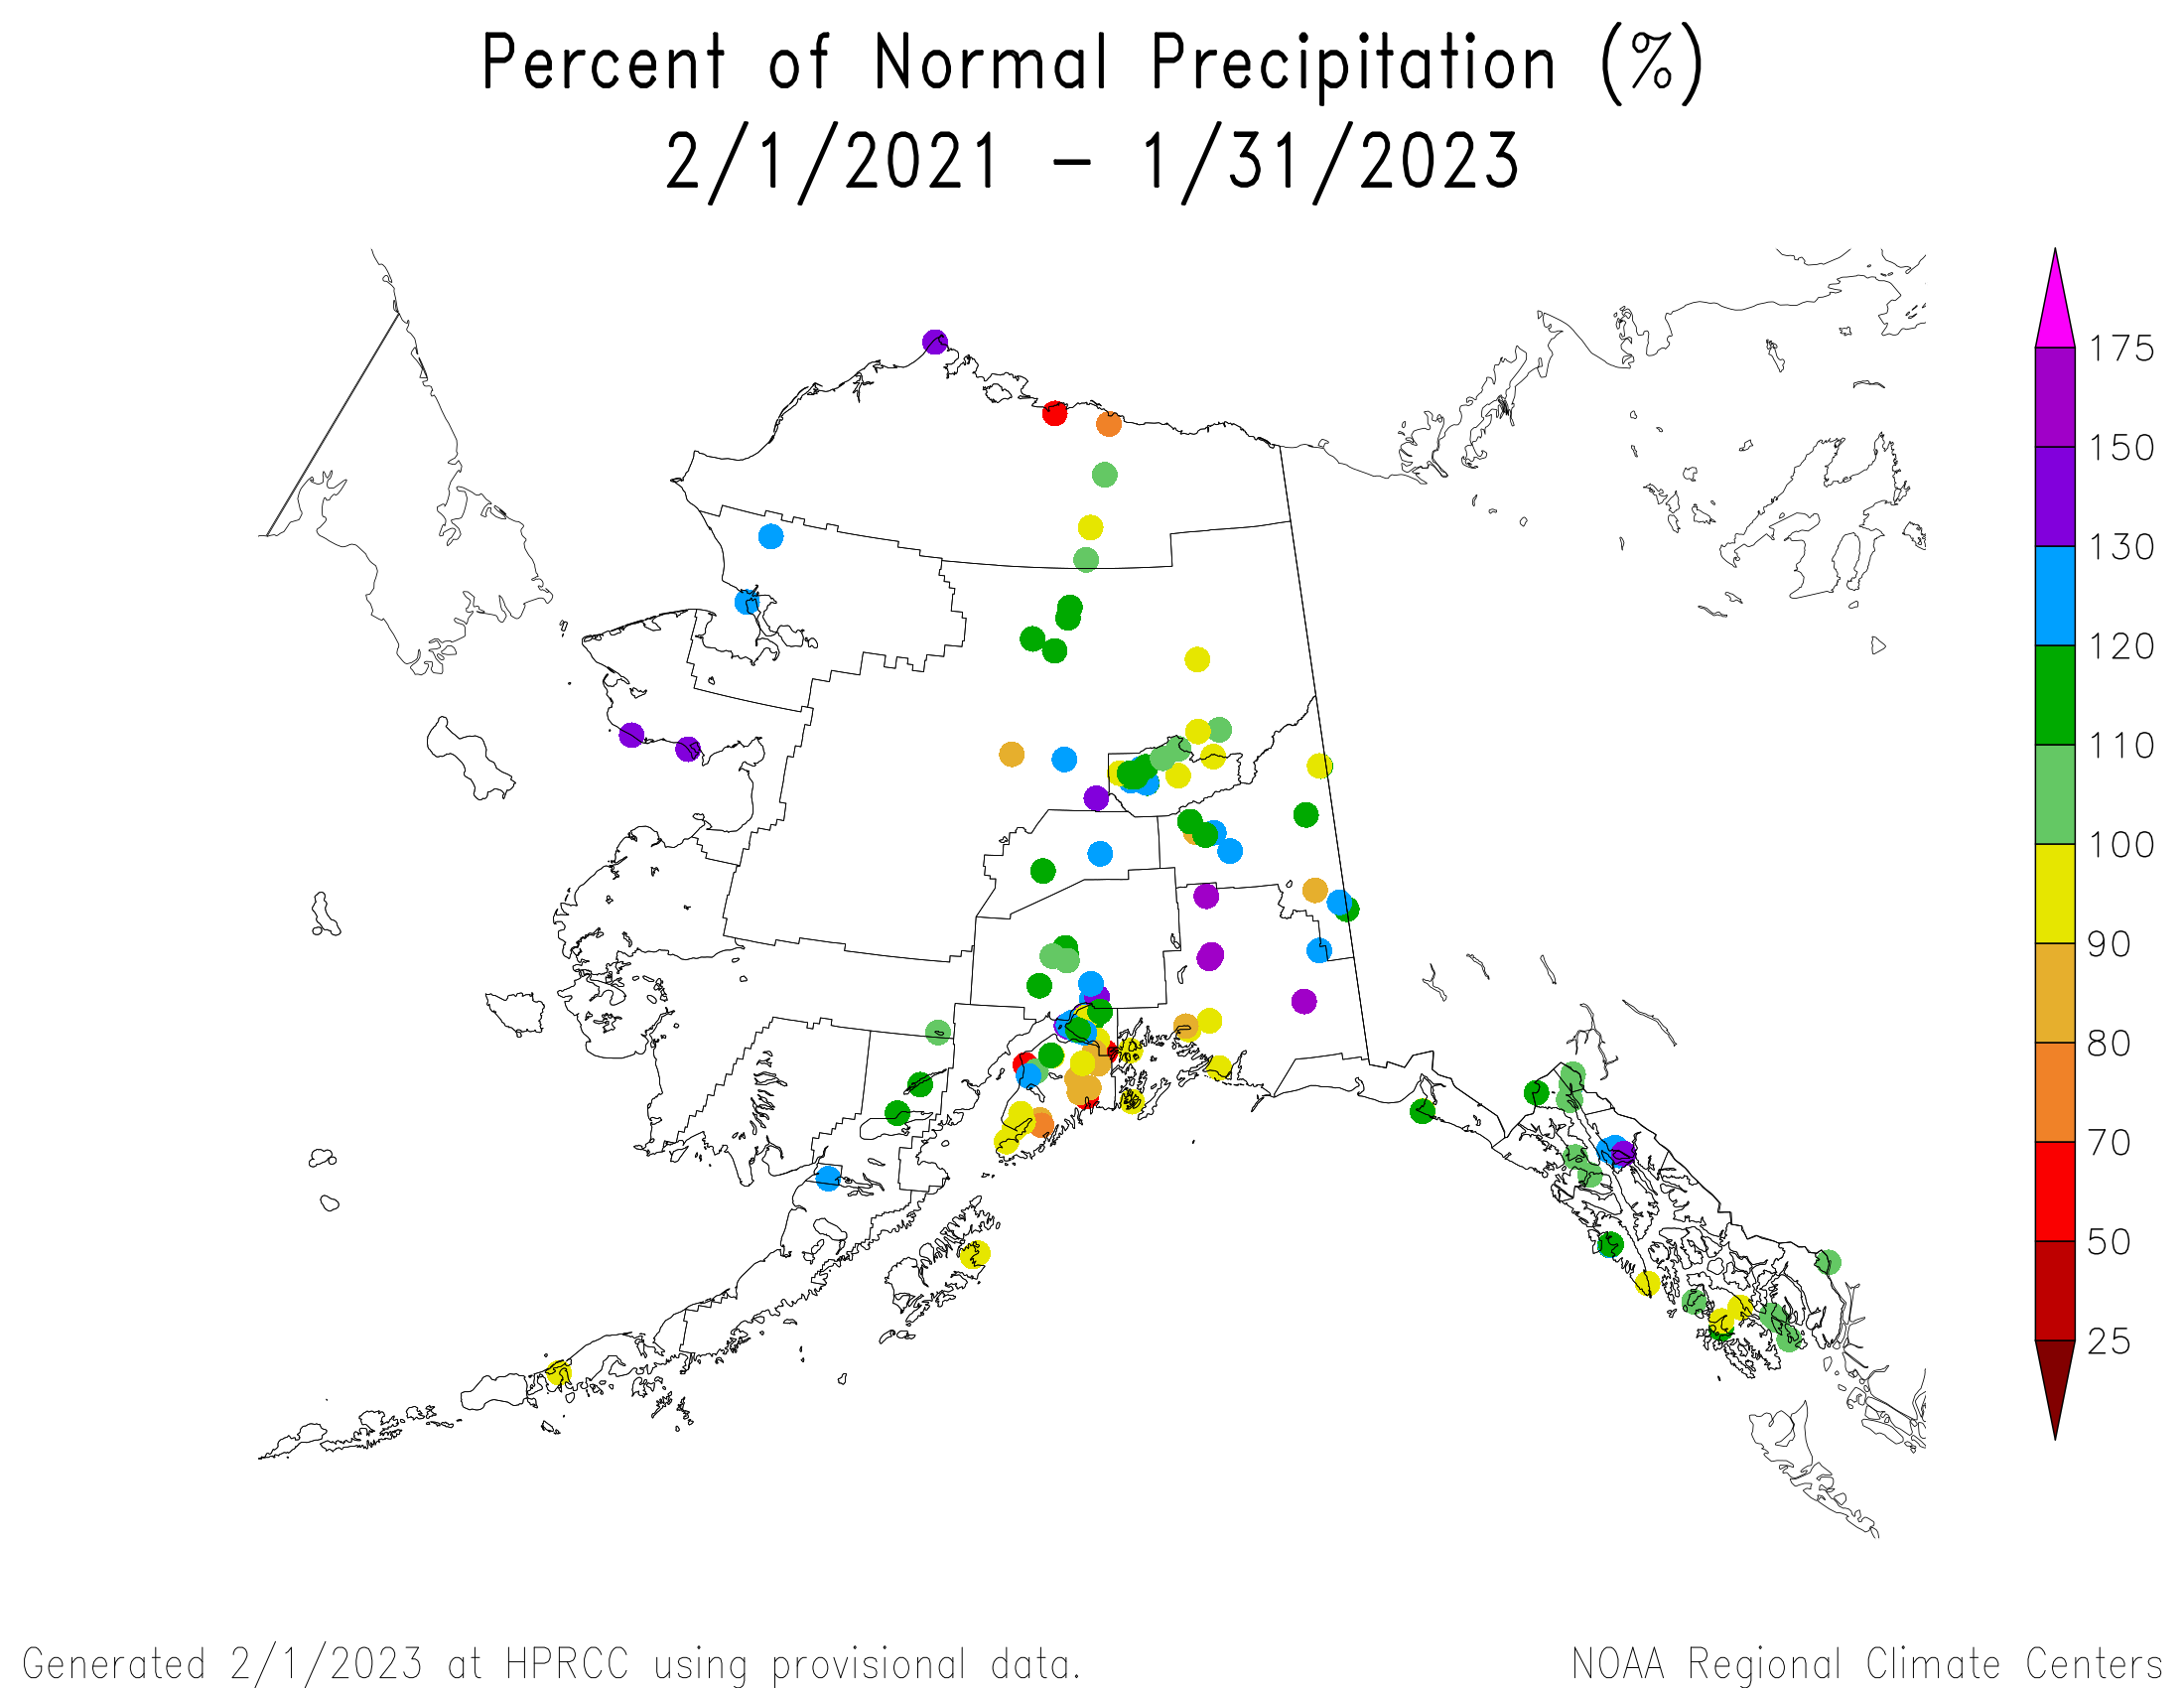
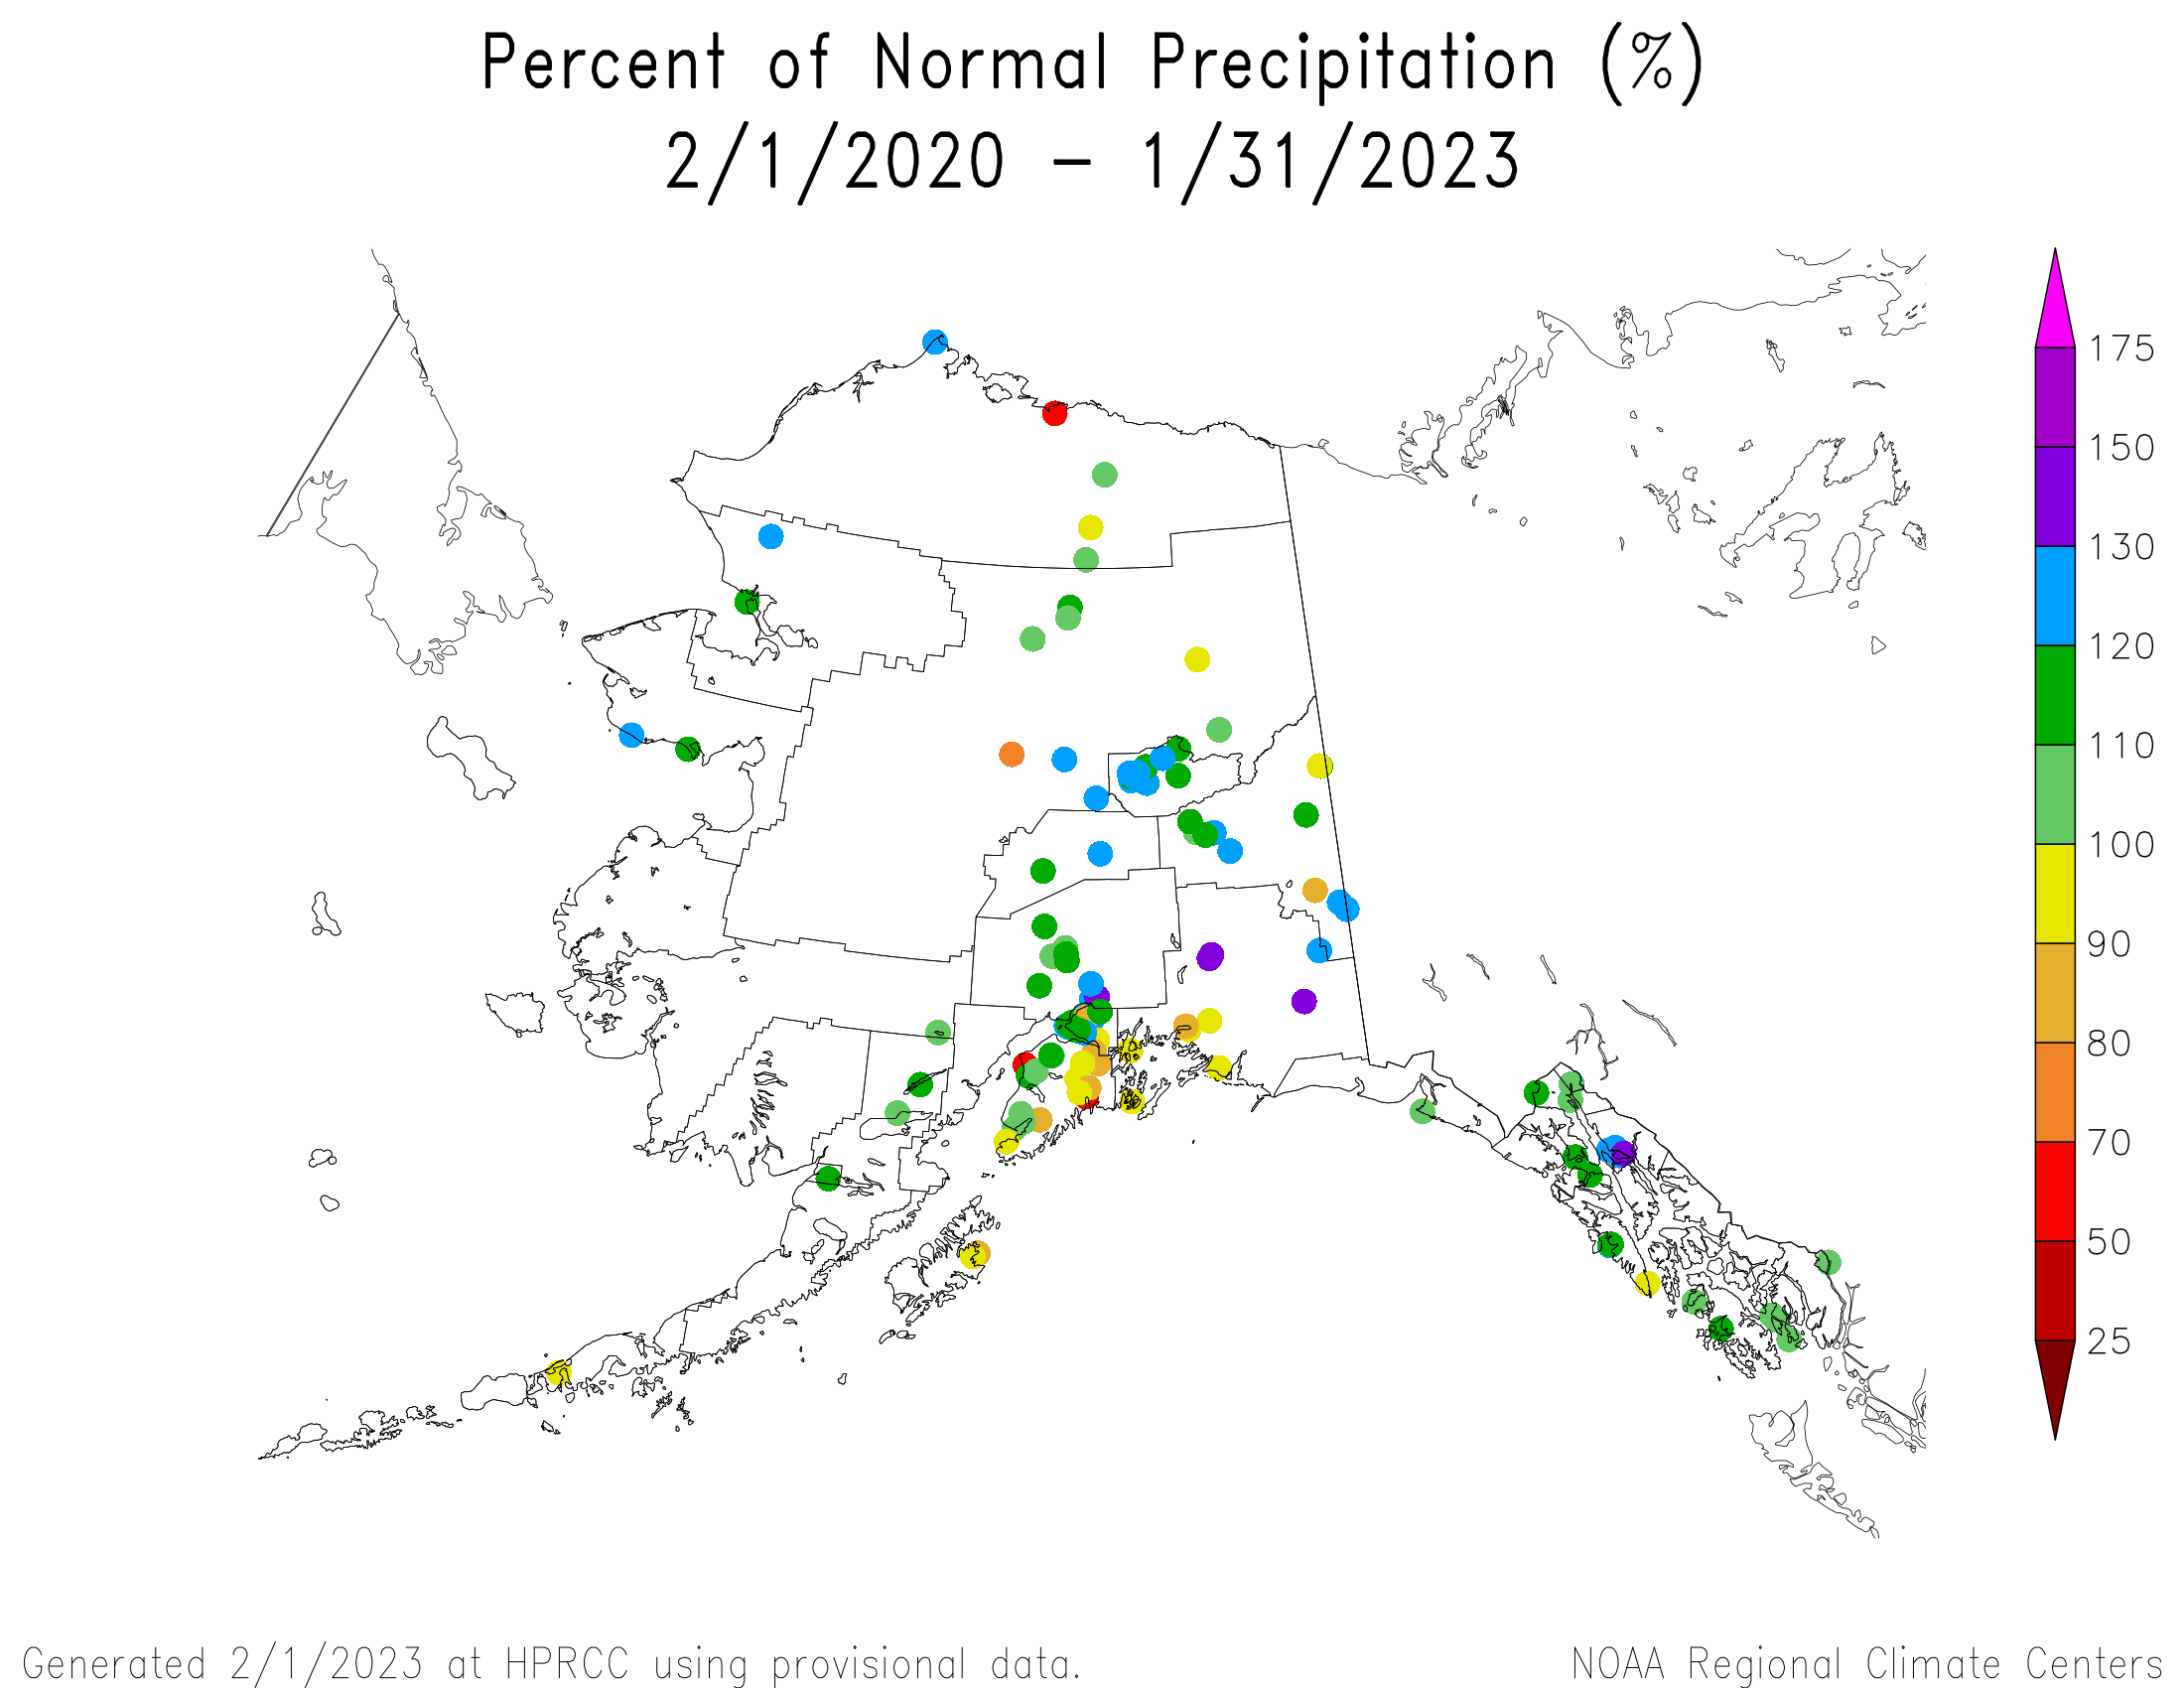
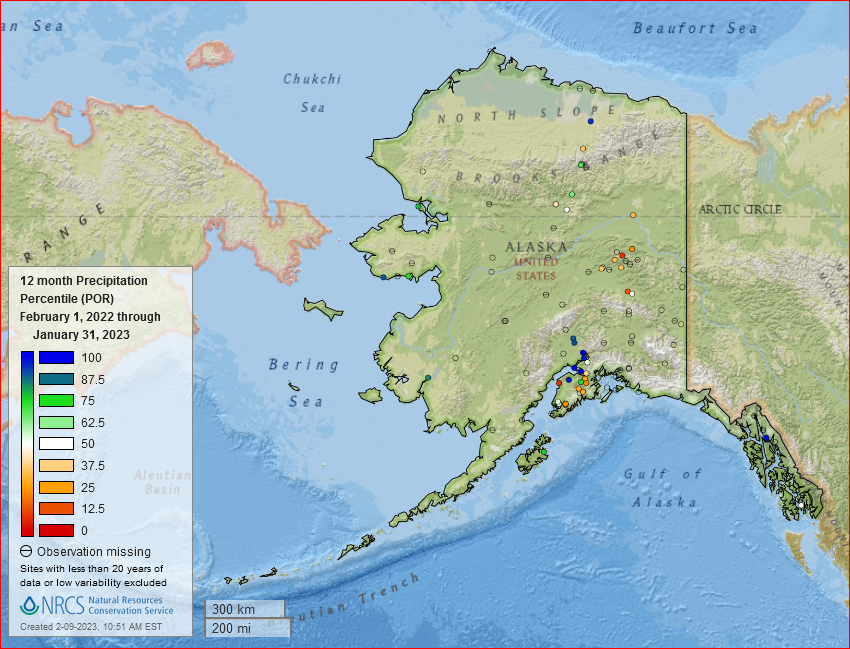
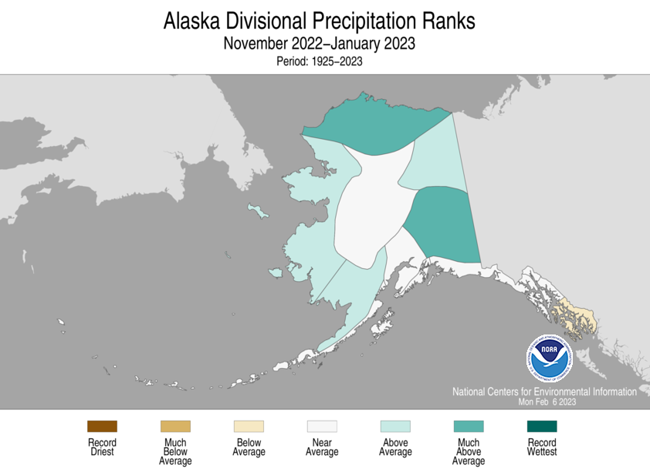
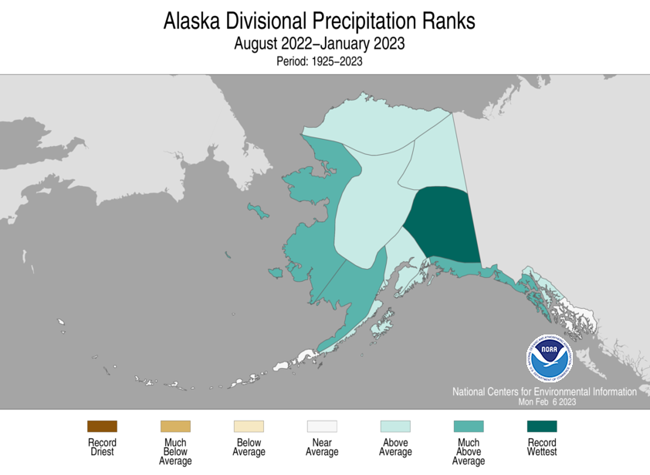
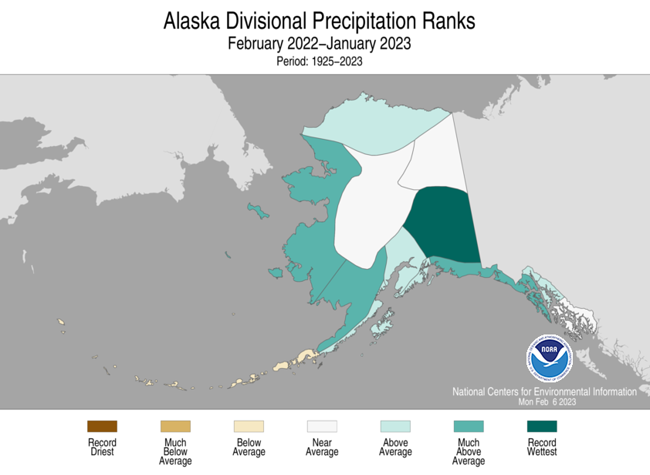
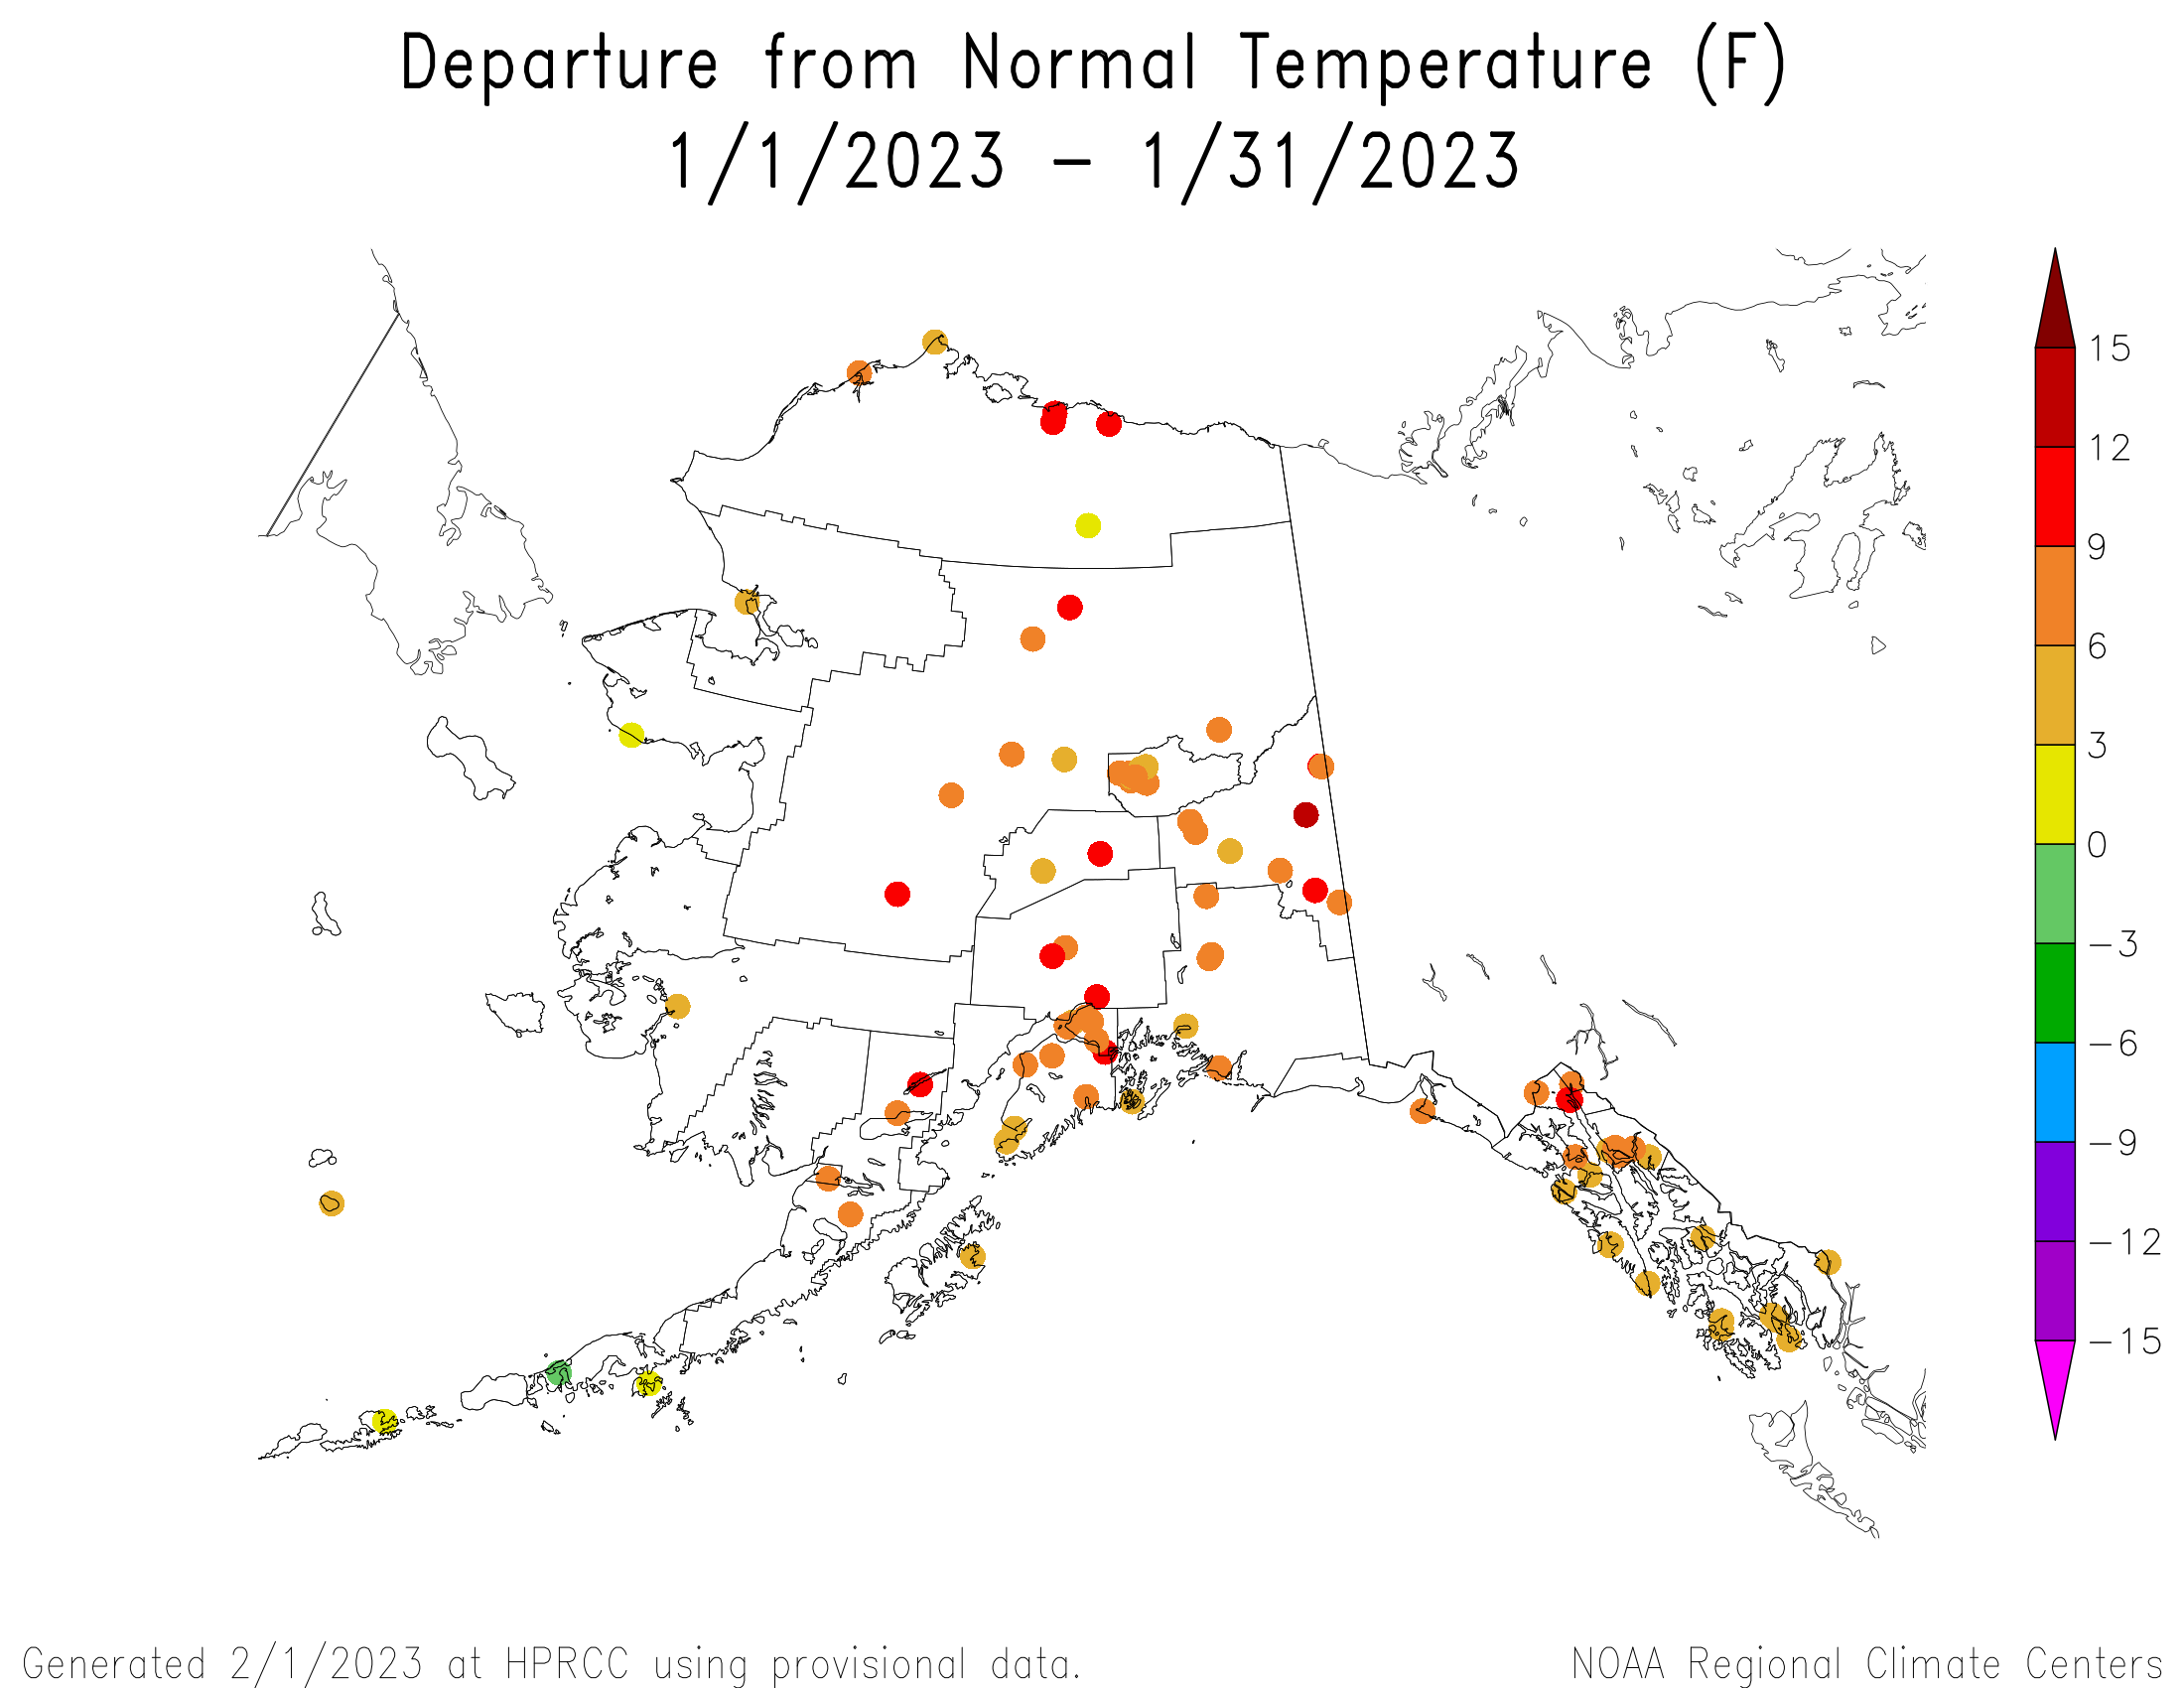
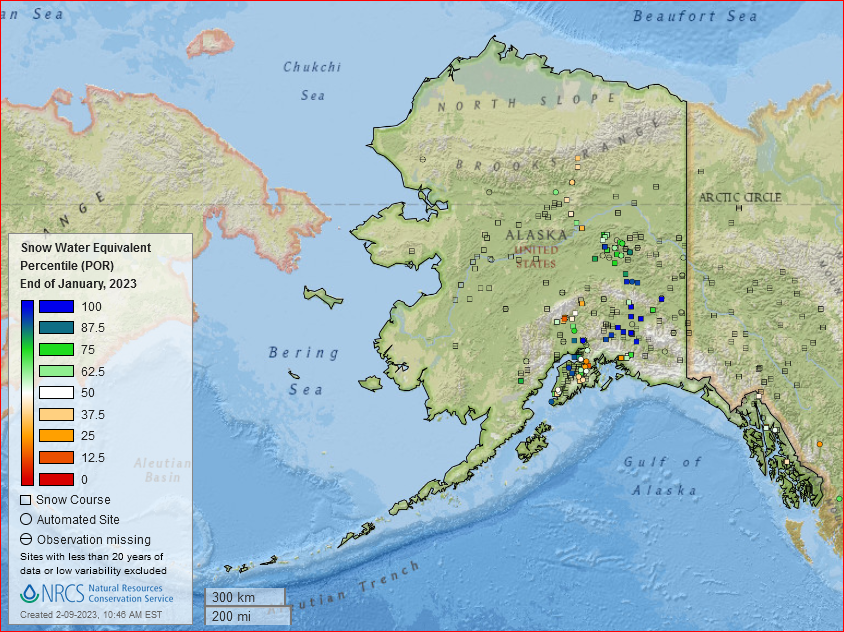
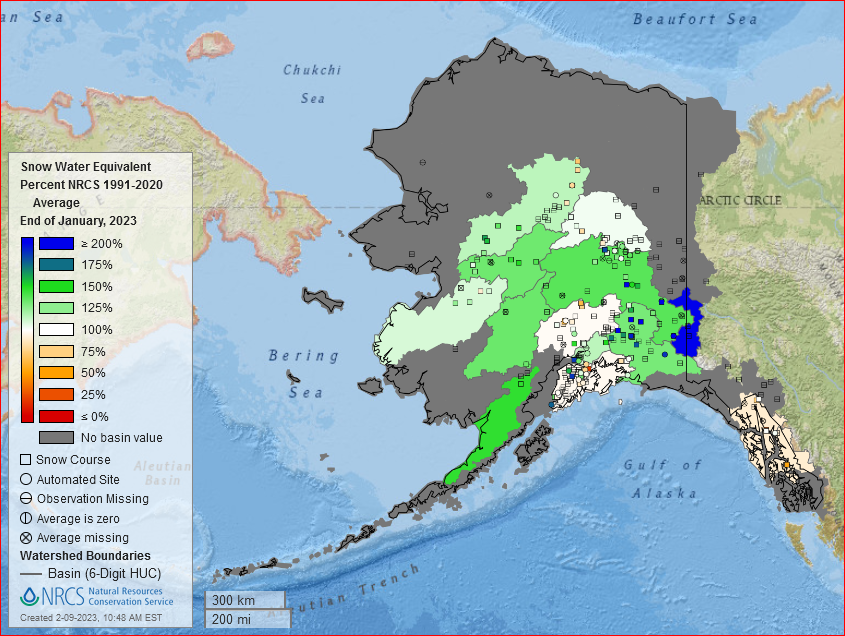
January 2023 was drier than normal in interior Alaska and from the Cook Inlet to Aleutians, and generally near to wetter than normal elsewhere in the state. Drier-than-normal conditions spread to the panhandle and some eastern stations by the 3-month time scale, but near to wetter-than-normal conditions dominated across most of the state by 6 months. At the 7- to 10-month time scales, it was drier than normal at Aleutian, southern panhandle, northwest Gulf, and eastern interior locations. At longer time scales, drier-than-normal conditions were mostly found just at northwest Gulf stations (low elevation station precipitation anomaly maps for the last 1, 2, 3, 4, 6, 7, 9, 10, 12, 24, 36, 48, 60 months) (high elevation SNOTEL station percent of normal precipitation maps for the last 1 and 4 months) (high elevation SNOTEL station precipitation percentile maps for the last 1, 4, 12 months) (SNOTEL basin and station percent of normal precipitation maps for the last 1, 4, 12 months) (climate division precipitation rank maps for the last 1, 3, 6, and 12 months) (climate engine model percent of normal precipitation map for the last month) (Leaky Bucket model precipitation percentile map).
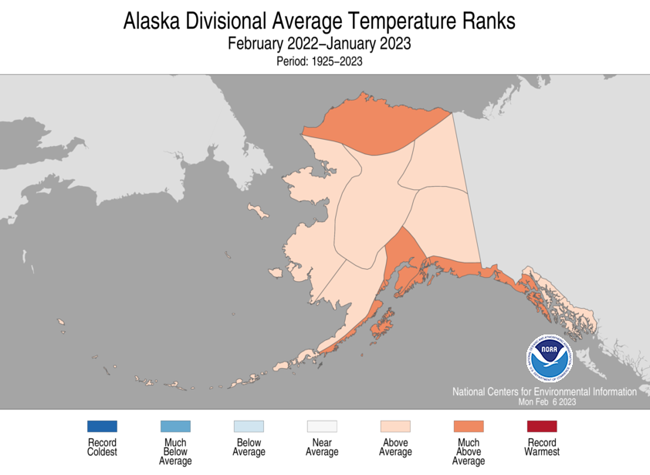
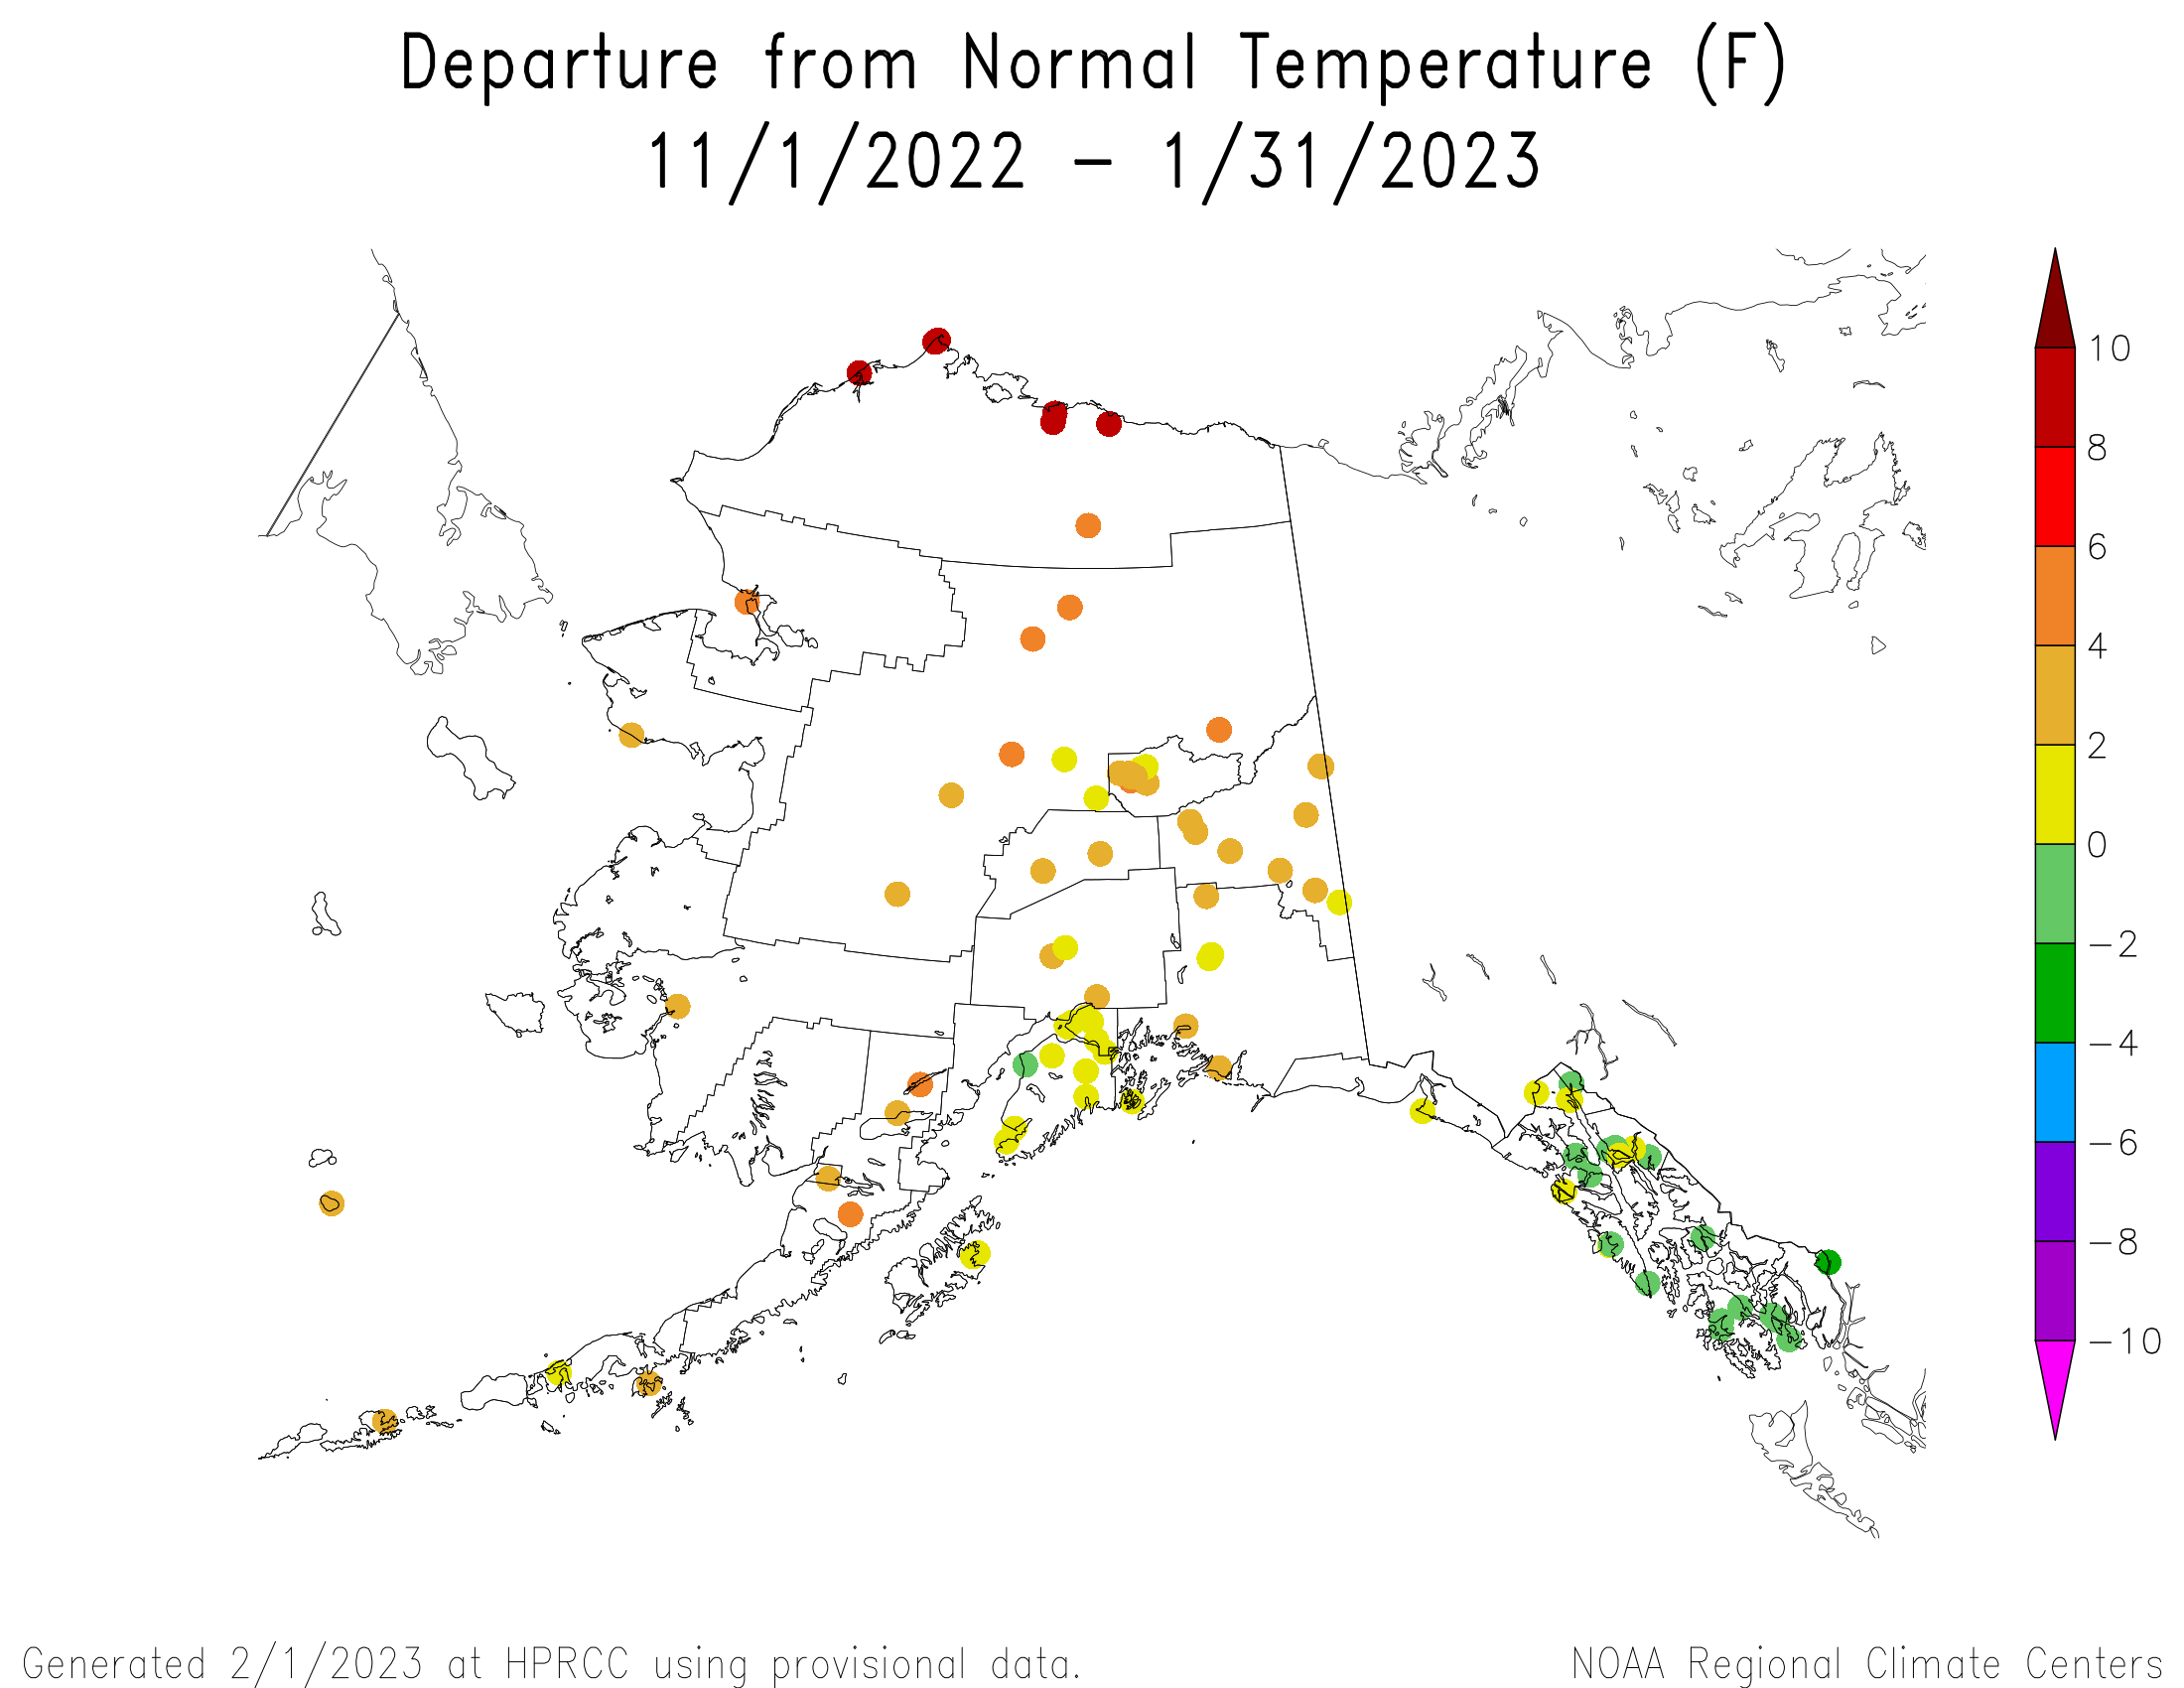
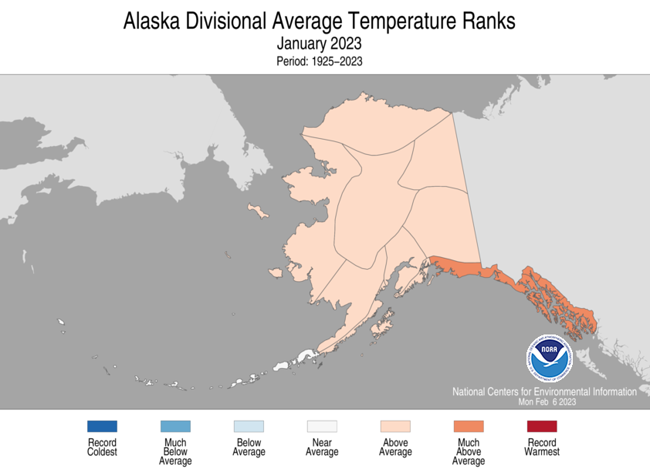
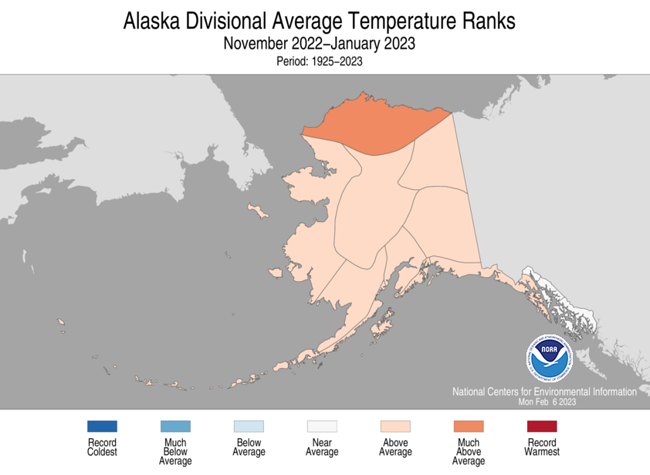
January temperatures were warmer than normal across the state. At the 2- to 3-month time scales, temperatures were near to cooler than normal in the panhandle, but warmer than normal across the rest of the state. Warmer-than-average temperatures dominated at longer time scales, when compared to the long-term (1926-2022) average. But when compared to more recent (1991-2020) normals, near to cooler-than-normal temperatures were evident at some eastern interior and panhandle stations because of a pronounced warming trend in recent decades (low elevation station temperature anomaly maps for the last 1, 2, 3, 4, 12 months) (climate division temperature rank maps for the last 1, 3, 6, and 12 months) (gridded temperature percentile maps for the last 1 and 3 months) (Leaky Bucket model temperature percentile map).
The winter snowpack covered the state. Snow water content (SWE) was near to above normal except for some SNOTEL stations in the south (satellite-based estimates of snow depth and SWE; SNOTEL station SWE percentile and SWE percent of normal; SNOTEL basin percent of normal SWE; SNOTEL station and basin percent of normal SWE). Monthly streamflow was mostly near to above normal for those streams that were not frozen, except for streams in the Aleutians.
Alaska was free of drought and abnormal dryness on the January 31, 2023 USDM map.
Puerto Rico and U.S. Virgin Islands


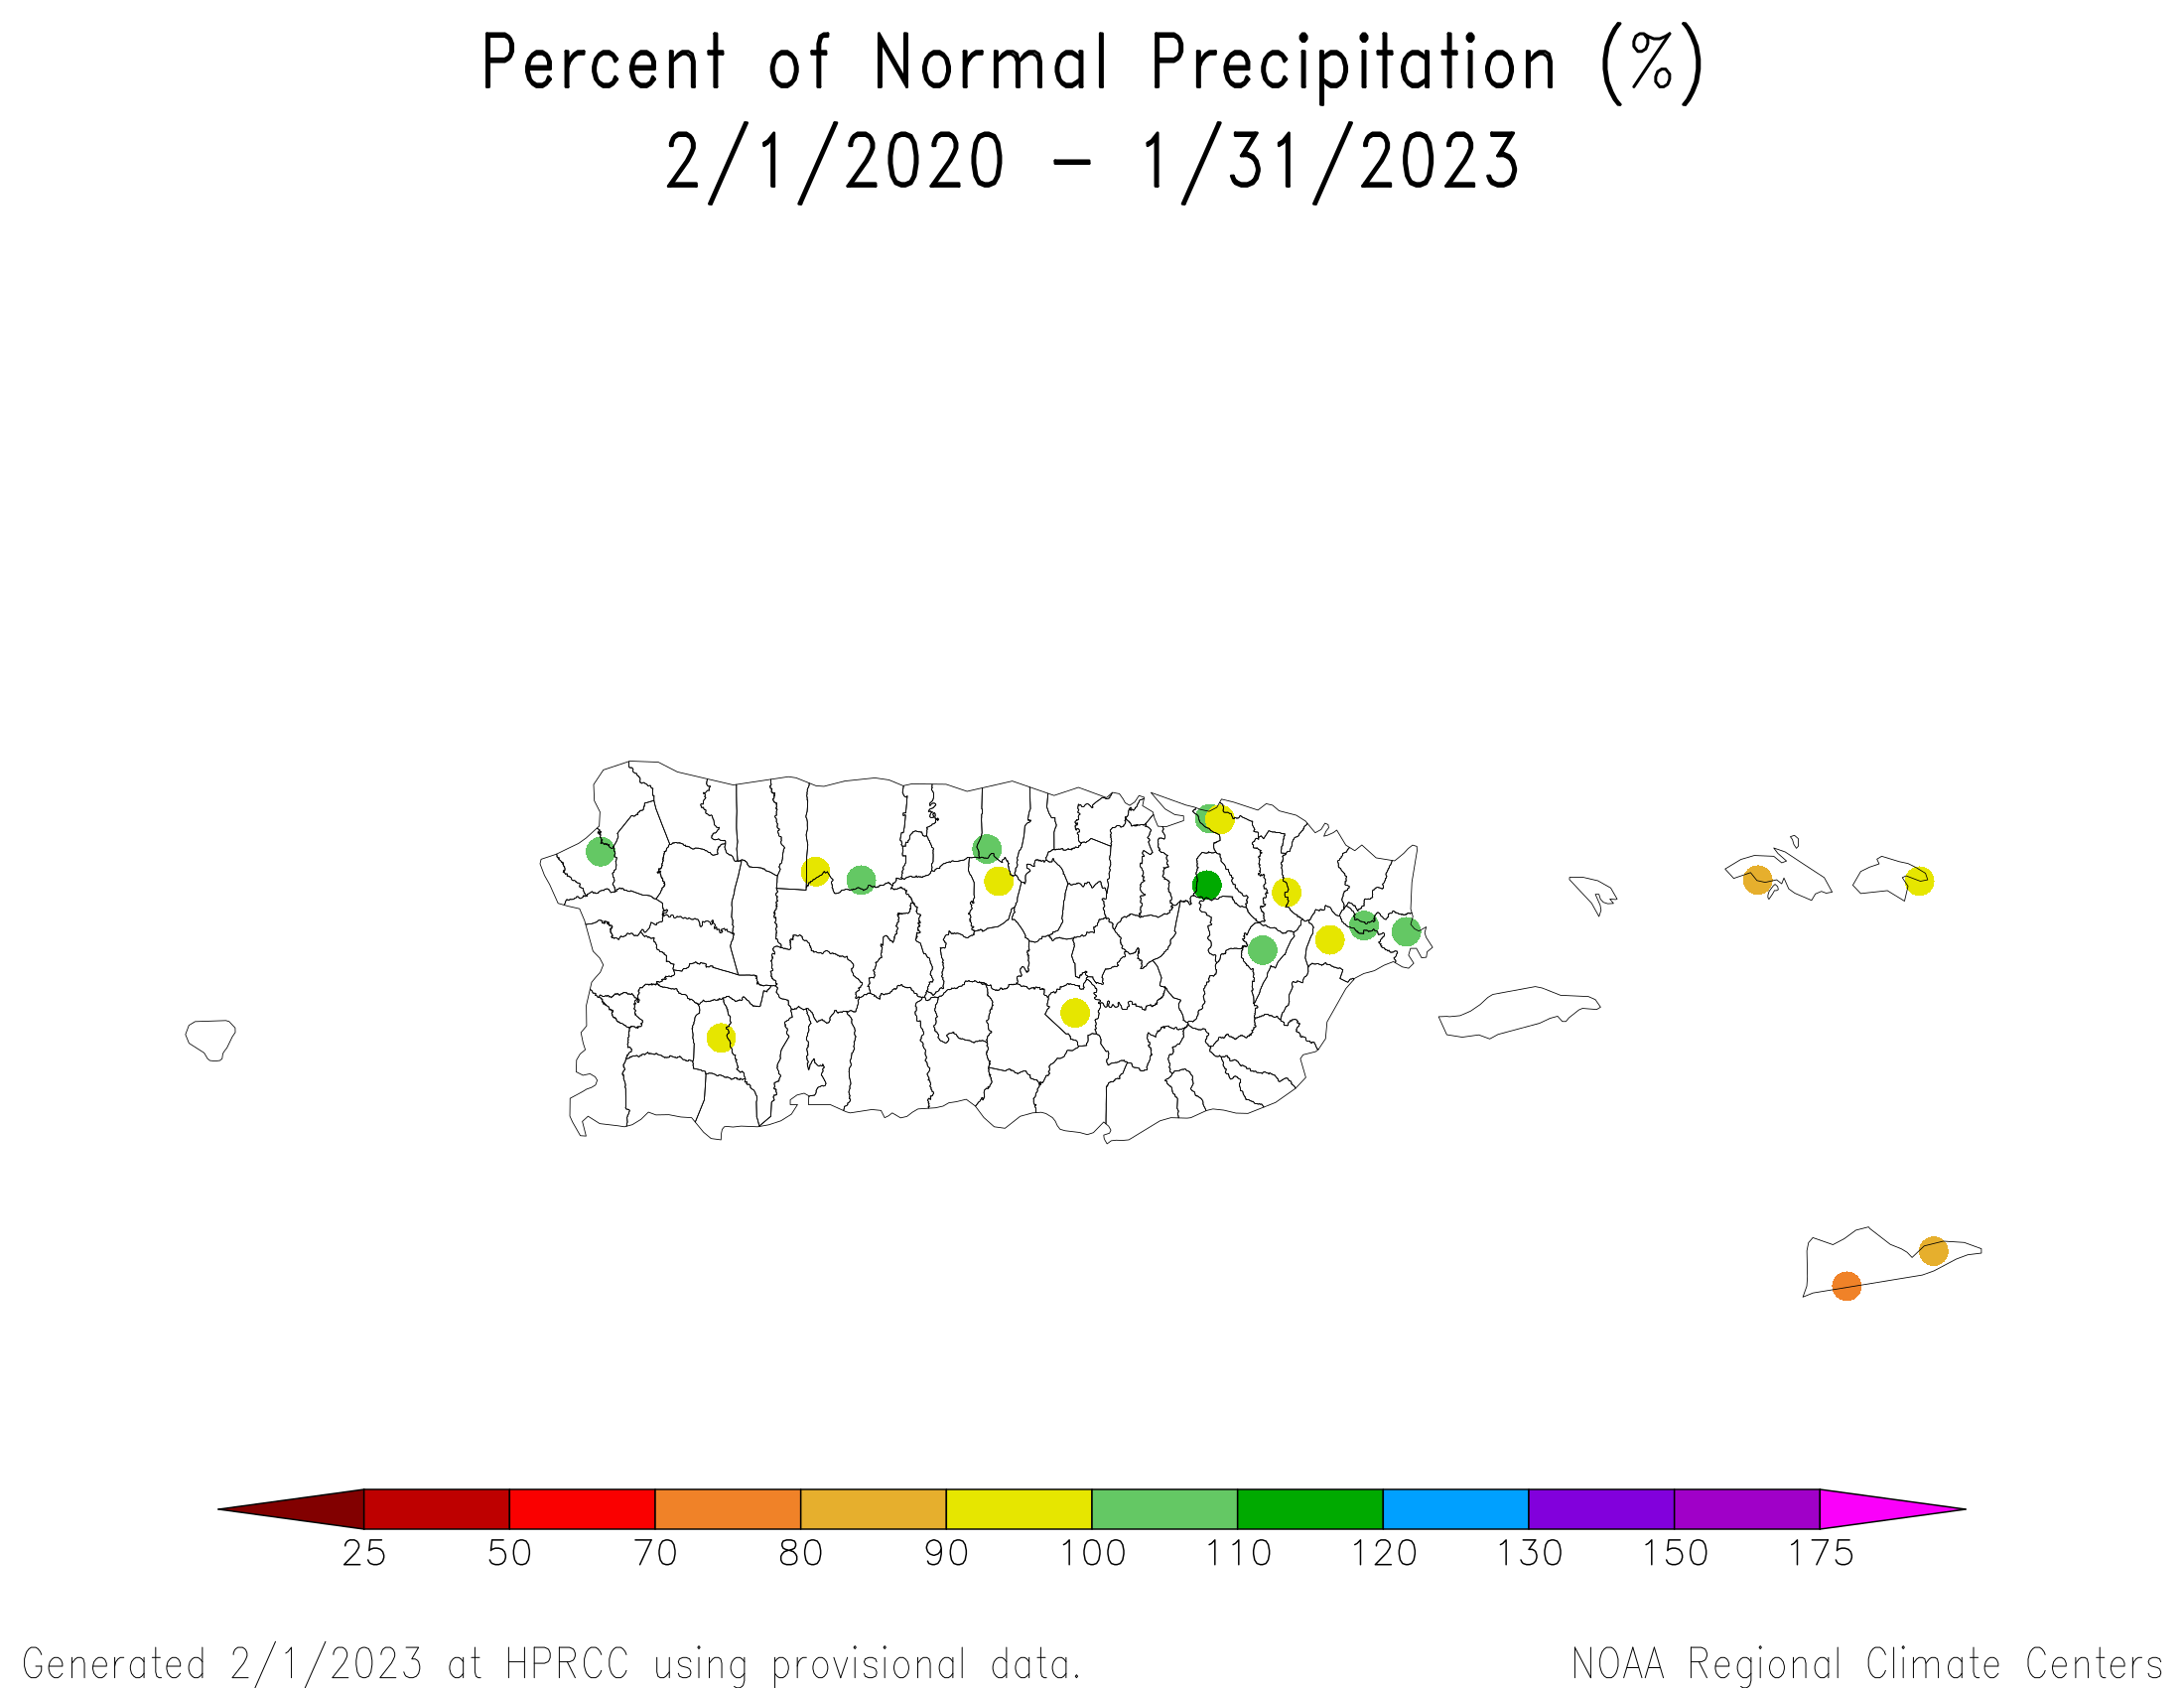
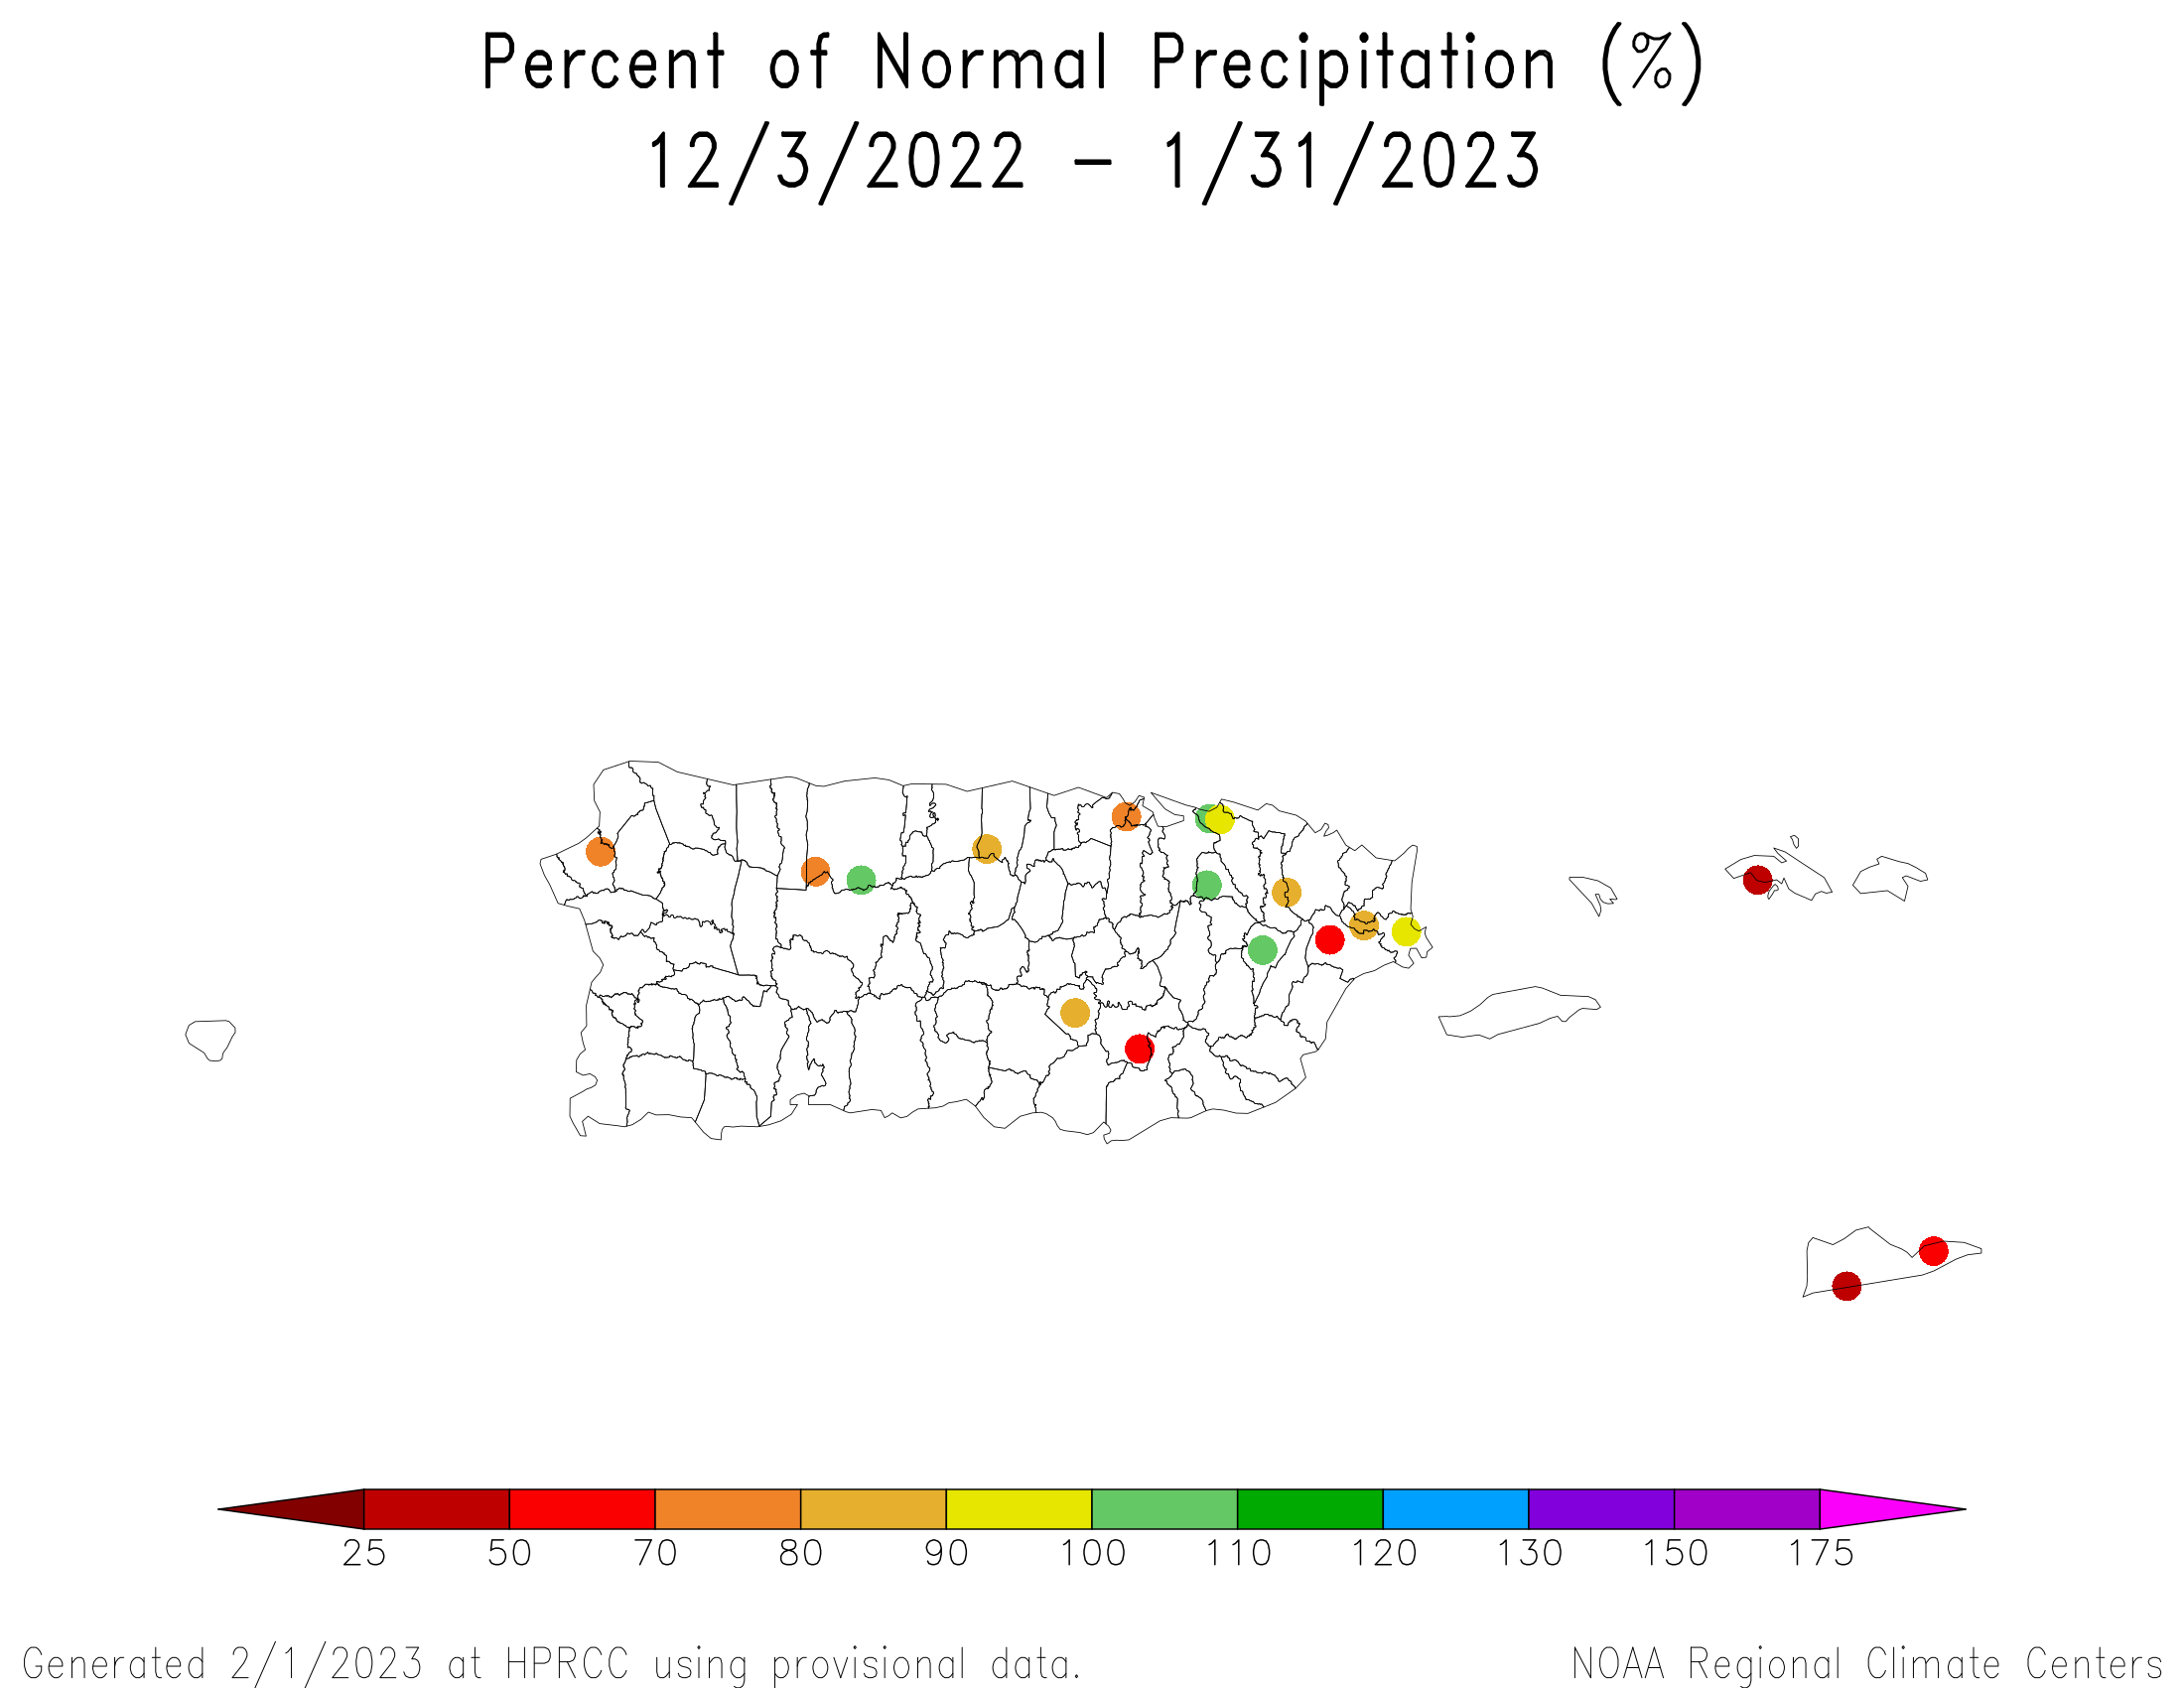
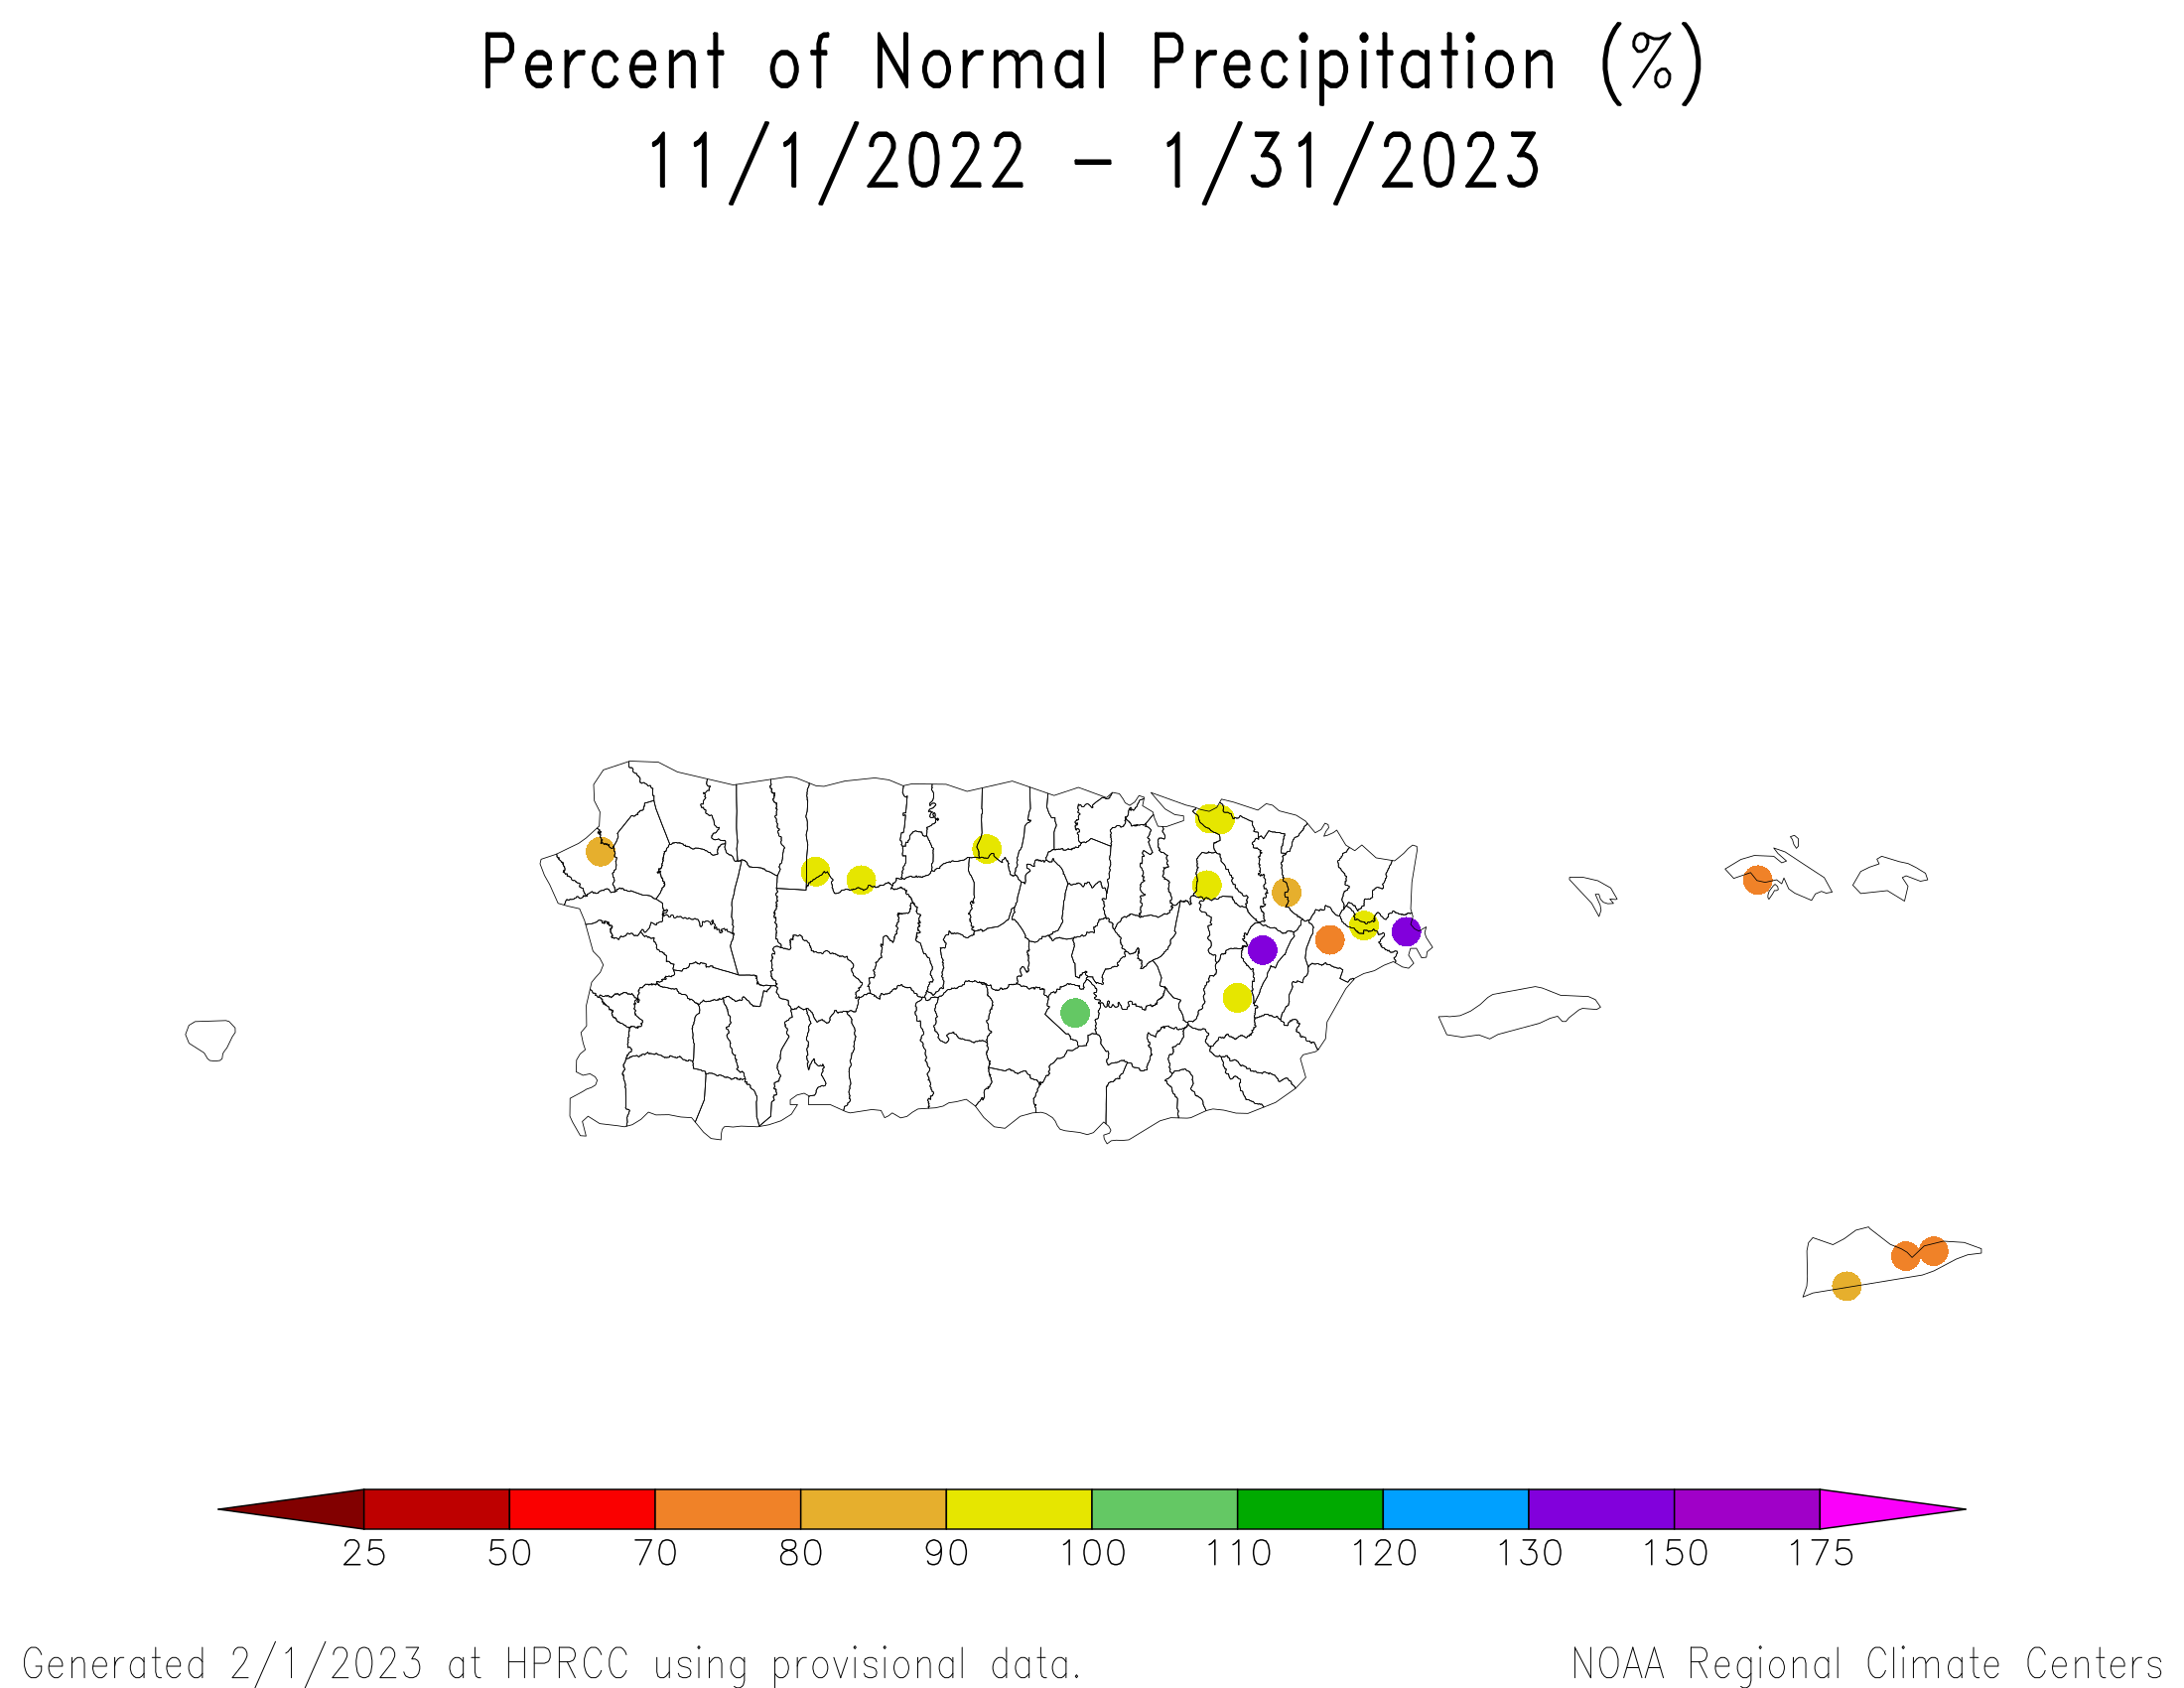
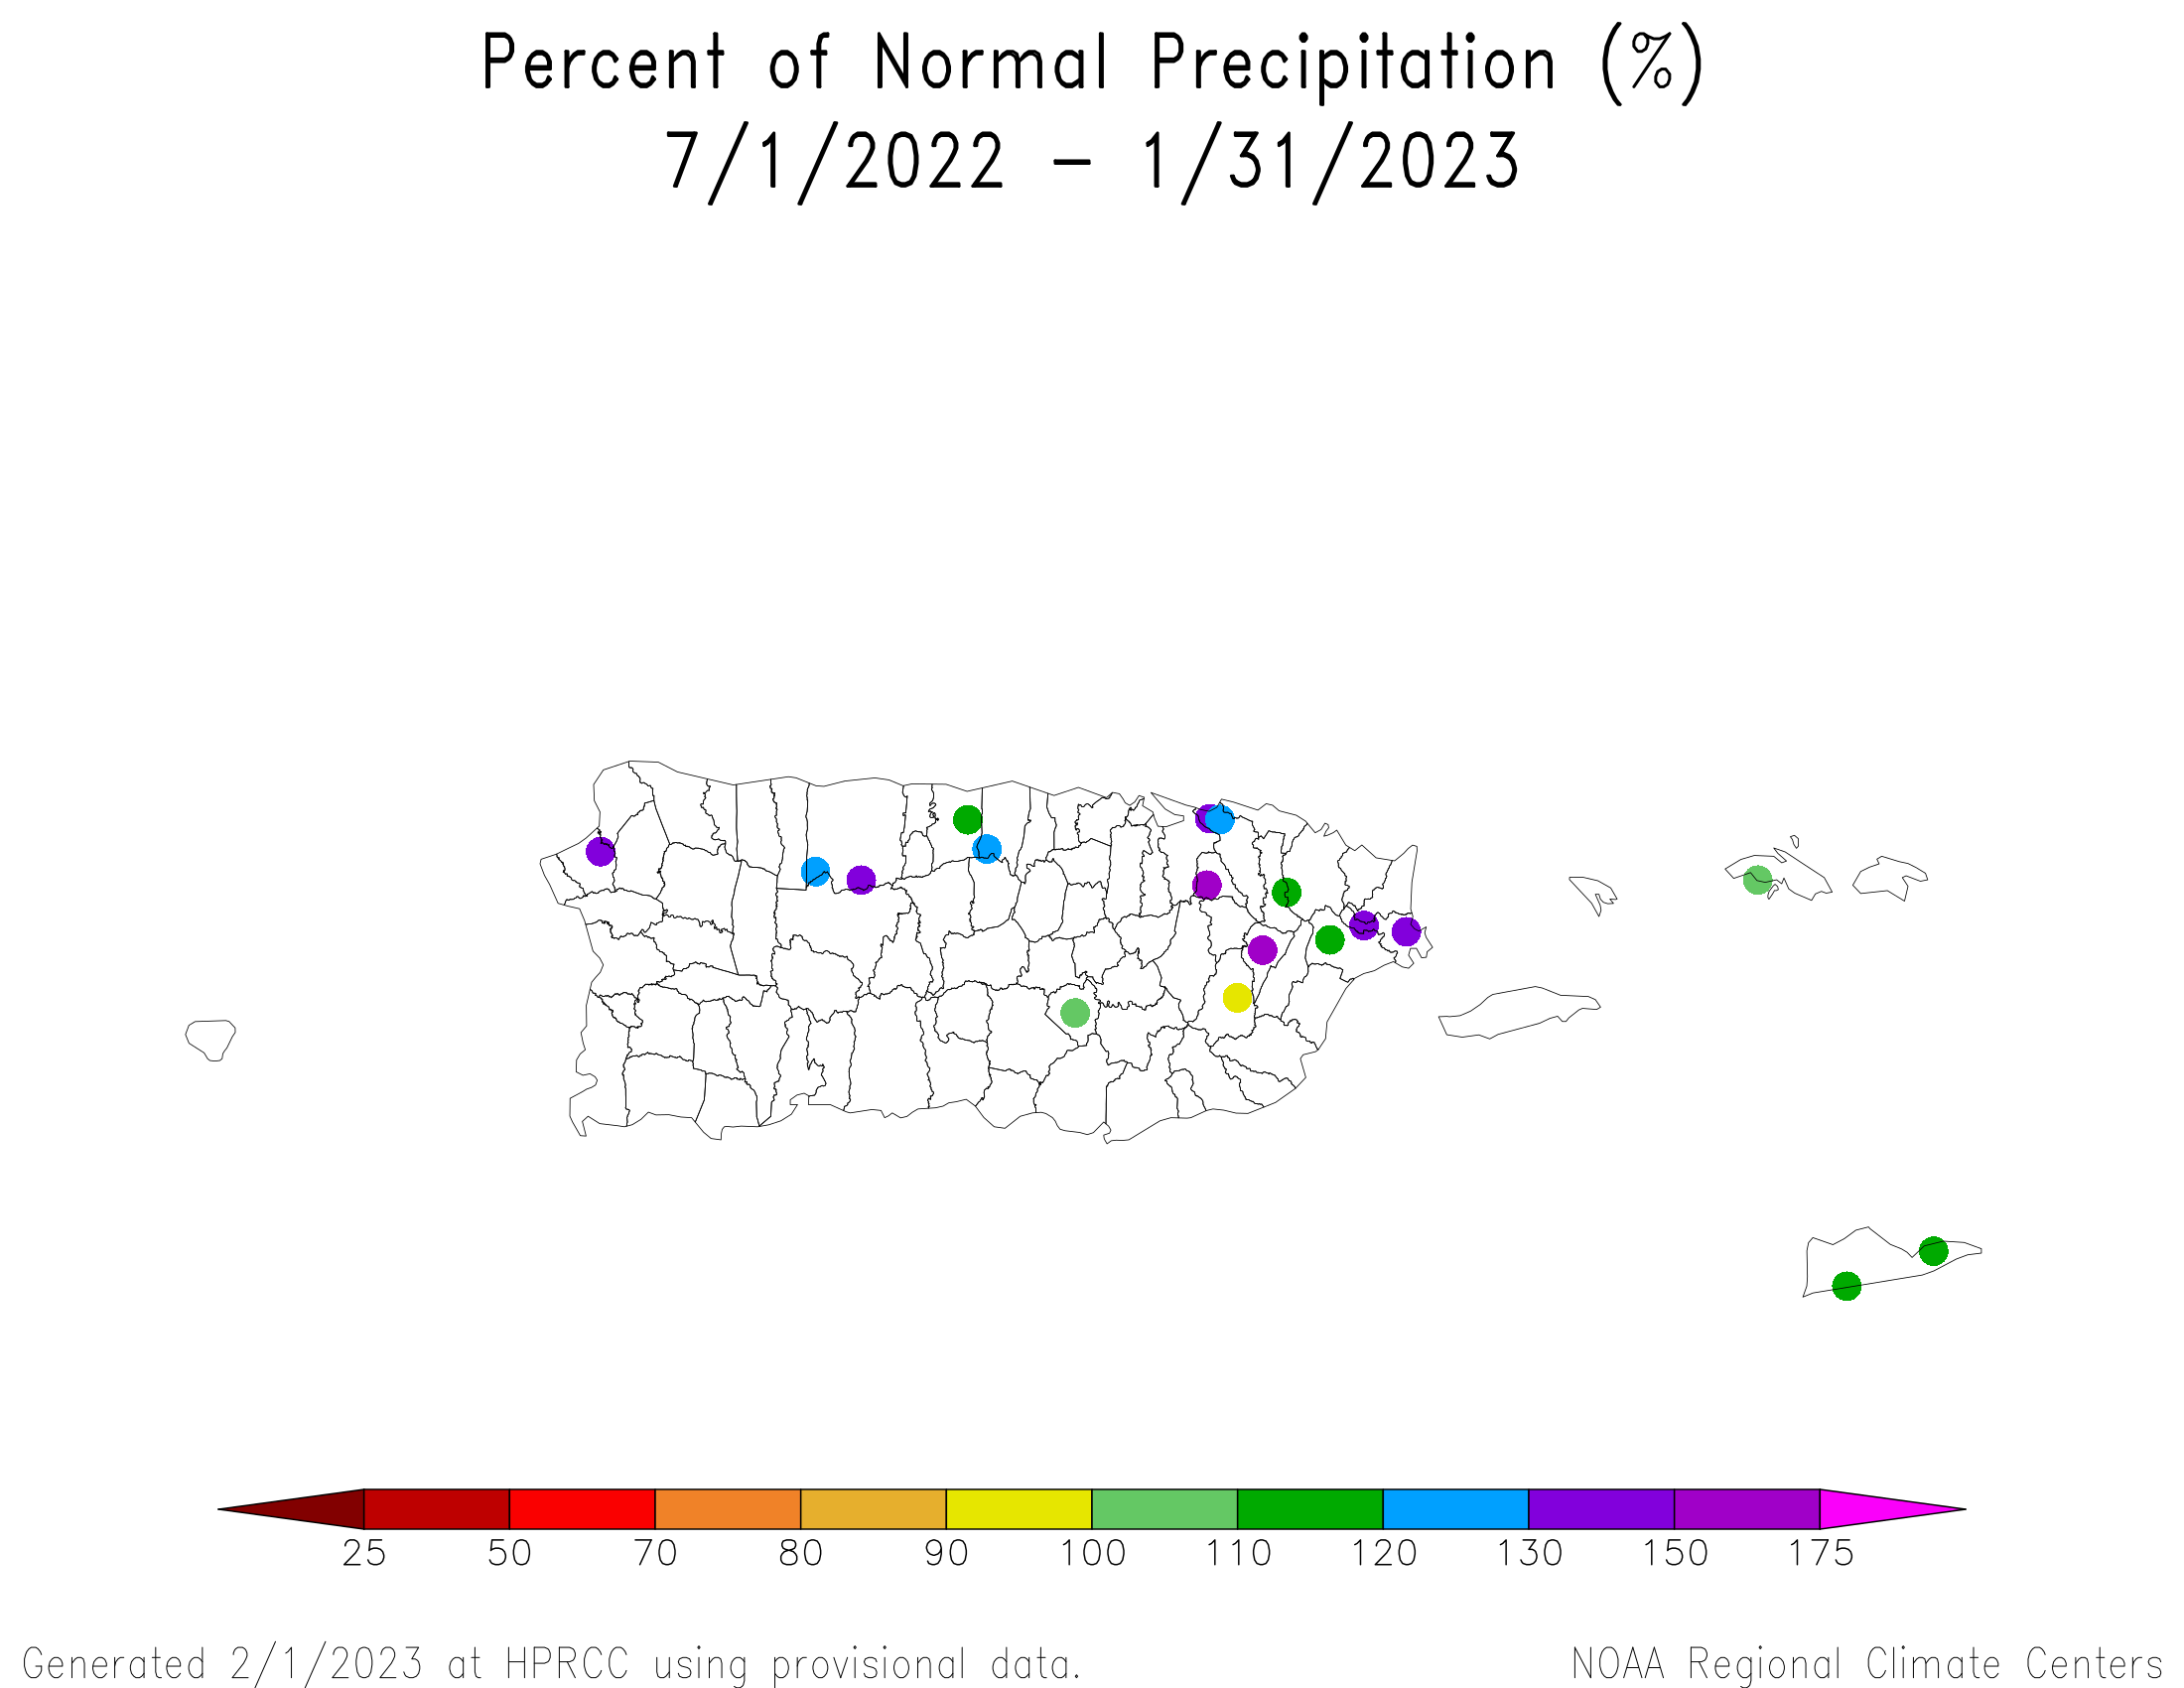
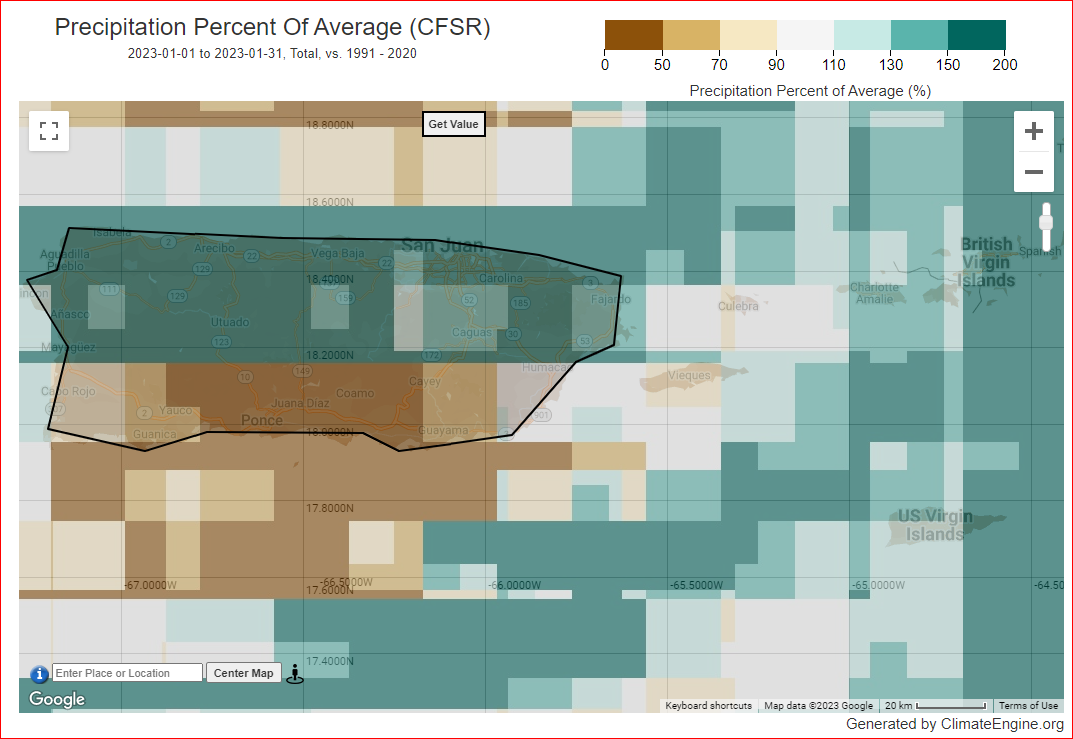
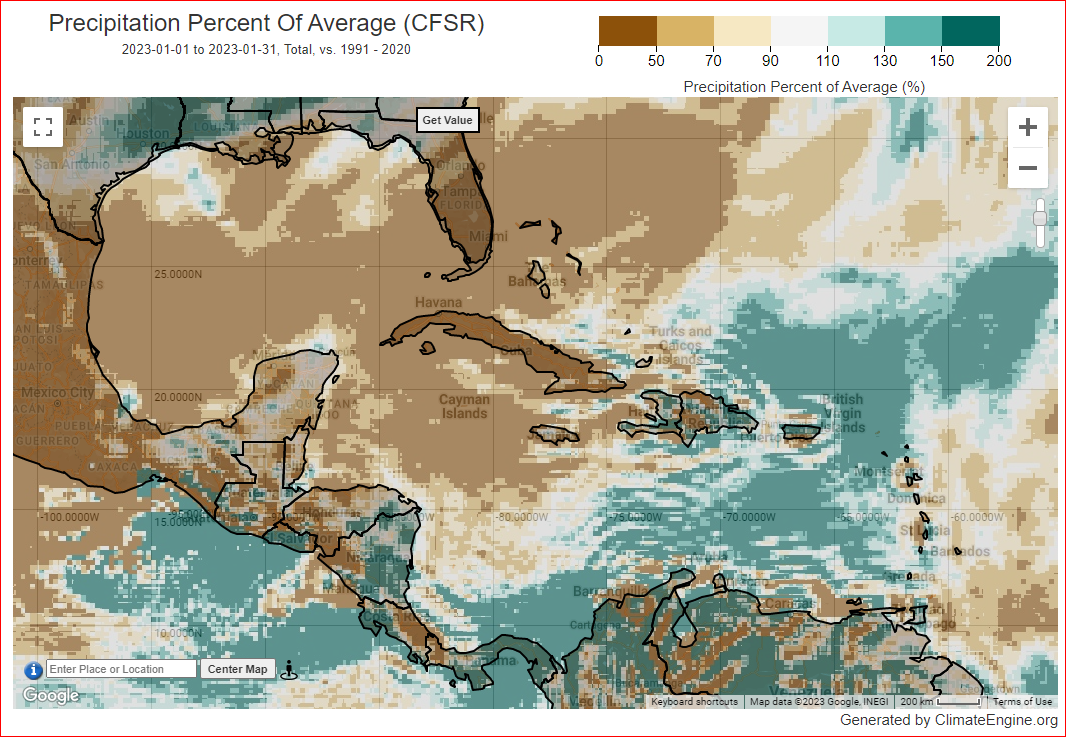
January 2023 was wetter than normal across most of Puerto Rico (PR) but drier than normal over the U.S. Virgin Islands (USVI). The last 2 months were mostly drier than normal except for wetter-than-normal conditions across parts of PR. The last 3 months were drier than normal across the USVI and northern PR, but wetter than normal over southern PR. Wetter-than-normal conditions were prevalent over PR but the USVI were still drier than normal. It was wetter than normal across the region at the 6- to 7-month time scales. Drier-than-normal conditions returned to the USVI and southern PR at 9 to 10 months. A mixed pattern dominated at 12 months, but drier-than-normal conditions were more widespread at longer time scales (radar-based precipitation anomaly estimates for the last 1, 2, and 3 months) (low elevation station precipitation maps for the last 1, 2, 3, 4, 6, 7, 9, 10, 12, 24, 36, 48, 60 months) (climate engine model percent of normal precipitation map for the last month: PR and USVI, Caribbean and Gulf of Mexico region).
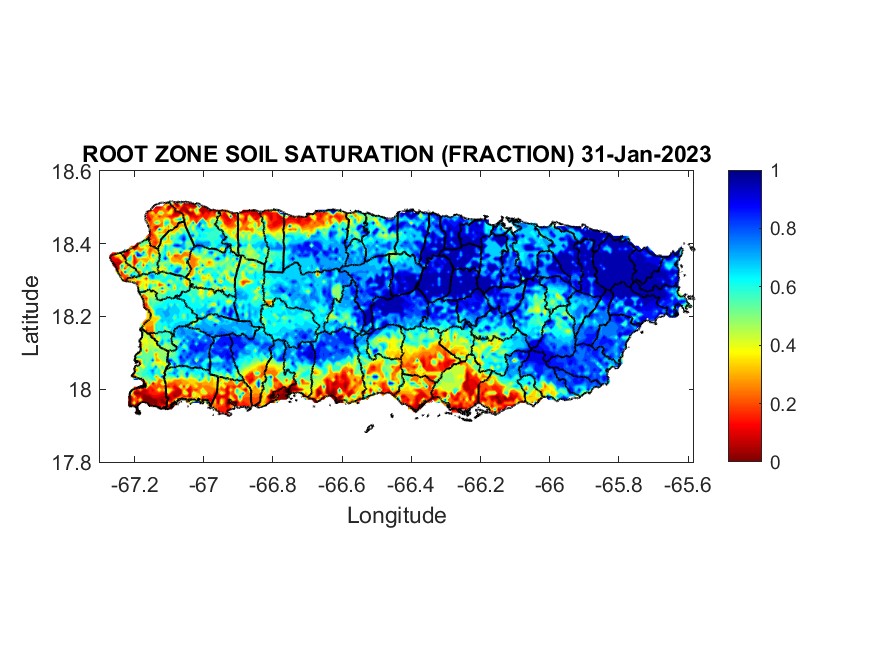
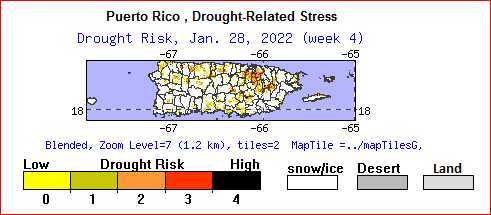
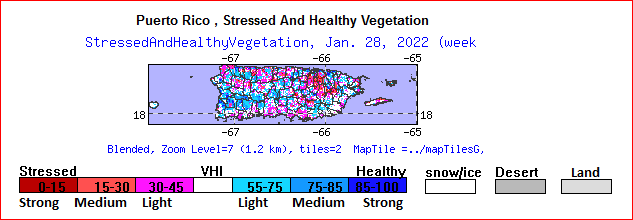
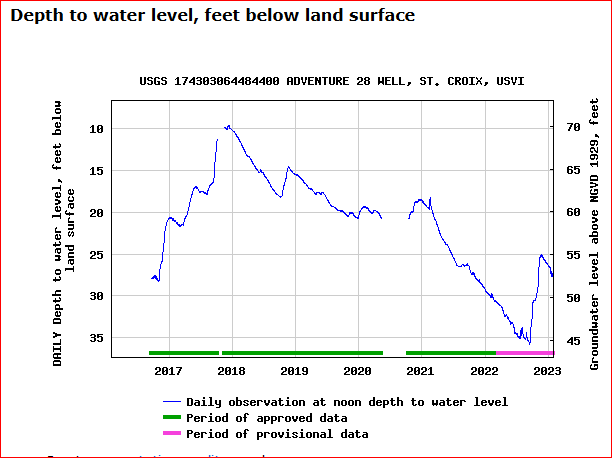
Root zone analyses indicated that soil conditions were moist across eastern and interior portions of PR, but dry along the southern and northwest coasts of PR (root zone soil saturation fraction); satellite-based analyses indicated that top layers of the soil were drying out across the USVI and PR, but deeper soils were still moist (relative soil moisture at 0-10 cm [0-4 in], 10-40 cm [4-16 in], 40-100 cm [16-39 in], 100-200 cm [39-79 in] depth). Satellite analyses showed a few areas of vegetative stress due to drought (VHI for PR and USVI, drought risk for PR and USVI, stressed vegetation for PR and USVI). Monthly streamflow on PR was near to above normal across the island. In the USVI, for the most part, groundwater steadily declined during January (St. Thomas, St. Croix, St. John). The end-of-January groundwater level was in mid-range (below previous peaks and above recent low levels) on all three islands (St. Thomas, St. Croix, St. John).
In the USVI, abnormal dryness continued on St. Thomas and St. Croix but ended on St. John, while abnormal dryness covered about 15.7% of PR on the January 31, 2023 USDM map, a little less than last month.
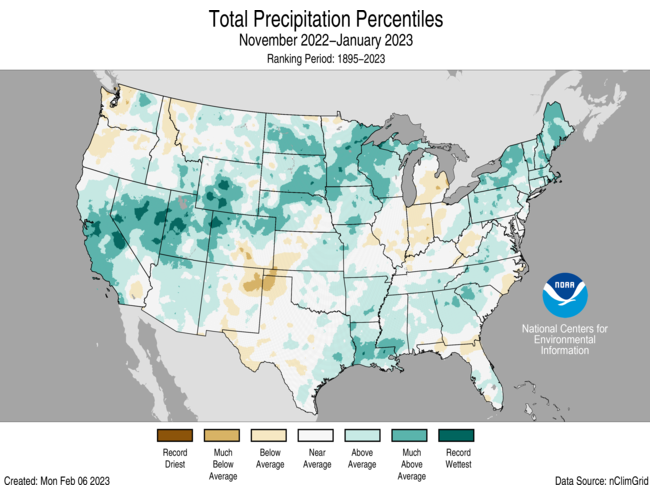
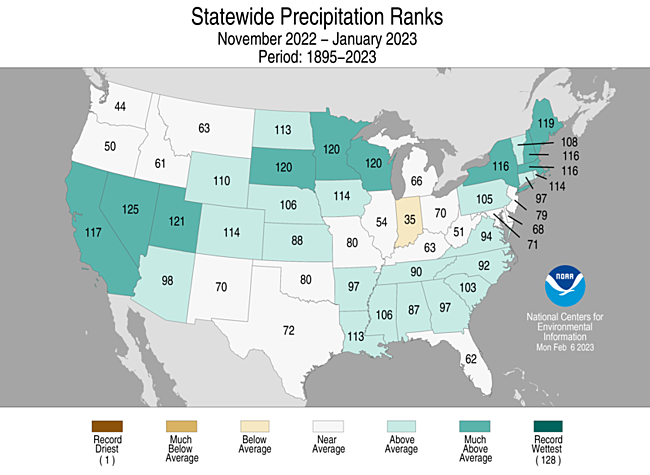
CONUS State Precipitation Ranks
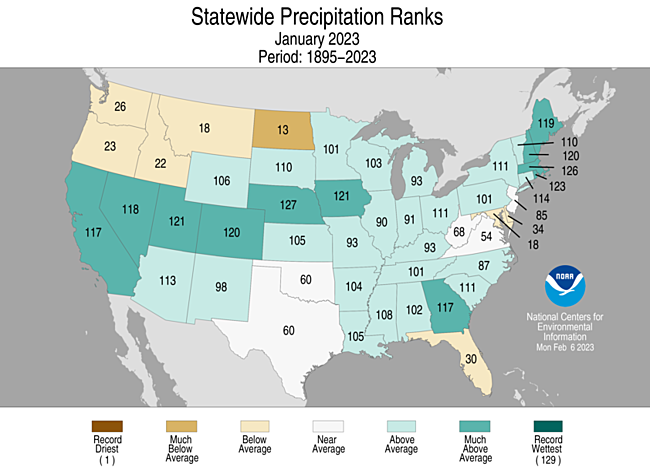
January 2023 was drier than normal in the Pacific Northwest to northern Plains, across the southern Plains, in most of Florida and over parts of the Mid-Atlantic, with locally near-record dryness in southern Florida and parts of the northern Plains. Precipitation was above normal from California to the central Plains and Upper Mississippi Valley, from the Lower Mississippi Valley to Northeast, and the interior Southeast, with record wet conditions in the central Plains. Only eight states had a precipitation rank in the driest third of the 129-year historical record for January, none of which ranked in the top ten driest category, but North Dakota came close at 13th driest.
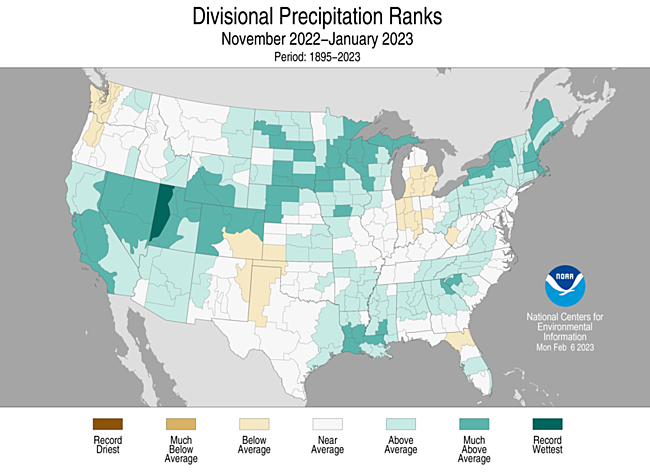
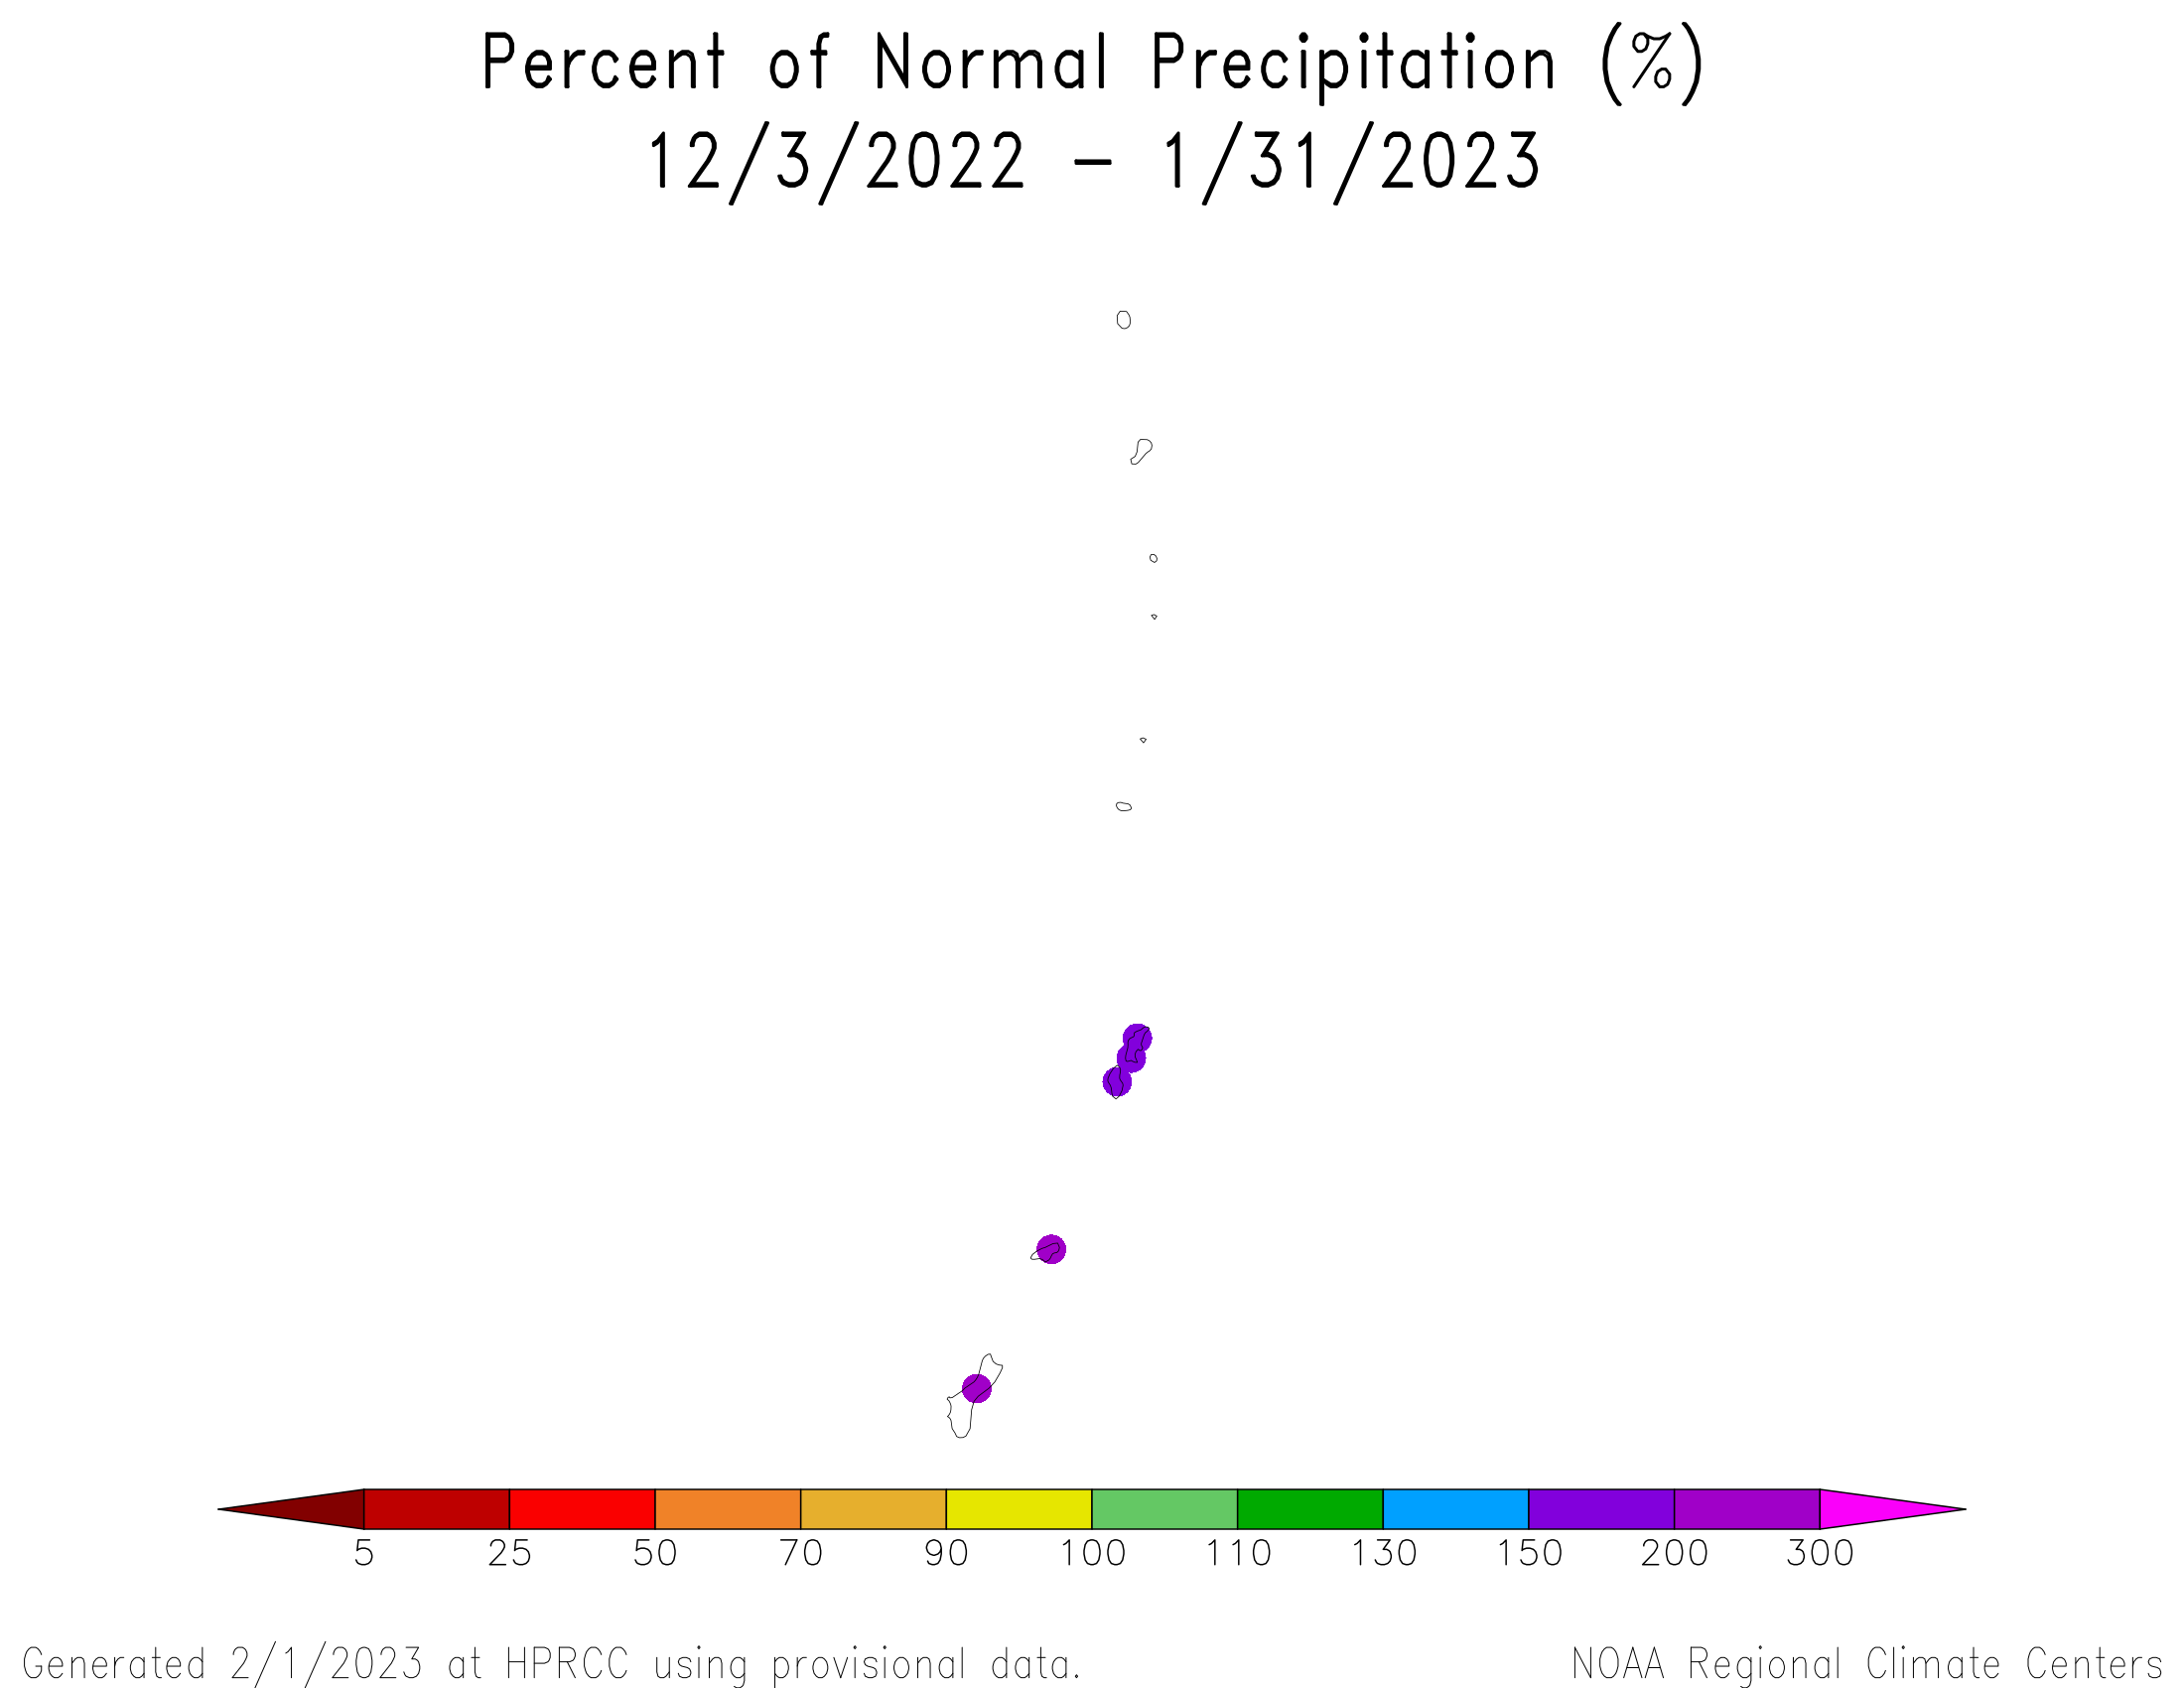
November 2022-January 2023 was drier than normal in parts of the Pacific Northwest, Ohio Valley to southern Great Lakes, and central Appalachians; along the Southeast Coast, and in the southern to central High Plains from New Mexico to western Kansas. Only one state had a precipitation rank in the driest third of the historical record for November-January because above-normal precipitation fell across parts of the states where dry conditions occurred, skewing their ranks.

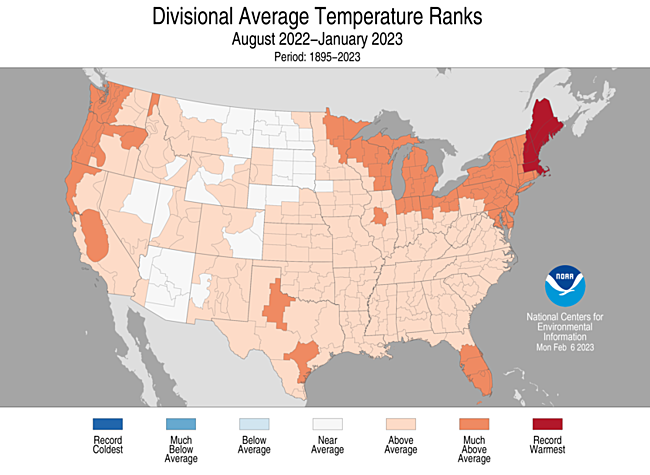
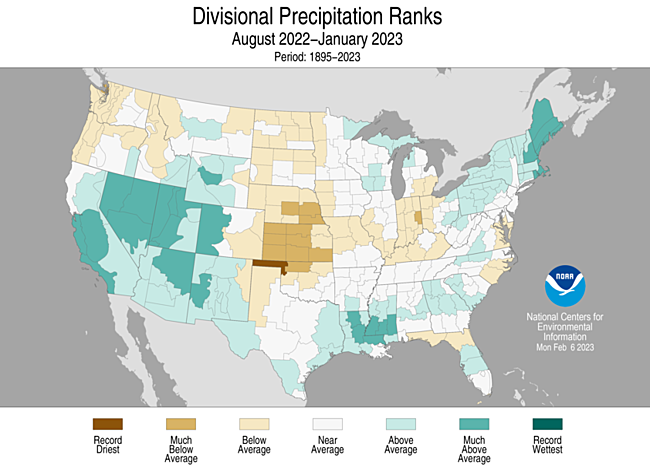
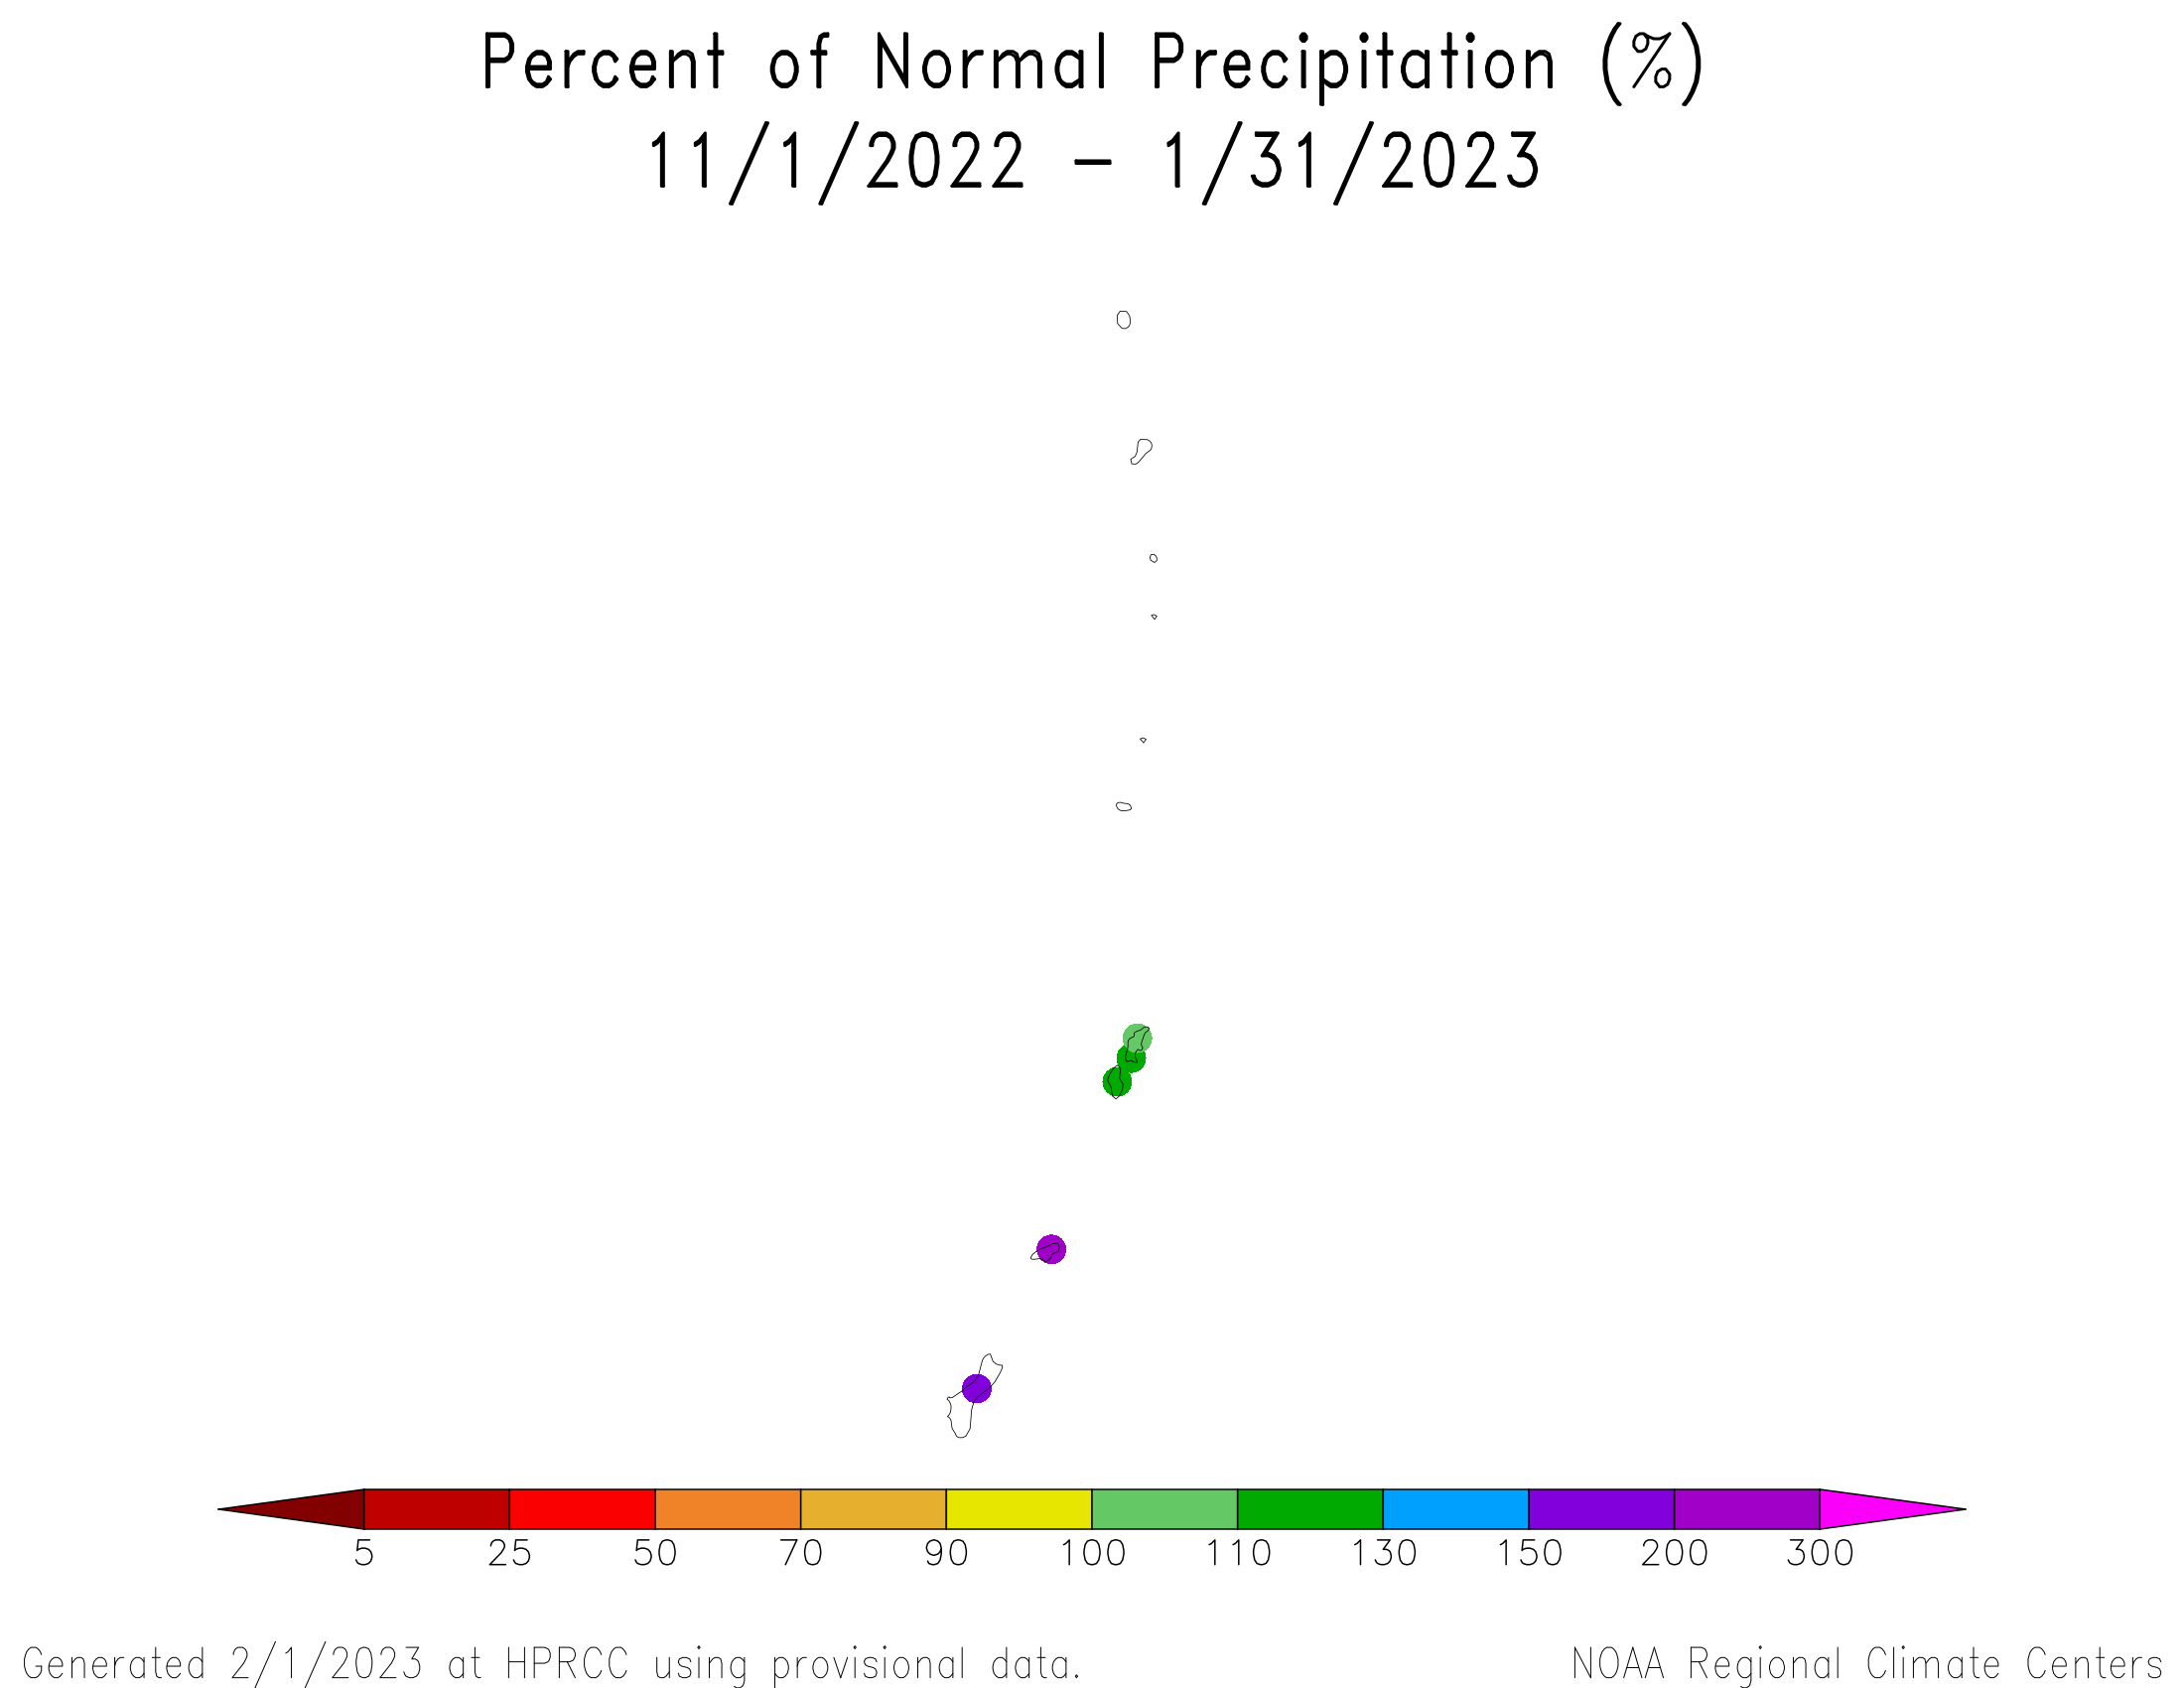
August 2022-January 2023 was drier than normal in the Pacific Northwest, Ohio Valley to southern Great Lakes, coastal Southeast to Mid-Atlantic, and most of the Great Plains, with record dryness occurring in the Oklahoma panhandle. Eleven states had a precipitation rank in the driest third of the historical record for August-January, with two ranking in the top ten driest category — Kansas (fourth driest) and Nebraska (seventh driest).
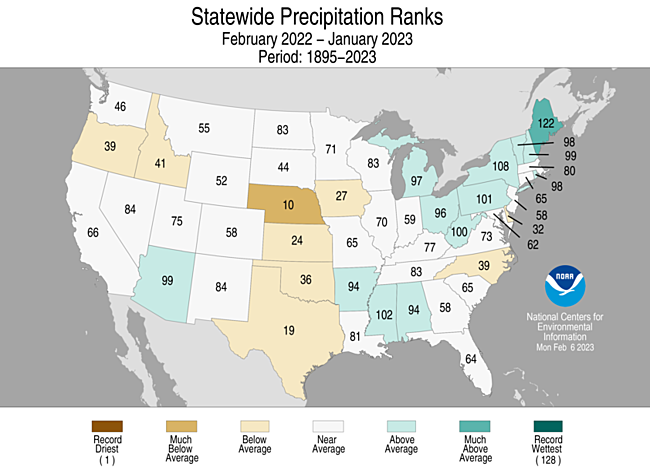

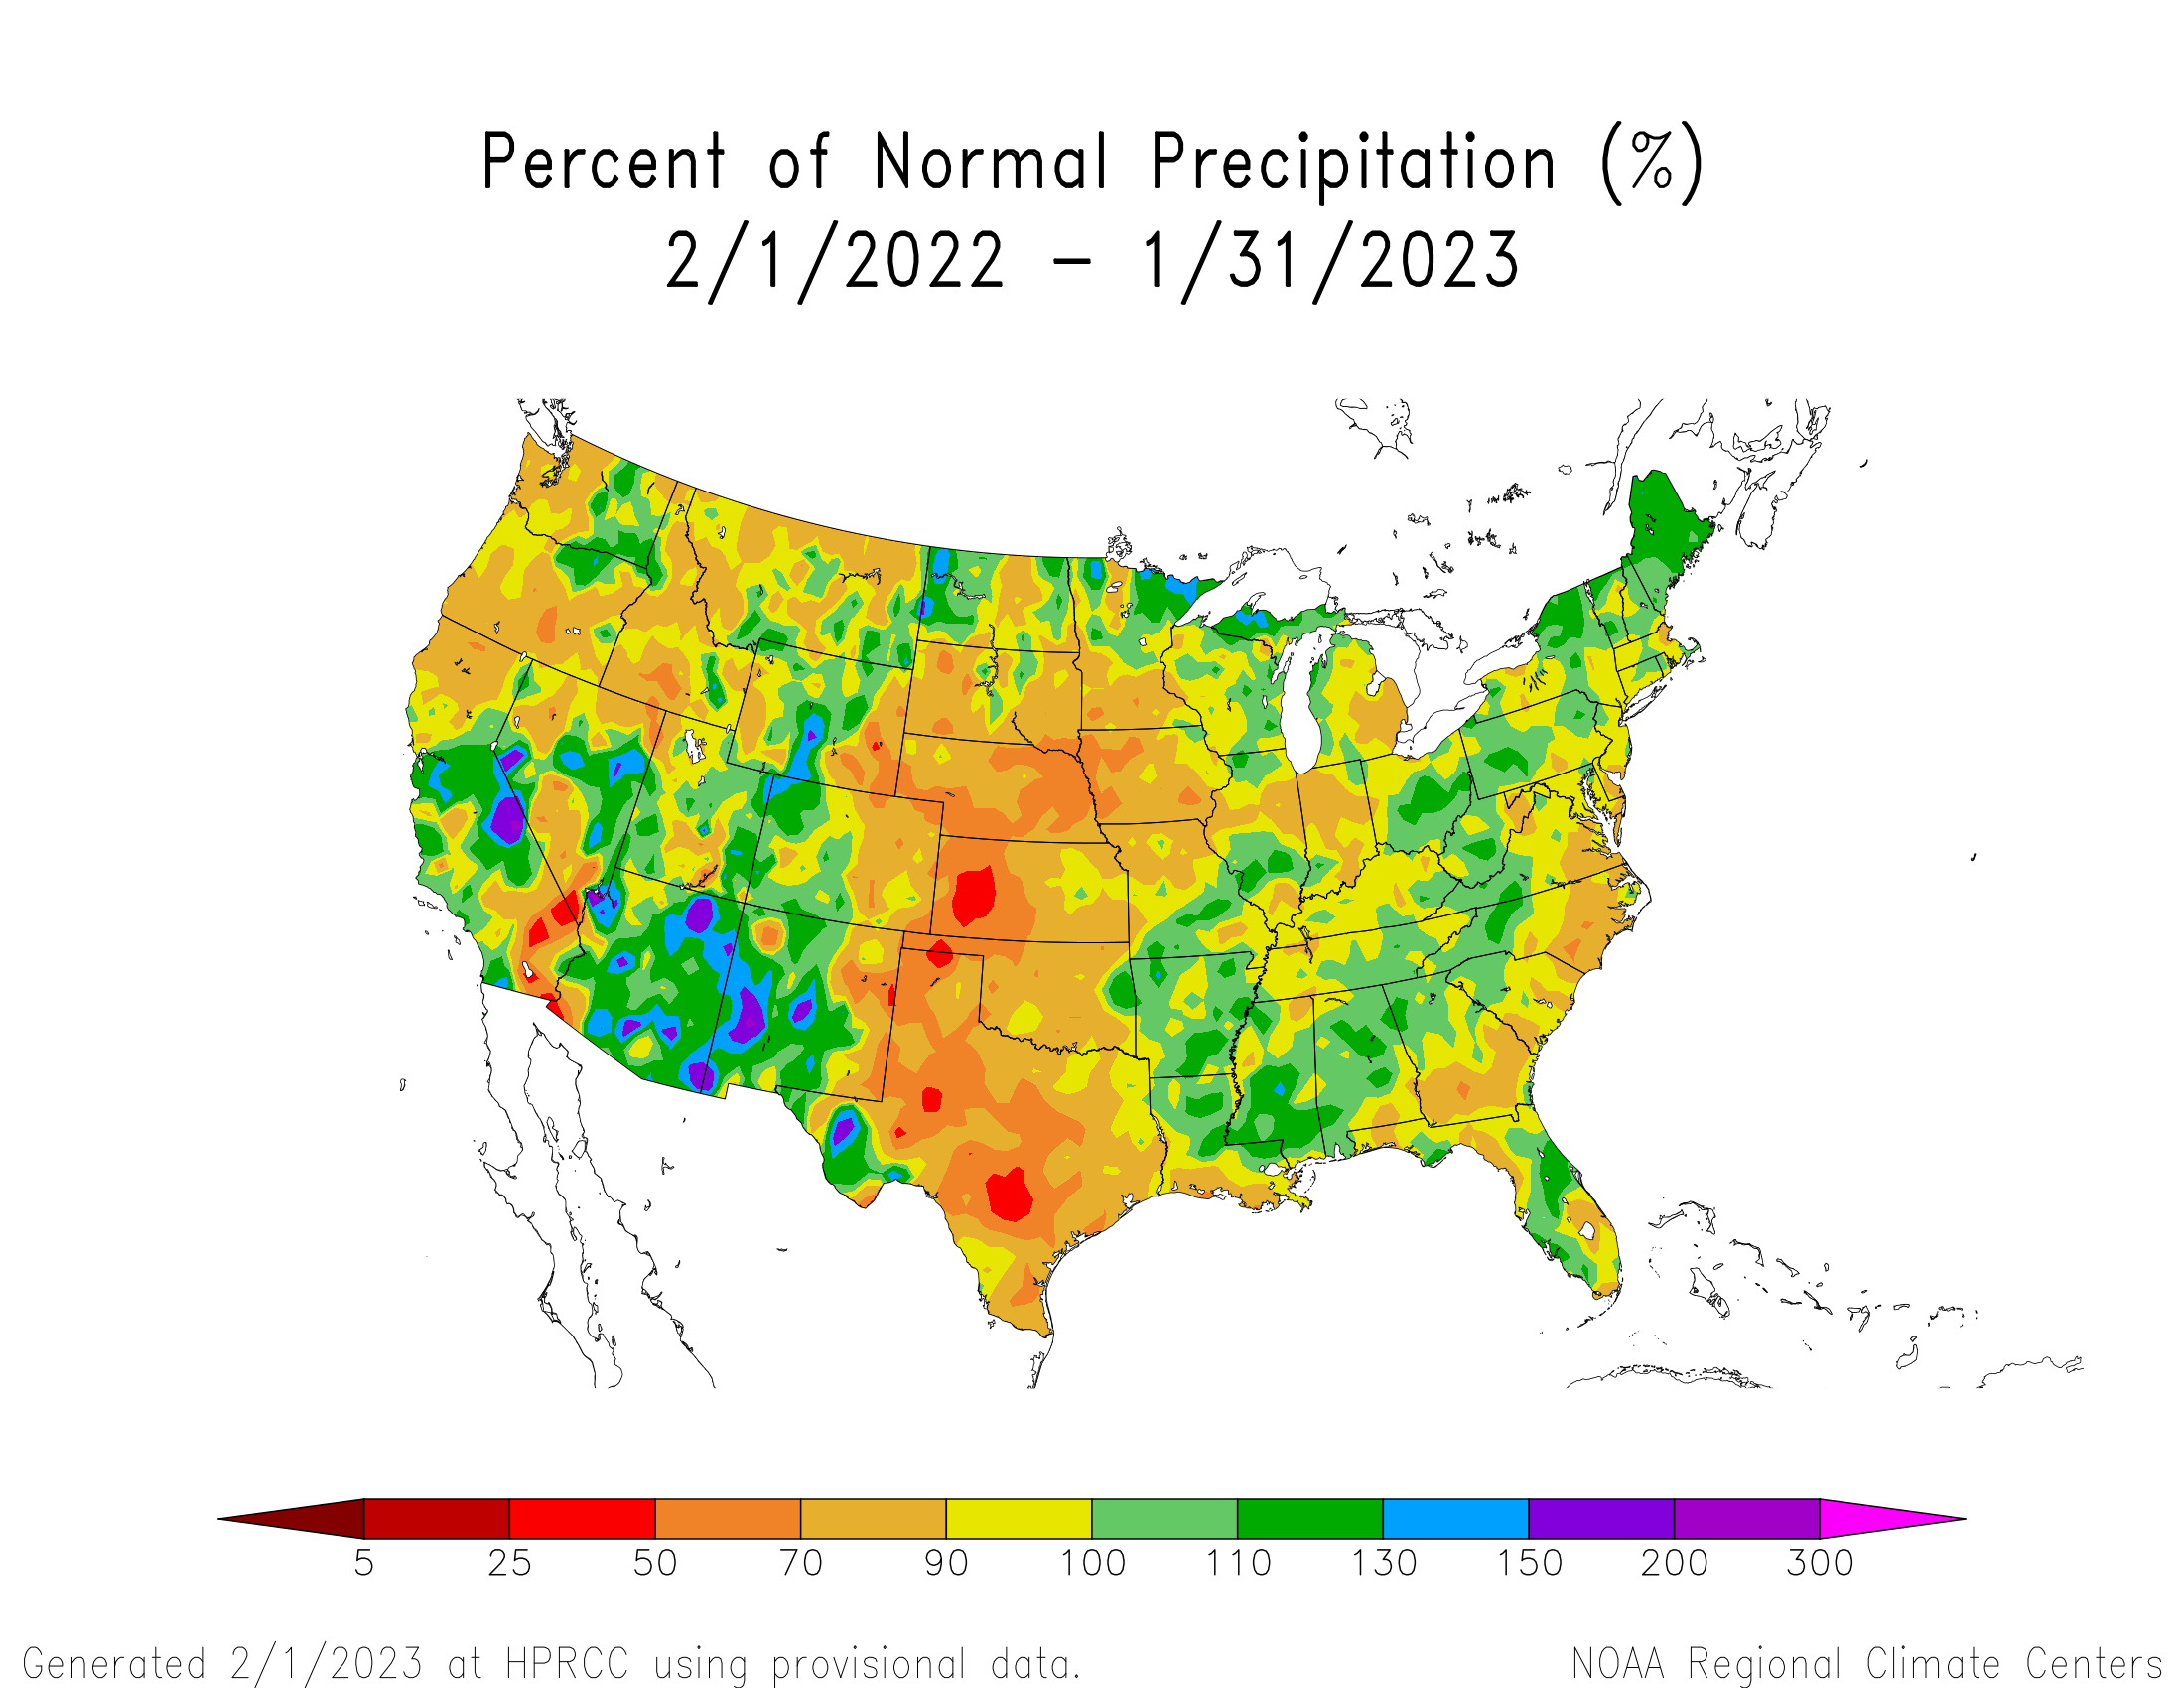
February 2022-January 2023 was drier than normal in the Pacific Northwest, Ohio Valley to southern Great Lakes, coastal Southeast to Mid-Atlantic, and most of the Great Plains. Nine states had a precipitation rank in the driest third of the historical record for February-January, with one ranking in the top ten driest category — Nebraska at tenth driest.
Agricultural Belts


During January 2023, the Primary Hard Red Winter Wheat agricultural belt was generally wetter and near to cooler than normal in the north, and drier and warmer than normal in the south. The month ranked as the 30th wettest and 32nd warmest January, regionwide, in the 1895-2023 record.
October marks the beginning of the growing season for the Primary Hard Red Winter Wheat belt. October 2022-January 2023 was mostly drier than normal and generally cooler than normal in the north and near to warmer than normal in the south. The period ranked as the 53rd driest and 49th warmest October-January, regionwide, on record.
According to the U.S. Department of Agriculture (USDA), as of January 31, 2023, drought affected approximately 60% of barley production, 45% of corn production, 41% of cotton production, 20% of rice production, 75% of sorghum production, 37% of soybean production, 64% of spring wheat production, 58% of winter wheat production, 40% of hay acreage, 55% of the cattle inventory, 43% of the milk cow inventory, and 45% of the sheep inventory. These are all less than the values last month.
U.S.-Affiliated Pacific Islands
The NOAA National Weather Service (NWS) offices, the Pacific ENSO Applications Climate Center (PEAC), and partners provided reports on conditions across the Pacific Islands.
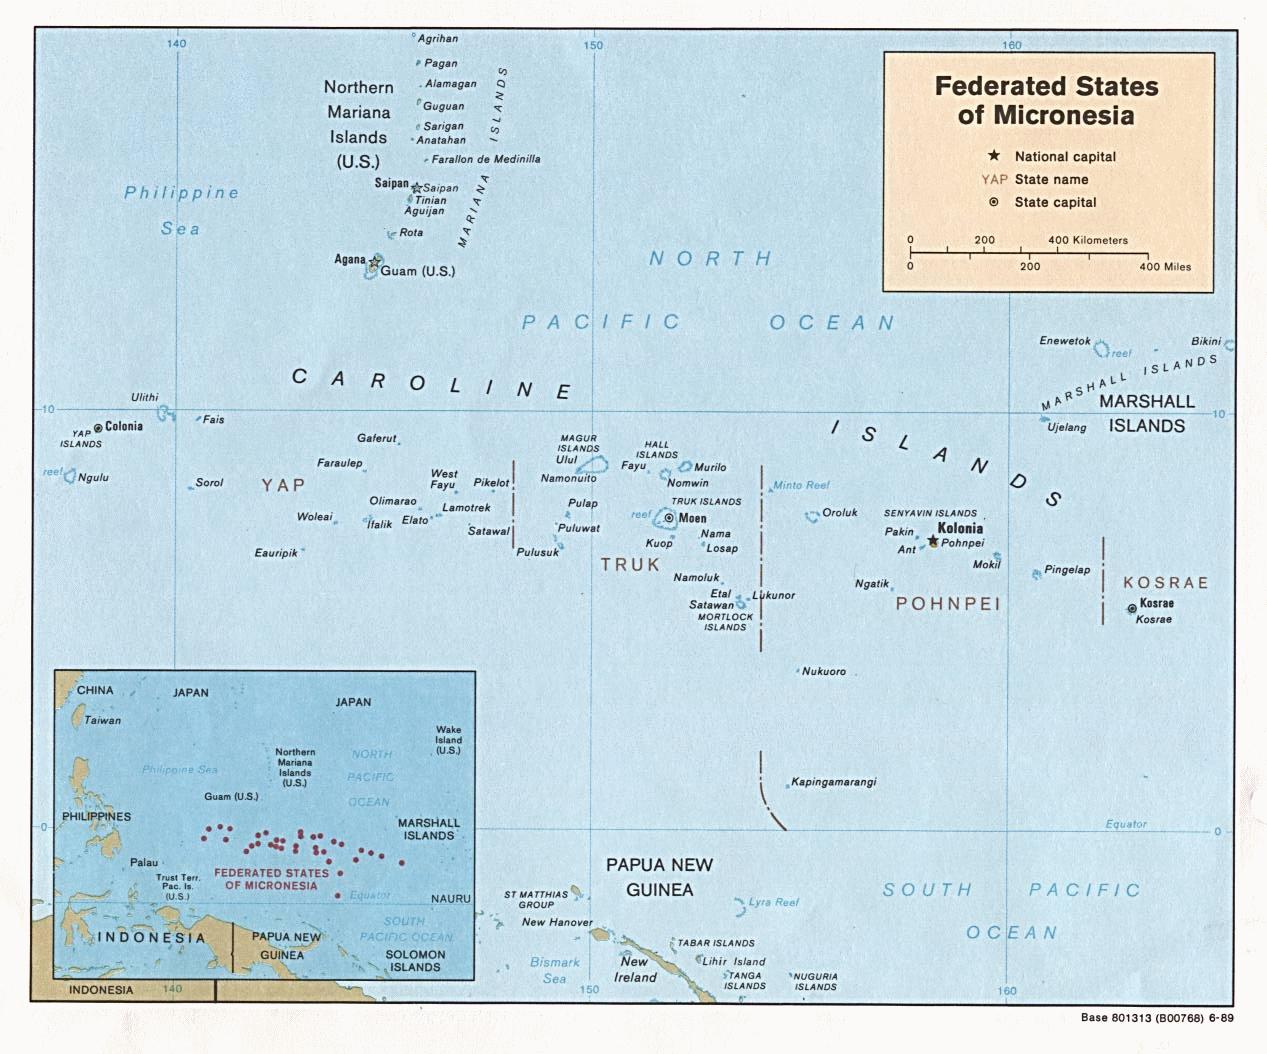
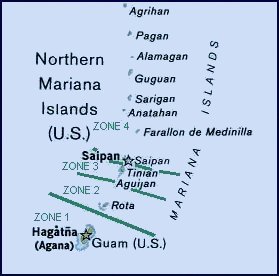
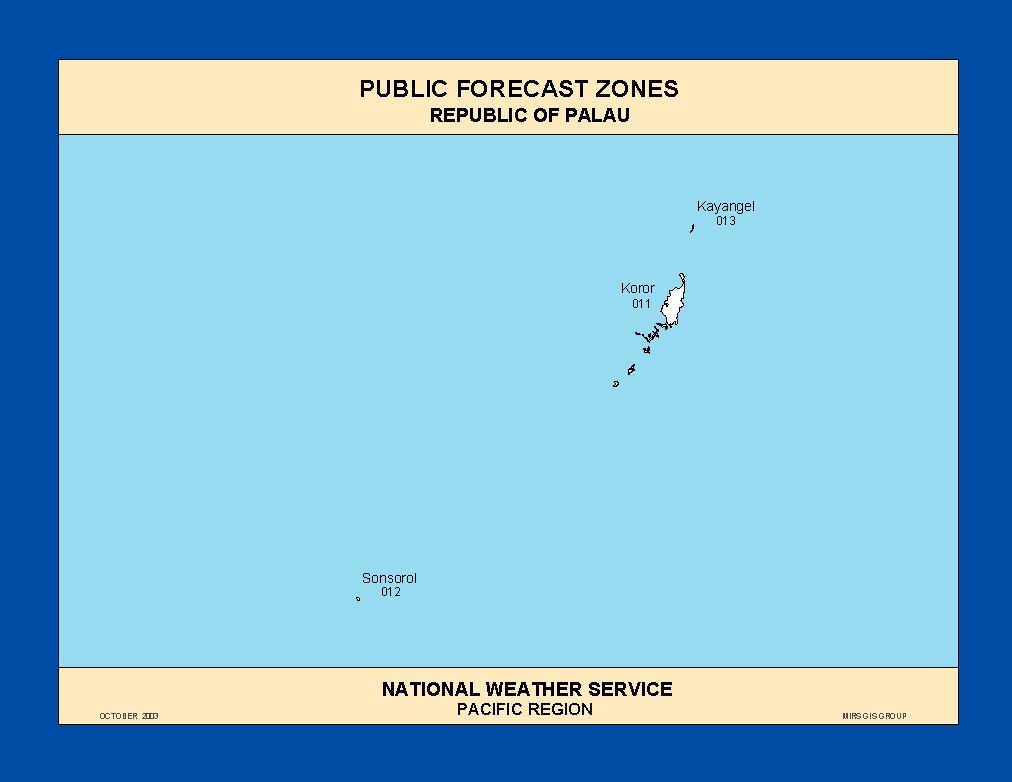
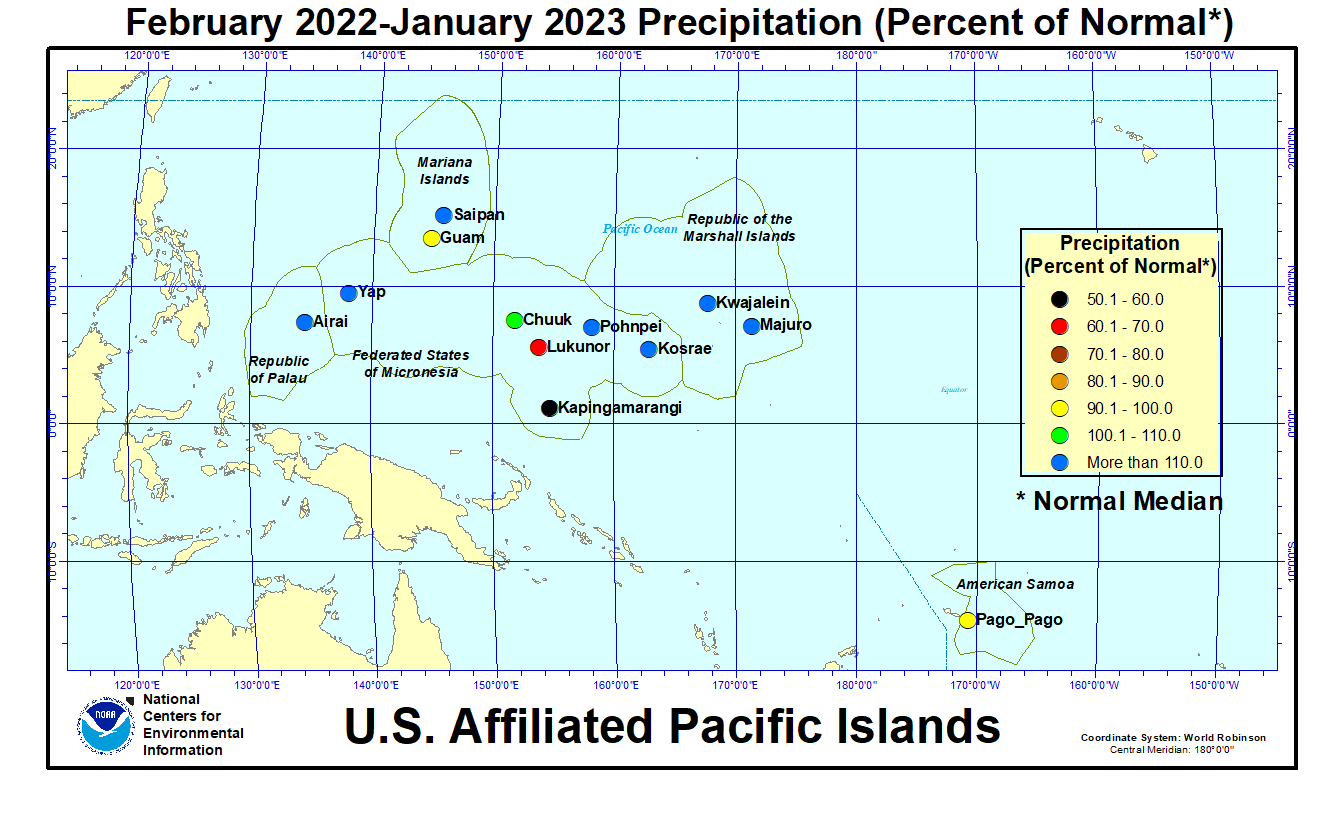
In the U.S. Affiliated Pacific Islands (USAPI) (maps — Federated States of Micronesia [FSM], Northern Mariana Islands, Marshall Islands [RMI], Republic of Palau, American Samoa, basinwide), January 2023 was drier than normal in the central FSM, and near to wetter than normal almost everywhere else.
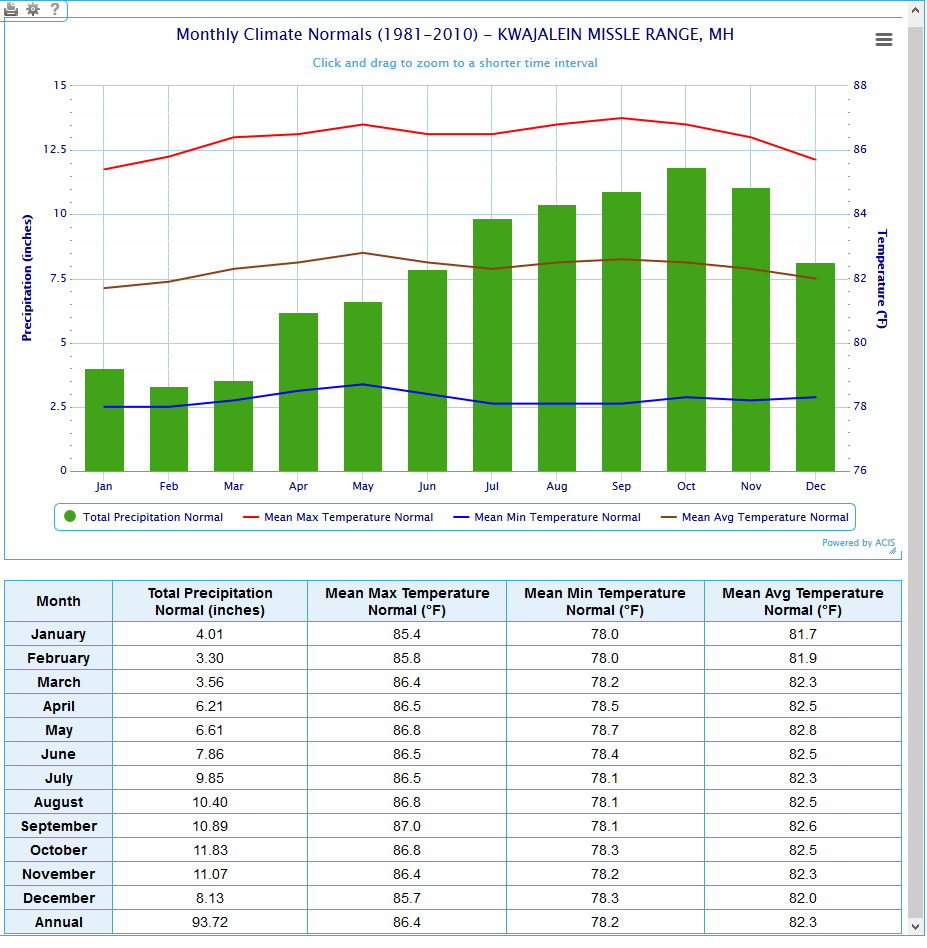
Monthly precipitation amounts were below the monthly minimum needed to meet most water needs (4 inches in the Marianas and Pago Pago, and 8 inches elsewhere) at Kwajalein and Wotje (RMI). January precipitation was above the monthly minimums at the rest of the stations across the USAPI. The 4- and 8-inch thresholds are important because, if monthly precipitation falls below the threshold, then water shortages or drought become a concern.
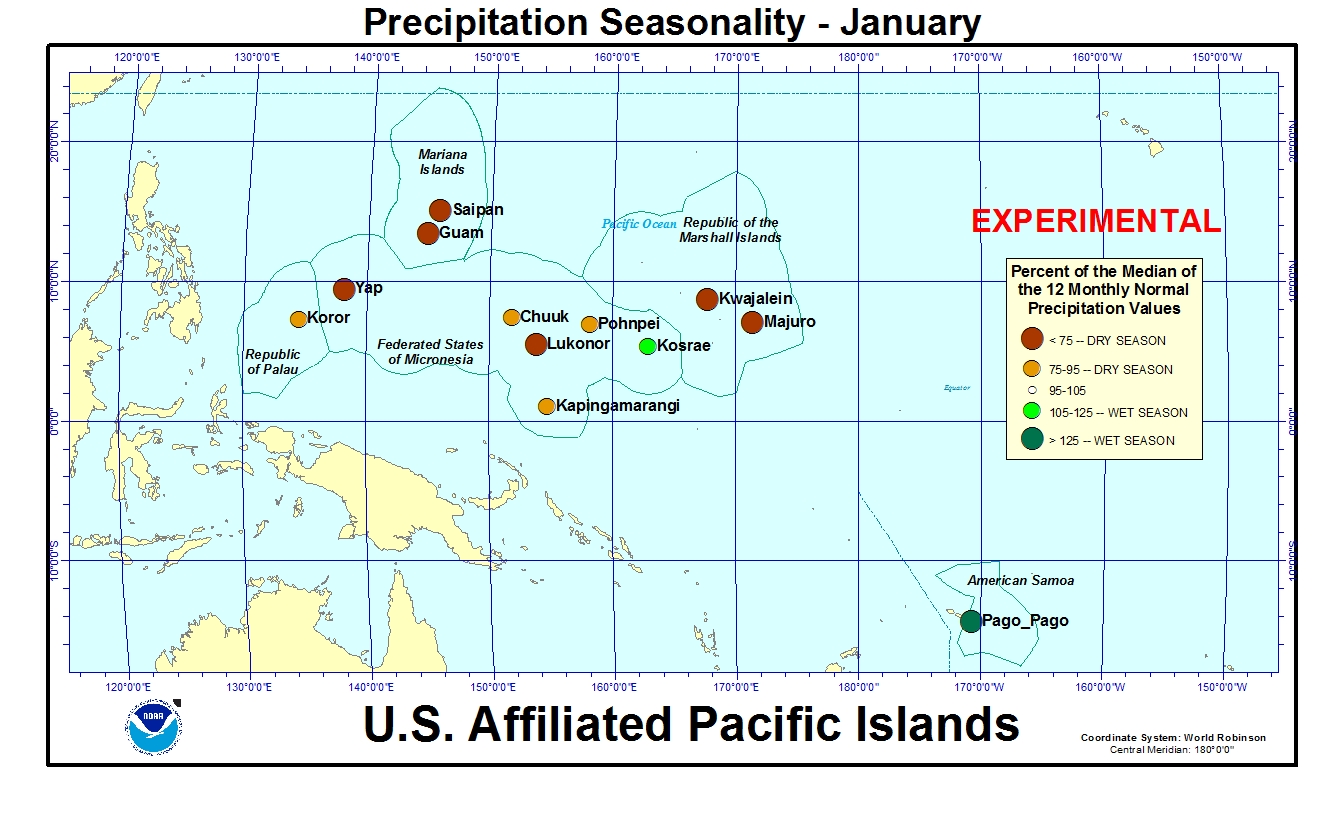
The tropical Pacific climatology can experience extremes in precipitation, from very low precipitation during the dry season to very high precipitation during the wet season. This can result in monthly normal precipitation values that are different from the monthly minimum needed to meet most water needs, and this can lead to percent of normal values that seem odd. This was the case during January 2023, which is in the wet season for American Samoa and dry season for Micronesia. Precipitation was above the monthly minimum but below normal (1981-2010 normal), because the normals are high, at:
- Chuuk: January 2023 precipitation 9.34 inches, January normal mean 10.14 inches, January normal median 10.10 inches.
Precipitation was below the monthly minimum but above normal (1981-2010 normal), because the normals are low, at:
- Kwajalein: January 2023 precipitation 7.08 inches, January normal mean 4.01 inches, January normal median 3.16 inches.
In the table below, the station identified as Koror is Palau International Airport (Airai).
| Station Name | Feb 2022 | Mar 2022 | Apr 2022 | May 2022 | Jun 2022 | Jul 2022 | Aug 2022 | Sep 2022 | Oct 2022 | Nov 2022 | Dec 2022 | Jan 2023 | Feb- Jan |
|---|---|---|---|---|---|---|---|---|---|---|---|---|---|
| Chuuk | 39% | 166% | 138% | 176% | 68% | 107% | 70% | 121% | 124% | 93% | 116% | 92% | 105% |
| Guam NAS | 42% | 110% | 187% | 69% | 79% | 135% | 62% | 109% | 150% | 77% | 182% | 350% | 99% |
| Kapingamarangi | 131% | 58% | 66% | 10% | 25% | 61% | 51% | 44% | 34% | 55% | 53% | 166% | 53% |
| Koror | 124% | 156% | 303% | 203% | 81% | 72% | 119% | 45% | 241% | 88% | 105% | 187% | 122% |
| Kosrae | 77% | 216% | 195% | 132% | 139% | 169% | 117% | 134% | 169% | 107% | 99% | 131% | 119% |
| Kwajalein | 244% | 471% | 156% | 196% | 141% | 94% | 132% | 68% | 161% | 81% | 88% | 224% | 131% |
| Lukonor | 58% | 133% | 125% | 88% | 62% | 66% | 32% | 36% | 95% | 94% | 54% | 124% | 68% |
| Majuro | 128% | 298% | 255% | 66% | 71% | 96% | 74% | 159% | 147% | 91% | 90% | 157% | 126% |
| Pago Pago | 150% | 51% | 58% | 96% | 110% | 166% | 121% | 60% | 149% | 118% | 71% | 114% | 91% |
| Pohnpei | 182% | 211% | 157% | 112% | 122% | 173% | 138% | 143% | 148% | 85% | 74% | 136% | 134% |
| Saipan | 63% | 265% | 204% | 76% | 106% | 159% | 80% | 67% | 151% | 60% | 130% | 441% | 121% |
| Yap | 123% | 159% | 254% | 153% | 83% | 110% | 65% | 57% | 217% | 68% | 131% | 133% | 113% |
| Station Name | Feb 2022 | Mar 2022 | Apr 2022 | May 2022 | Jun 2022 | Jul 2022 | Aug 2022 | Sep 2022 | Oct 2022 | Nov 2022 | Dec 2022 | Jan 2023 | Feb- Jan |
|---|---|---|---|---|---|---|---|---|---|---|---|---|---|
| Chuuk | 2.86" | 13.83" | 17.19" | 19.87" | 7.93" | 12.86" | 8.98" | 14.15" | 14.27" | 9.83" | 13.00" | 9.34" | 144.11" |
| Guam NAS | 1.28" | 2.28" | 4.74" | 2.35" | 4.88" | 13.71" | 9.15" | 13.74" | 17.12" | 5.66" | 9.32" | 14.02" | 98.25" |
| Kapingamarangi | 12.19" | 6.62" | 8.97" | 1.19" | 3.40" | 8.60" | 4.17" | 4.38" | 2.76" | 5.11" | 5.23" | 15.23" | 77.85" |
| Koror | 10.64" | 11.57" | 22.21" | 24.06" | 14.19" | 13.31" | 16.00" | 5.26" | 28.49" | 10.00" | 11.76" | 19.04" | 186.53" |
| Kosrae | 9.93" | 34.72" | 34.09" | 23.42" | 20.39" | 25.14" | 16.69" | 19.11" | 18.53" | 14.74" | 15.95" | 21.87" | 254.58" |
| Kwajalein | 6.45" | 11.07" | 8.21" | 13.17" | 9.78" | 9.23" | 12.81" | 7.34" | 18.02" | 9.09" | 5.88" | 7.08" | 118.13" |
| Lukonor | 5.16" | 12.28" | 14.14" | 10.27" | 7.19" | 10.52" | 4.55" | 3.70" | 10.73" | 8.52" | 6.06" | 10.45" | 103.57" |
| Majuro | 8.79" | 19.61" | 24.02" | 6.72" | 7.78" | 10.70" | 8.65" | 17.72" | 18.76" | 12.21" | 10.30" | 12.14" | 157.4" |
| Pago Pago | 17.94" | 5.50" | 5.42" | 9.32" | 5.84" | 9.23" | 6.53" | 3.92" | 13.82" | 11.93" | 9.10" | 15.19" | 113.74" |
| Pohnpei | 17.42" | 27.81" | 28.86" | 22.32" | 18.02" | 26.66" | 19.69" | 17.91" | 22.62" | 12.66" | 11.86" | 17.94" | 243.77" |
| Saipan | 1.62" | 5.01" | 5.36" | 1.81" | 3.84" | 14.16" | 10.55" | 6.72" | 16.07" | 3.39" | 5.01" | 11.16" | 84.7" |
| Yap | 6.36" | 7.23" | 14.28" | 12.04" | 10.04" | 16.54" | 9.57" | 7.76" | 26.48" | 5.99" | 11.17" | 8.51" | 135.97" |
| Station Name | Feb 2022 | Mar 2022 | Apr 2022 | May 2022 | Jun 2022 | Jul 2022 | Aug 2022 | Sep 2022 | Oct 2022 | Nov 2022 | Dec 2022 | Jan 2023 | Feb- Jan |
|---|---|---|---|---|---|---|---|---|---|---|---|---|---|
| Chuuk | 7.25" | 8.32" | 12.47" | 11.30" | 11.66" | 11.98" | 12.86" | 11.71" | 11.51" | 10.61" | 11.25" | 10.10" | 136.77" |
| Guam NAS | 3.03" | 2.07" | 2.53" | 3.40" | 6.18" | 10.14" | 14.74" | 12.66" | 11.44" | 7.38" | 5.11" | 4.01" | 99.09" |
| Kapingamarangi | 9.27" | 11.43" | 13.64" | 12.08" | 13.78" | 14.15" | 8.13" | 9.93" | 8.19" | 9.27" | 9.84" | 9.15" | 145.85" |
| Koror | 8.56" | 7.44" | 7.32" | 11.83" | 17.48" | 18.53" | 13.50" | 11.77" | 11.84" | 11.39" | 11.16" | 10.18" | 152.90" |
| Kosrae | 12.93" | 16.06" | 17.51" | 17.75" | 14.64" | 14.91" | 14.22" | 14.22" | 10.94" | 13.83" | 16.11" | 16.67" | 213.87" |
| Kwajalein | 2.64" | 2.35" | 5.26" | 6.72" | 6.93" | 9.87" | 9.74" | 10.74" | 11.18" | 11.28" | 6.66" | 3.16" | 90.41" |
| Lukonor | 8.93" | 9.26" | 11.31" | 11.69" | 11.65" | 15.93" | 14.04" | 10.15" | 11.32" | 9.08" | 11.27" | 8.41" | 151.36" |
| Majuro | 6.88" | 6.58" | 9.42" | 10.11" | 11.01" | 11.17" | 11.69" | 11.17" | 12.73" | 13.44" | 11.39" | 7.74" | 125.25" |
| Pago Pago | 12.00" | 10.68" | 9.39" | 9.66" | 5.33" | 5.55" | 5.38" | 6.53" | 9.26" | 10.14" | 12.84" | 13.34" | 125.57" |
| Pohnpei | 9.55" | 13.17" | 18.41" | 19.96" | 14.81" | 15.43" | 14.26" | 12.55" | 15.27" | 14.83" | 16.08" | 13.18" | 182.36" |
| Saipan | 2.59" | 1.89" | 2.63" | 2.38" | 3.62" | 8.91" | 13.13" | 10.09" | 10.62" | 5.61" | 3.85" | 2.53" | 70.25" |
| Yap | 5.19" | 4.56" | 5.63" | 7.85" | 12.04" | 15.08" | 14.82" | 13.50" | 12.18" | 8.83" | 8.51" | 6.39" | 120.31" |
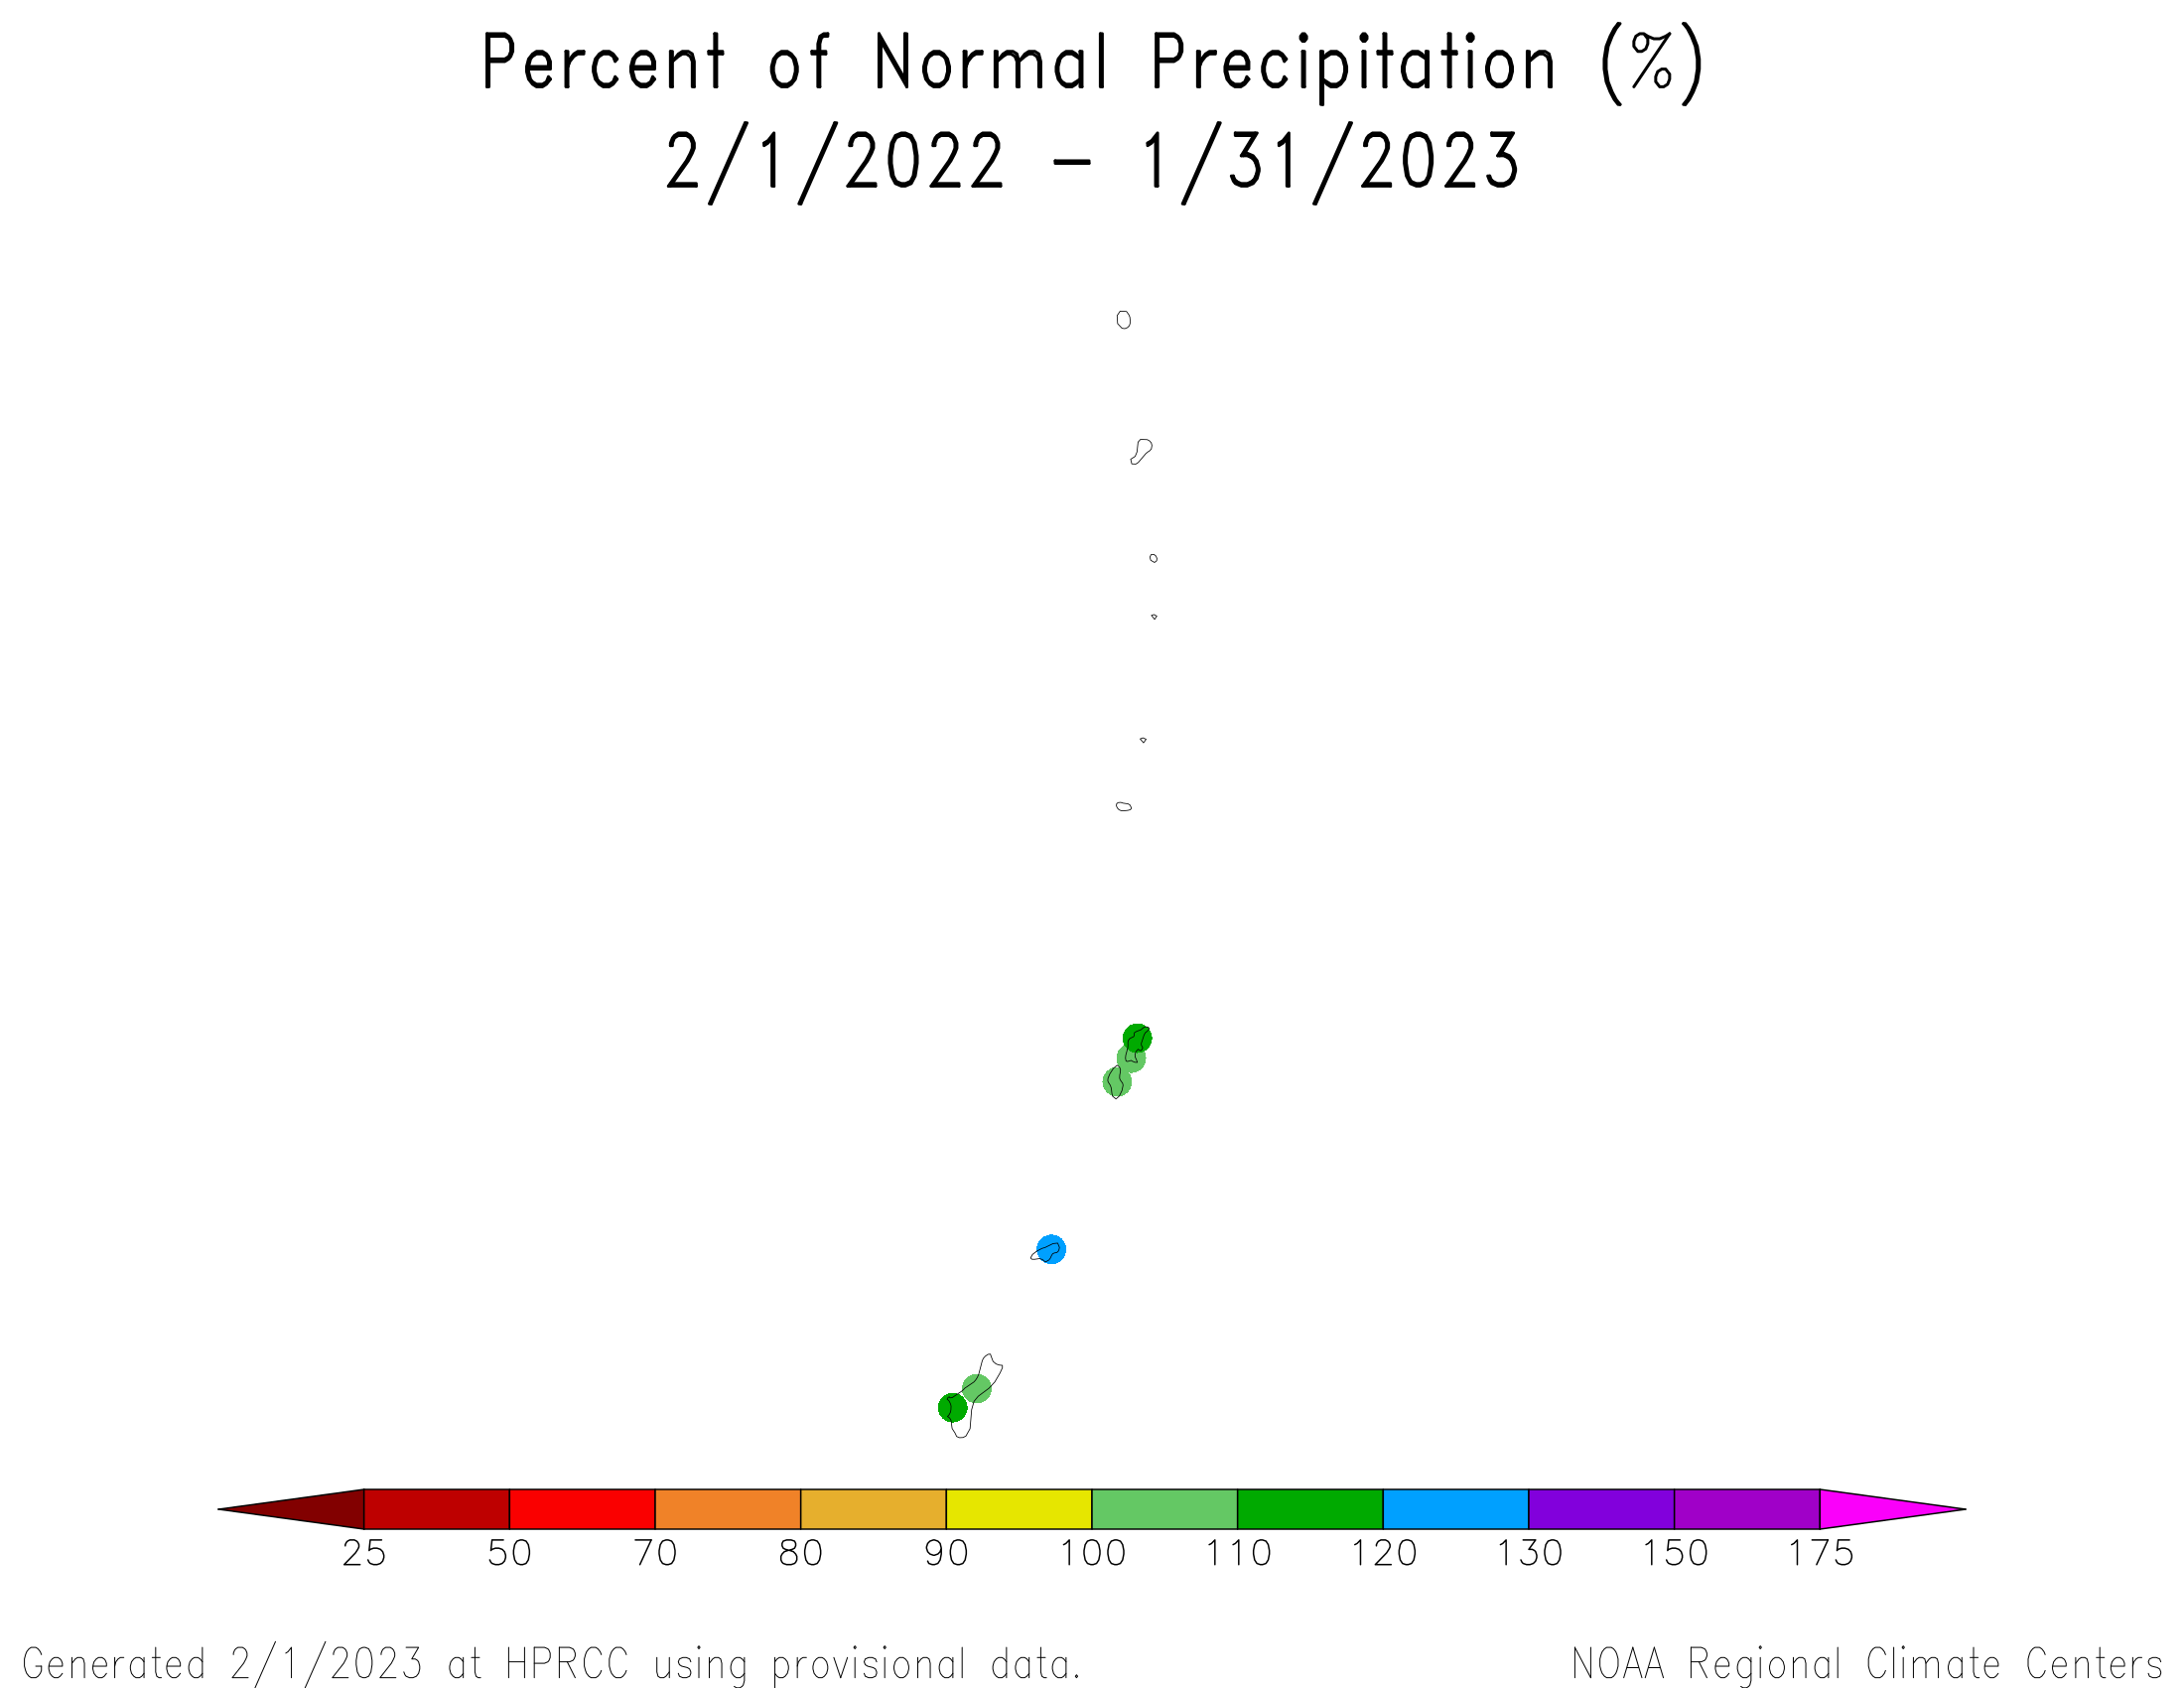
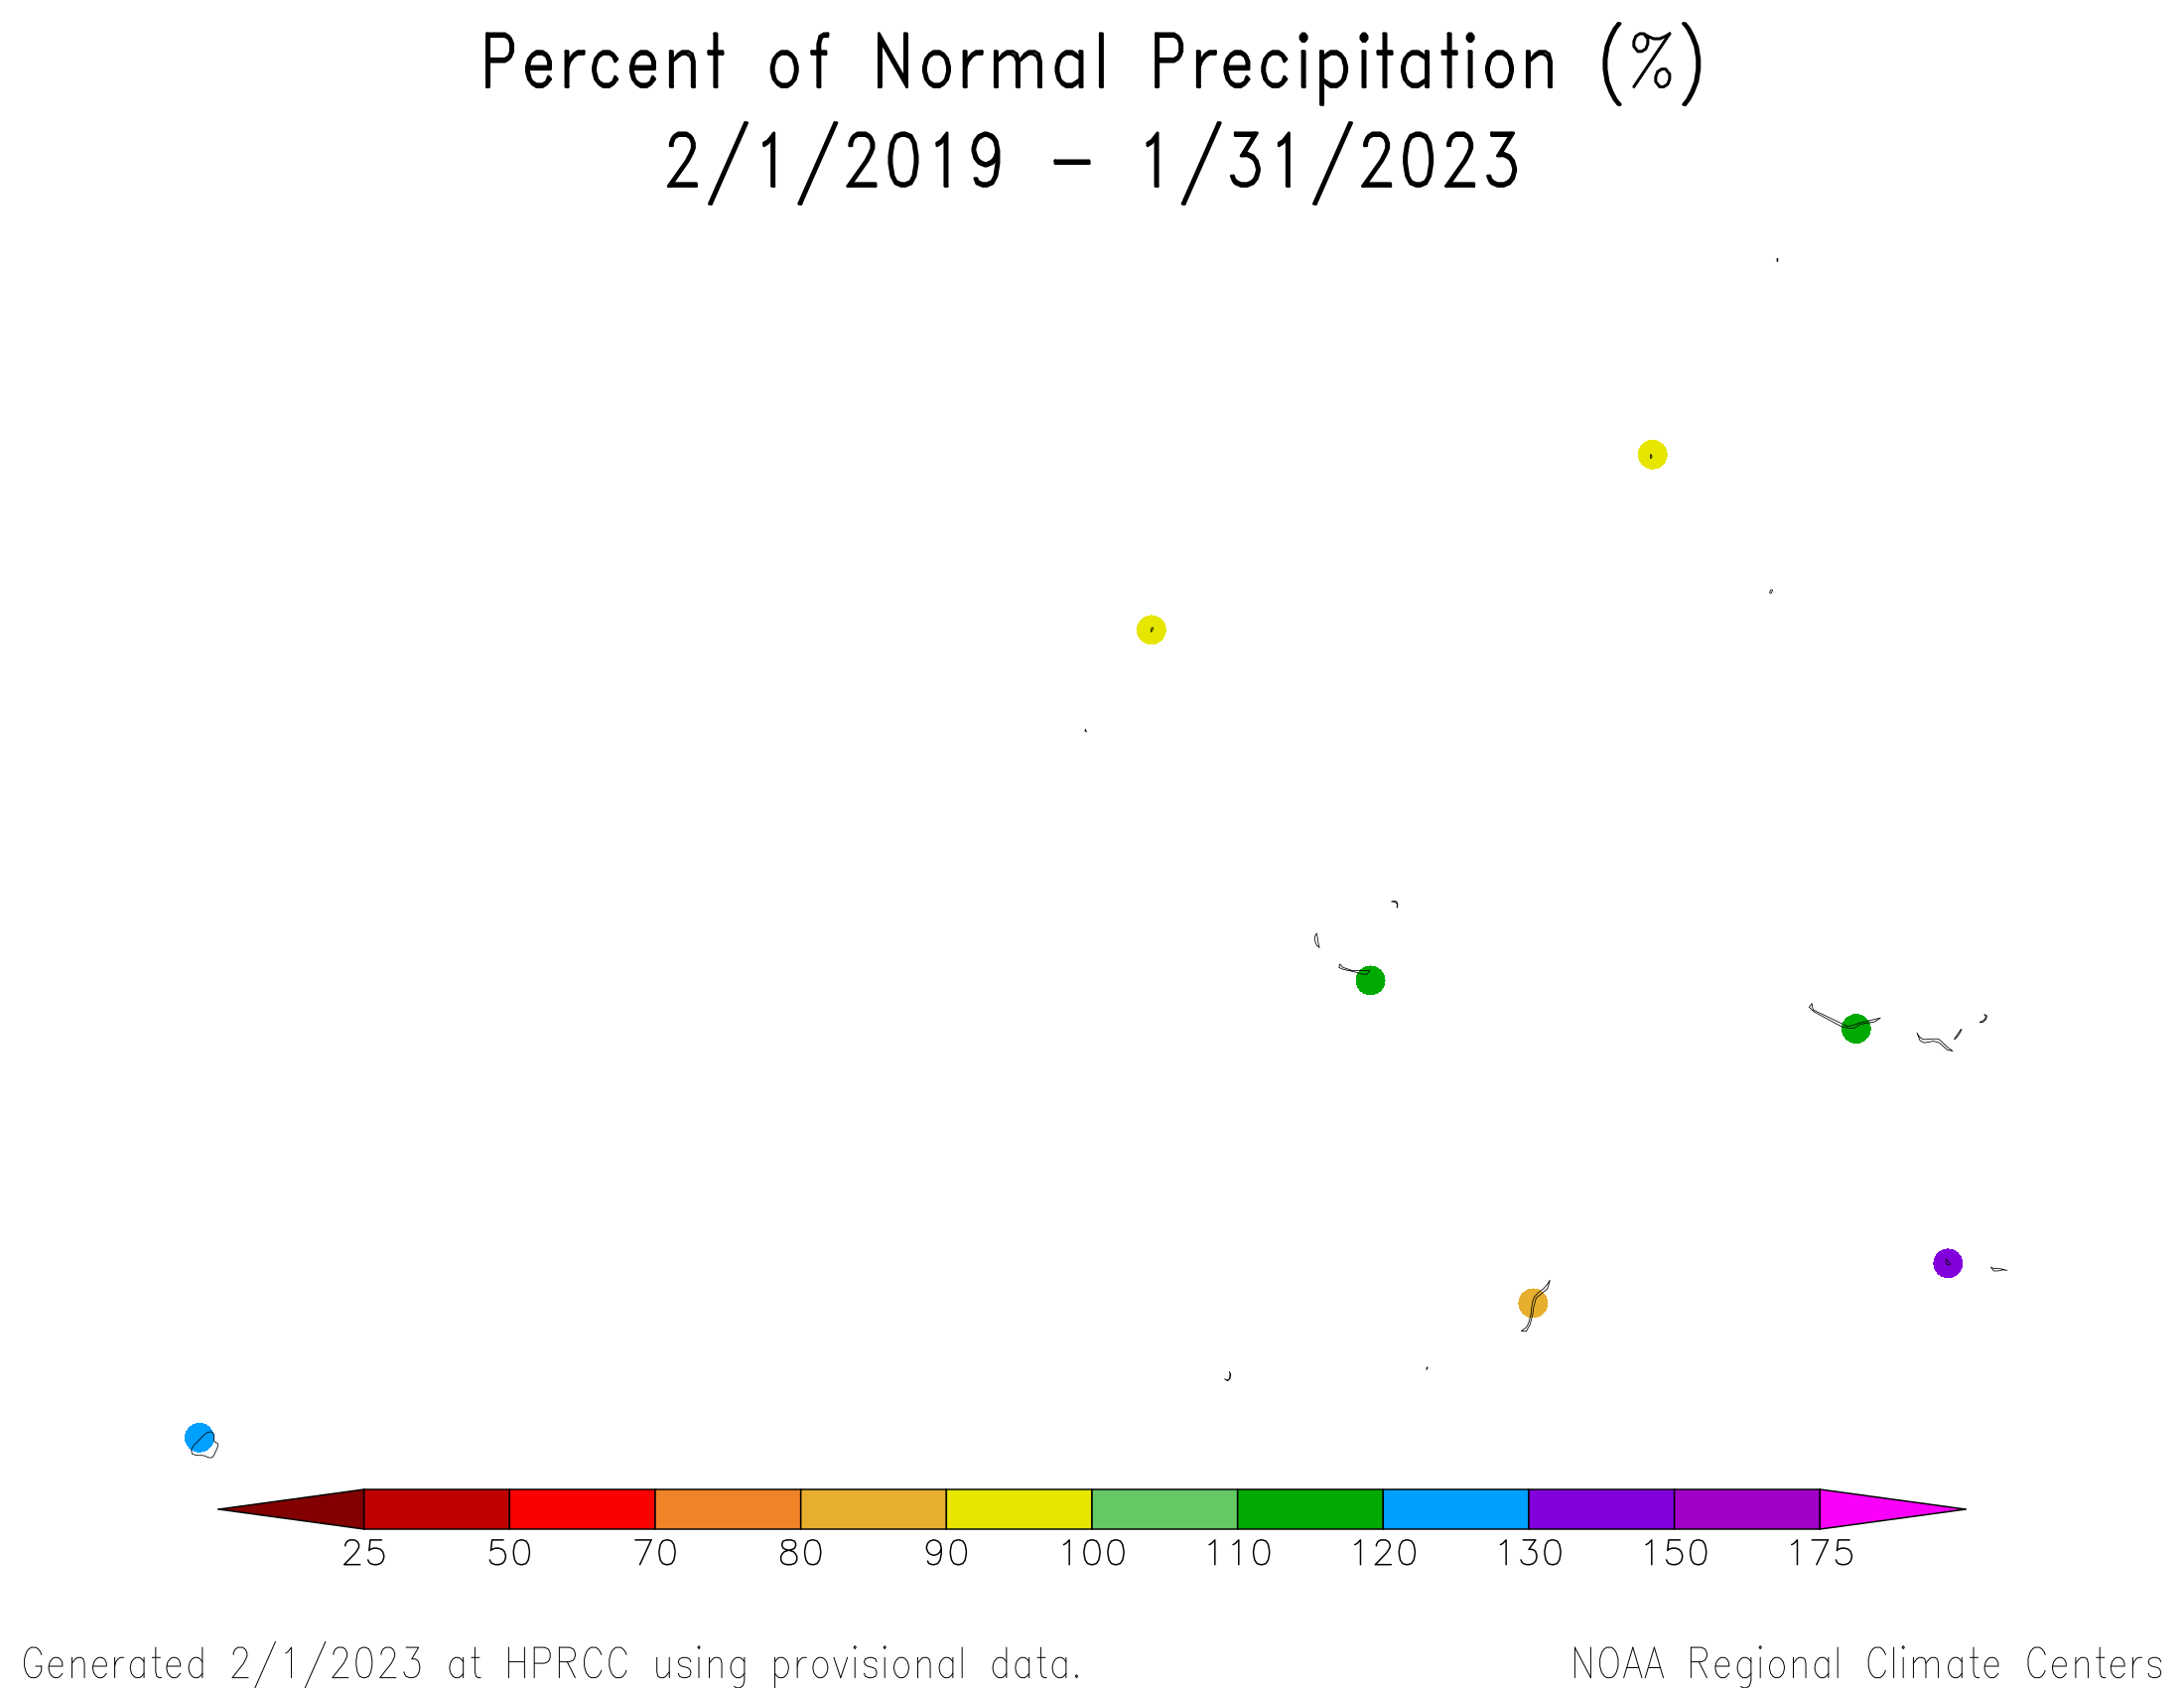
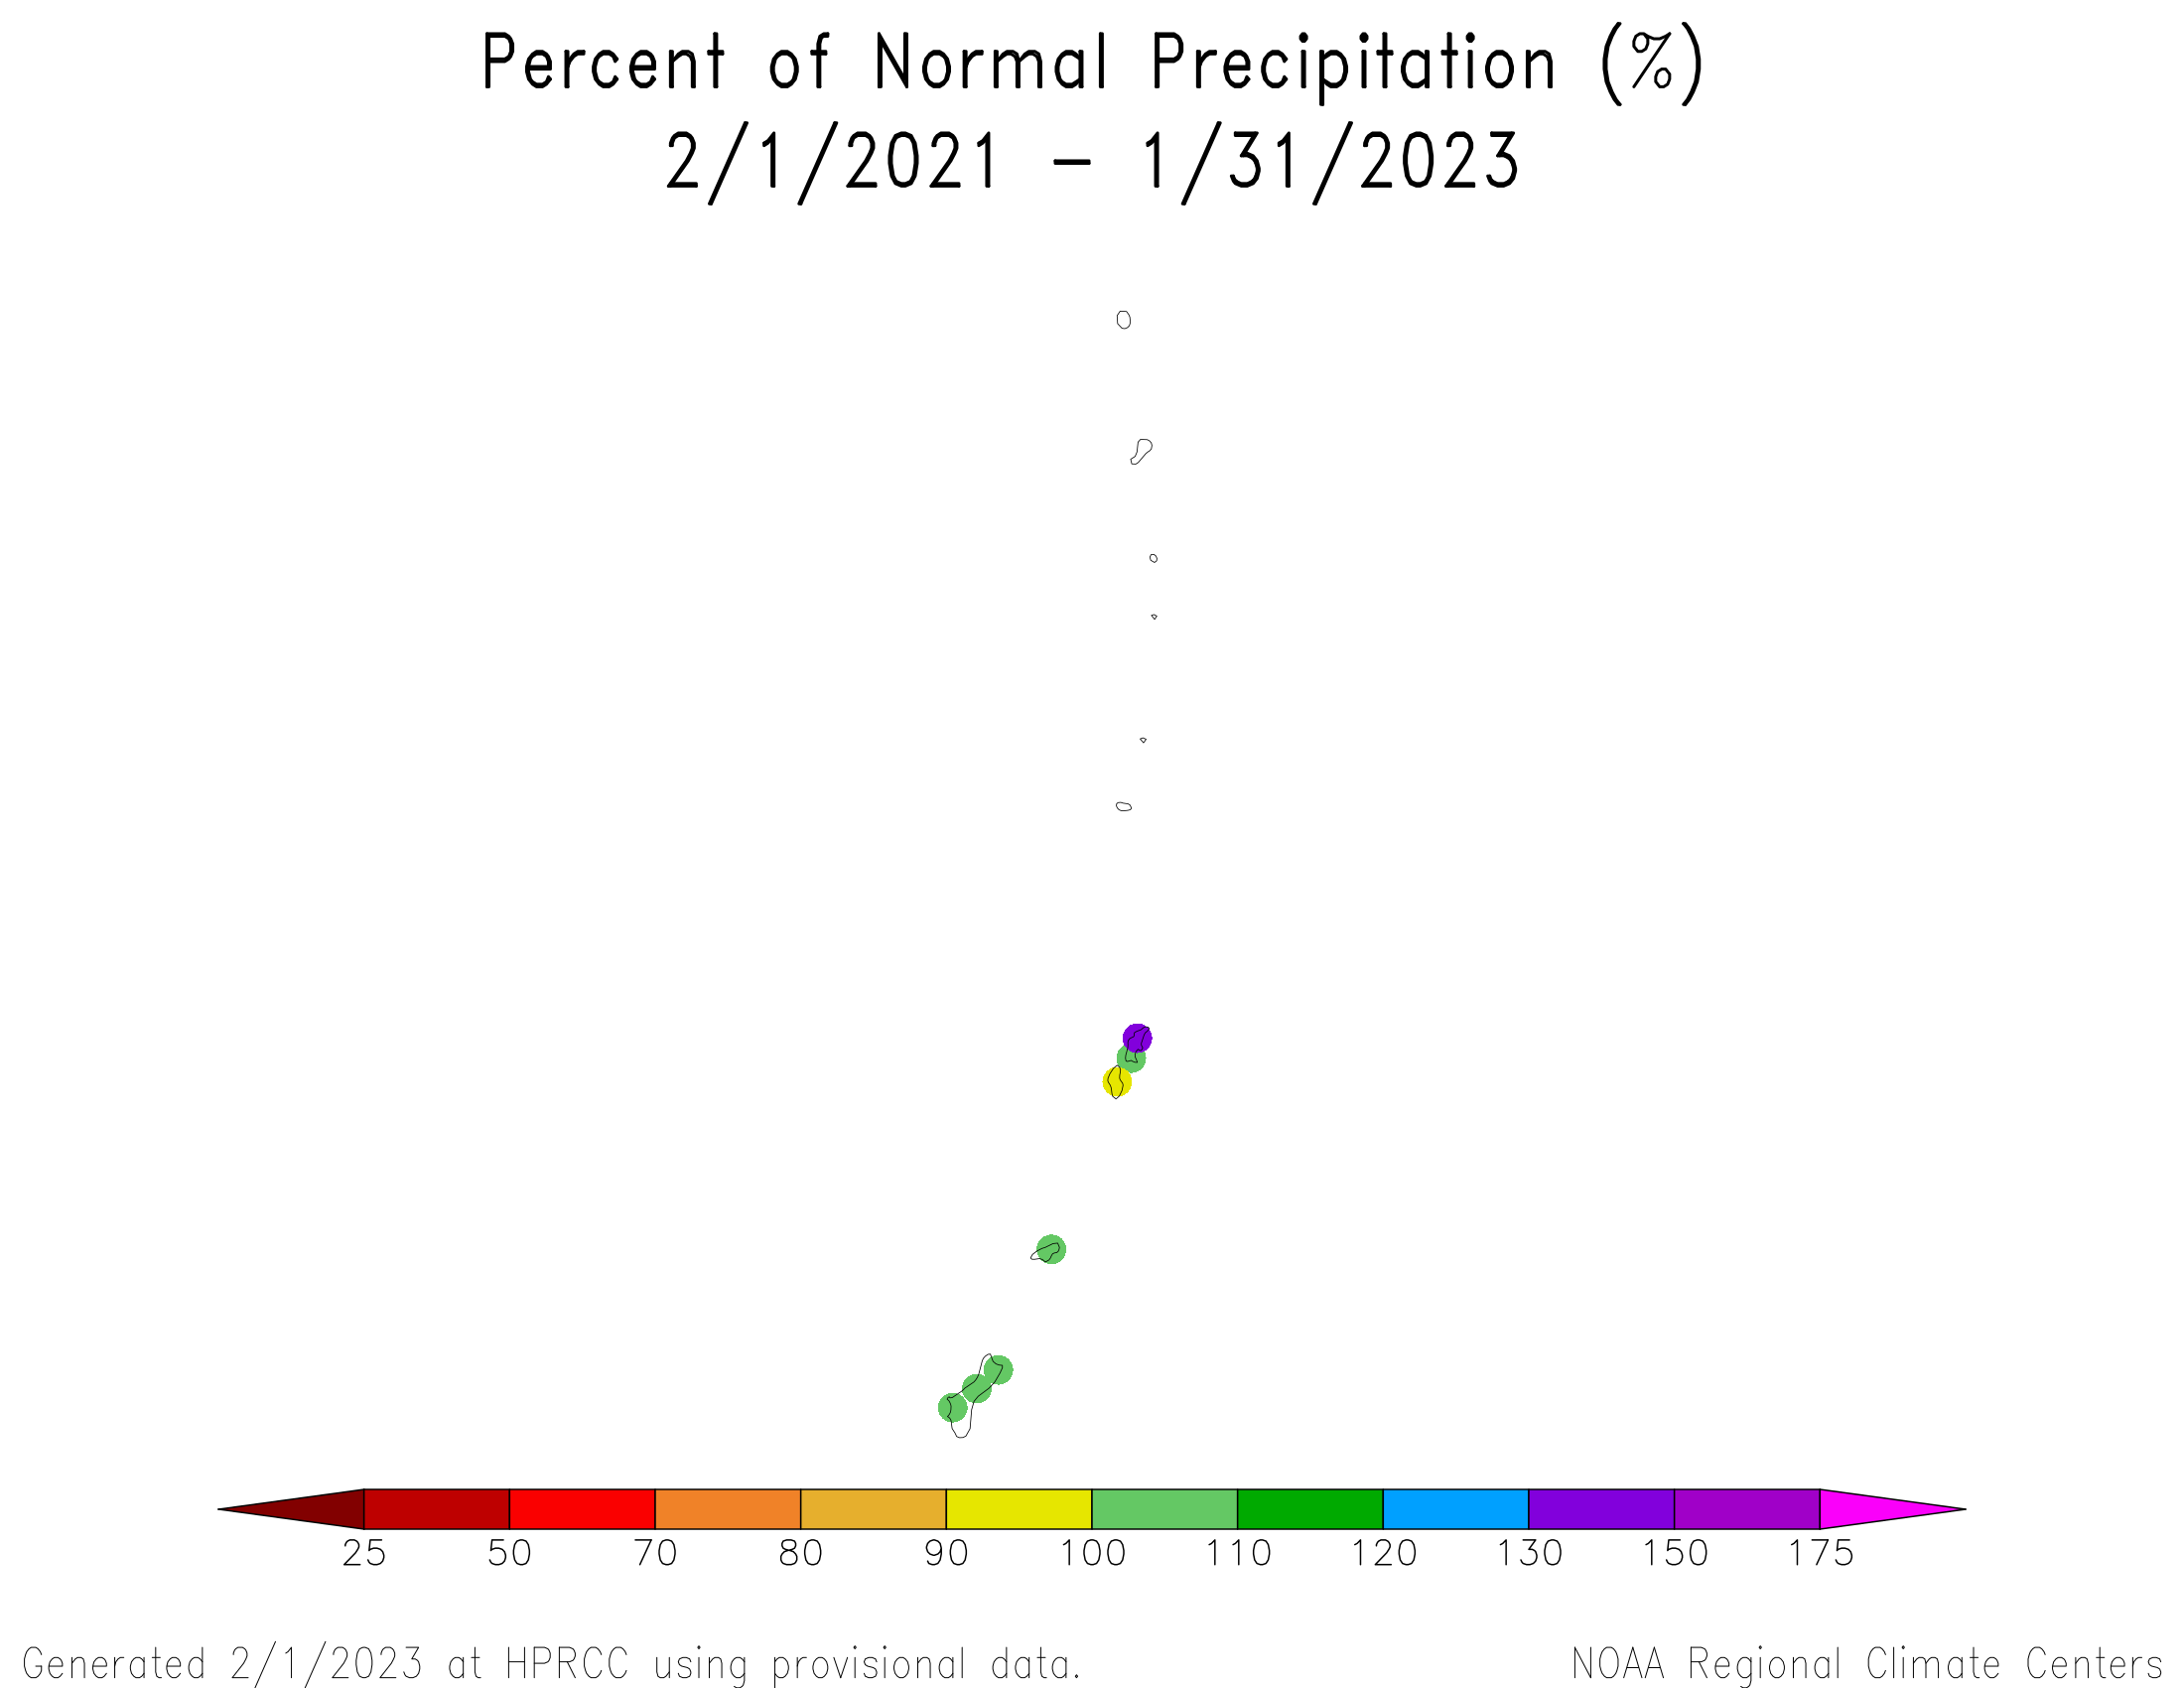
As measured by percent of normal precipitation, no station was drier than normal in the short term (January and the last 3 months [November-January]) and long term (last 12 months [February 2022-January 2023]). Chuuk was drier than normal in the short-term but wetter than normal in the long-term. Kapingamarangi, Lukunor, and Pago Pago were drier than normal at the 3- and 12-month time scales and wetter than normal for January. Kosrae, Kwajalein, and Pohnpei were drier than normal for the last 3 months and wetter than normal for January and the last 12 months. Airai, Guam, Majuro, Saipan, and Yap were near to wetter than normal for all 3 time periods.


Based on percent of normal average (instead of normal median values), in the Marianas Islands, precipitation during January and the last 2 to 4 months was above normal across the main islands. The last 6 to 24 months were mostly wetter than normal. Longer time periods had a mixed anomaly pattern, with drier-than-normal conditions dominating at 48 months (percent of normal precipitation maps for the last 1, 2, 3, 4, 6, 7, 9, 10, 12, 24, 36, 48, 60 months).


Based on percent of normal average (instead of normal median values), in the Marshall Islands, January and December-January were drier than normal in the southwestern islands and wetter than normal to the north and east, while November-January was drier than normal in the west and wetter than normal in the east. Wetter-than-normal conditions dominated at 4 to 12 months. It was drier than normal in the far northeast (Wotje) and southwest (Jaluit) at the 24- to 48-month time scales with wetter-than-normal conditions dominating at longer time scales (percent of normal precipitation maps for the last 1, 2, 3, 4, 6, 7, 9, 10, 12, 24, 36, 48, 60 months).

![0-10 cm [0-4 in]](/monitoring-content/sotc/drought/2023/01/rsoim0-10_20230131_00z_pr.gif)
![10-40 cm [4-16 in]](/monitoring-content/sotc/drought/2023/01/rsoim10-40_20230131_00z_pr.gif)
![40-100 cm [16-39 in]](/monitoring-content/sotc/drought/2023/01/rsoim40-100_20230131_00z_pr.gif)
![100-200 cm [39-79 in]](/monitoring-content/sotc/drought/2023/01/rsoim100-200_20230131_00z_pr.gif)
According to the January 31 USDM produced for the USAPI, moderate drought continued on Kapingamarangi while the rest of the USAPI stations were free of drought and abnormal dryness.
There were no Drought Information Statements (DGT) issued for the USAPI in January. The reservoir level on Majuro generally increased during the first part of the month and decreased for the last half of the month. The reservoir level peaked at about 27.5 million gallons of water on January 11 and ended the month at the low point of 24.5 million gallons. This is below the threshold of concern for drought of 28.8 million gallons. Some of the low water level is due to one sector of the reservoir being serviced. This portion of the reservoir system typically holds 8 million gallons, so the 24.5 million gallon level was above the revised 20.8 million gallon level of concern.
Satellite observations of vegetation health (VHI, stressed vegetation, drought stress) on Guam generally indicated no drought concerns.
January 2023 precipitation ranks were mostly in the median to wet side of the historical distribution, based on data available at the time of this report. Record to near-record dryness was still occurring at Kapingamarangi and Lukunor at longer time scales:
- Kapingamarangi: 7th wettest January (in a 33-year record), but 2nd driest rank for June-January through February-January.
- Lukunor: 19th wettest January (39 years), but driest August-January through April-January and February-January; 2nd driest March-January.
At the wet end of the scale, it was the wettest January at Saipan (43 years) & Ulithi (39 years) and 3rd wettest at Guam (66 years), while Mili (39 years) had the 2nd wettest January and wettest October-January through February-January.
The following analysis of historical data for the USAPI stations in the Global Historical Climatology Network-Daily (GHCN-D) dataset, augmented with fill-in data from the 1981-2010 Normals, helps put the current data into historical perspective by computing ranks based on the period of record. The table below lists the precipitation ranks for January 2023, August 2022-January 2023 (last 6 months), and February 2022-January 2023 (the last 12 months). Some stations have a long period of record and their dataset is fairly complete, while other stations have a shorter period of record and the dataset has some missing data.
| Station | January 2023 | Aug 2022-Jan 2023 | Feb 2022-Jan 2023 | Period of Record | |||
|---|---|---|---|---|---|---|---|
| Rank | Years | Rank | Years | Rank | Years | ||
| Ailinglaplap | 30 | 40 | 30 | 37 | 37 | 37 | 1981-2023 |
| Airai | 66 | 72 | 65 | 71 | 69 | 70 | 1951-2023 |
| Chuuk | 37 | 72 | 24 | 72 | 45 | 71 | 1951-2023 |
| Fananu | 10 | 10 | -- | 5 | -- | 2 | 2003-2023 |
| Guam | 64 | 66 | 43 | 66 | 33 | 65 | 1957-2023 |
| Jaluit | 21 | 40 | 8 | 38 | 18 | 37 | 1981-2023 |
| Kapingamarangi | 27 | 33 | 5 | 21 | 2 | 18 | 1962-2023 |
| Kosrae | 41 | 53 | 27 | 38 | 28 | 33 | 1954-2023 |
| Kwajalein | 60 | 71 | 47 | 71 | 58 | 70 | 1952-2023 |
| Lukunor | 21 | 39 | 1 | 26 | 1 | 26 | 1981-2023 |
| Majuro | 59 | 69 | 52 | 69 | 59 | 68 | 1954-2023 |
| Mili | 38 | 39 | 35 | 35 | 34 | 34 | 1981-2023 |
| Nukuoro | 35 | 41 | 32 | 39 | 35 | 38 | 1981-2023 |
| Pago Pago | 32 | 57 | 25 | 57 | 20 | 56 | 1966-2023 |
| Pingelap | -- | 39 | -- | 36 | -- | 35 | 1981-2022 |
| Pohnpei | 59 | 72 | 57 | 72 | 70 | 71 | 1951-2023 |
| Saipan | 43 | 43 | 24 | 35 | 30 | 34 | 1981-2023 |
| Ulithi | 39 | 39 | 16 | 37 | 28 | 35 | 1981-2023 |
| Utirik | -- | 22 | -- | 9 | -- | 4 | 1985-2020 |
| Woleai | 35 | 41 | 29 | 33 | 25 | 27 | 1968-2023 |
| Wotje | 35 | 40 | 19 | 37 | 31 | 36 | 1981-2023 |
| Yap | 48 | 72 | 38 | 72 | 54 | 71 | 1951-2023 |


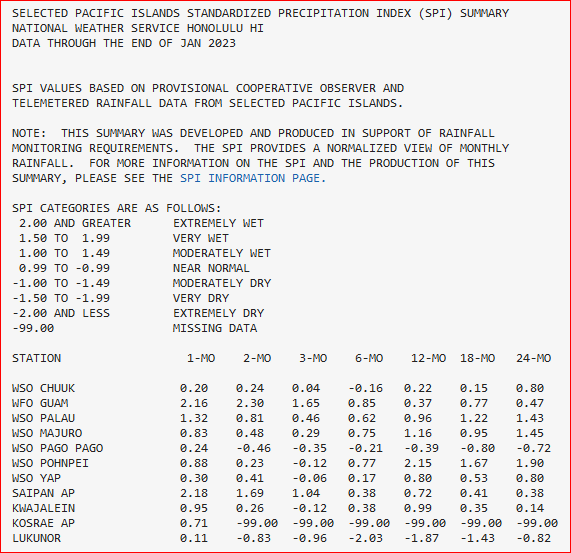
SPI values for seven time periods for Pacific Islands, computed by the Honolulu NWS office.
NOAA Regional Climate Centers
More information, provided by the NOAA Regional Climate Centers and others, can be found below.
Southeast
As noted by the Southeast Regional Climate Center, mean monthly temperatures were above average across the Southeast in January, and precipitation was above average across most of the interior of the region. In contrast, the driest locations were found across the northern Gulf Coast, much of the Florida Peninsula, and northern Virginia, where monthly precipitation totals were 2 to 6 inches (50.8 to 152 mm) below average (less than 75 percent of normal). Miami, FL recorded its fourth driest January on record (since 1895) with just 0.05 inch (1.27 mm) of precipitation, while West Palm Beach, FL recorded its third driest January on record (since 1888) with 0.21 inch (5.33 mm) of precipitation. Monthly precipitation was 1 to 2 inches (25.4 to 50.8 mm) below average across the U.S. Virgin Islands.
Due to the copious precipitation, drought conditions continued to improve across much of the region in January. The percentage of the region in moderate (D1) drought declined by about 10 percent, while the percentage of the region in severe (D2) drought declined by about 4 percent. The biggest improvements were seen across southern parts of Alabama and Georgia and the western Panhandle of Florida, where large portions of moderate and severe drought were eliminated. Areas of moderate drought were also reduced slightly across eastern sections of the Carolinas. On the other hand, abnormally dry (D0) conditions emerged across much of the Florida Peninsula by the end of the month. Areas of moderate drought persisted across northeast Florida and southeast Georgia, while a small area of severe drought persisted across the Big Bend region of Florida. Abnormally dry conditions persisted across parts of Puerto Rico and the U.S. Virgin Islands.
Agricultural conditions were variable across Puerto Rico. Dryness was reported across the south coastal region and along the southern slopes, while soils were saturated for much of the month across the north coastal region. Though surface water supplies were mostly full across the Virgin Islands, many farmers were taking measures to conserve water as the dry season progresses. These included using ground cover to limit evaporation, rotating foraging livestock, storing hay, and preparing irrigation.
South
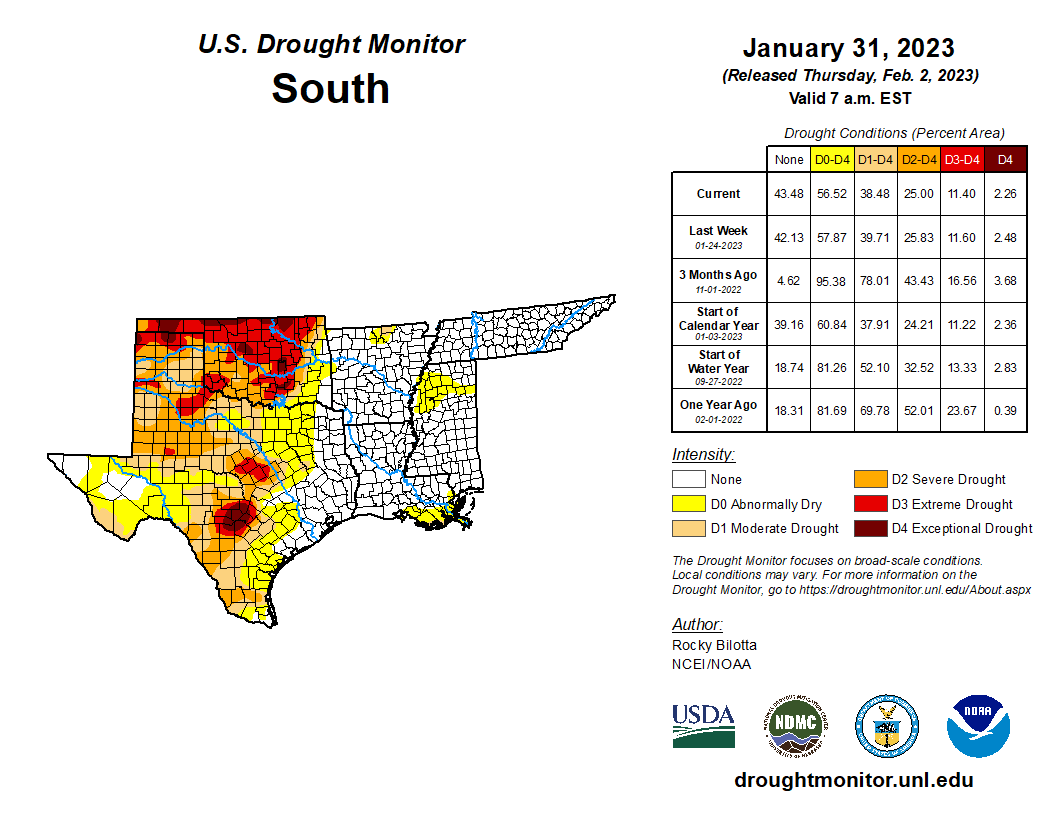
As explained by the Southern Regional Climate Center, January 2023 was warmer than normal across the Southern region, with departures from normal being greater in the east of the region than in the west, and precipitation was above normal in the east of the region and below normal in the west. During January, drought conditions remained relatively steady across the Southern region. As of January 31st, much of central Texas, the Texas Panhandle, Oklahoma remained in drought conditions. Slight degradation occurred in deep southern Texas, and slight improvements occurred along the southeast Louisiana coast. As of January 31st, the majority or all of Louisiana, Arkansas, Mississippi, and Tennessee were drought-free. Much of Oklahoma continued to experience Extreme (45 percent) or Exceptional (10 percent) Drought according to the USDM. The majority of impacts from drought during January come out of the Texas Panhandle and Oklahoma. There are concerns over the winter wheat crop, despite an increase of 11 percent in acres planted across the region when compared to 2022. The beef cattle herd in Oklahoma also reported substantial decreases when compared to the previous year. The January inventory of all cattle and calves was down 11.5% from January 1, 2022 to 1.981 million head. Oklahoma City is suing an oil company for allegedly stealing water intended for emergency drought relief. Water levels at gauges along the Mississippi River remained below long-term historical means but had rebounded from record lows observed in late 2022.
Midwest
As described by the Midwest Regional Climate Center, based on preliminary rankings, the Midwest had the 6th warmest January on record; average temperatures were well above normal across the entire region. January precipitation totaled 2.71 inches (69 mm) for the Midwest, which was 0.77 inch (20 mm) above normal, or 140 percent of normal. Precipitation was near or above normal for most of the region, with only northwestern Minnesota below 50 percent of normal.
Drought conditions were variable across the Midwest in January. Timely precipitation and mild temperatures helped to erase nearly all traces of drought in Illinois, Indiana, and Ohio, leaving just patchy areas of dryness across the lower Midwest. Drought held firm in southeast Michigan with 30 percent of the state in moderate to severe drought and virtually no change throughout the month. Drought also persisted in intensity and spatial extent in Iowa and across Minnesota. By month's end, 54 percent of Iowa and 37 percent of Minnesota were in drought.
Northeast
As summarized by the Northeast Regional Climate Center, the Northeast experienced its second warmest January since records began in 1895, with 3.41 inches of precipitation, 104 percent of normal. The USDM from January 3 showed less than 1 percent of the Northeast in moderate drought and 9 percent as abnormally dry. Much of the Northeast saw wetter-than-normal weather during January, alleviating abnormal dryness in New England and allowing New Hampshire to be free of drought and dryness for the first time since May 2020. Abnormal dryness also eased in Pennsylvania and northern New Jersey and contracted in New York. However, abnormal dryness was introduced or expanded slightly in areas that were drier than normal during January, including southern New Jersey, southern and western Maryland, and eastern West Virginia. A small area of moderate drought also persisted on Long Island, New York. The USDM from January 31 showed less than 1 percent of the Northeast in moderate drought and 3 percent as abnormally dry.
High Plains
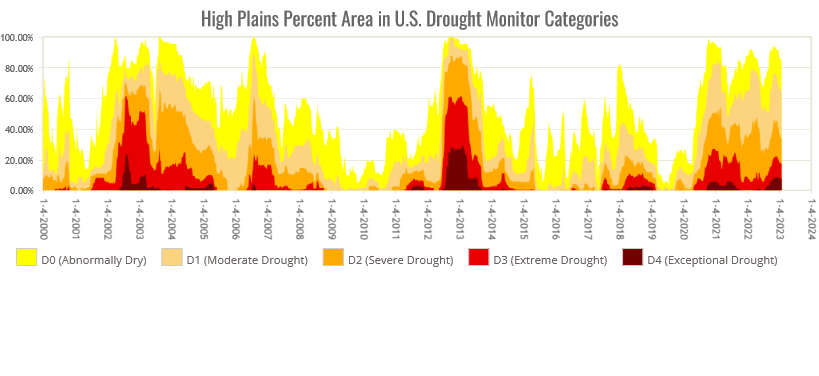
As summarized by the High Plains Regional Climate Center, temperatures varied across the region, with areas ranging from 8 degrees F (4.4 degrees C) below normal to 6 degrees F (3.3 degrees C) above normal. After below-normal precipitation in the High Plains for most of 2022, the new year began with record-breaking wetness. Several winter storms impacted the drought-stricken central part of the region this past month, leading to numerous precipitation records being broken. Many locations in the central part of the region eclipsed or ranked in the top 10 for both precipitation and snowfall. While many locations were above 200 percent of their normal precipitation, North Dakota and the northern portions of South Dakota missed out on this beneficial precipitation. While this wetness has impacted places affected by drought in 2022, the changes in drought conditions have been slow to improve due to the severity.
After back-to-back months of above normal precipitation, drought conditions have started to finally improve. Some areas in the Dakotas and along the southern Front Range of the Rockies missed out on the much-needed precipitation, with conditions deteriorating as a result. Overall, there was a 3 percent decrease in D0 to D4 (abnormally dry to exceptional drought conditions). Although North Dakota missed out on the precipitation this past month, drought conditions improved after the near-record snowfall in December. The state experienced a 12 percent reduction in D2 (severe drought) in response; however, nearly 80 percent of the state is still engulfed in D1 (moderate drought). Wyoming greatly benefited this month, with an 11 percent reduction in D0-D4 in the state. Elsewhere in the region, other improvements and degradation were observed.
West
As summarized by the Western Regional Climate Center, the stormy pattern that began in late December for California, the Great Basin, and much of the Southwest continued into mid-January bringing well above-normal precipitation and below-normal temperatures to the region and continued improvement to long-term drought conditions. A deep snowpack is building across the Sierra Nevada and parts of the Upper Colorado River Basin with record high snow water equivalent for some locations. The Pacific Northwest was generally drier and warmer than normal.
A series of moisture-laden atmospheric rivers brought heavy rainfall and mountain snowfall to California, the Great Basin, and parts of Arizona and New Mexico with many sites in the top five wettest Januarys on record. Drier-than-normal conditions prevailed across most of the Pacific Northwest with less than 50 percent of normal total precipitation for many locations. West Glacier, Montana logged 0.76 inch of precipitation, only 22 percent of normal and the second driest January since 1949. Bellingham, Washington recorded 1.46 inches of precipitation (33 percent of normal) for the fourth driest January since records started in 1949.
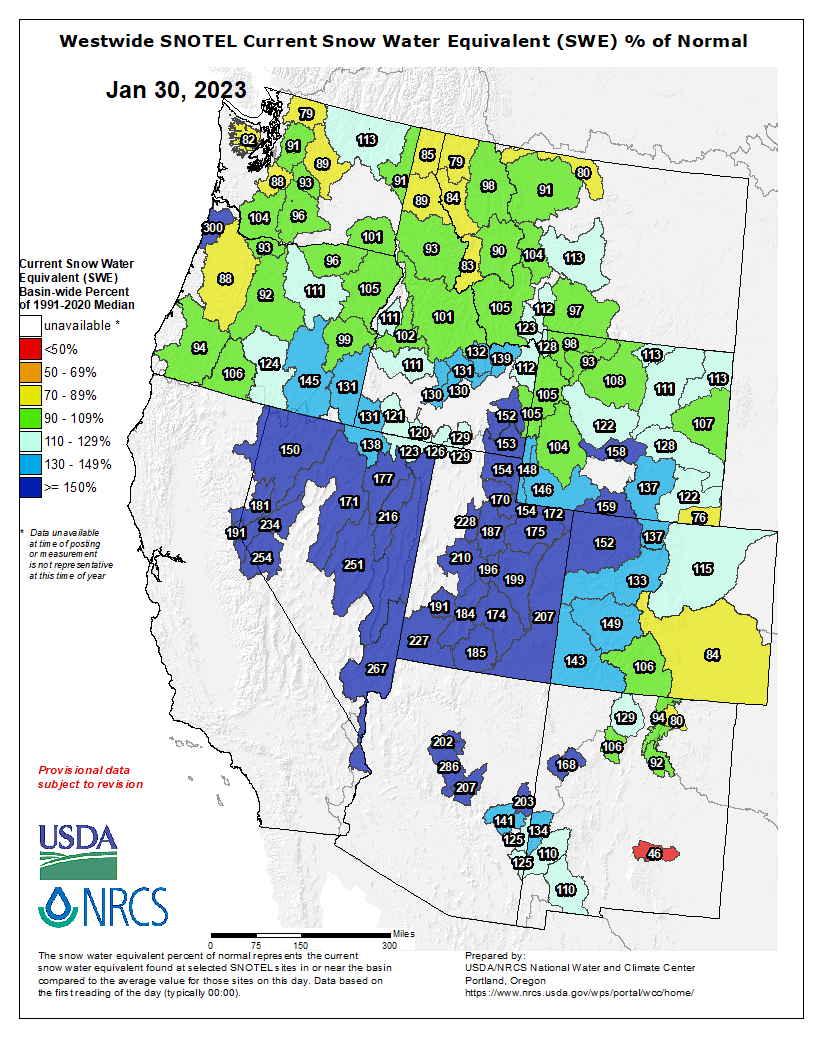
In California, Nevada, Utah, and Arizona snowpack was well above normal at the end of January with most NRCS SNOTEL sites greater than 150 percent of normal snow water equivalent (SWE); even more encouraging for drought recovery is that many locations have already surpassed the 1991-2020 median water year peak SWE. Snowpack has fallen below normal for much of the Cascades in Washington and Oregon, and northern Rockies in northern Idaho and northwest Montana with SWE values 70-90 percent of normal.
According to the USDM at the end of January, 61 percent of the West was in drought with six percent of the West in extreme (D3) or exceptional (D4) drought. Drought improvements were found in all western states except for Montana with the most widespread improvements in California. Only a few small areas of worsening drought (one category degradations) were found in Oregon, Idaho, Montana, and New Mexico.
Temperatures across Alaska were warm with many stations reporting 5 to 10 degrees Fahrenheit, or warmer, above normal January mean temperatures. It was also wet in the Panhandle with many locations 110-130 percent of normal total January precipitation. Parts of Southcentral Alaska were drier than normal with Kenai reporting just 0.03 inches of total precipitation (three percent of normal) making it the driest January since consistent reporting began in 1944. January precipitation totals were a mixed bag across the rest of Alaska with some areas below normal and other areas above normal.
In Hawaii, the Big Island and Oahu saw monthly precipitation totals mostly below normal with many stations less than 50 percent of the 1991-2020 average. Hilo received 2.06 inches (25 percent of normal) of precipitation for the month coming in as the 14th driest January since records started in 1950. Maui, Molokai, and Kauai saw above normal monthly precipitation. Hana, on the island of Maui, logged 11.47 inches (203 percent of normal) of monthly rainfall which is the 14th wettest since 1950. Overall, the spatial extent of drought was reduced across the state and the end of January was the first time without D2 (severe drought) or worse in the state in about one year based on the USDM.