|
Contents Of This Report: |
|
Please note that the values presented in this report are based on preliminary data. They will change when the final data are processed, but will not be replaced on these pages.
National Drought Overview
|
|
[top]
Detailed Drought Discussion
Overview
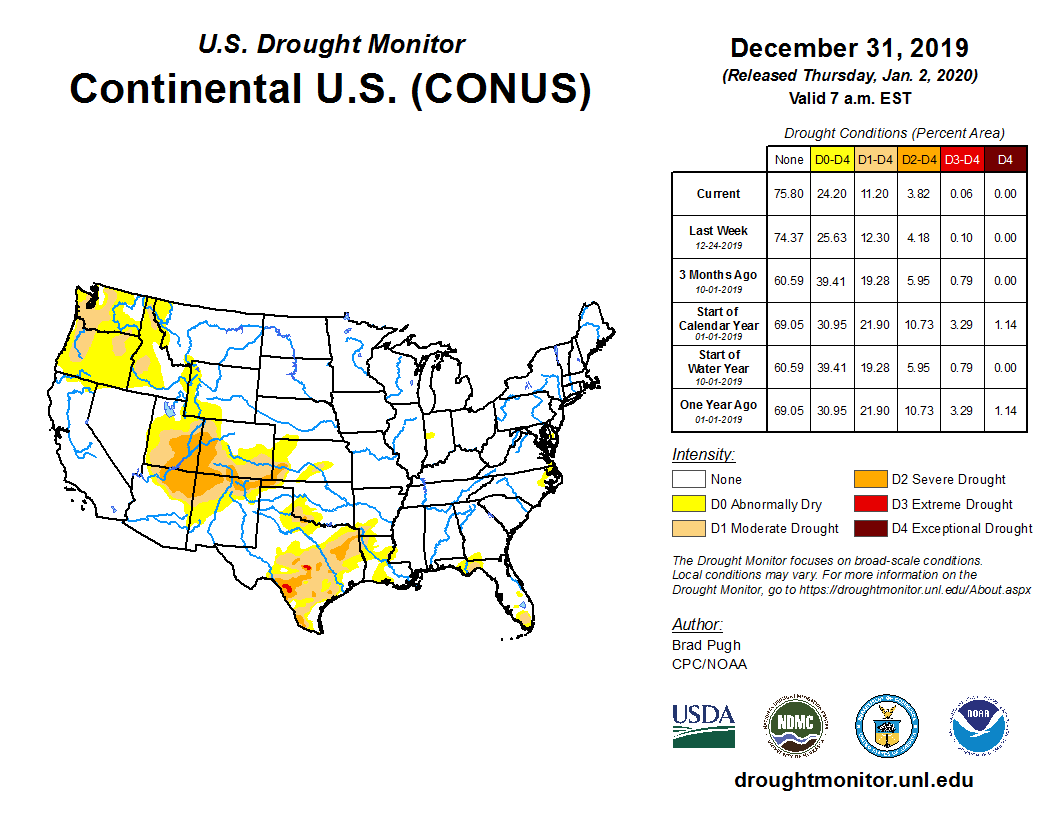
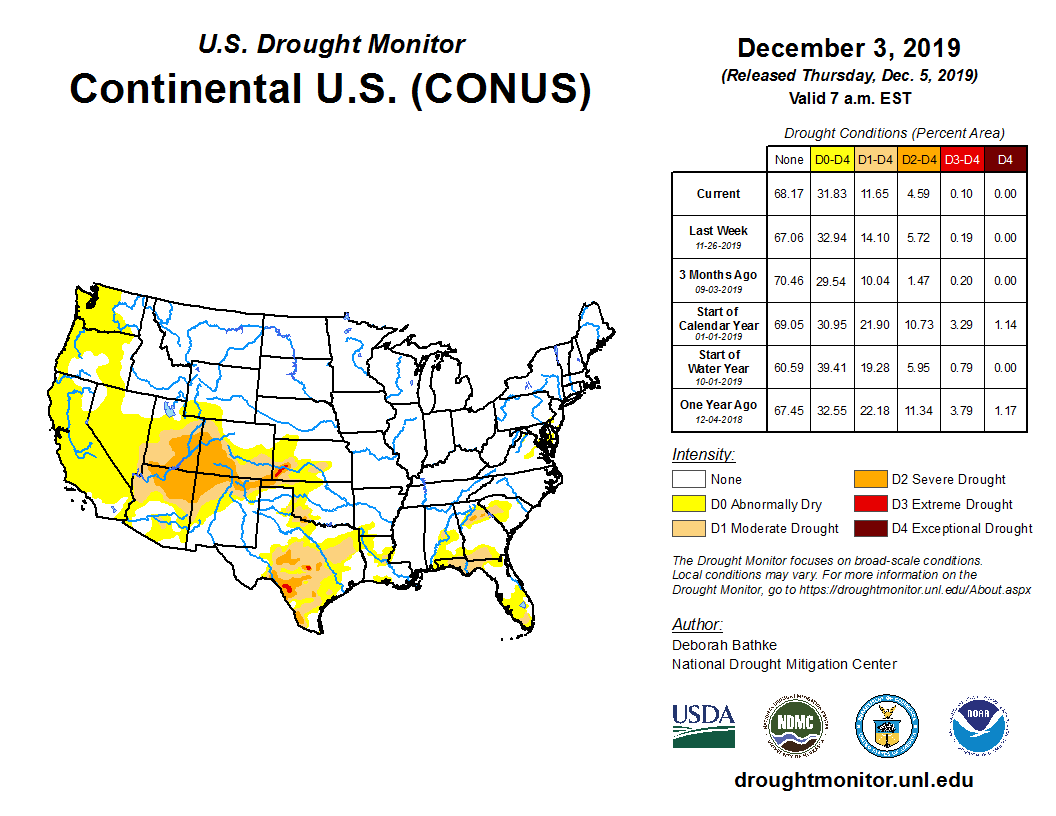
The U.S. Drought Monitor drought map valid December 31, 2019.
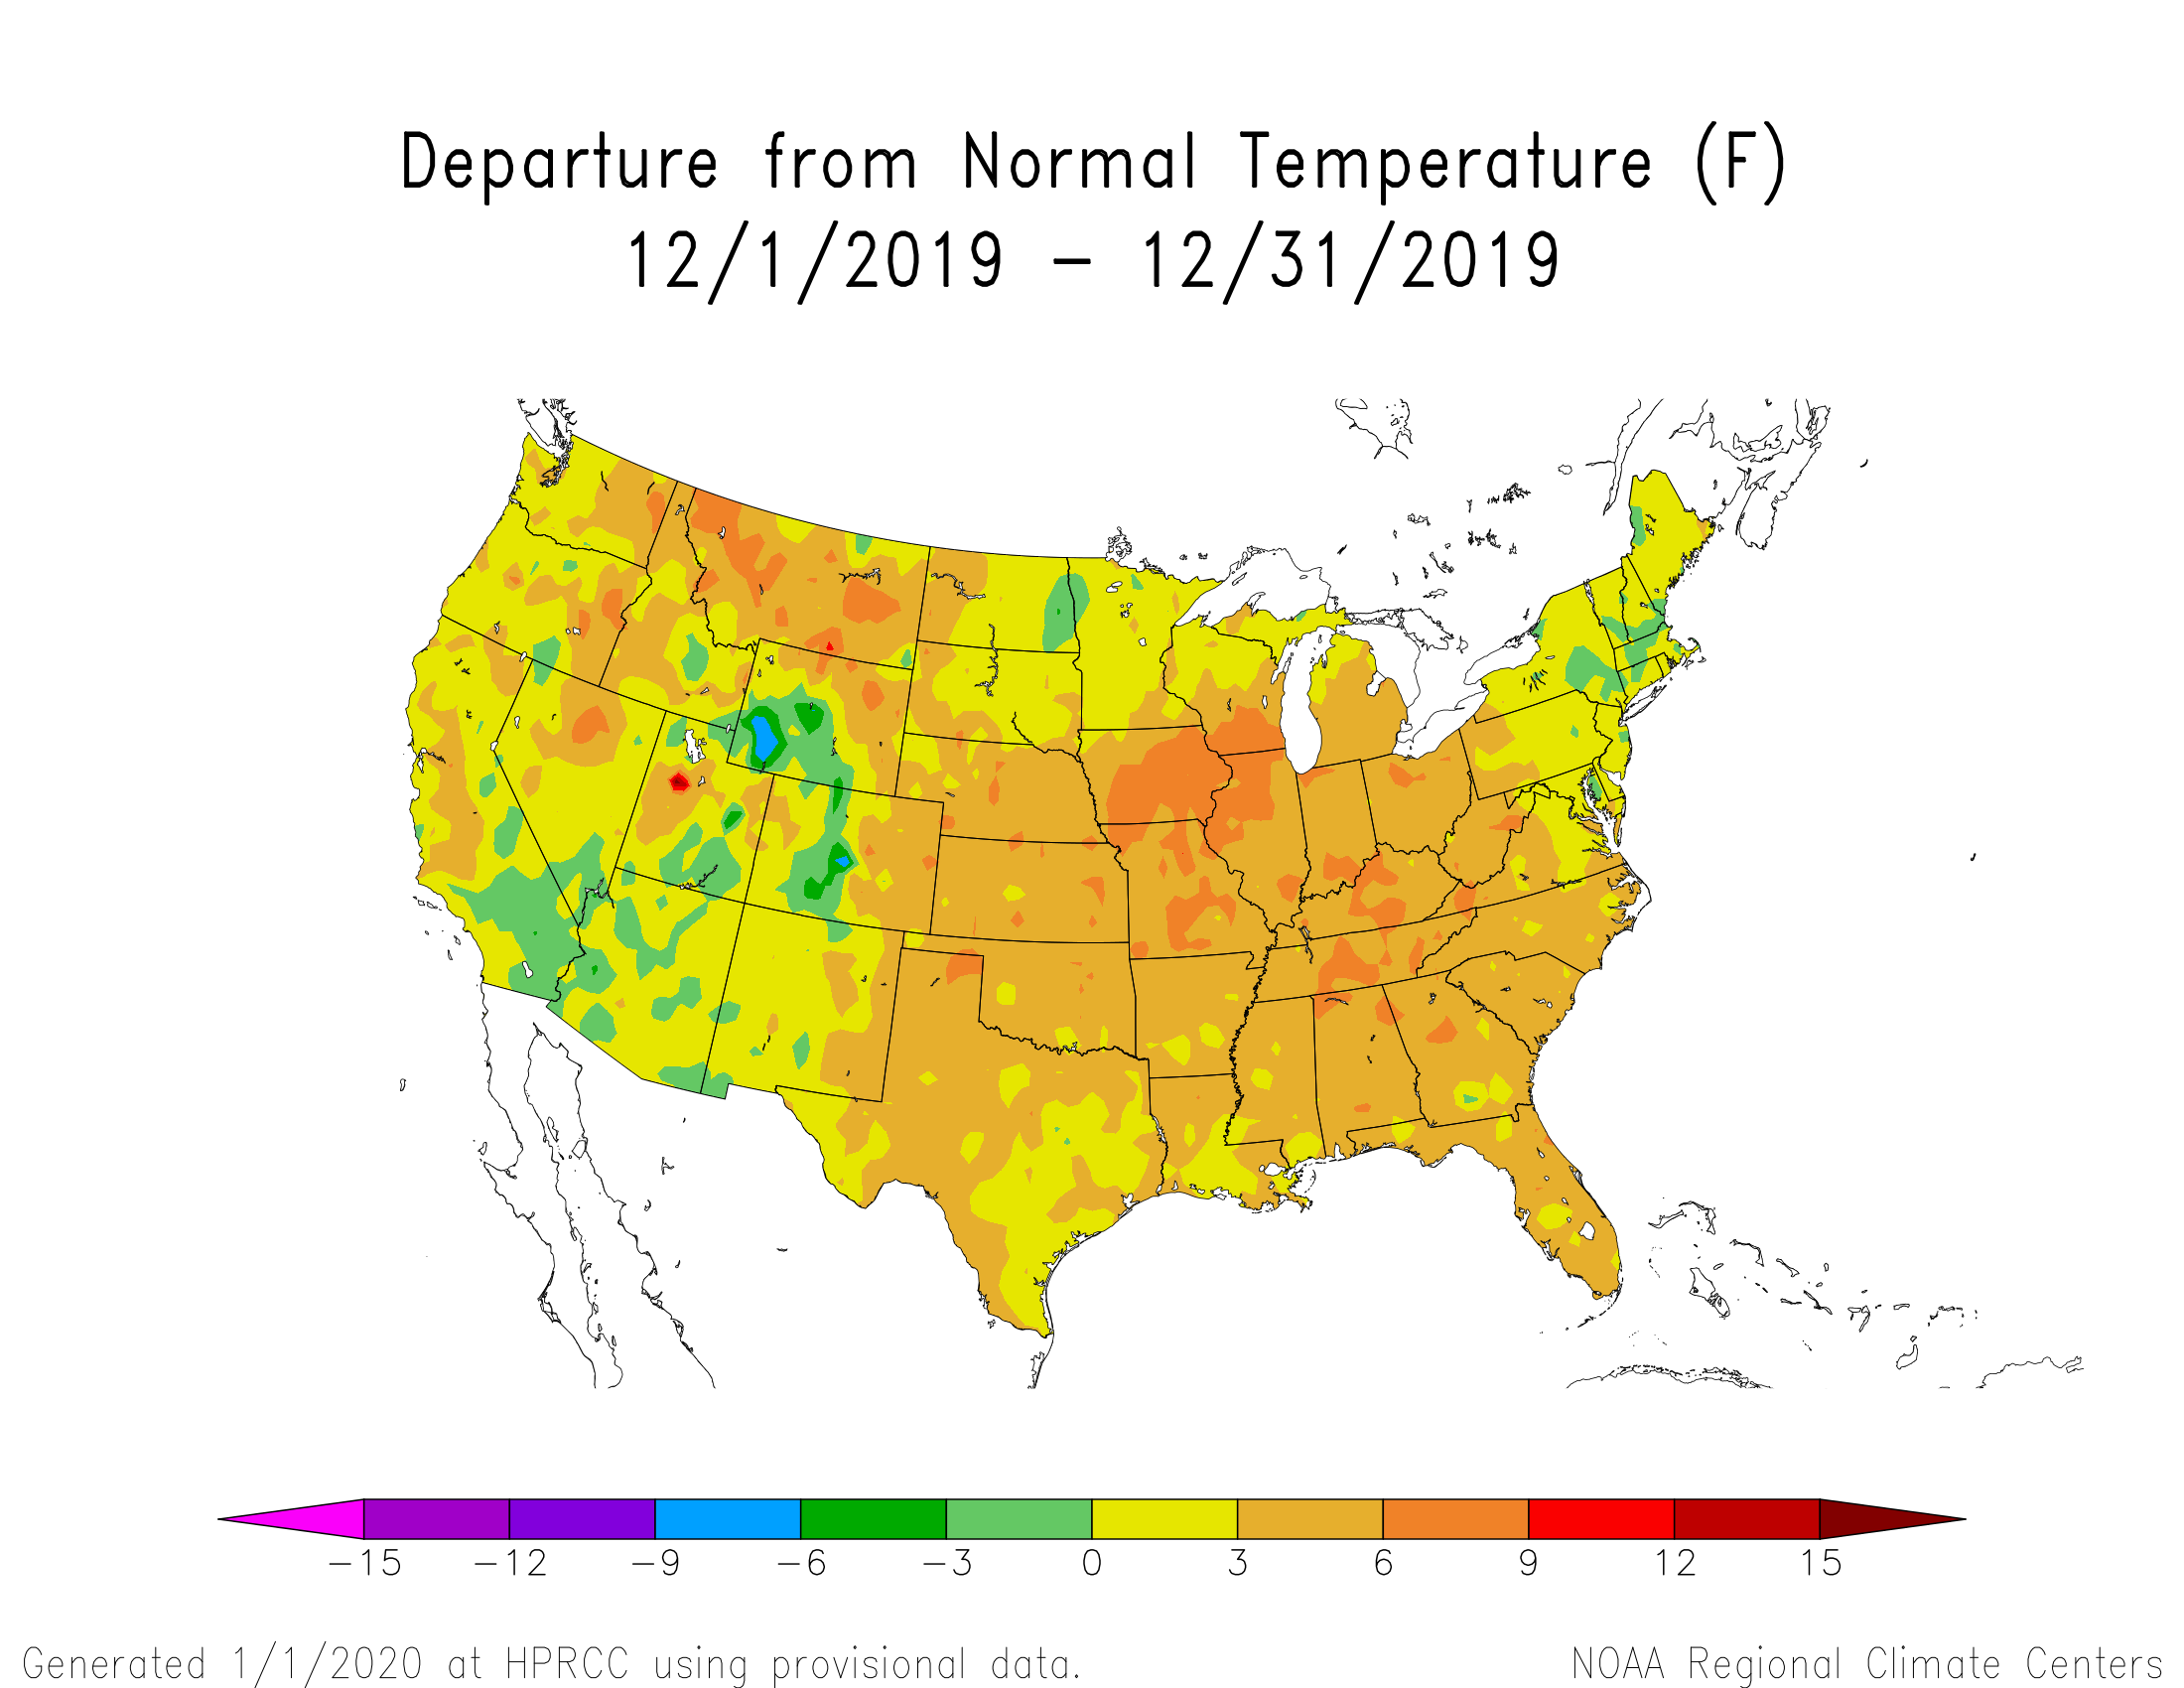
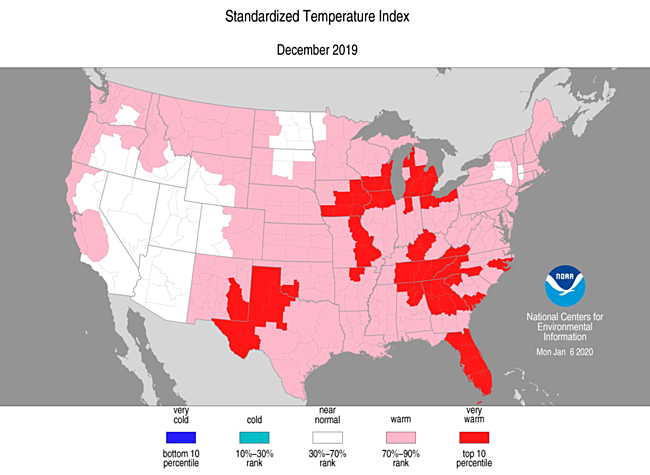
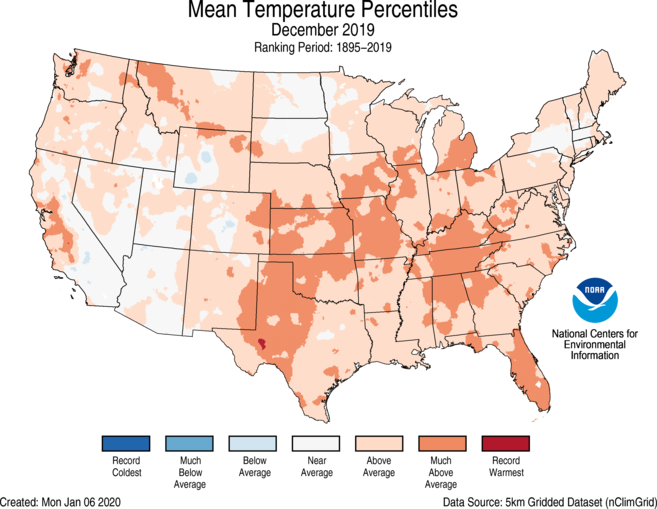
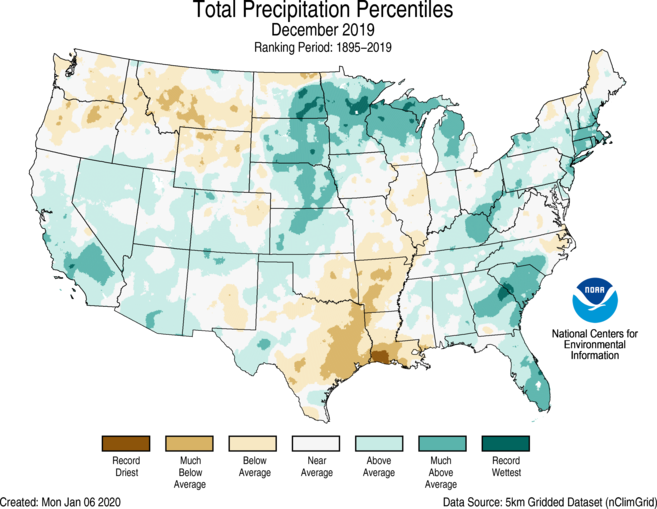
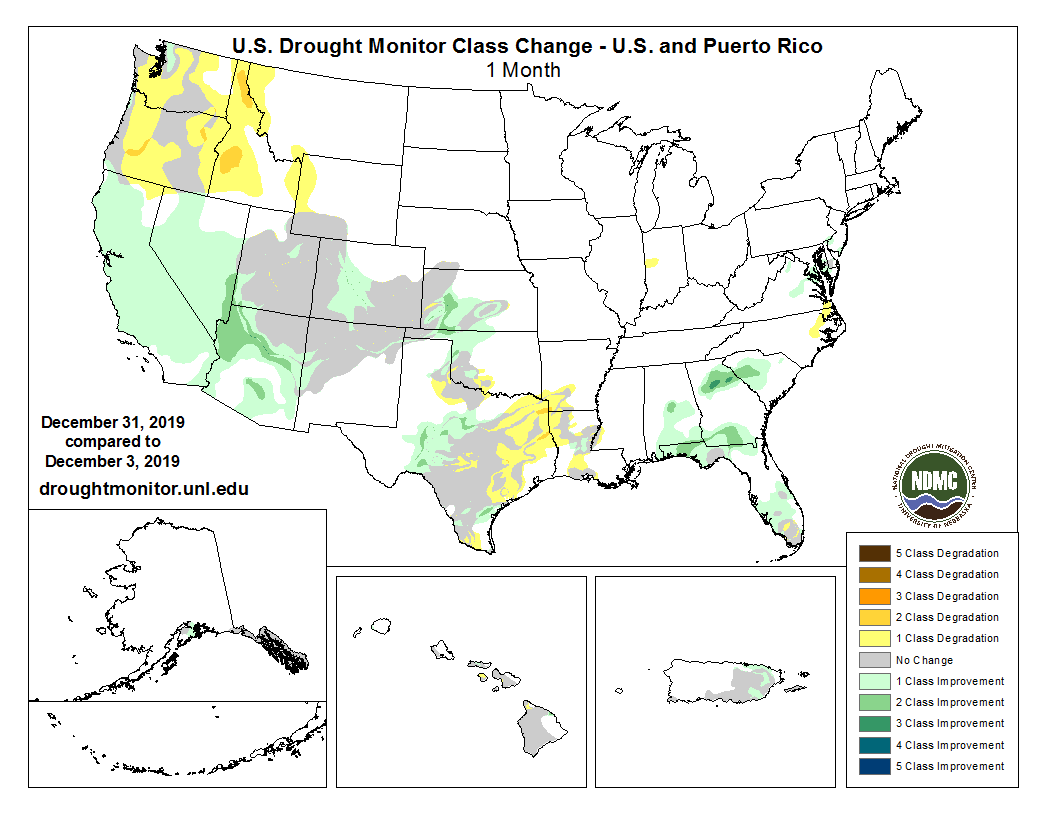
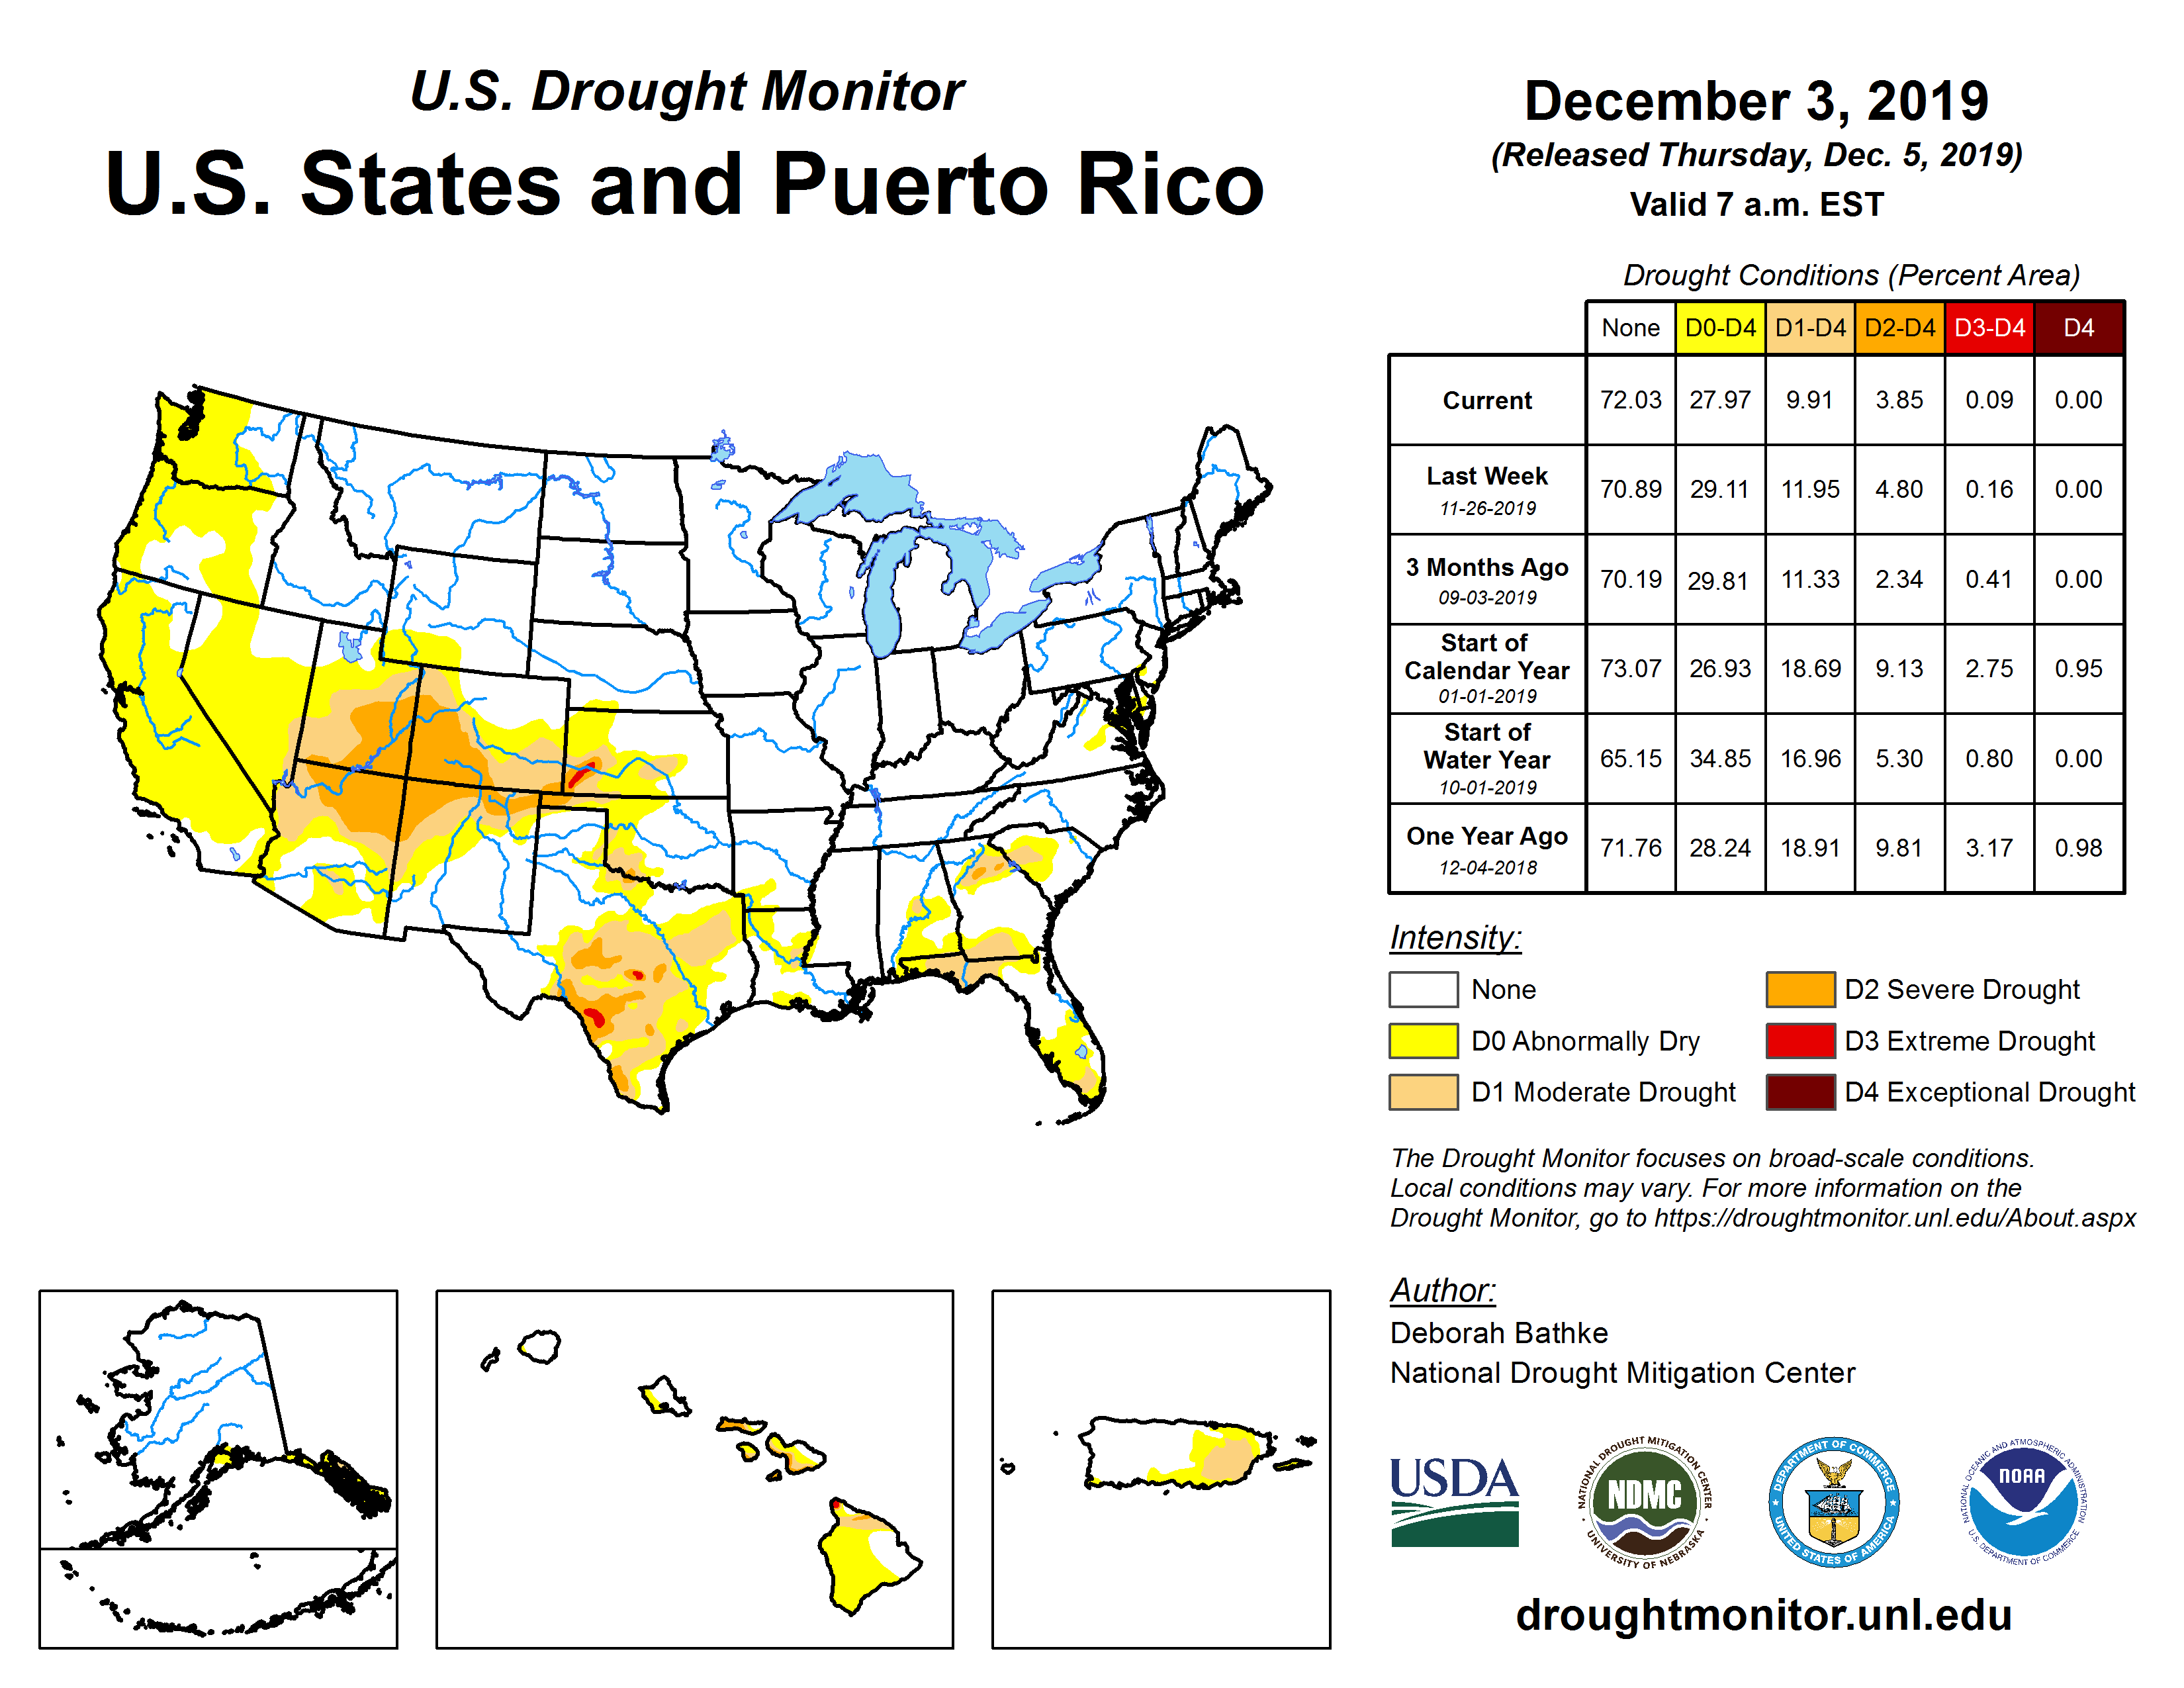
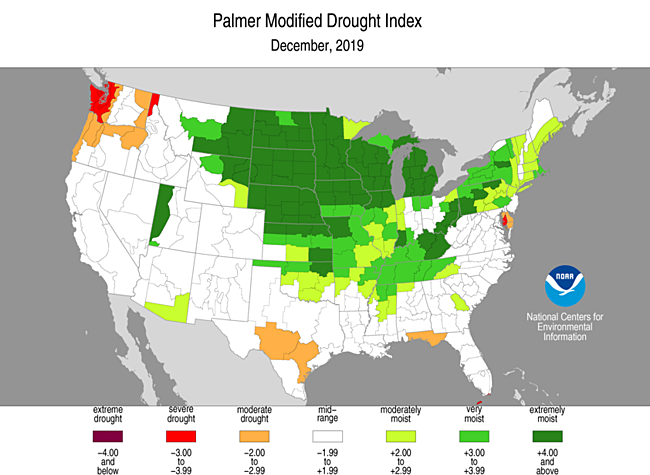
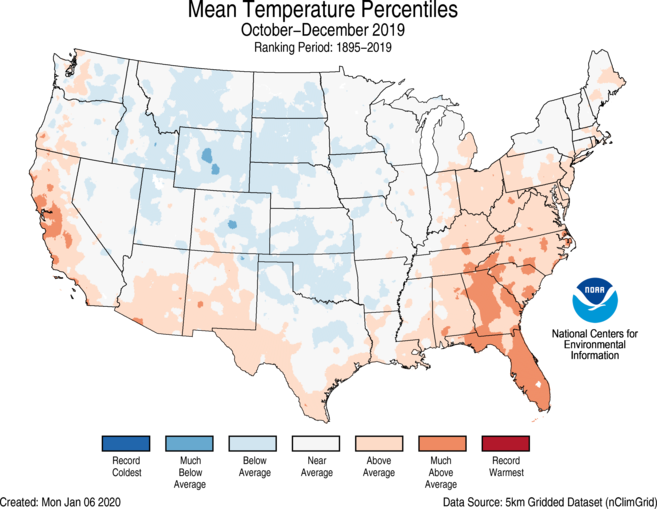
The upper-level circulation over the CONUS during December 2019 consisted of numerous short-wave troughs and ridges which moved quickly west to east across the country. Occasionally long-wave ridges and troughs would become established, but they did not last long. The normal or climatological ("climo") mean circulation pattern across the CONUS consists of a ridge over the West and trough over the East. But when averaged over the month for December 2019, the ridge/trough pattern was flattened into a more zonal flow. The more zonal monthly flow and weakened eastern trough contributed to warmer-than-normal monthly temperatures across most of the CONUS. The short-wave troughs, and surface lows and fronts associated with them, brought precipitation along their storm tracks. One track left above-normal precipitation across the Southwest, central and northern Plains, to western Great Lakes, while another spread above-normal precipitation across the Southeast, Appalachian Mountain Chain, and Northeast. December precipitation was drier than normal outside these storm tracks — especially across much of the Pacific Northwest to northern Rockies and northern High Plains, and from the southern Plains to Mid-Mississippi Valley. Much of Alaska, Hawaii, Puerto Rico, and the U.S. Virgin Islands, and some of the U.S.-Affiliated Pacific Islands, were also drier than normal for the month. As a result of these conditions, drought and abnormal dryness expanded or intensified in the Pacific Northwest and parts of the southern Plains. Drought and abnormal dryness contracted or became less intense across much of the Southwest and Southeast, and parts of Texas to Kansas. Drought contraction was more than expansion this month, with the USDM-based national moderate-to-exceptional drought footprint across the CONUS falling from 11.7 percent of the CONUS at the end of November to 11.2 percent of the CONUS at the end of December (from 9.9 percent to 9.5 percent for the 50 States and Puerto Rico). According to the Palmer Drought Index, which goes back to the beginning of the 20th century, about 5.3 percent of the CONUS was in moderate to extreme drought at the end of December, increasing about 0.3 percent from the 5.0 percent at the end of November.
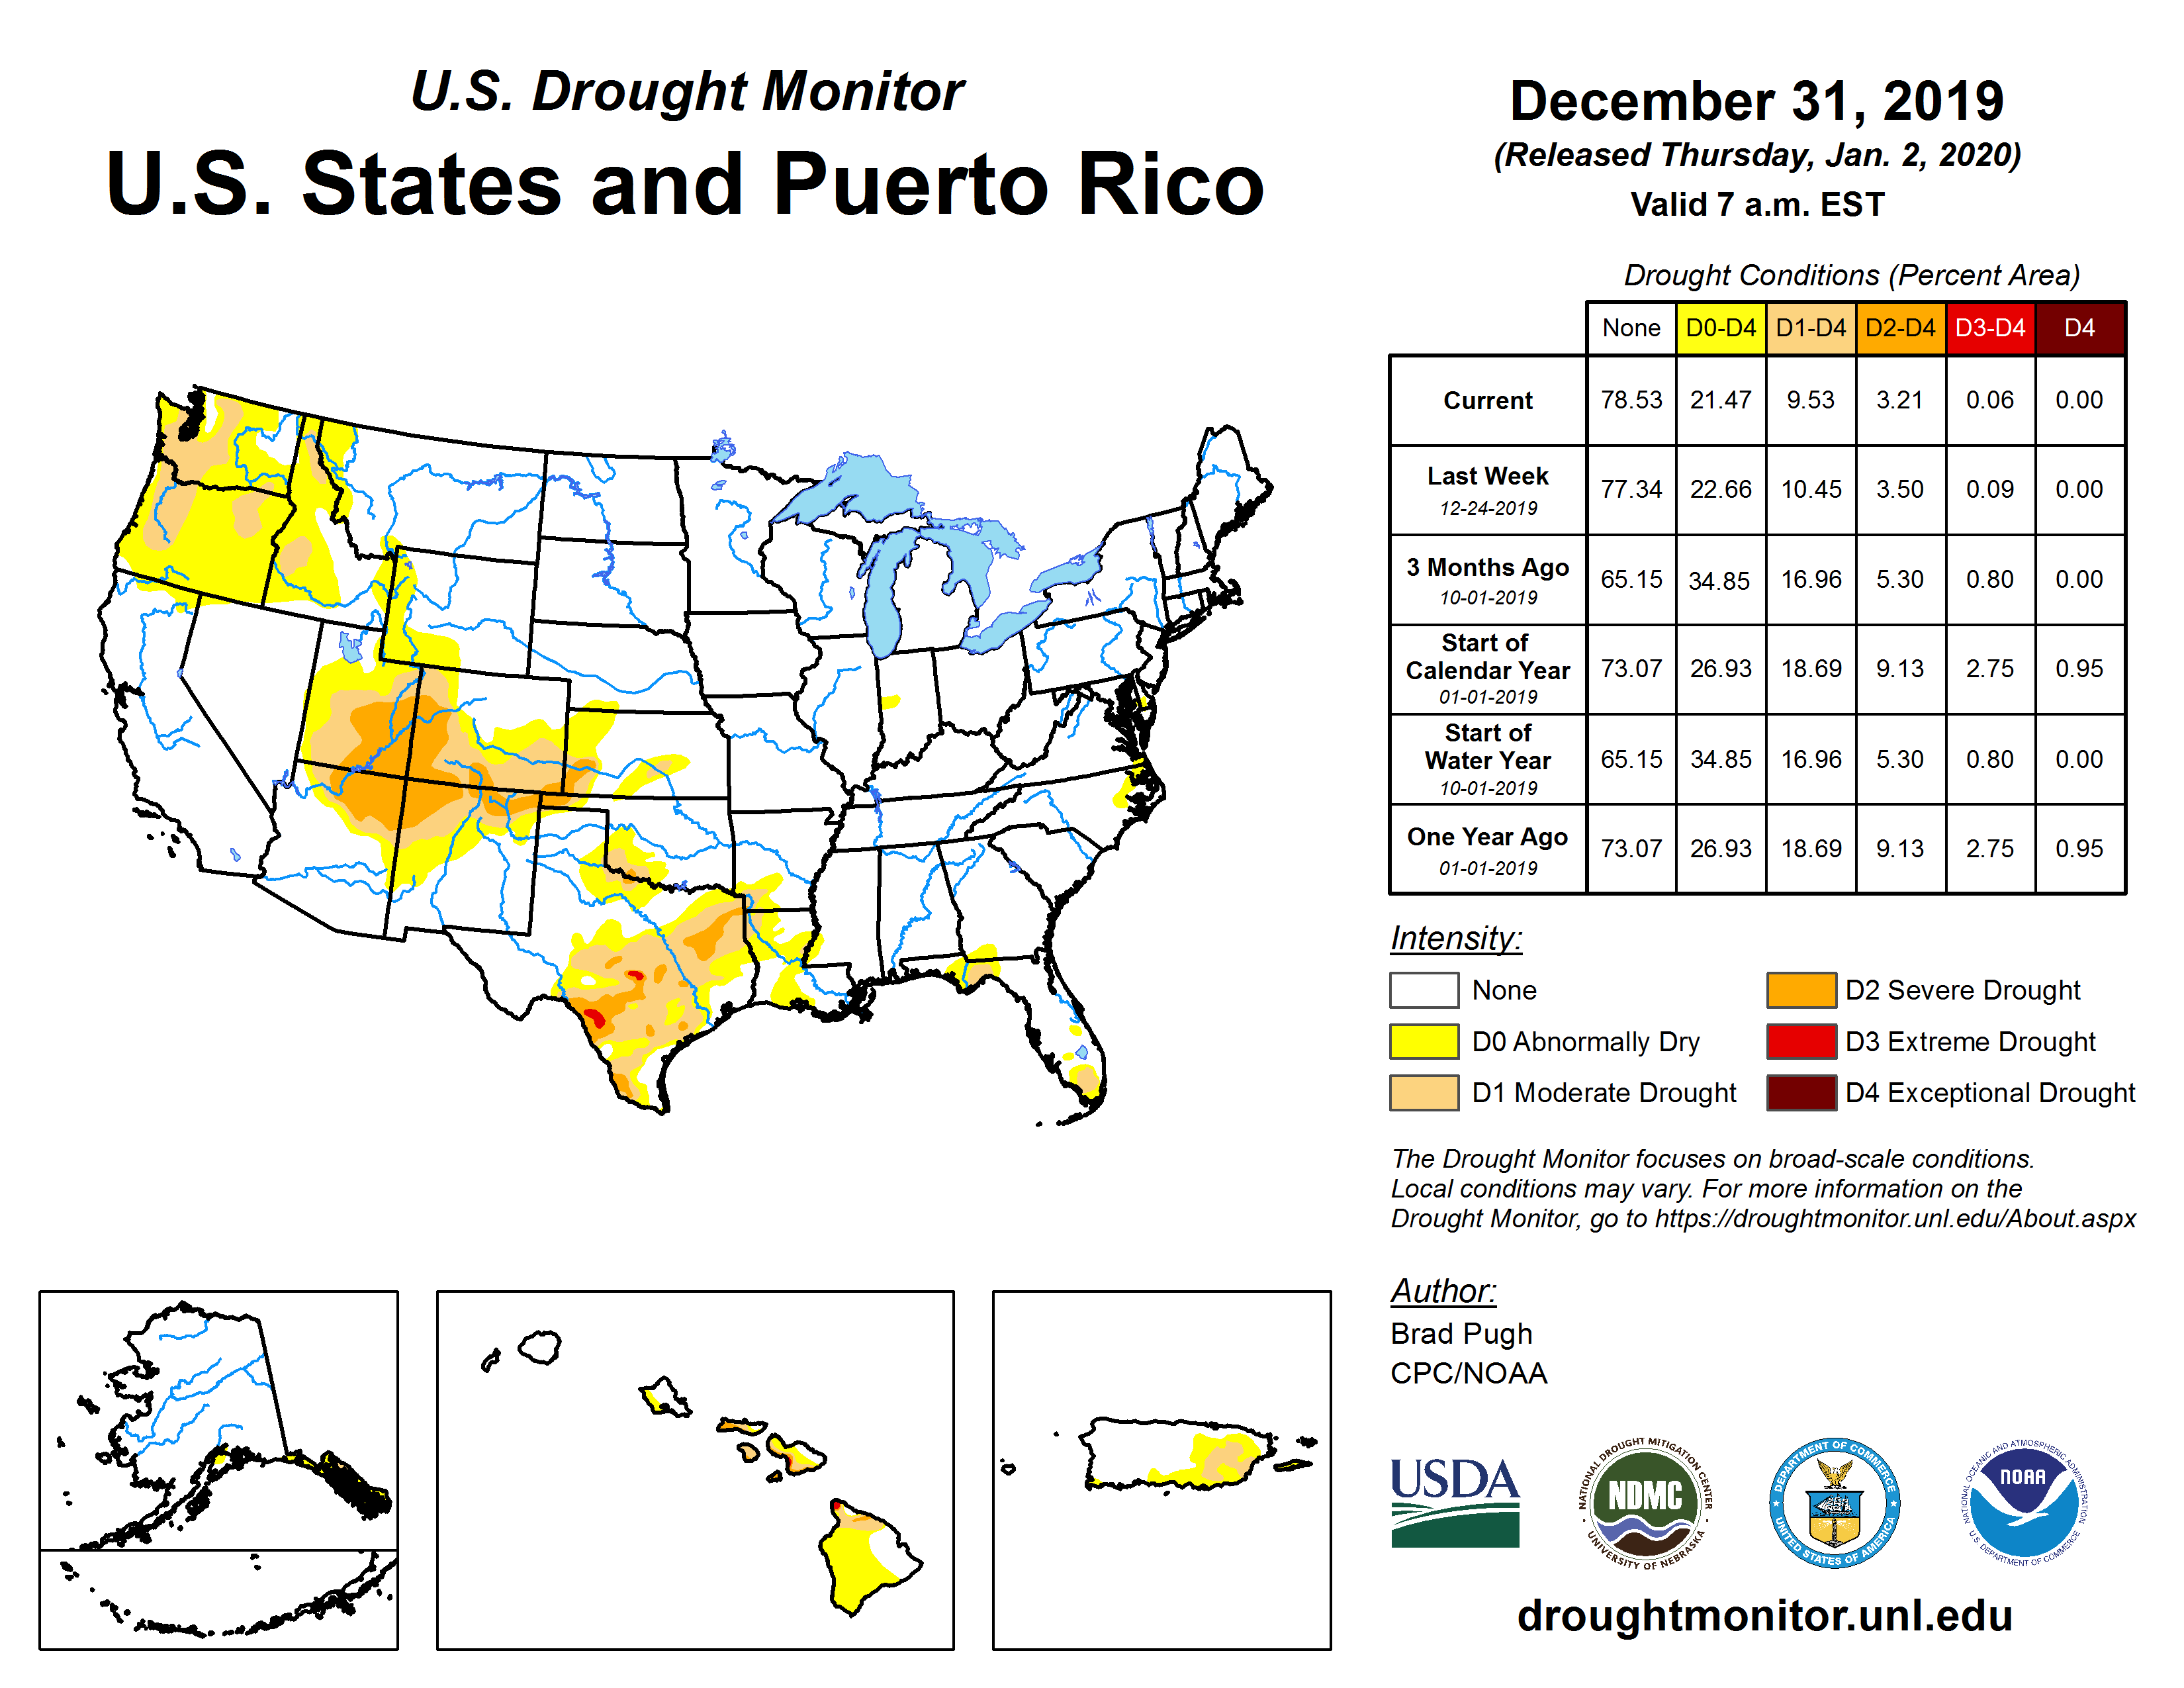
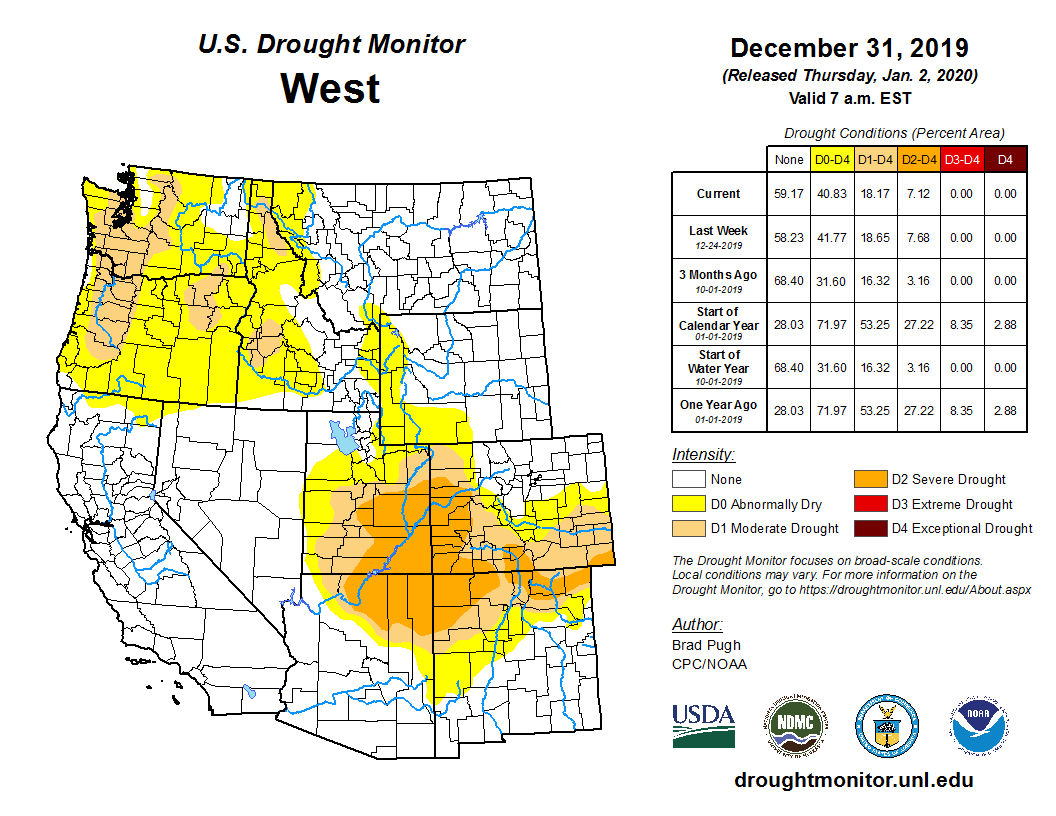
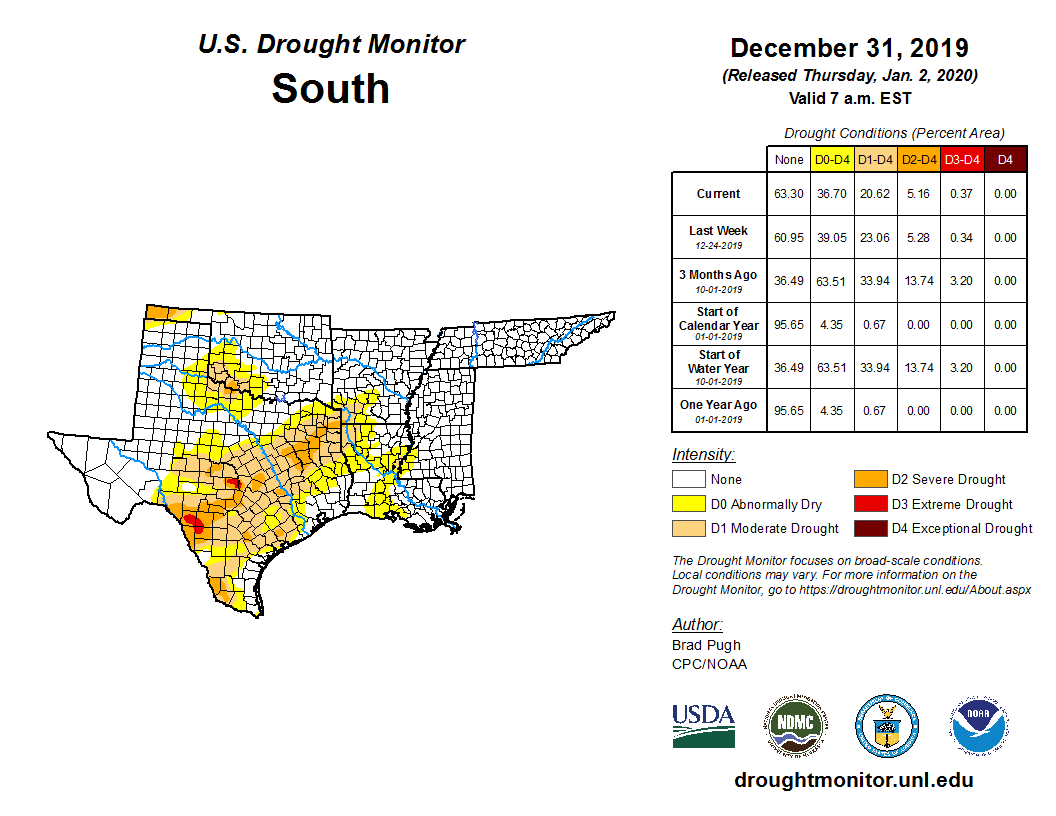
Drought conditions at the end of December, as depicted on the December 31st, 2019 USDM map, included the following core drought and abnormally dry areas:
- Moderate (D1) to severe (D2) drought covered a large part of the Southwest spreading into the central High Plains, with abnormal dryness (D0) and moderate drought over the Pacific Northwest. The percent area of the West (from the Rockies to the West Coast) in moderate to extreme drought (based on the Palmer Drought Index) was roughly the same as last month, hovering at about 9.1 percent. The area of the West experiencing moist conditions increased slightly to 6.1 percent at the end of December.
- Abnormal dryness (D0) to severe drought continued in the central Plains, with abnormal dryness to extreme (D3) drought covering large parts of the southern Plains.
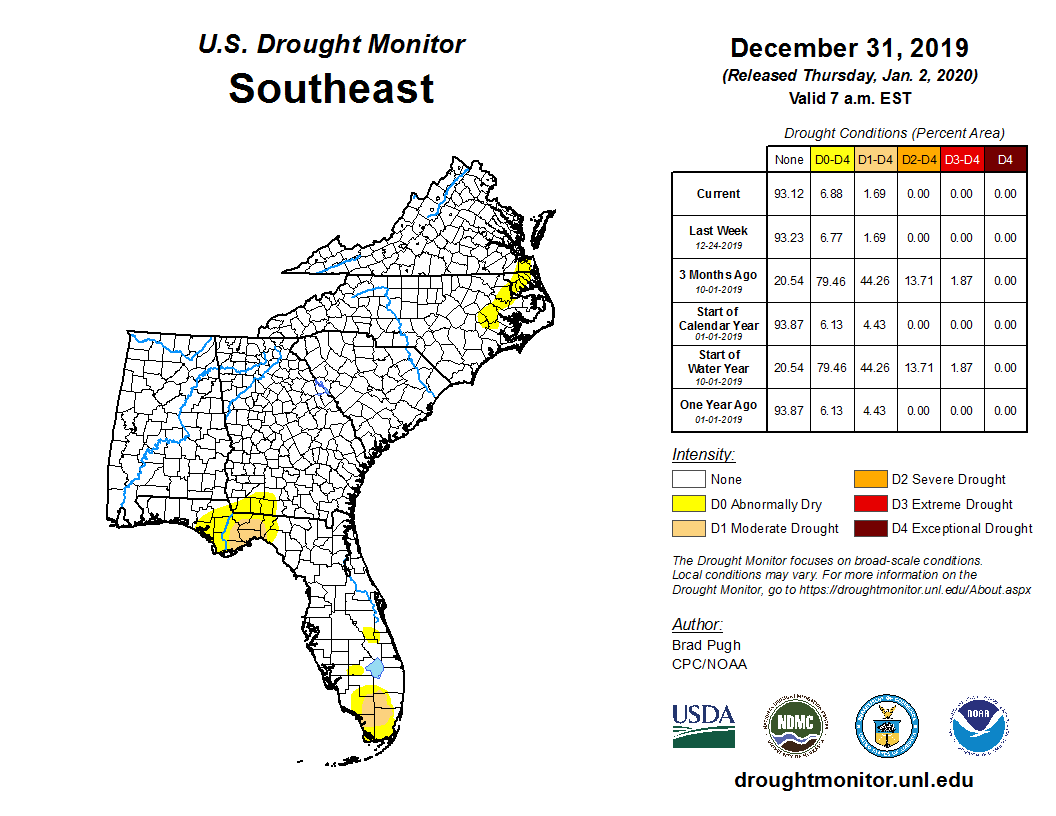
- Severe drought disappeared and moderate drought contracted considerably in the Southeast, leaving behind spots of abnormal dryness to moderate drought in Florida and a smear of abnormal dryness in eastern North Carolina.
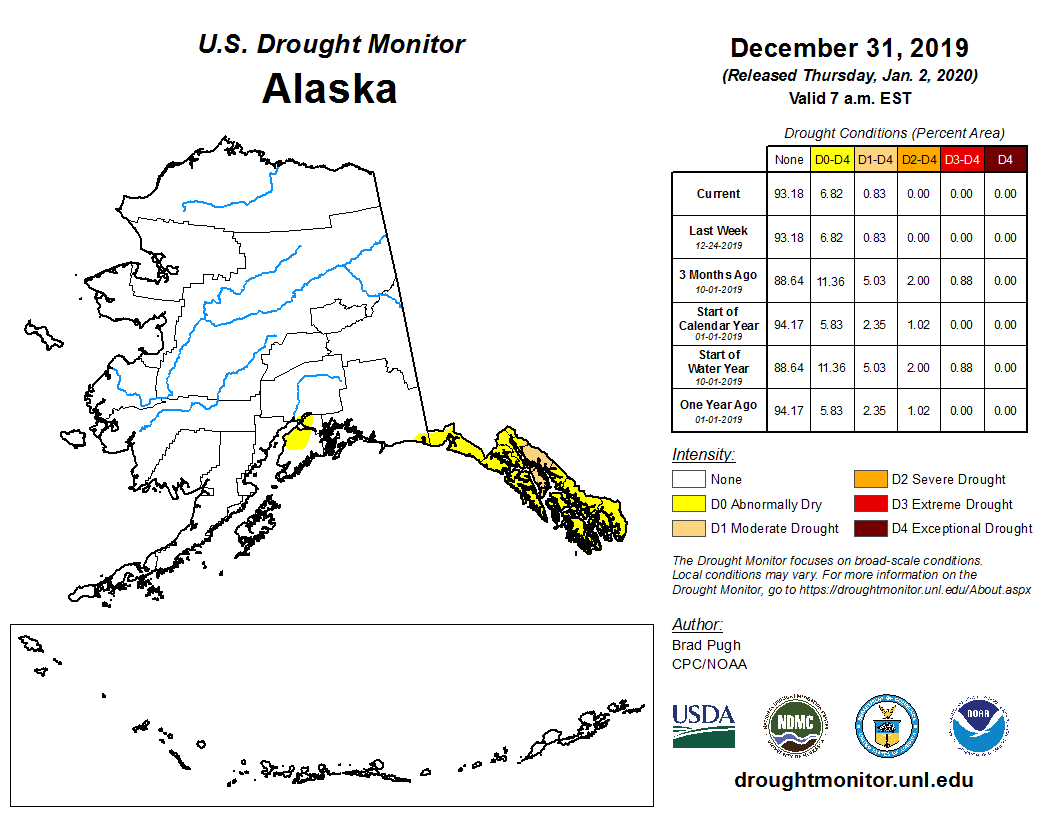
- An area of moderate drought remains in the Alaskan panhandle with abnormal dryness across the panhandle and a small part of south coastal Alaska.
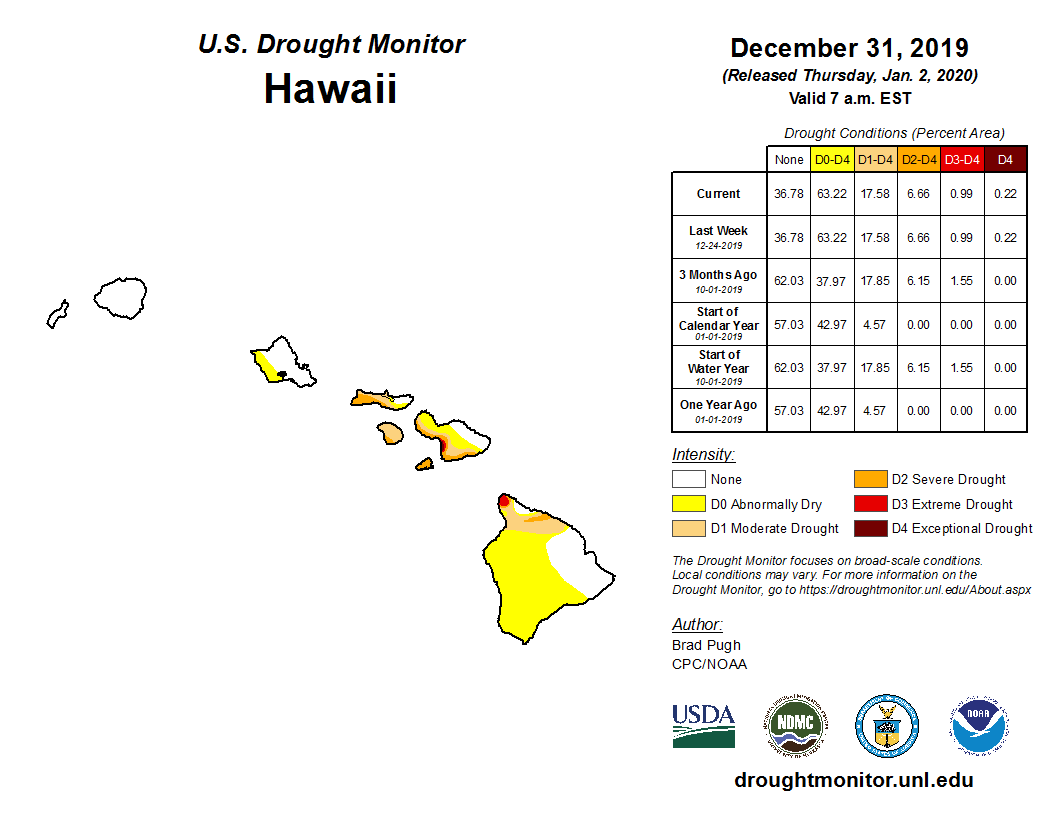
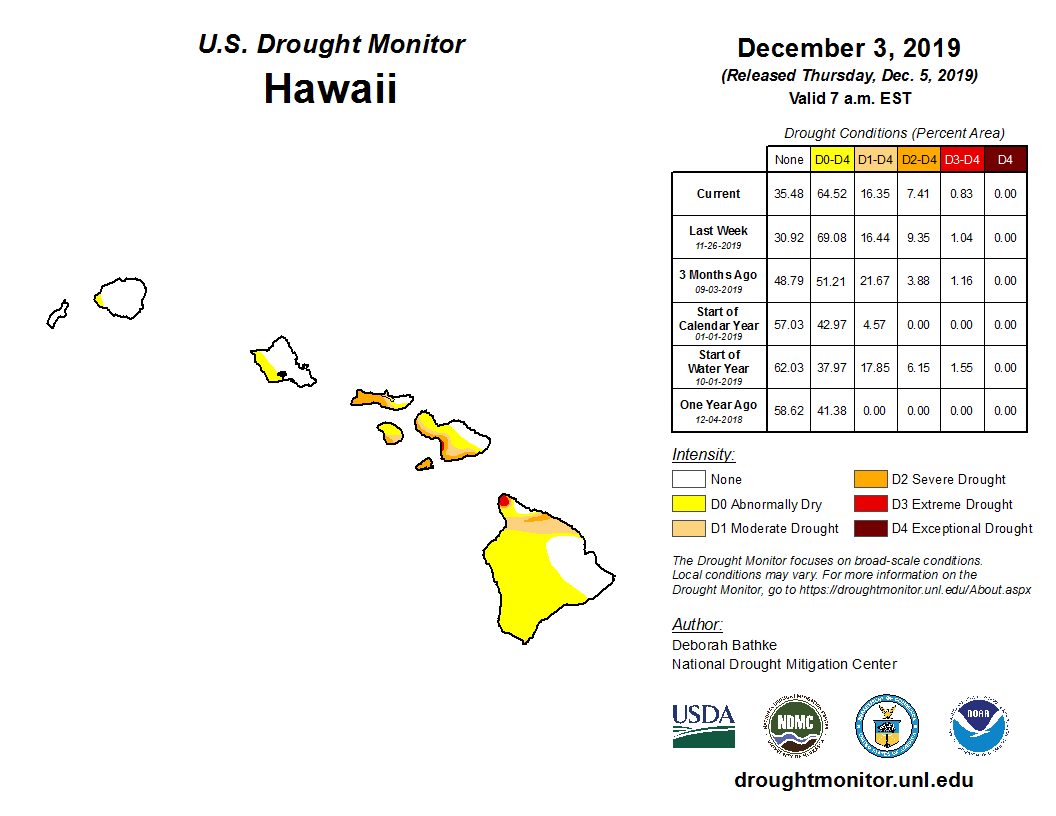
- In Hawaii, abnormal dryness to extreme drought continued, with a small spot of exceptional drought. About 17.6 percent of the state was in drought (D1-D4) and 63.2 percent was experiencing abnormally dry conditions or drought (D0-D4).
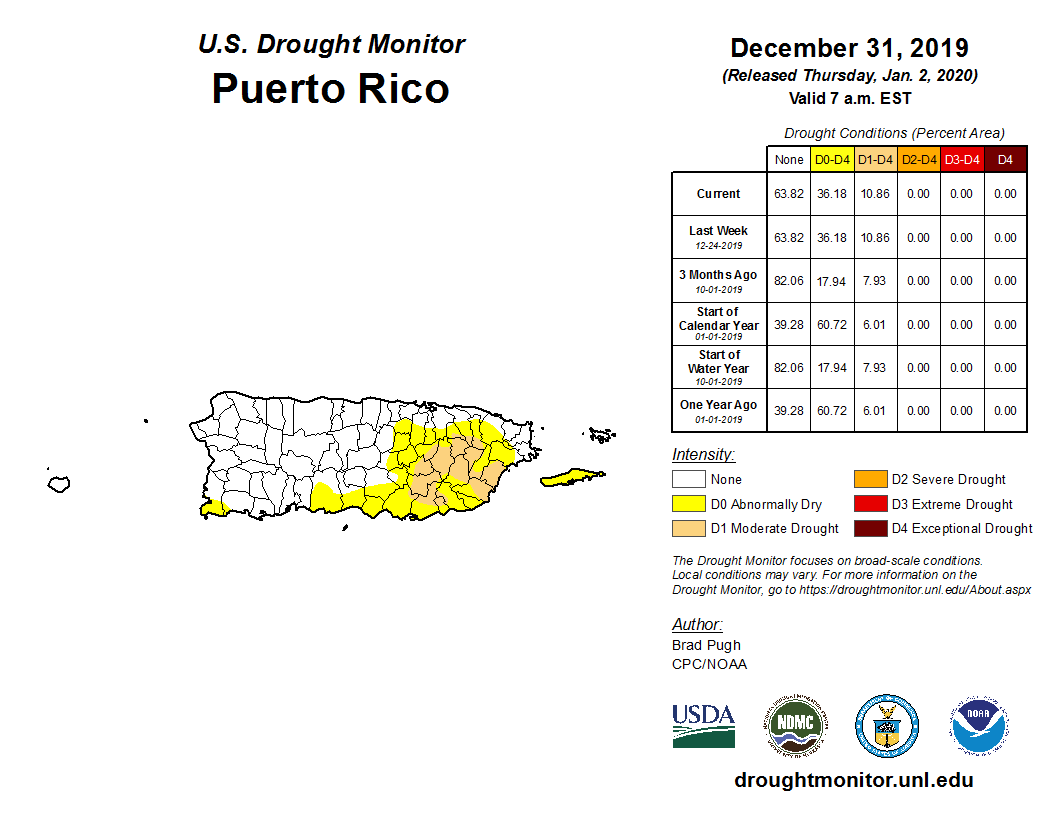
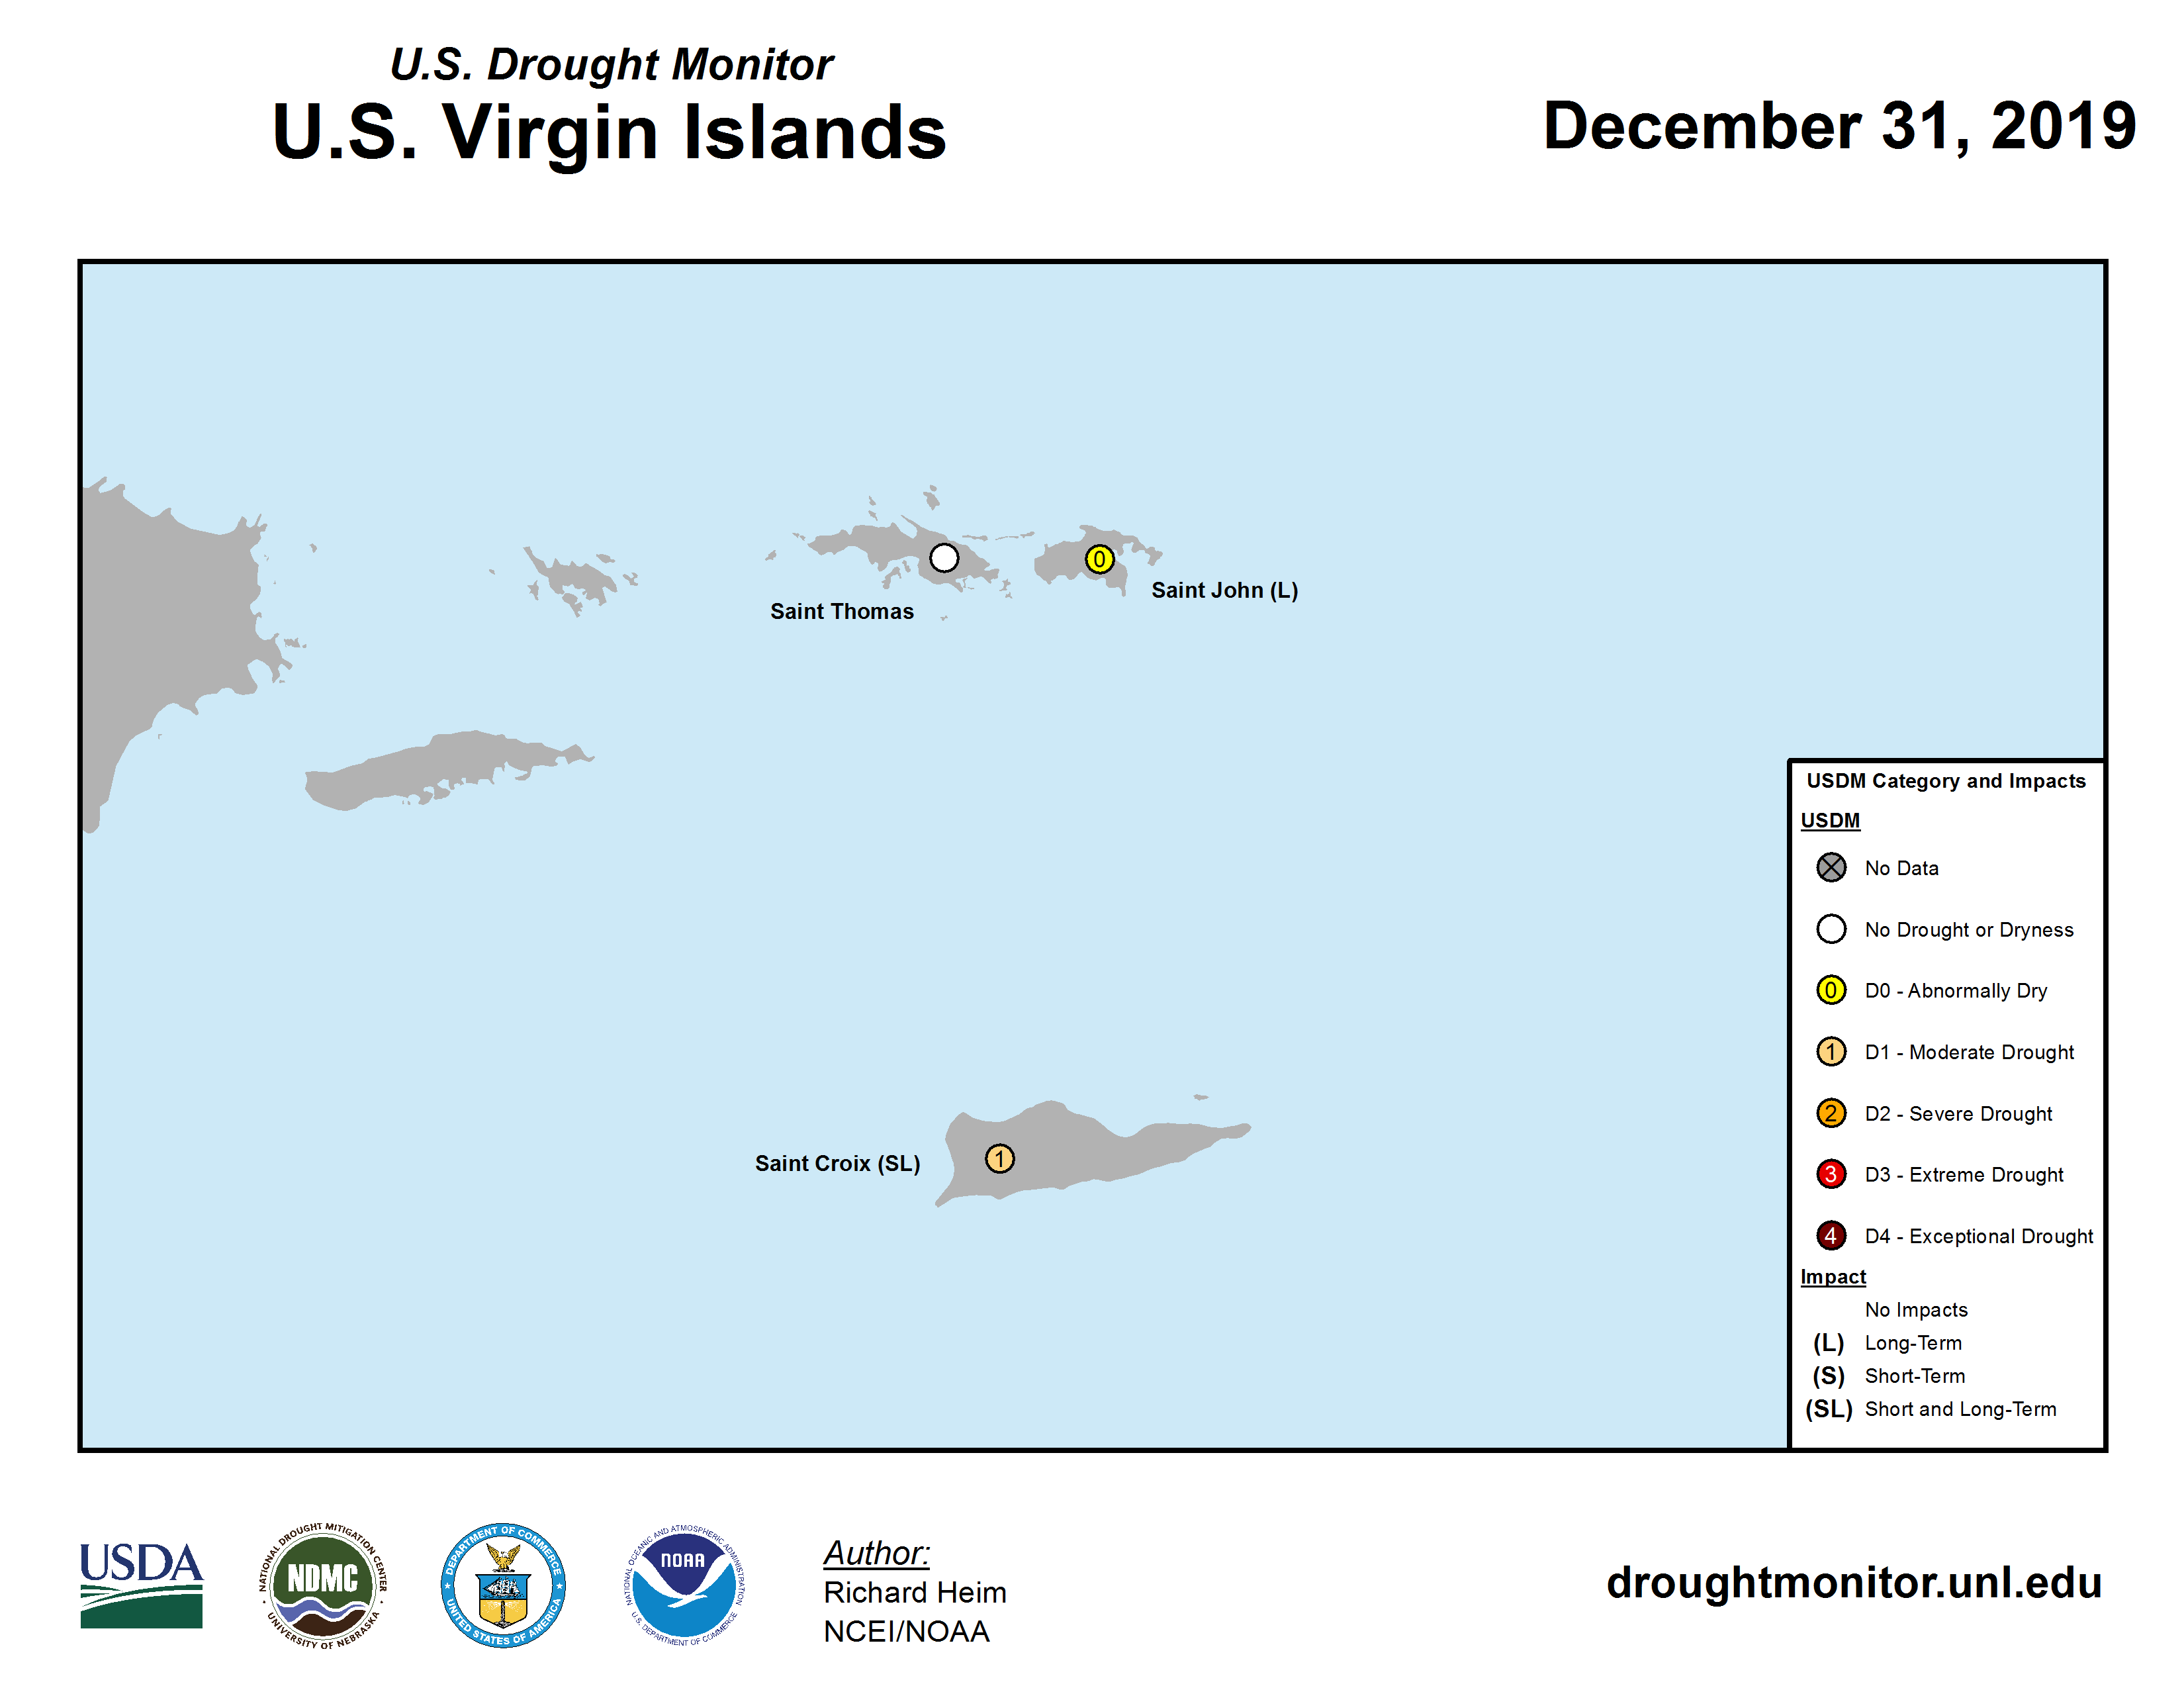
- Moderate drought contracted in Puerto Rico, while abnormal dryness continued on St. John and moderate drought continued on St. Croix in the U.S. Virgin Islands.
- In the U.S.-Affiliated Pacific Islands (USAPI), abnormal dryness developed on Majuro, while the rest of the USAPI was free of drought or abnormal dryness.
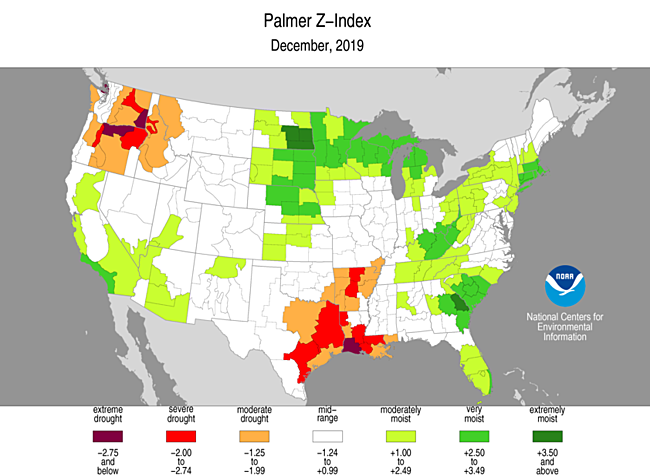
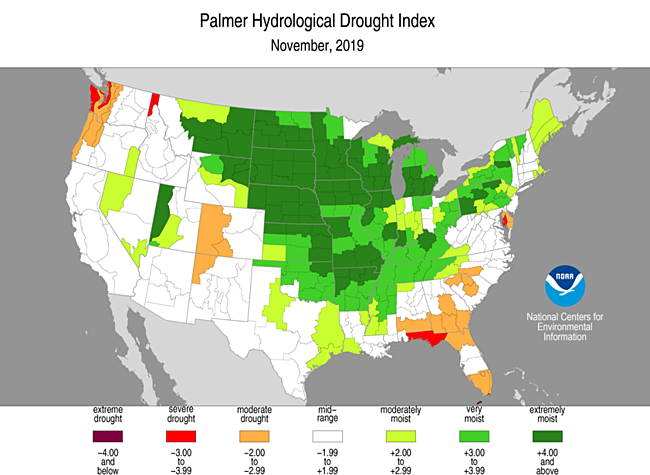
Palmer Drought Index
The Palmer drought indices measure the balance between moisture demand (evapotranspiration driven by temperature) and moisture supply (precipitation). The Palmer Z Index depicts moisture conditions for the current month, while the Palmer Hydrological Drought Index (PHDI) and Palmer Drought Severity Index (PDSI) depict the current month's cumulative moisture conditions integrated over the last several months. While both the PDSI and PHDI indices show long-term moisture conditions, the PDSI depicts meteorological drought while the PHDI depicts hydrological drought. The PDSI map may show less severe and extensive drought (as well as wet spell conditions) in some parts of the country than the PHDI map because the meteorological conditions that produce drought and wet spell conditions are not as long-lasting as the hydrological impacts.
|
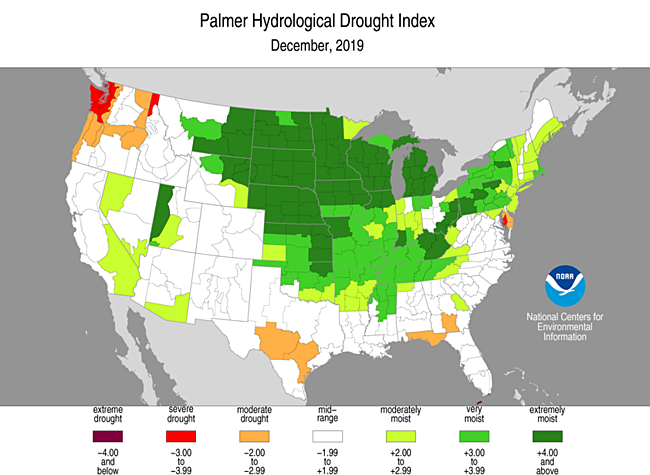 |
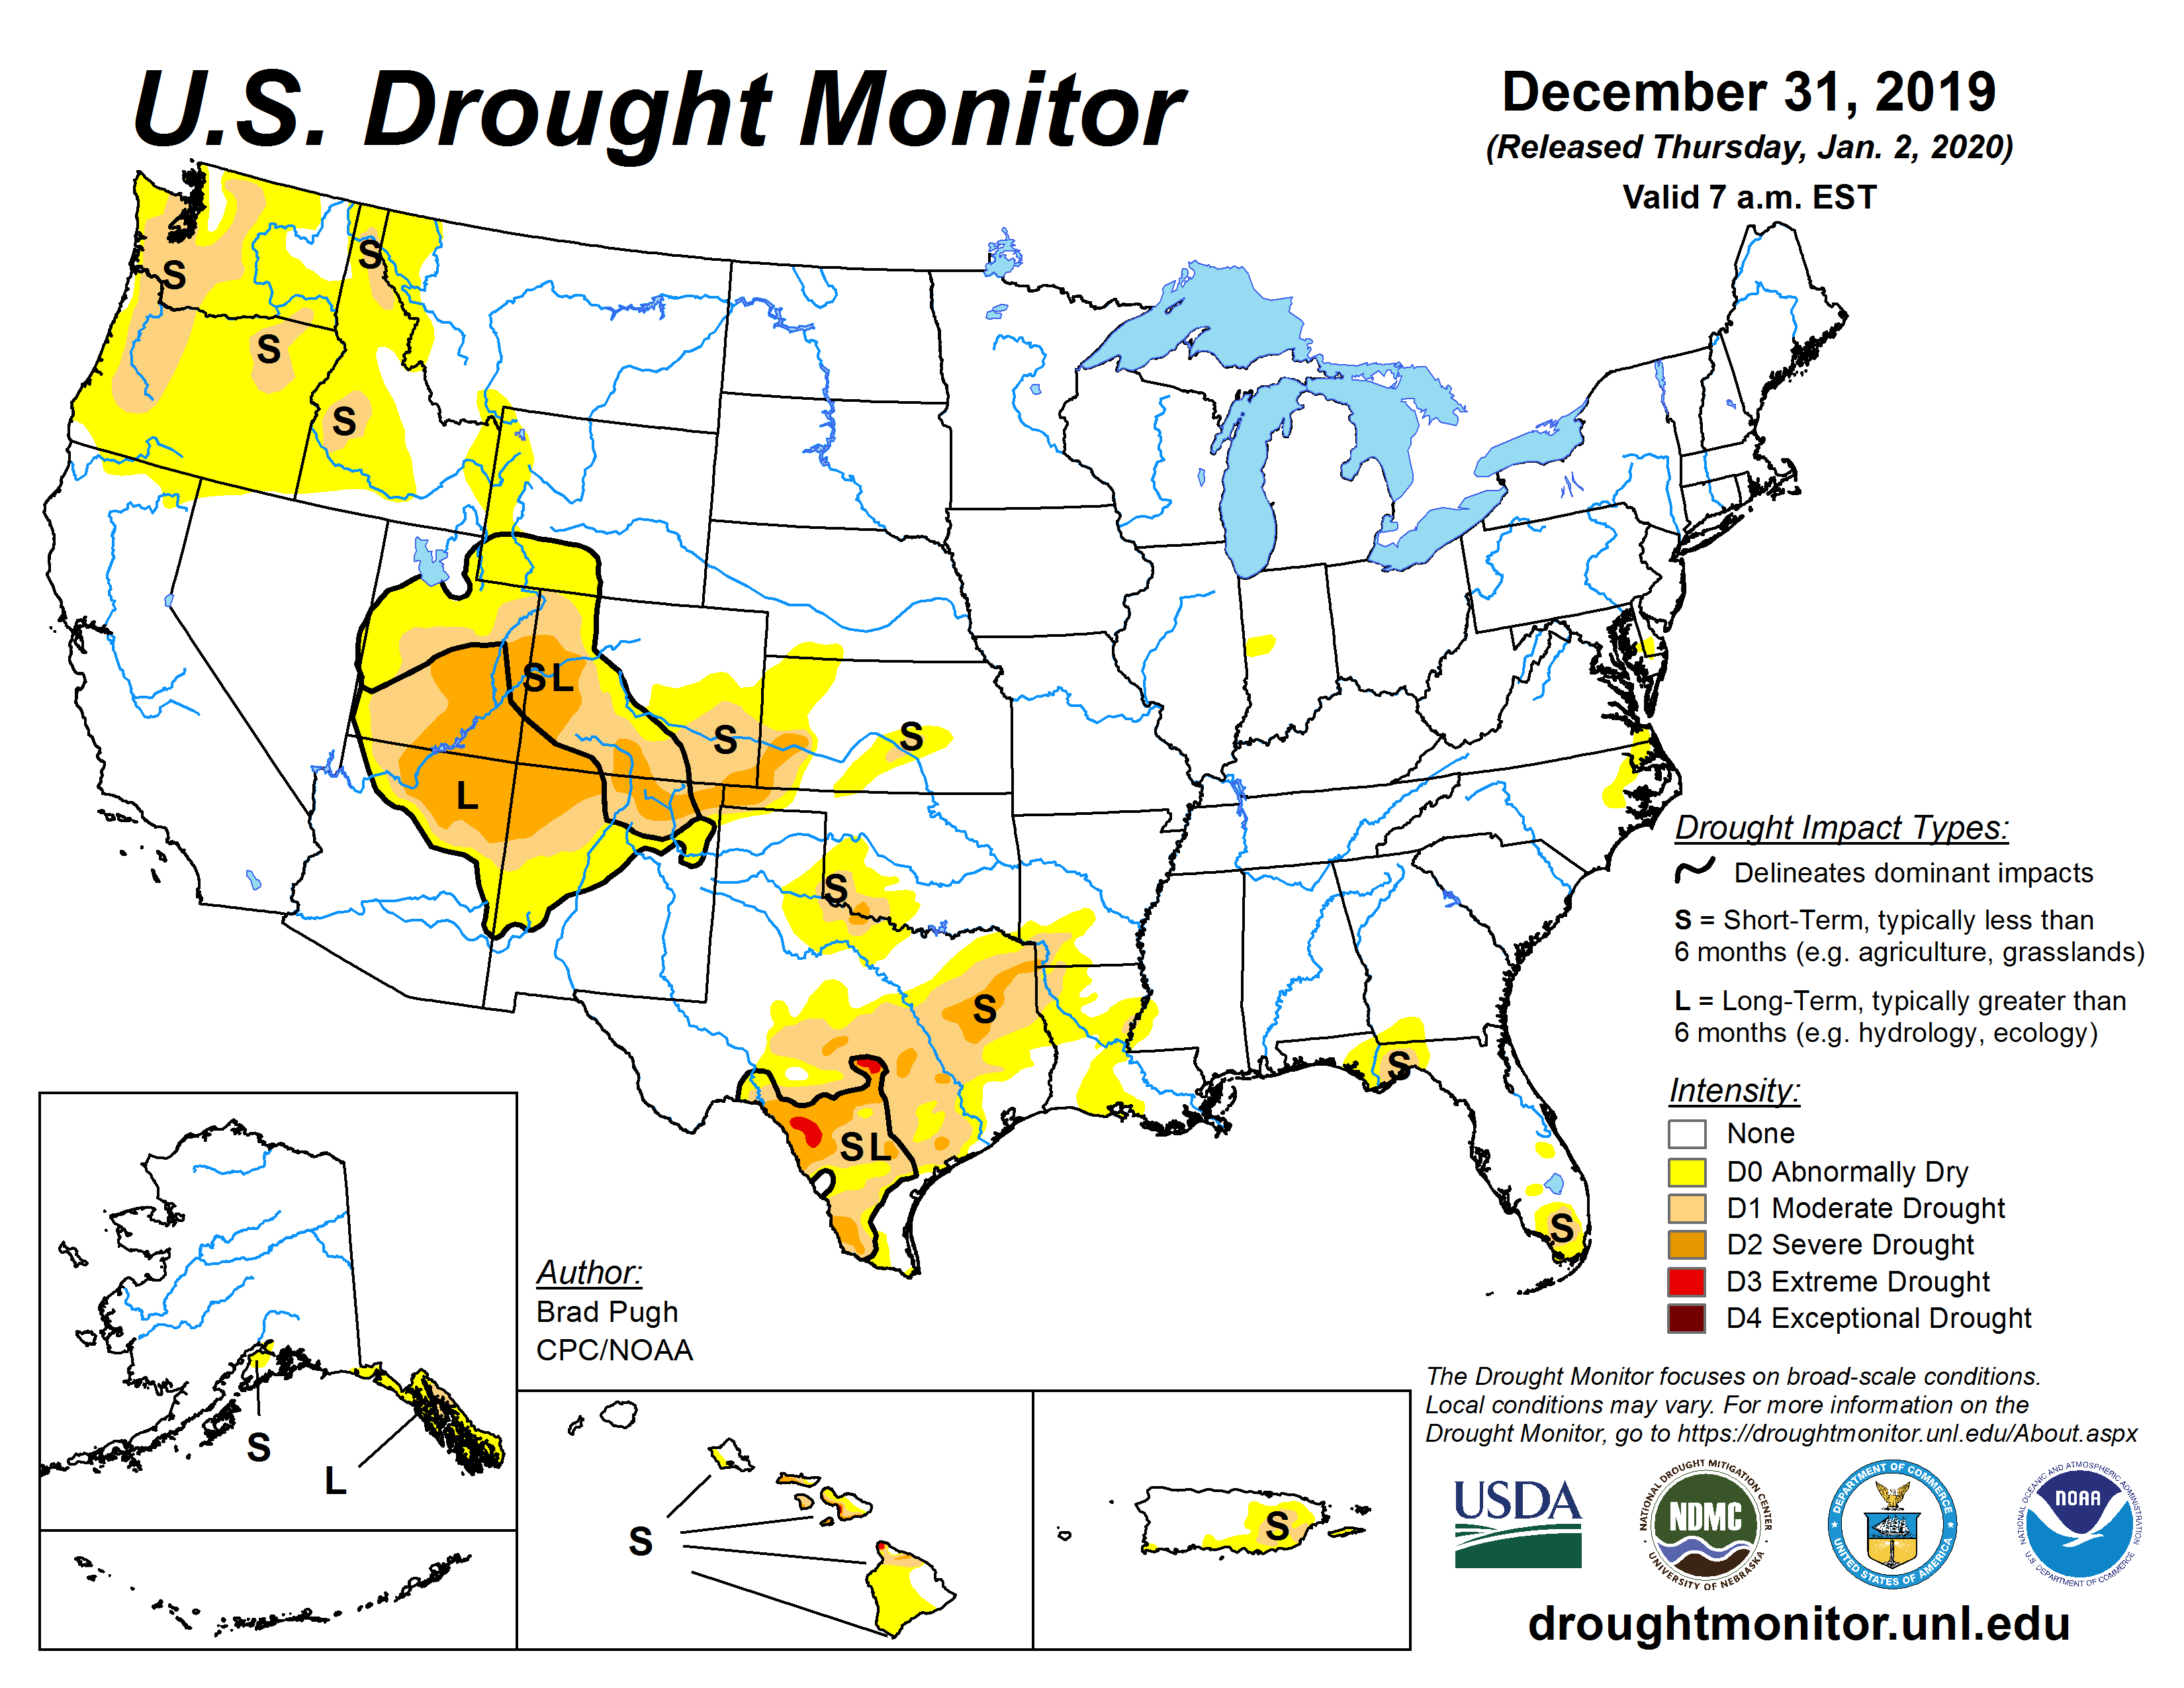
Used together, the Palmer Z Index and PHDI maps show that short-term drought occurred across the Pacific Northwest and adjacent northern Rockies. The persistence of short-term dry conditions expanded long-term drought in the Pacific Northwest during December compared to November. Short-term drought occurred in eastern Texas to the Lower Mississippi Valley, eliminating long-term wet areas in Texas. The recurrence of short-term dry conditions introduced long-term drought in southern Texas. Short-term wet conditions in the Southeast and near-normal to wet conditions during December in the Southwest shrank long-term drought in both regions and expanded long-term wet conditions in parts of the Southwest (December vs. November).
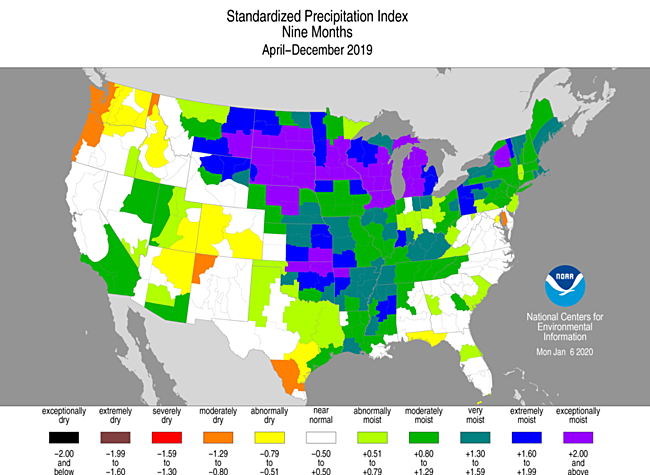
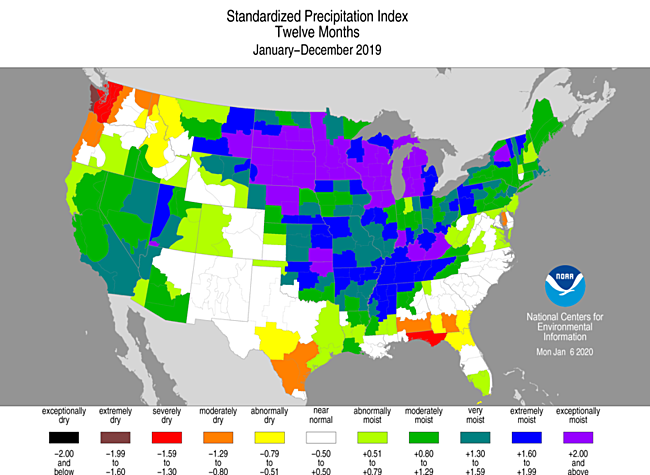
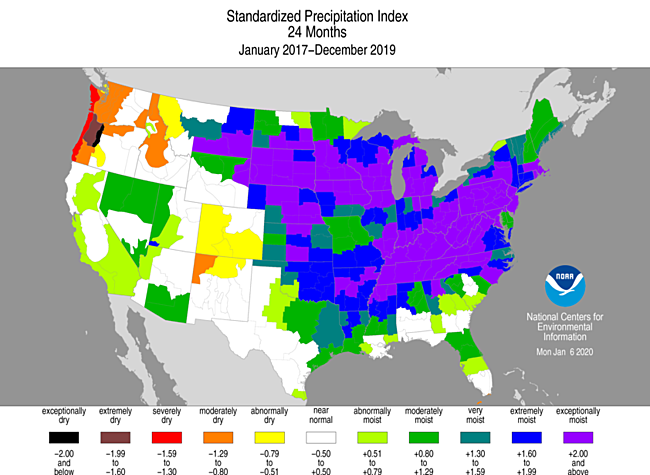
Standardized Precipitation Index
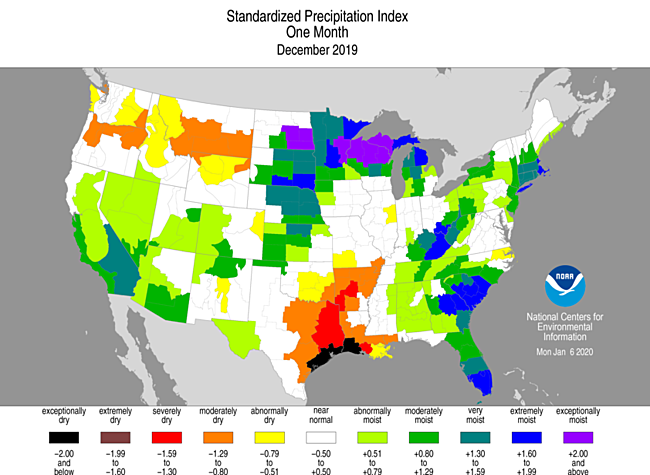
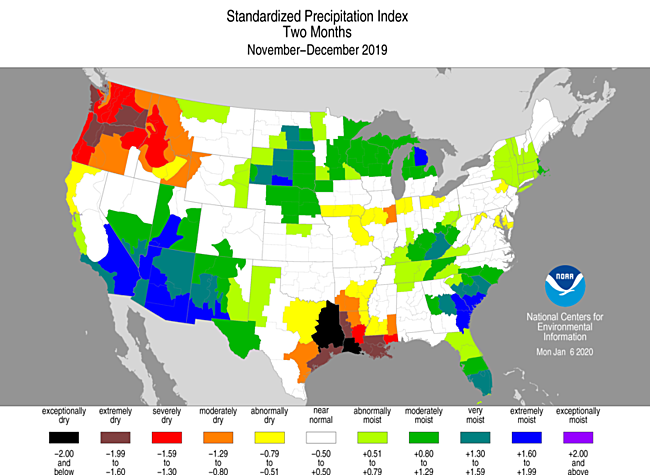
The Standardized Precipitation Index (SPI) measures moisture supply. The SPI maps here show the spatial extent of anomalously wet and dry areas at time scales ranging from 1 month to 24 months.
 |
 |
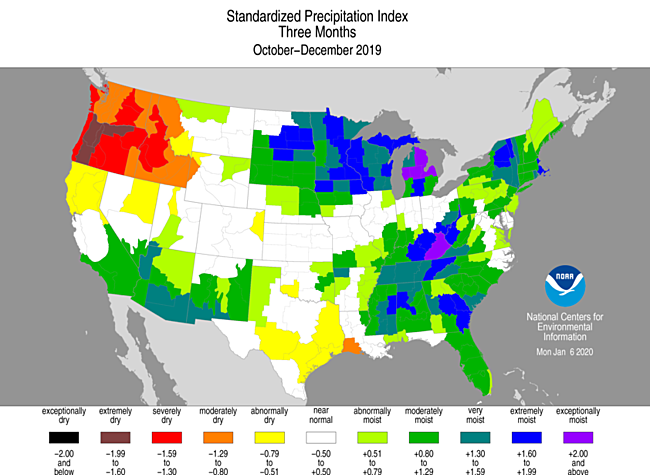 |
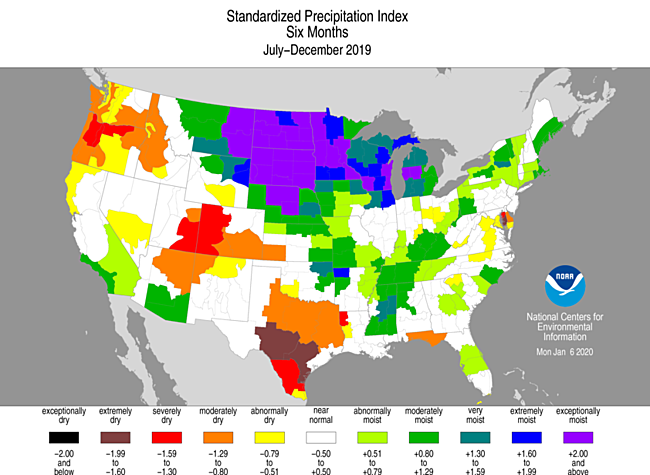
The SPI maps illustrate how moisture conditions have varied considerably through time and space over the last two years. The Pacific Northwest and adjacent parts of the northern Rockies are dry at all time scales, but very dry at the 2- to 3-month time scales; the coastal areas are very dry at the 12- to 24-month time scales. In spite of wetness at the 1- to 3-month time scales, the Southwest (Four Corners area) is very dry at 6 months, with dryness also at the 9- and 24-month time scales. Eastern Texas to the Lower Mississippi Valley is dry at the 1- to 2-month time scales, with the dryness limited to Texas at 3 and 6 months, and to southern Texas at 9 and 12 months. The Florida panhandle to southern Georgia is dry at the 6- to 12-month time scales, especially the last 12 months. There is spotty dryness at 2 months in the Mid-Mississippi Valley and at 2- and 6- to 12-month time scales along the Mid-Atlantic coast. Otherwise, wet conditions dominate much of the country at most time scales.
 |
 |
 |
Regional Discussion
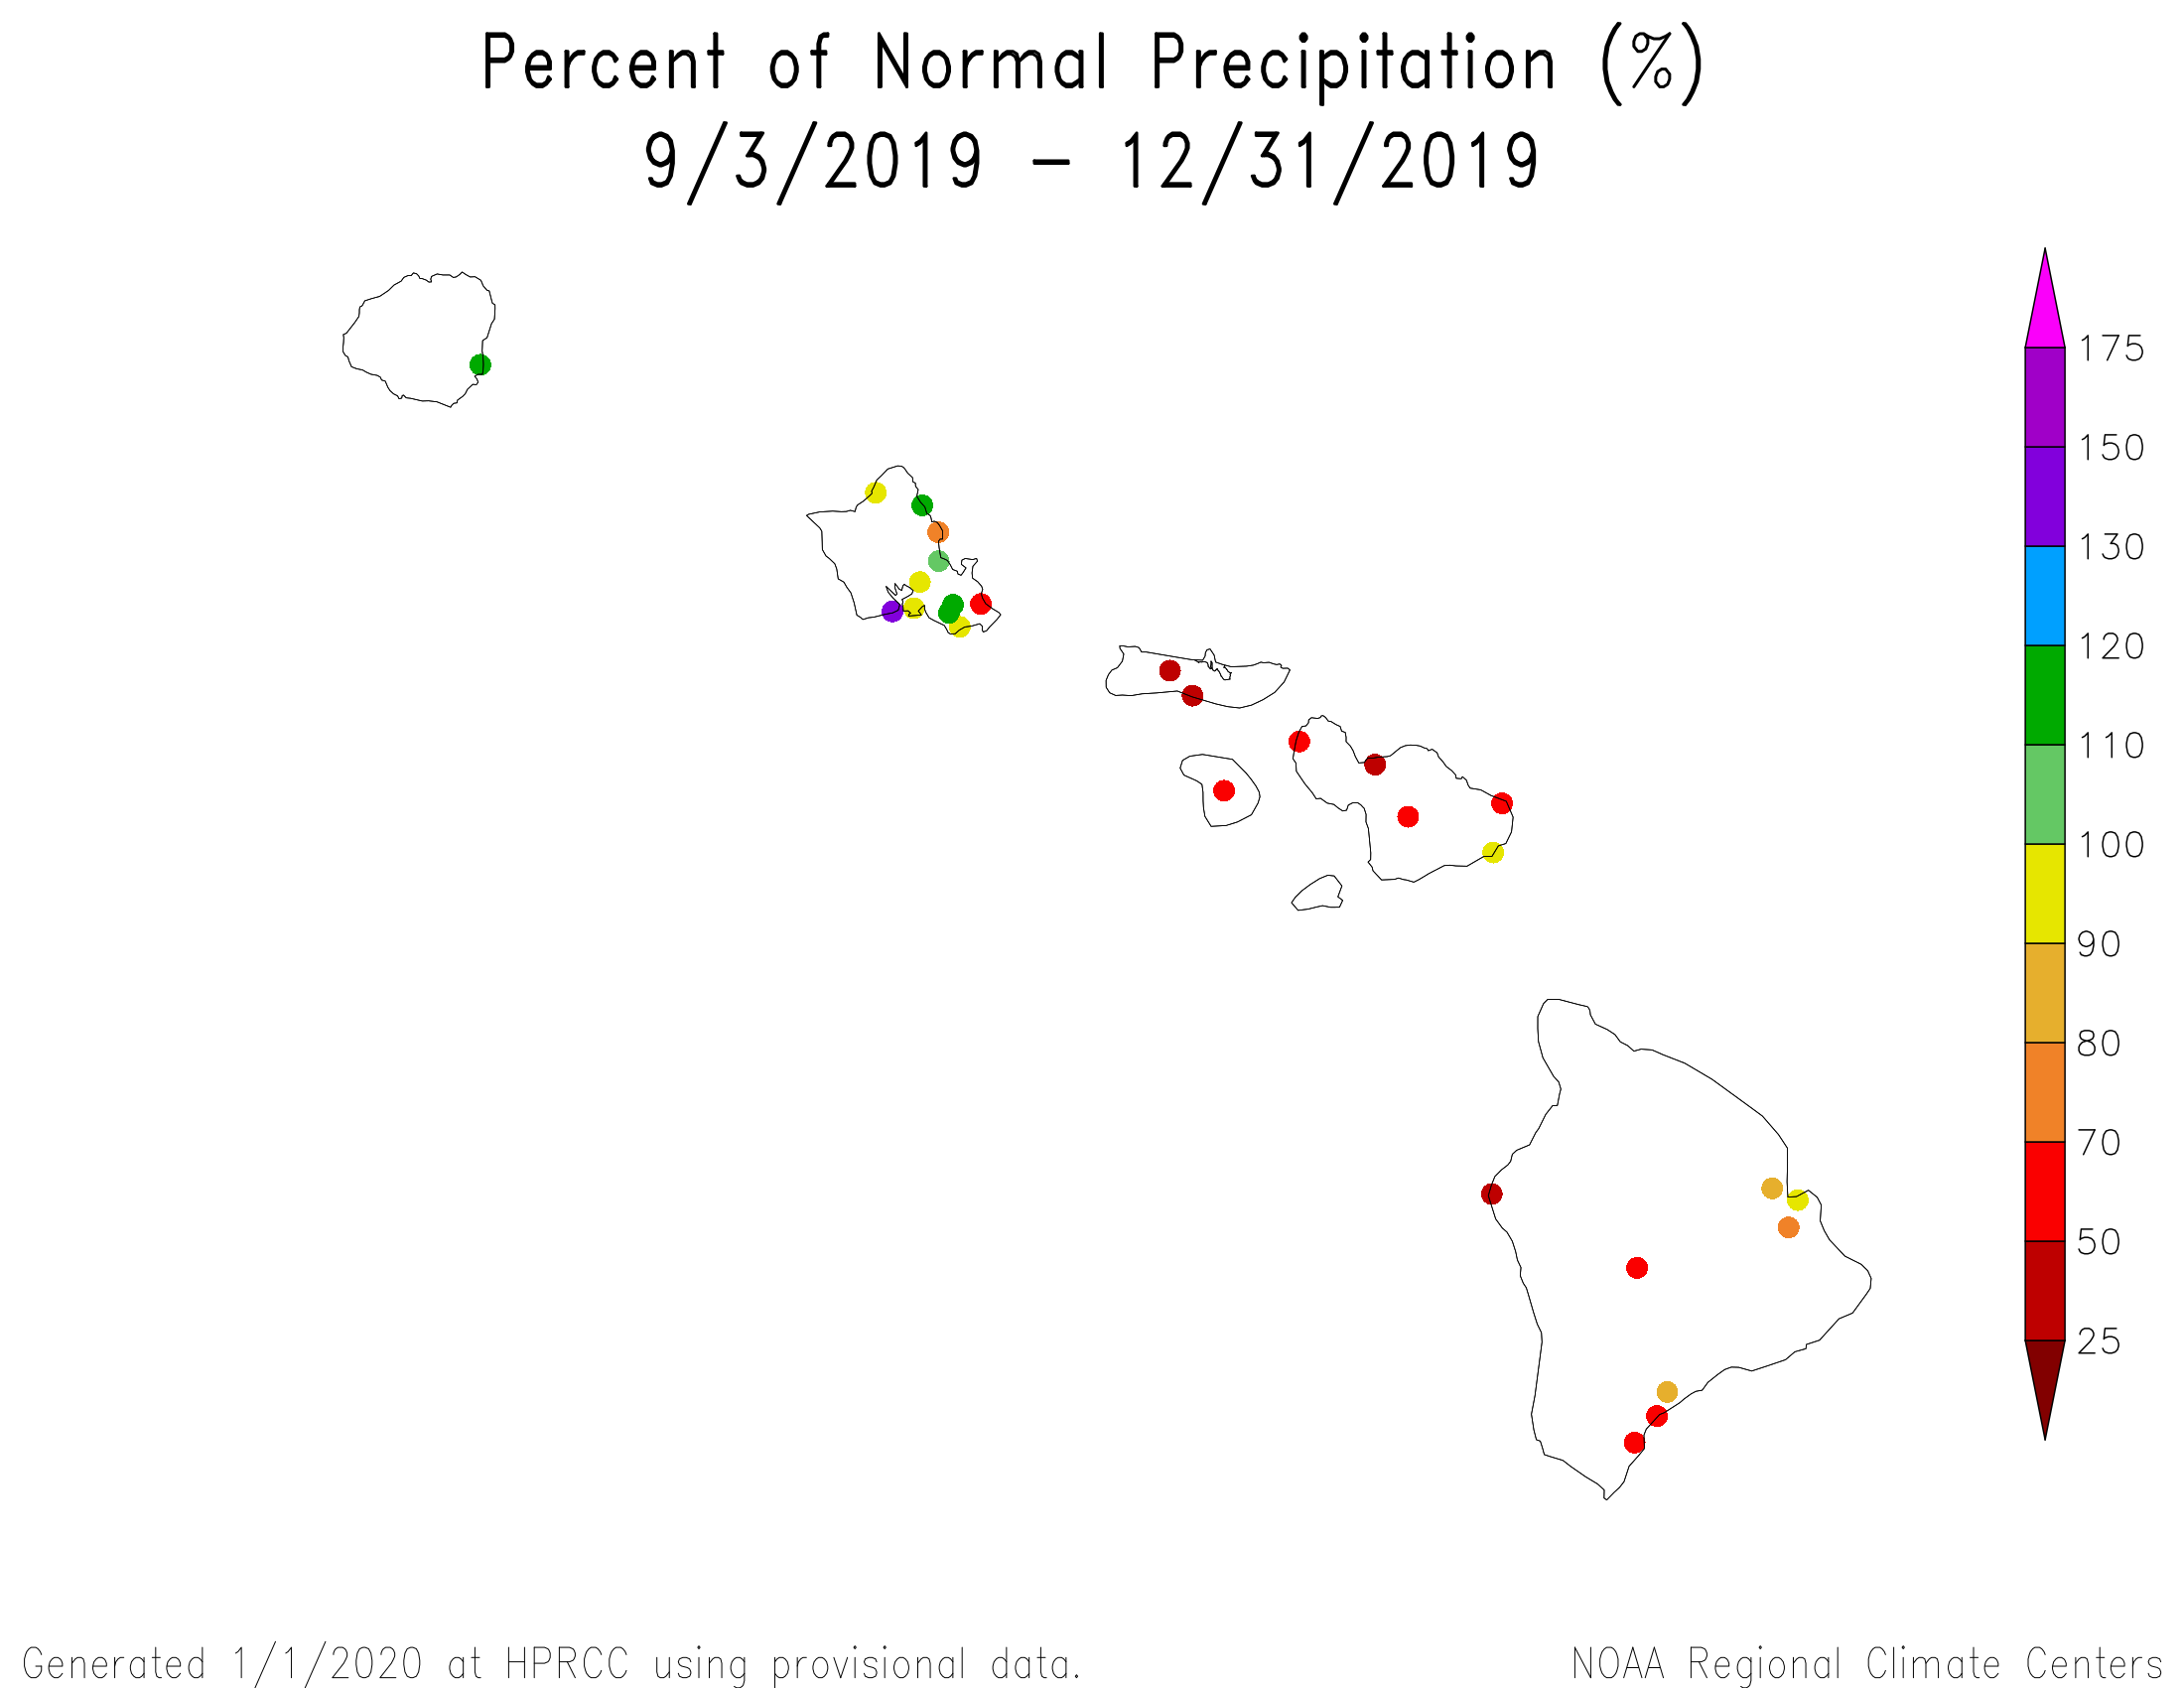
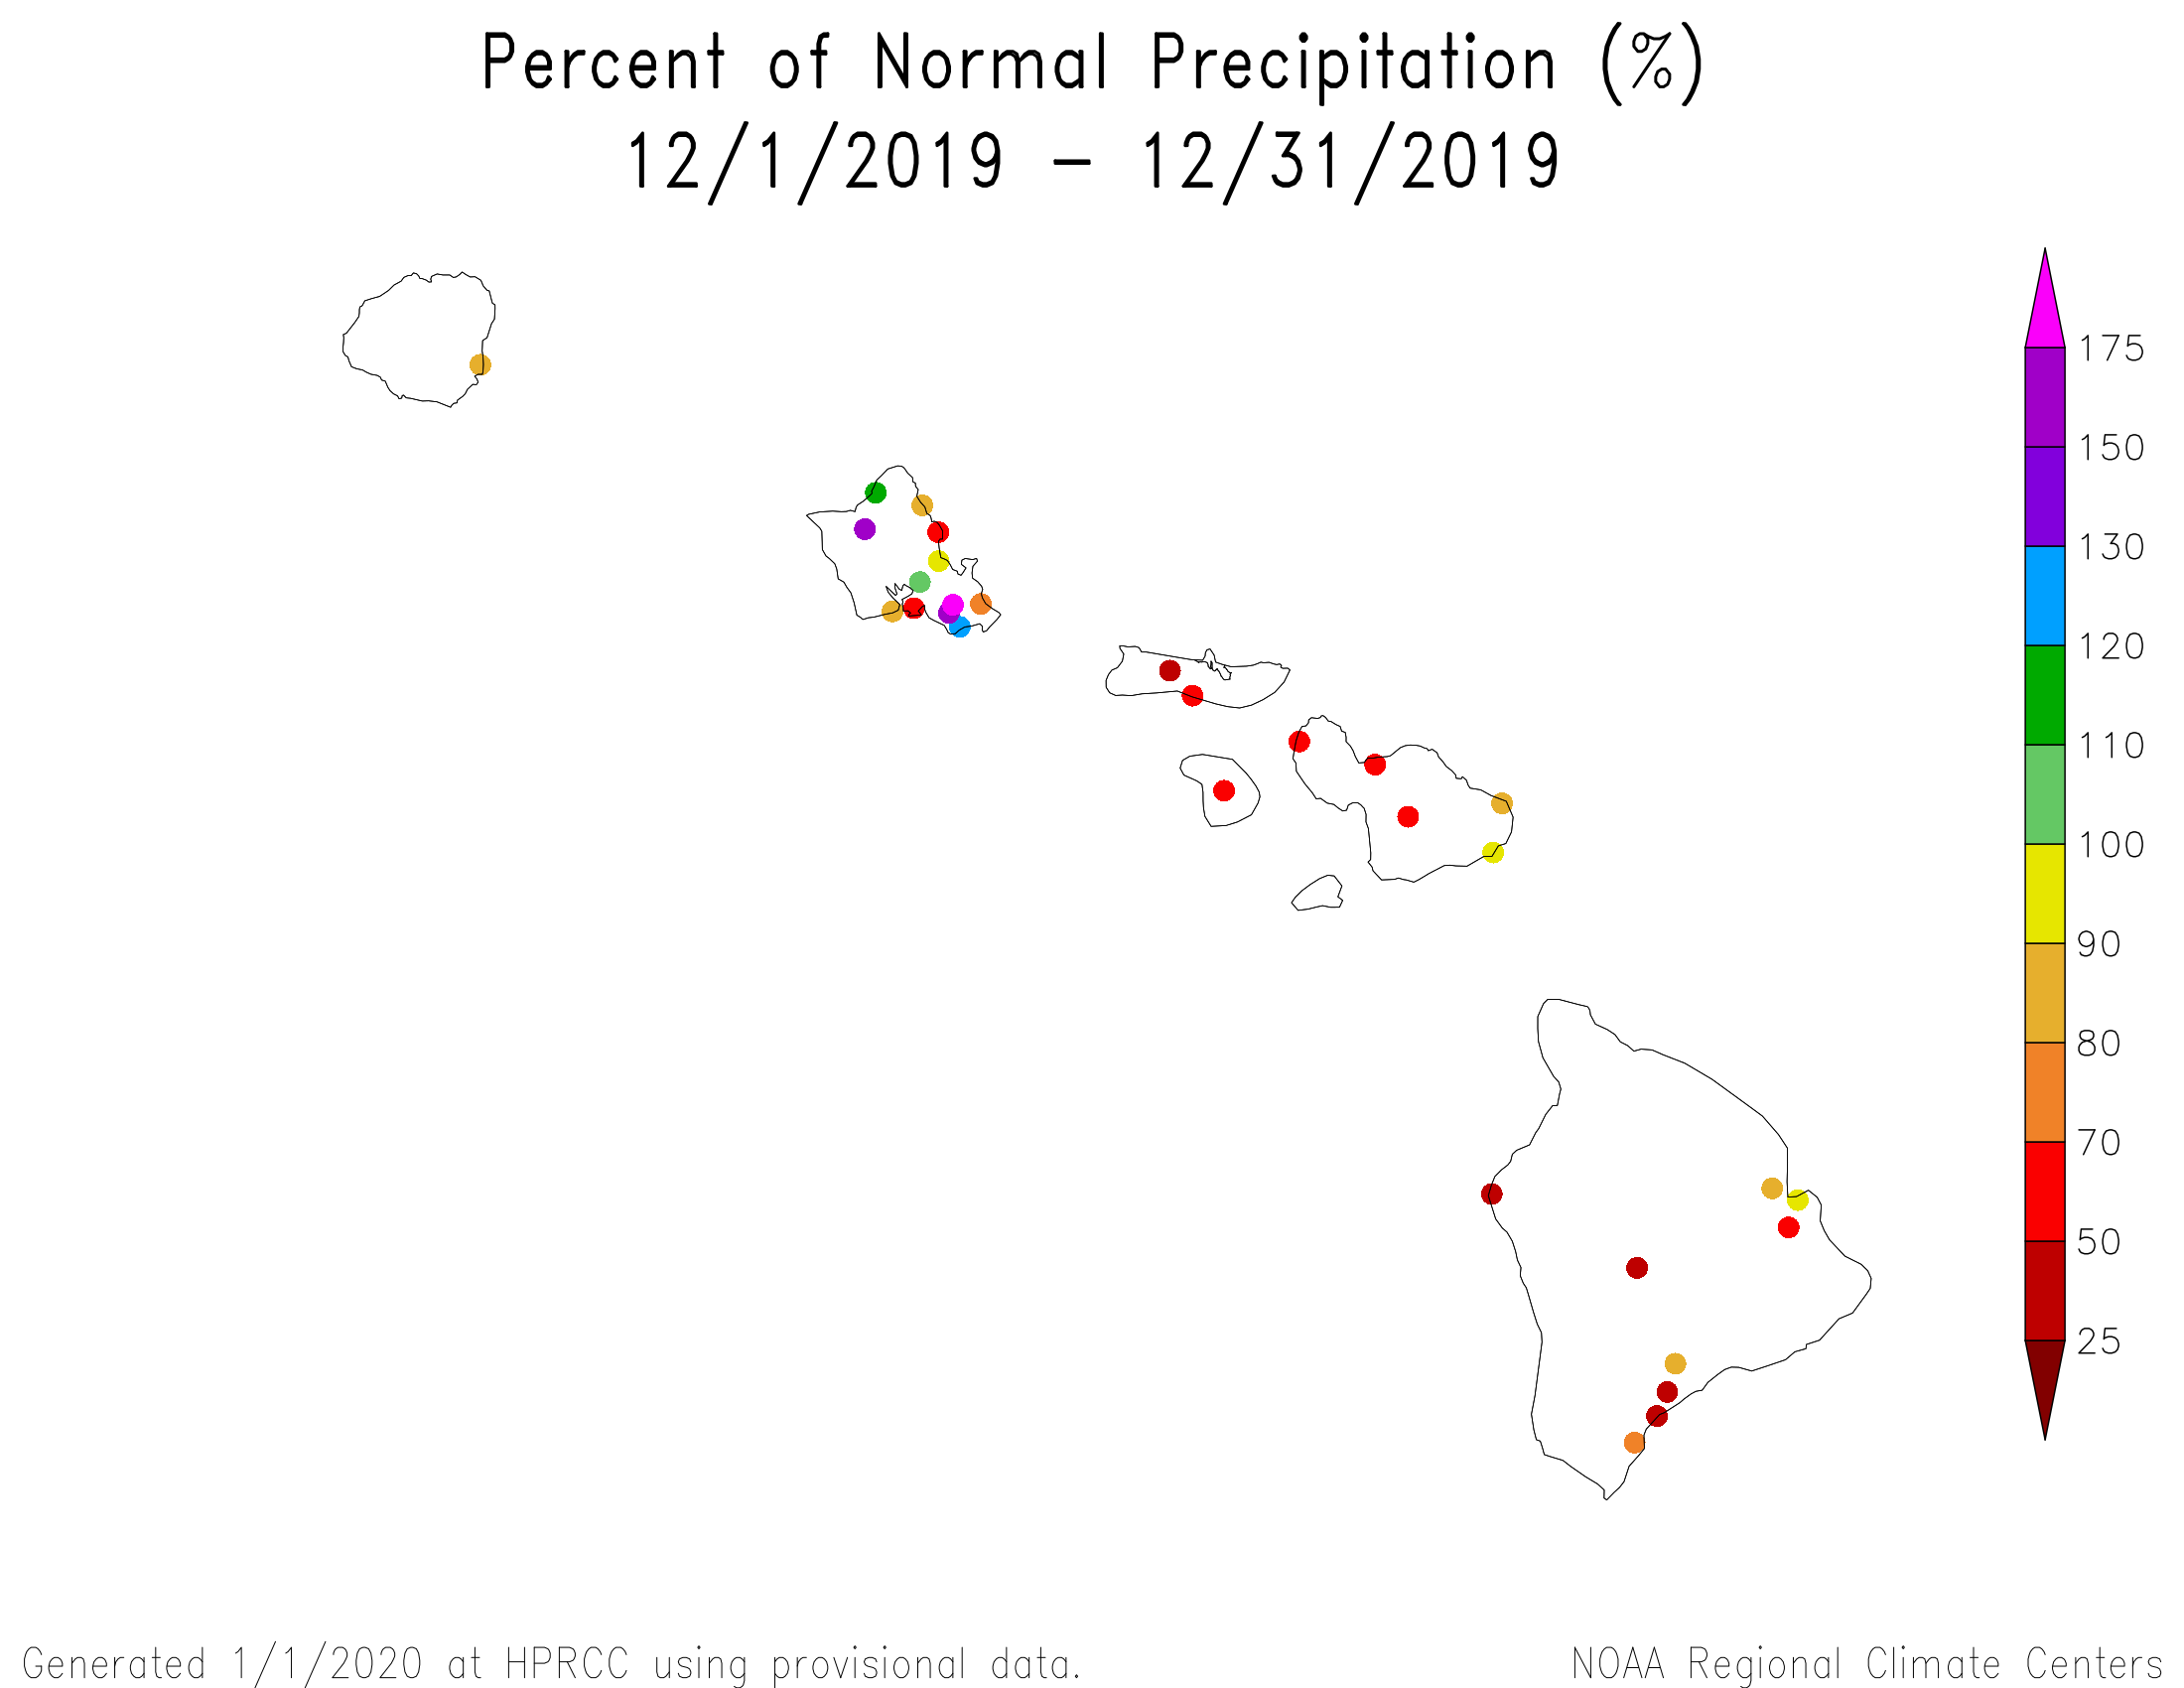
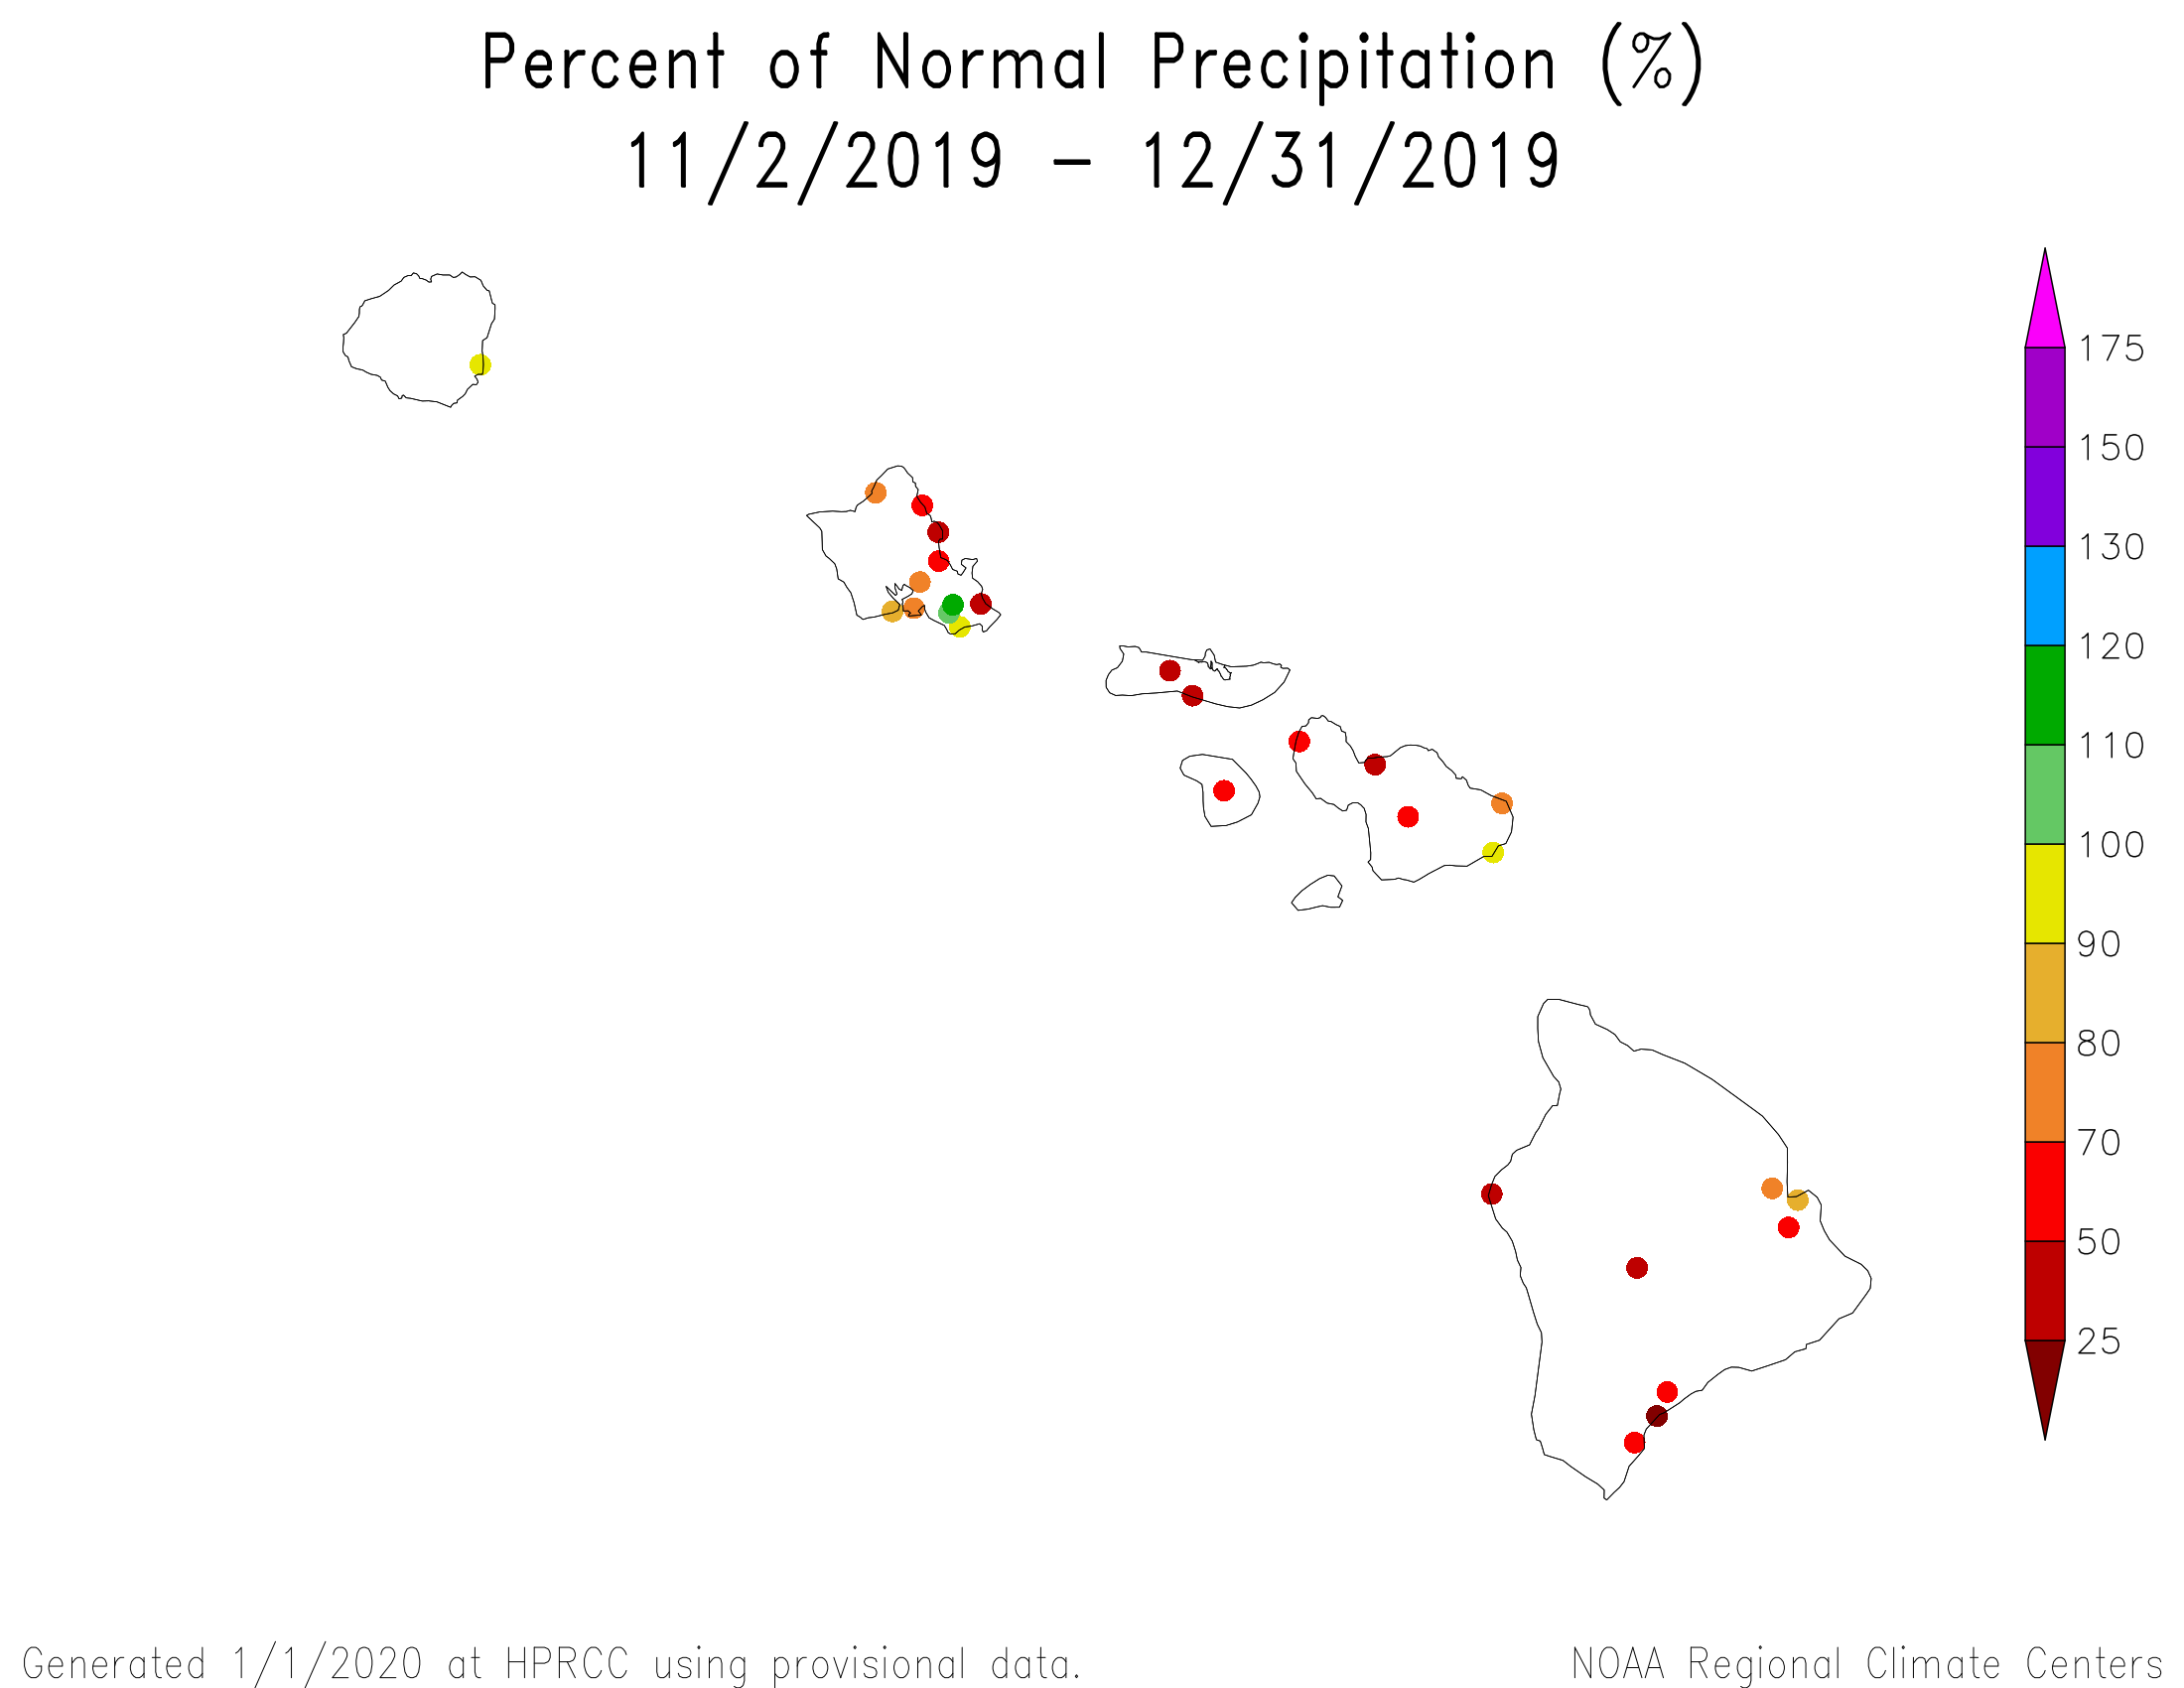
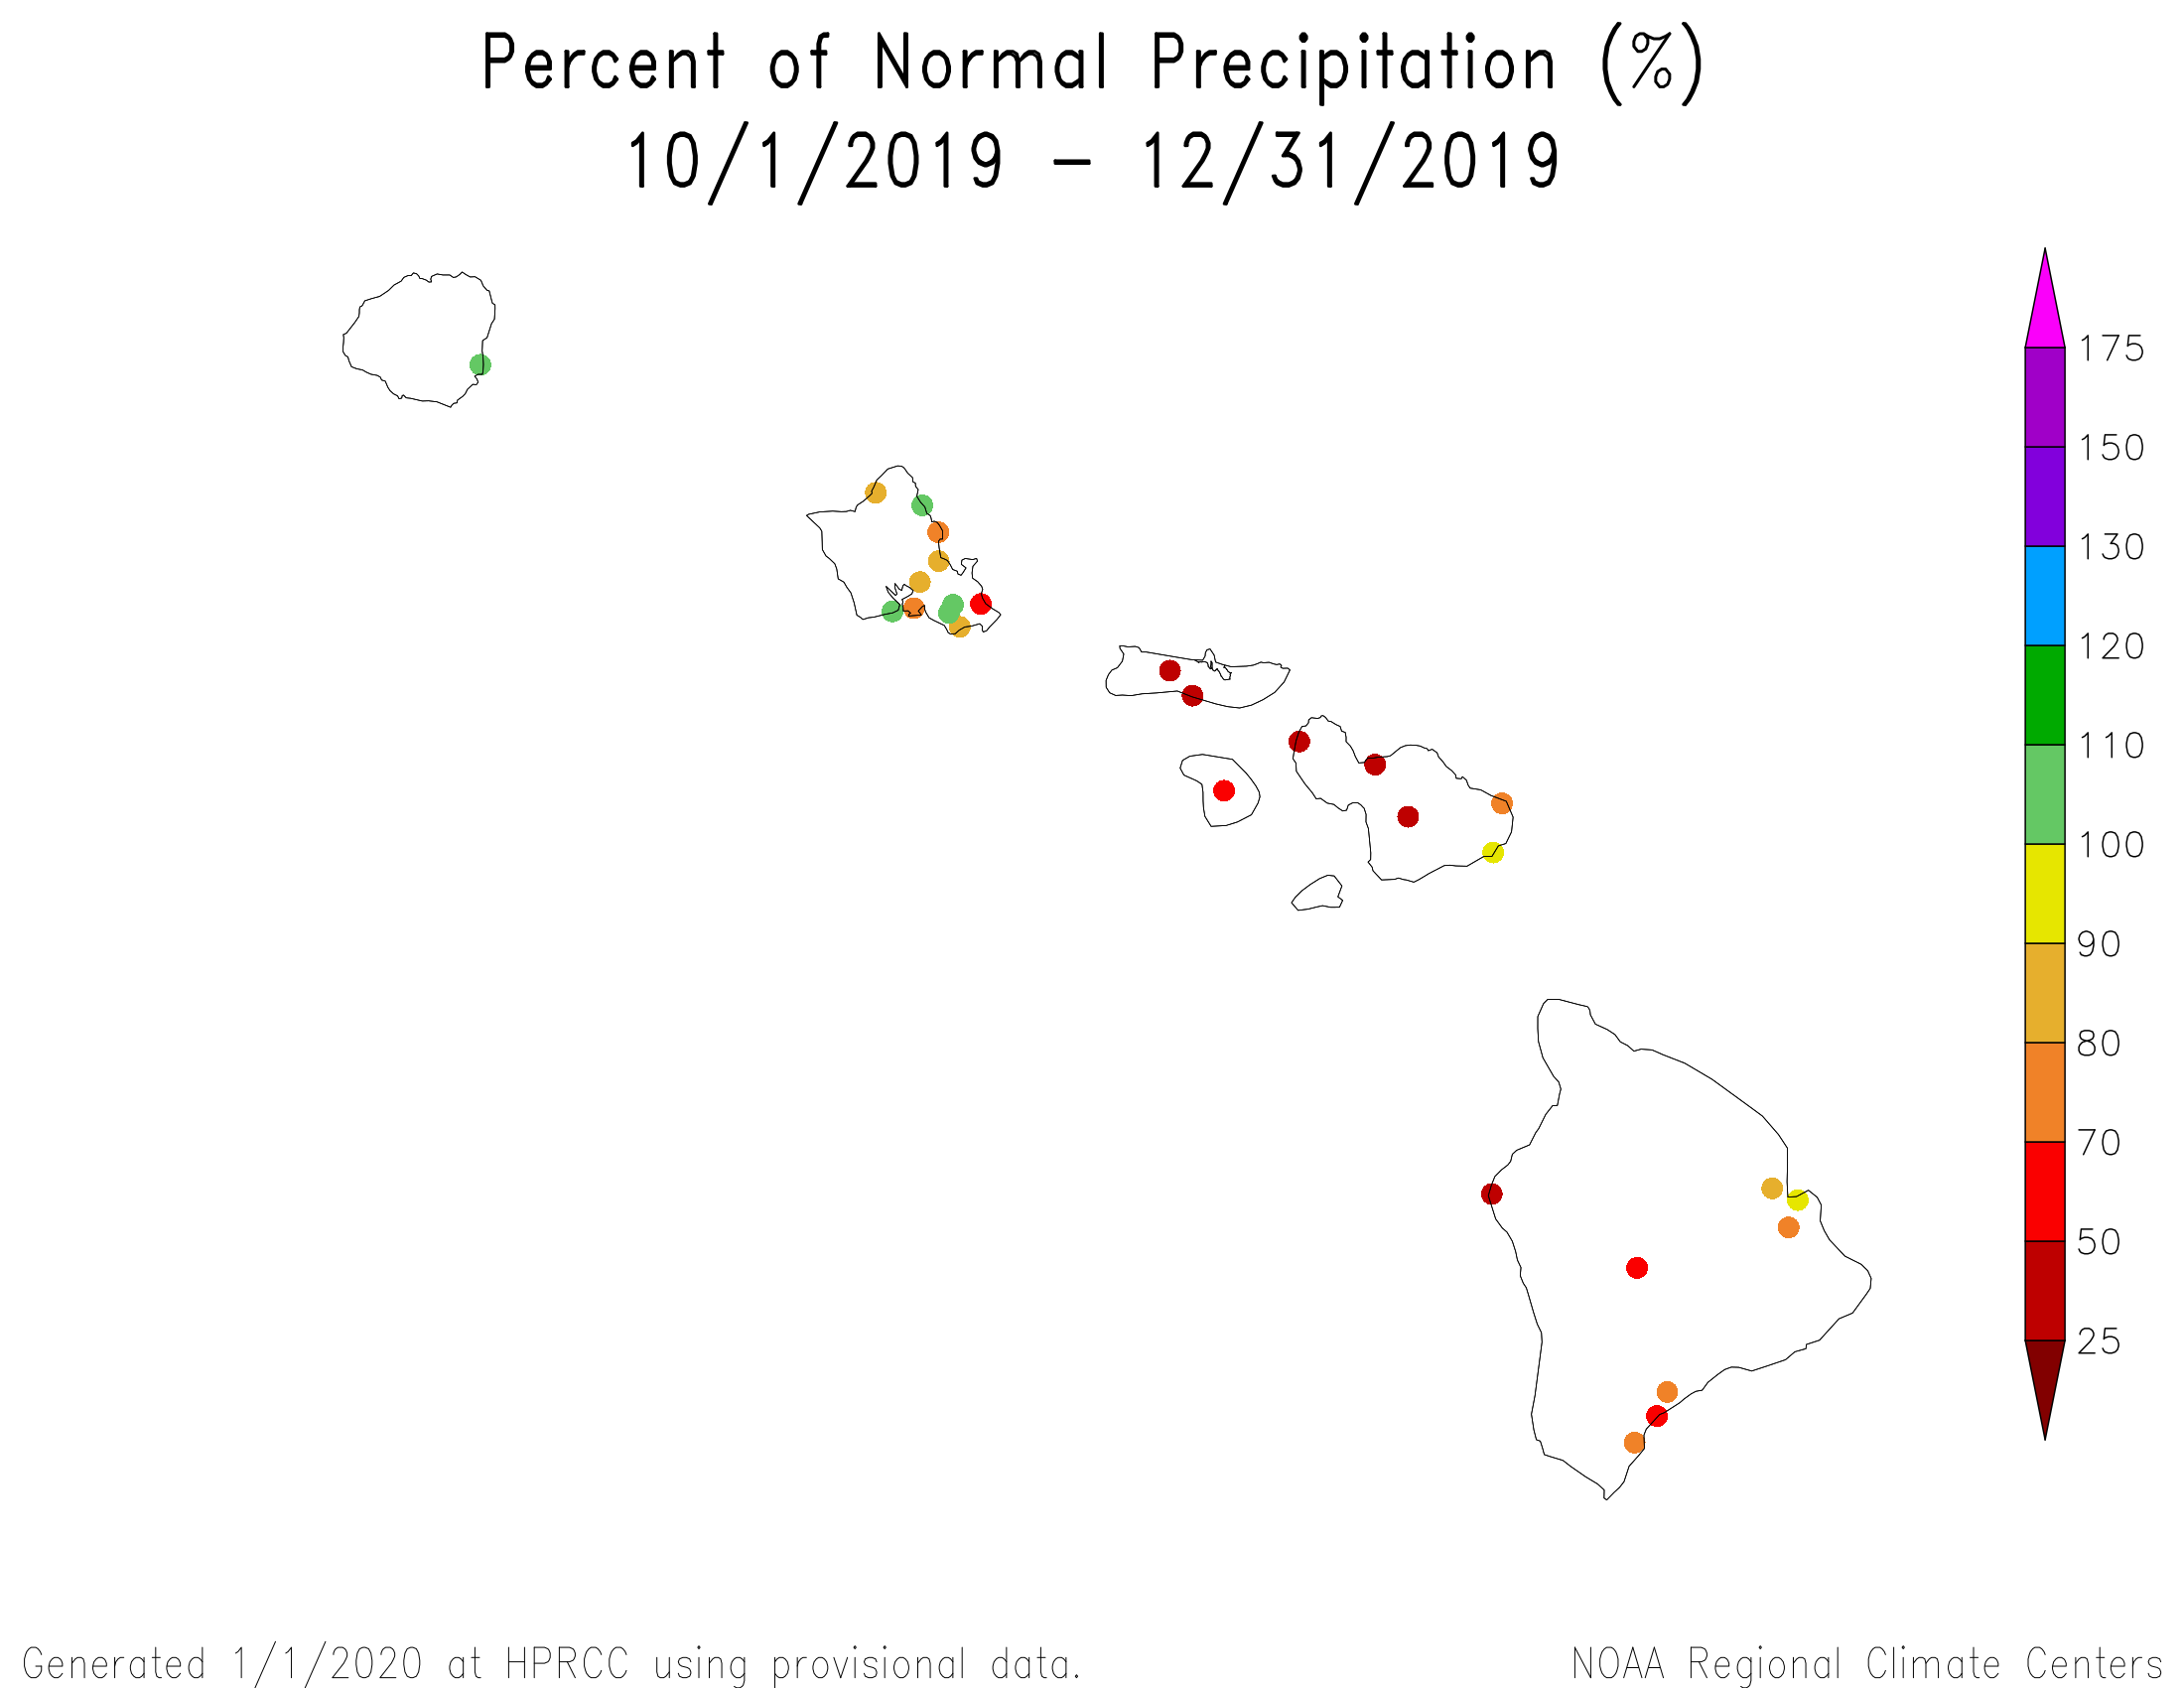
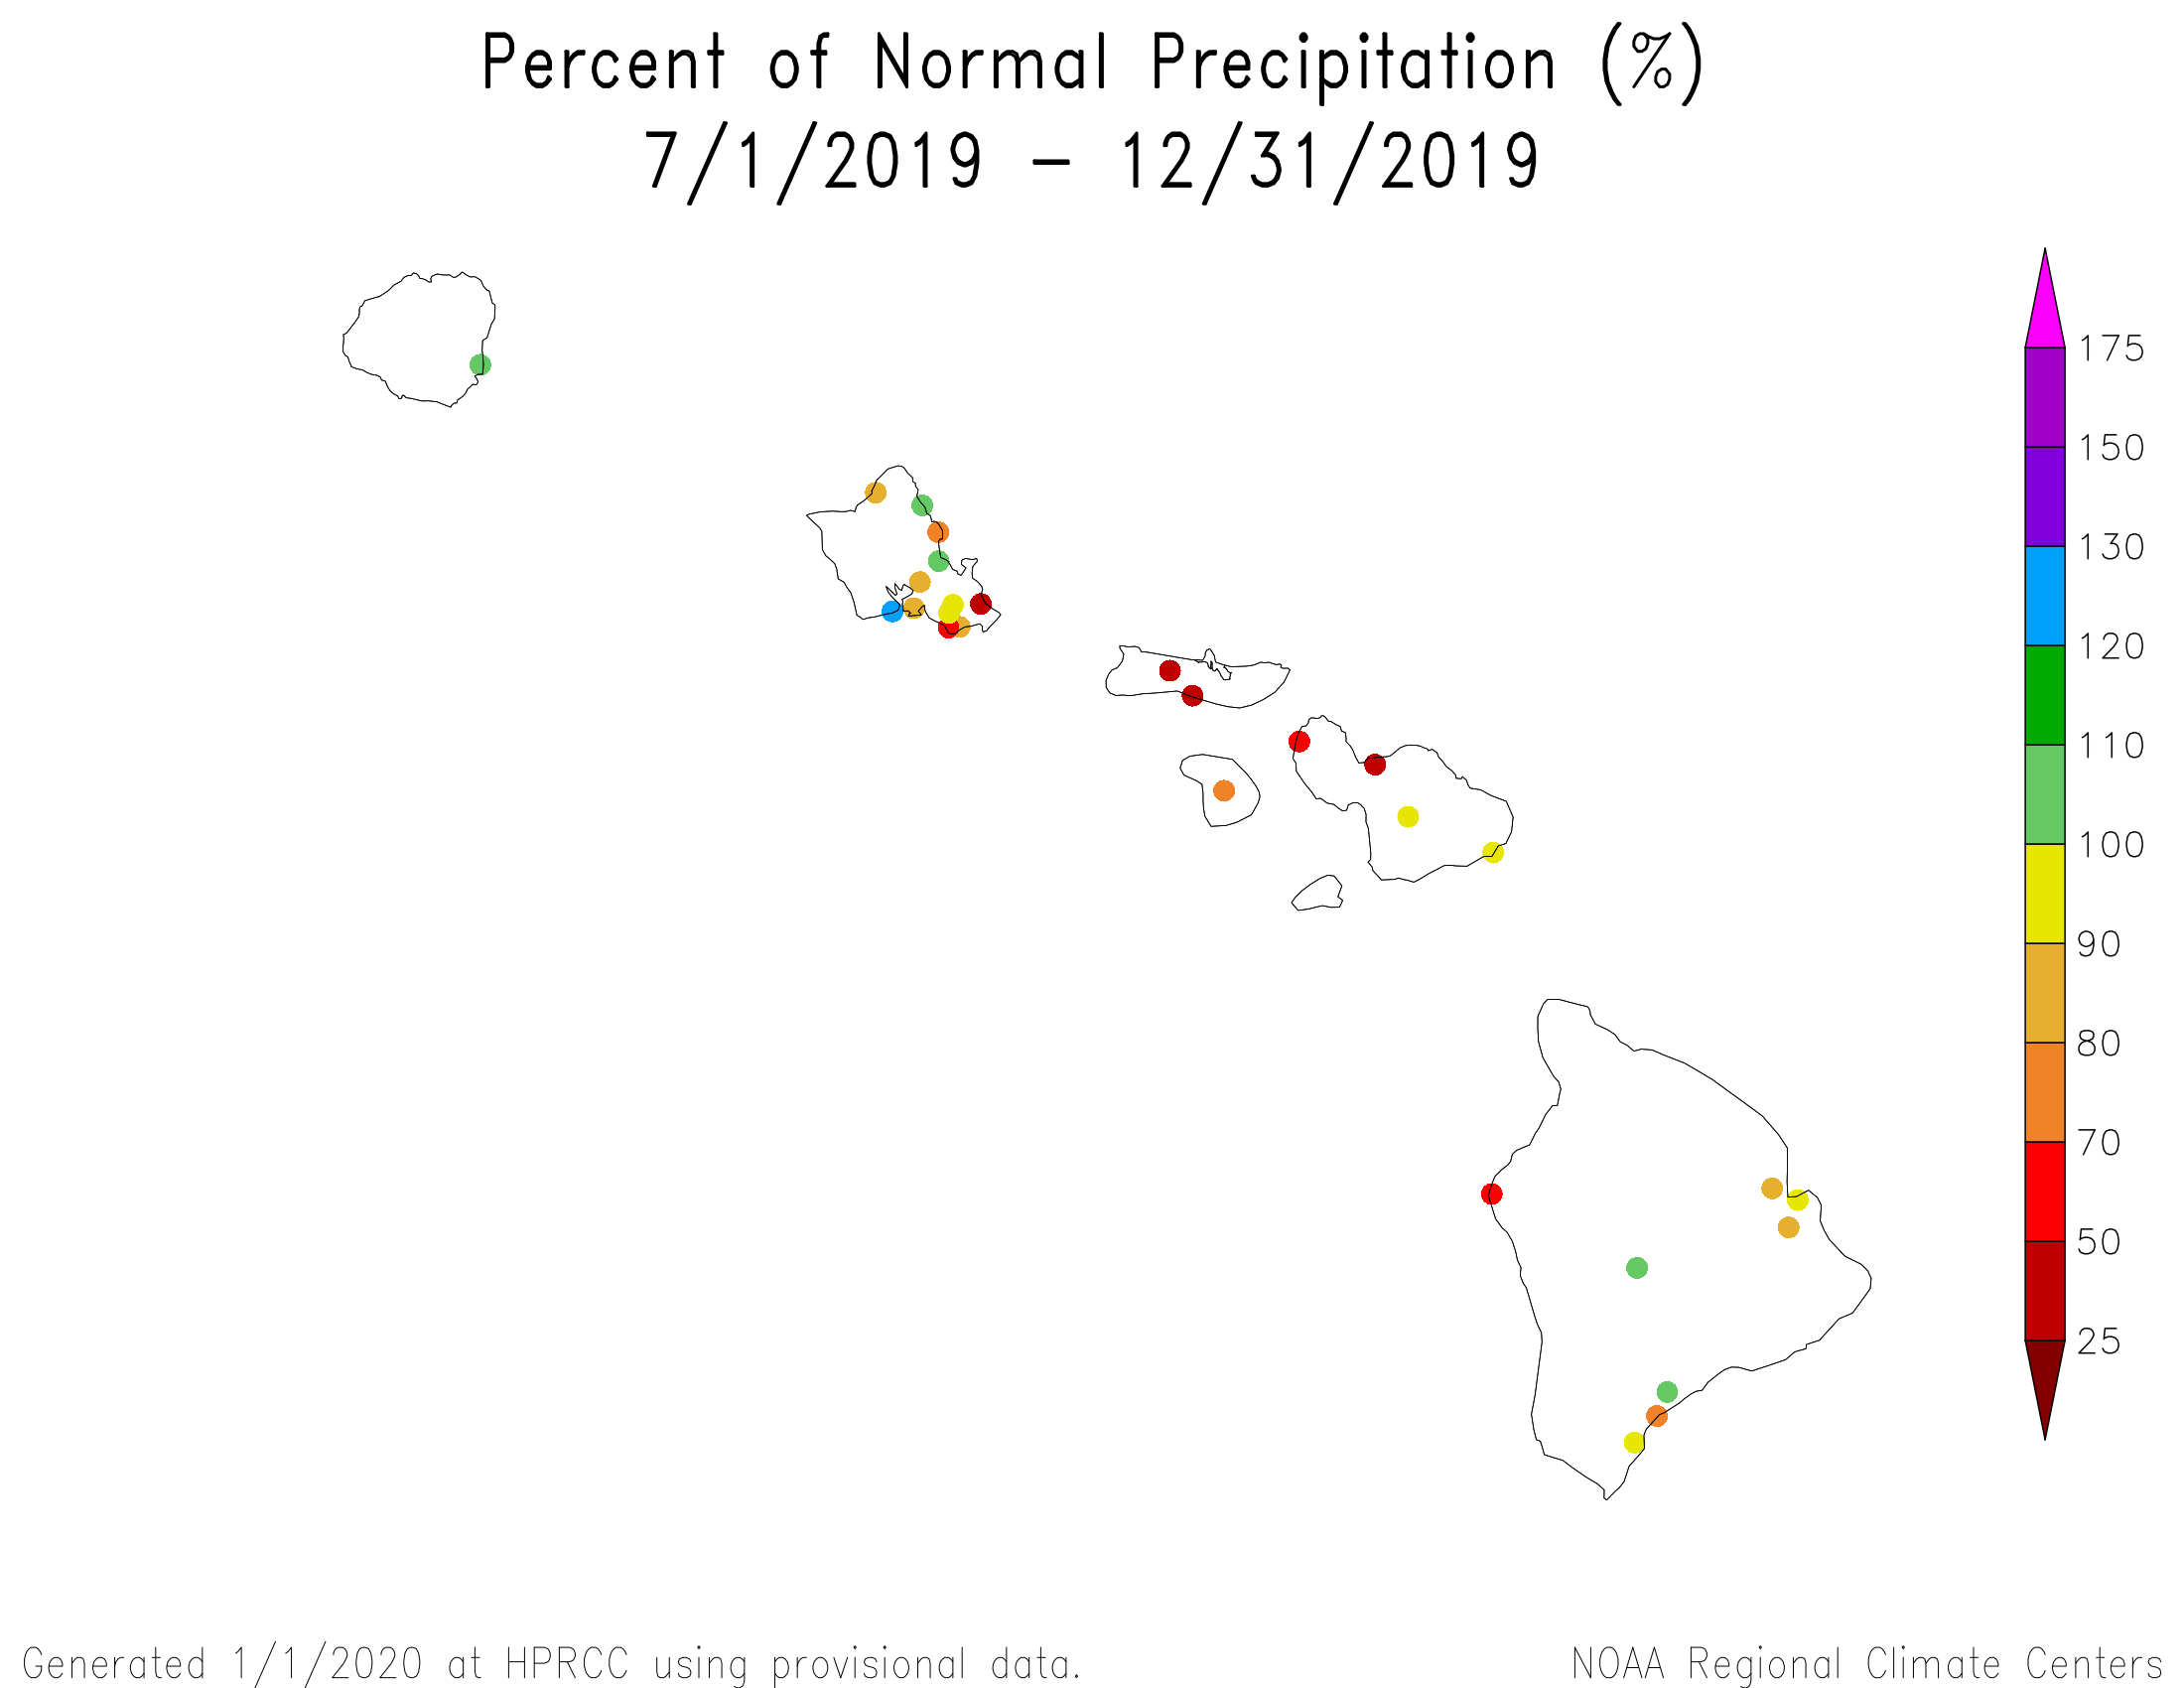
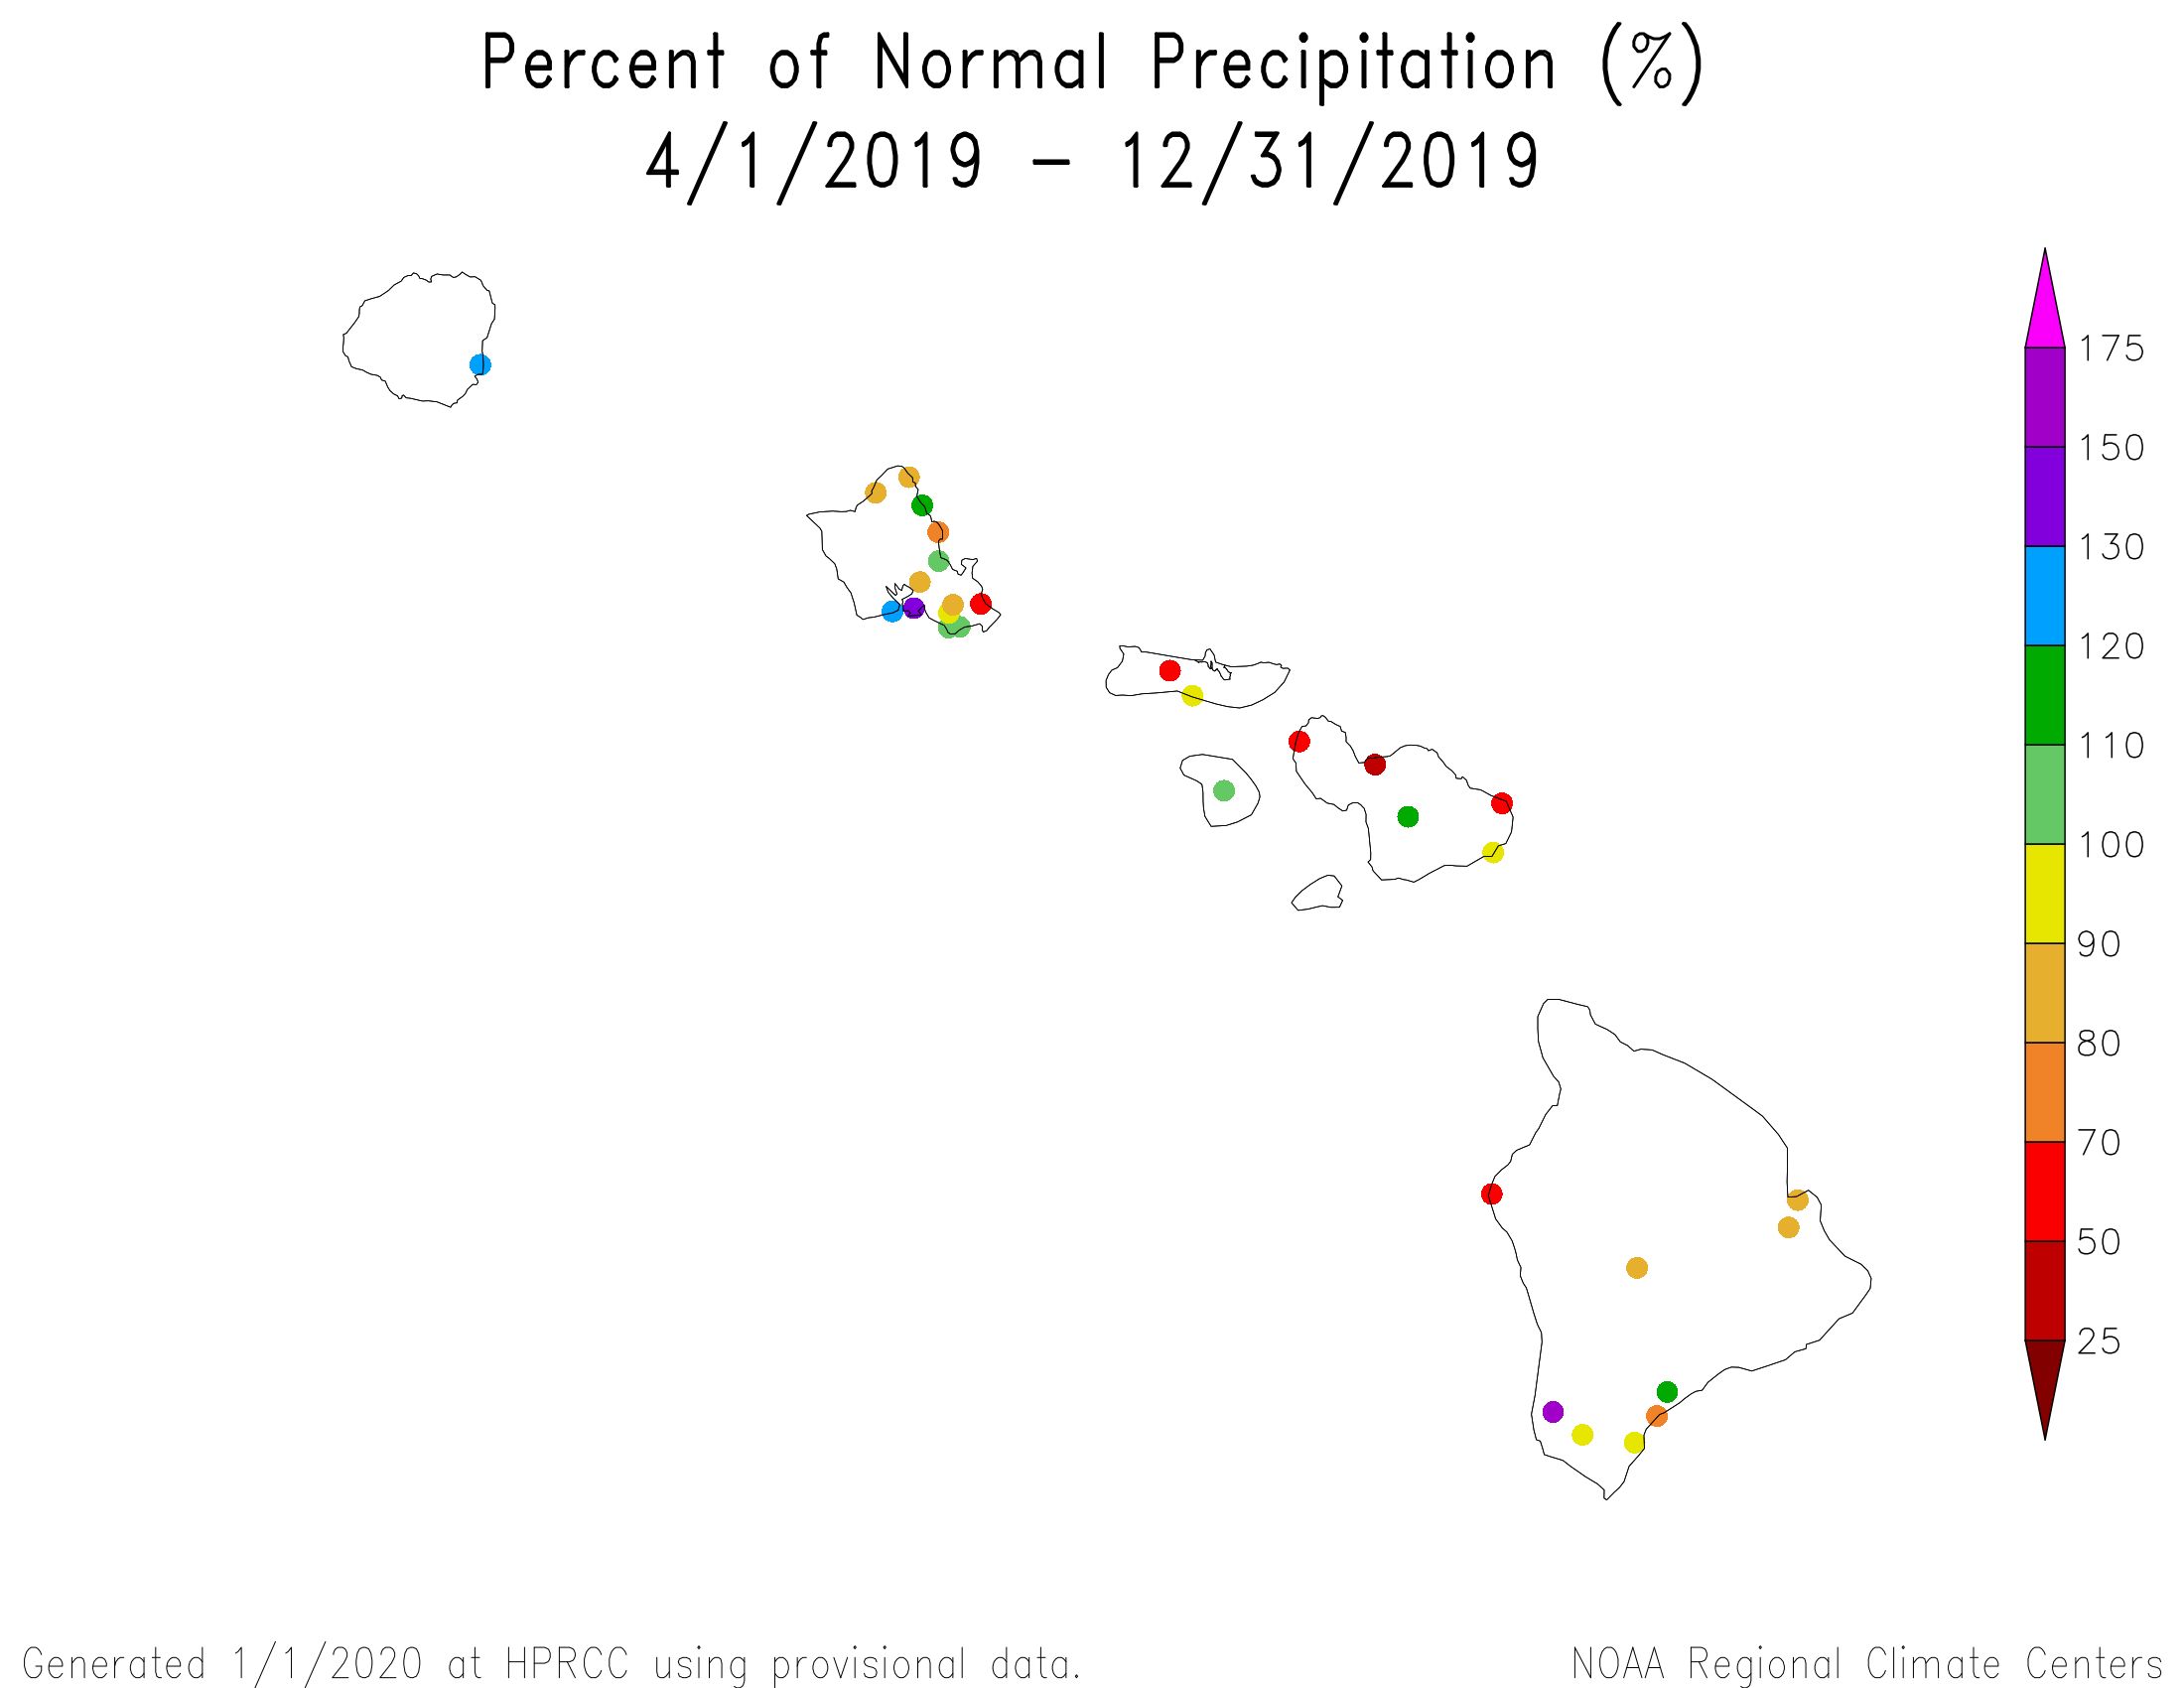
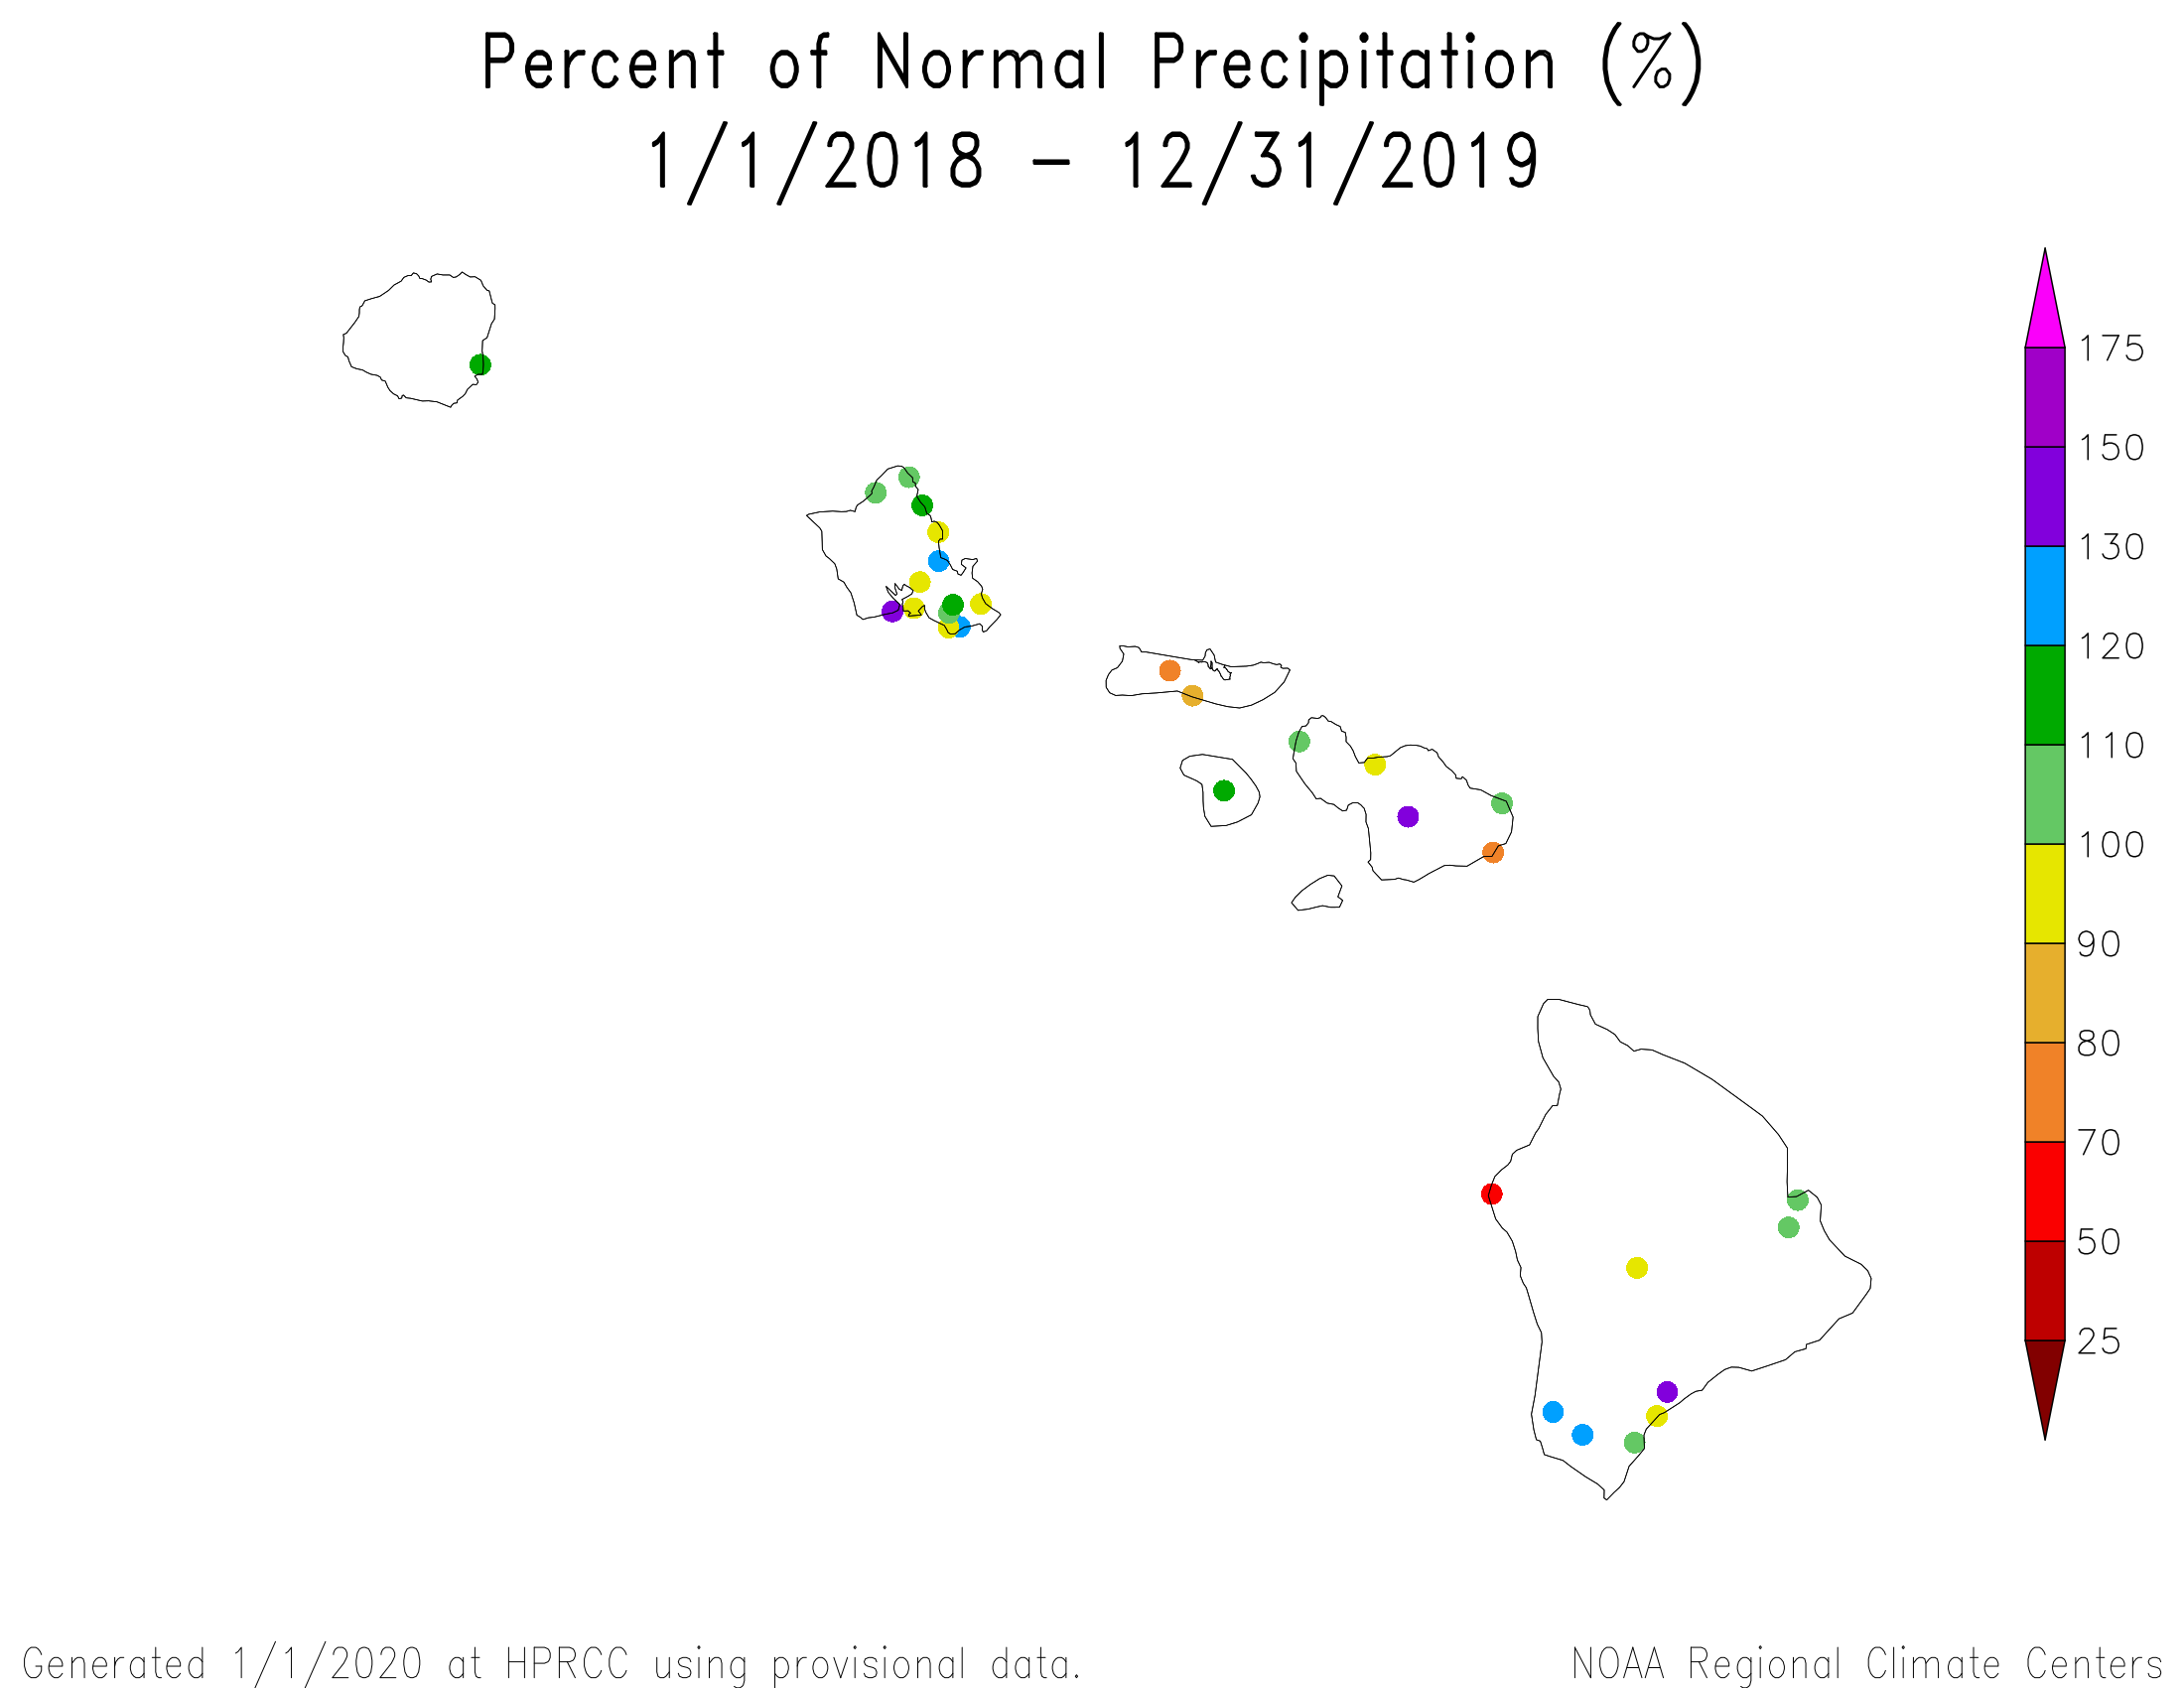
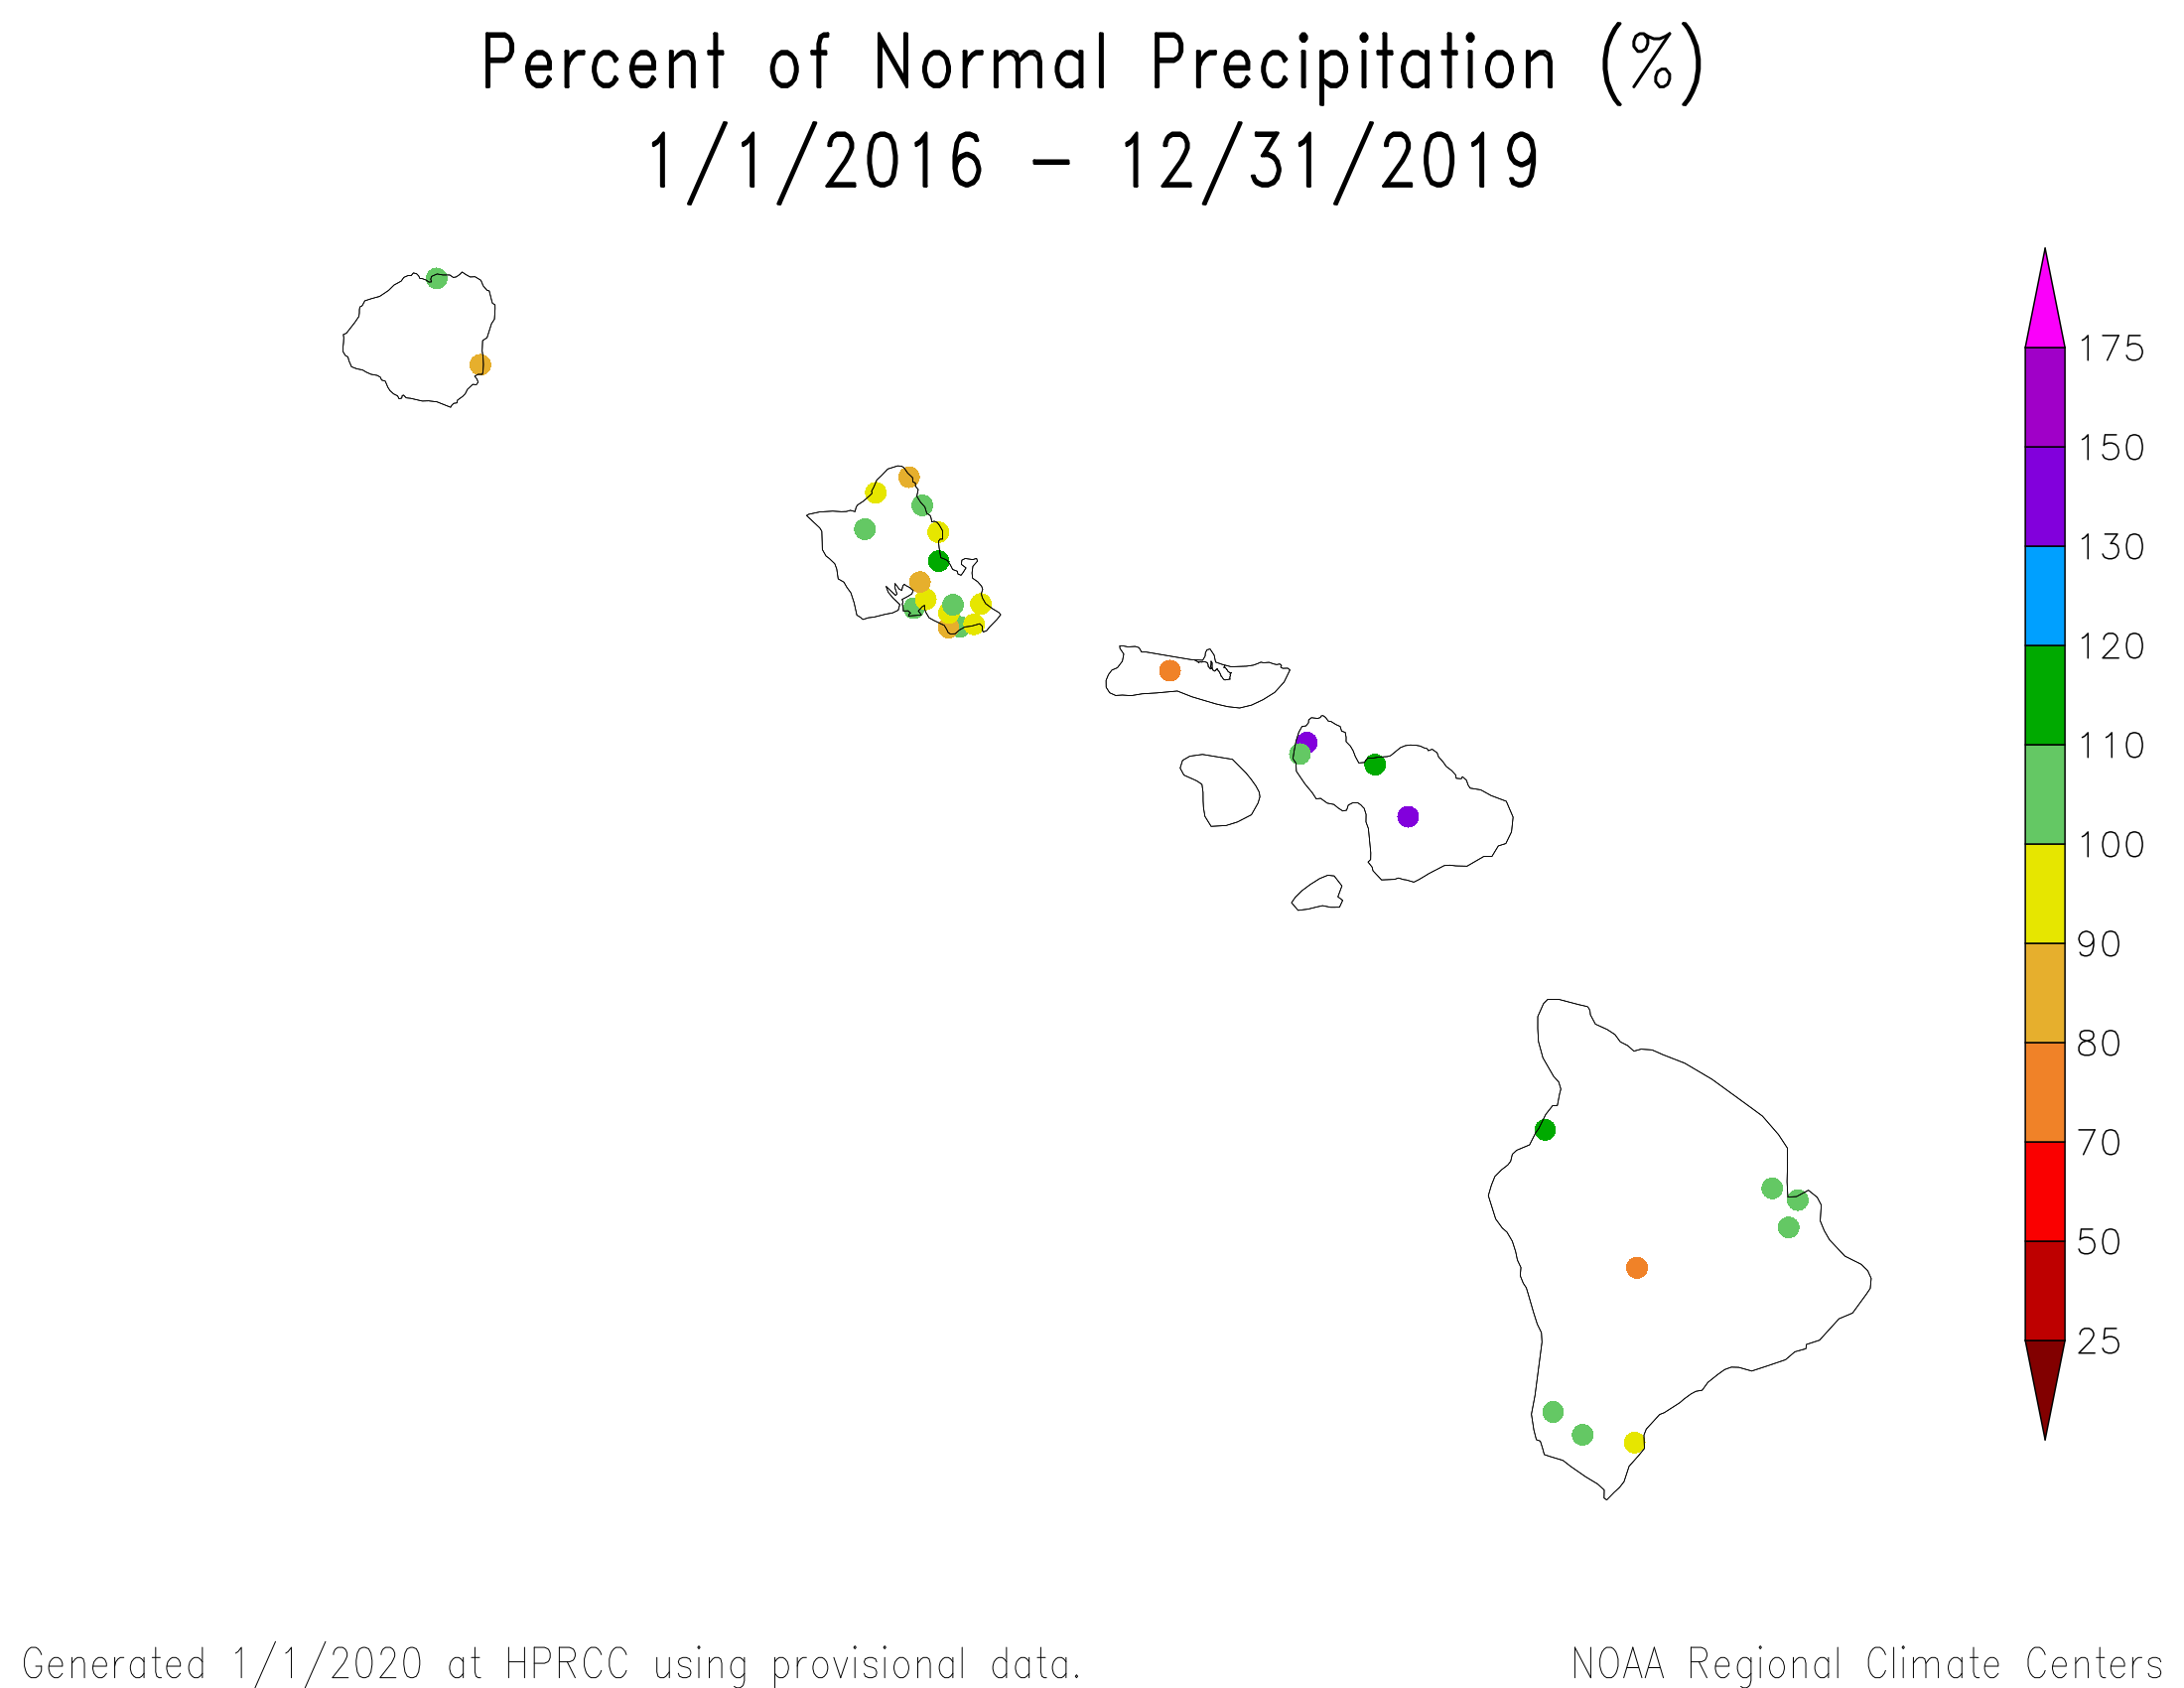
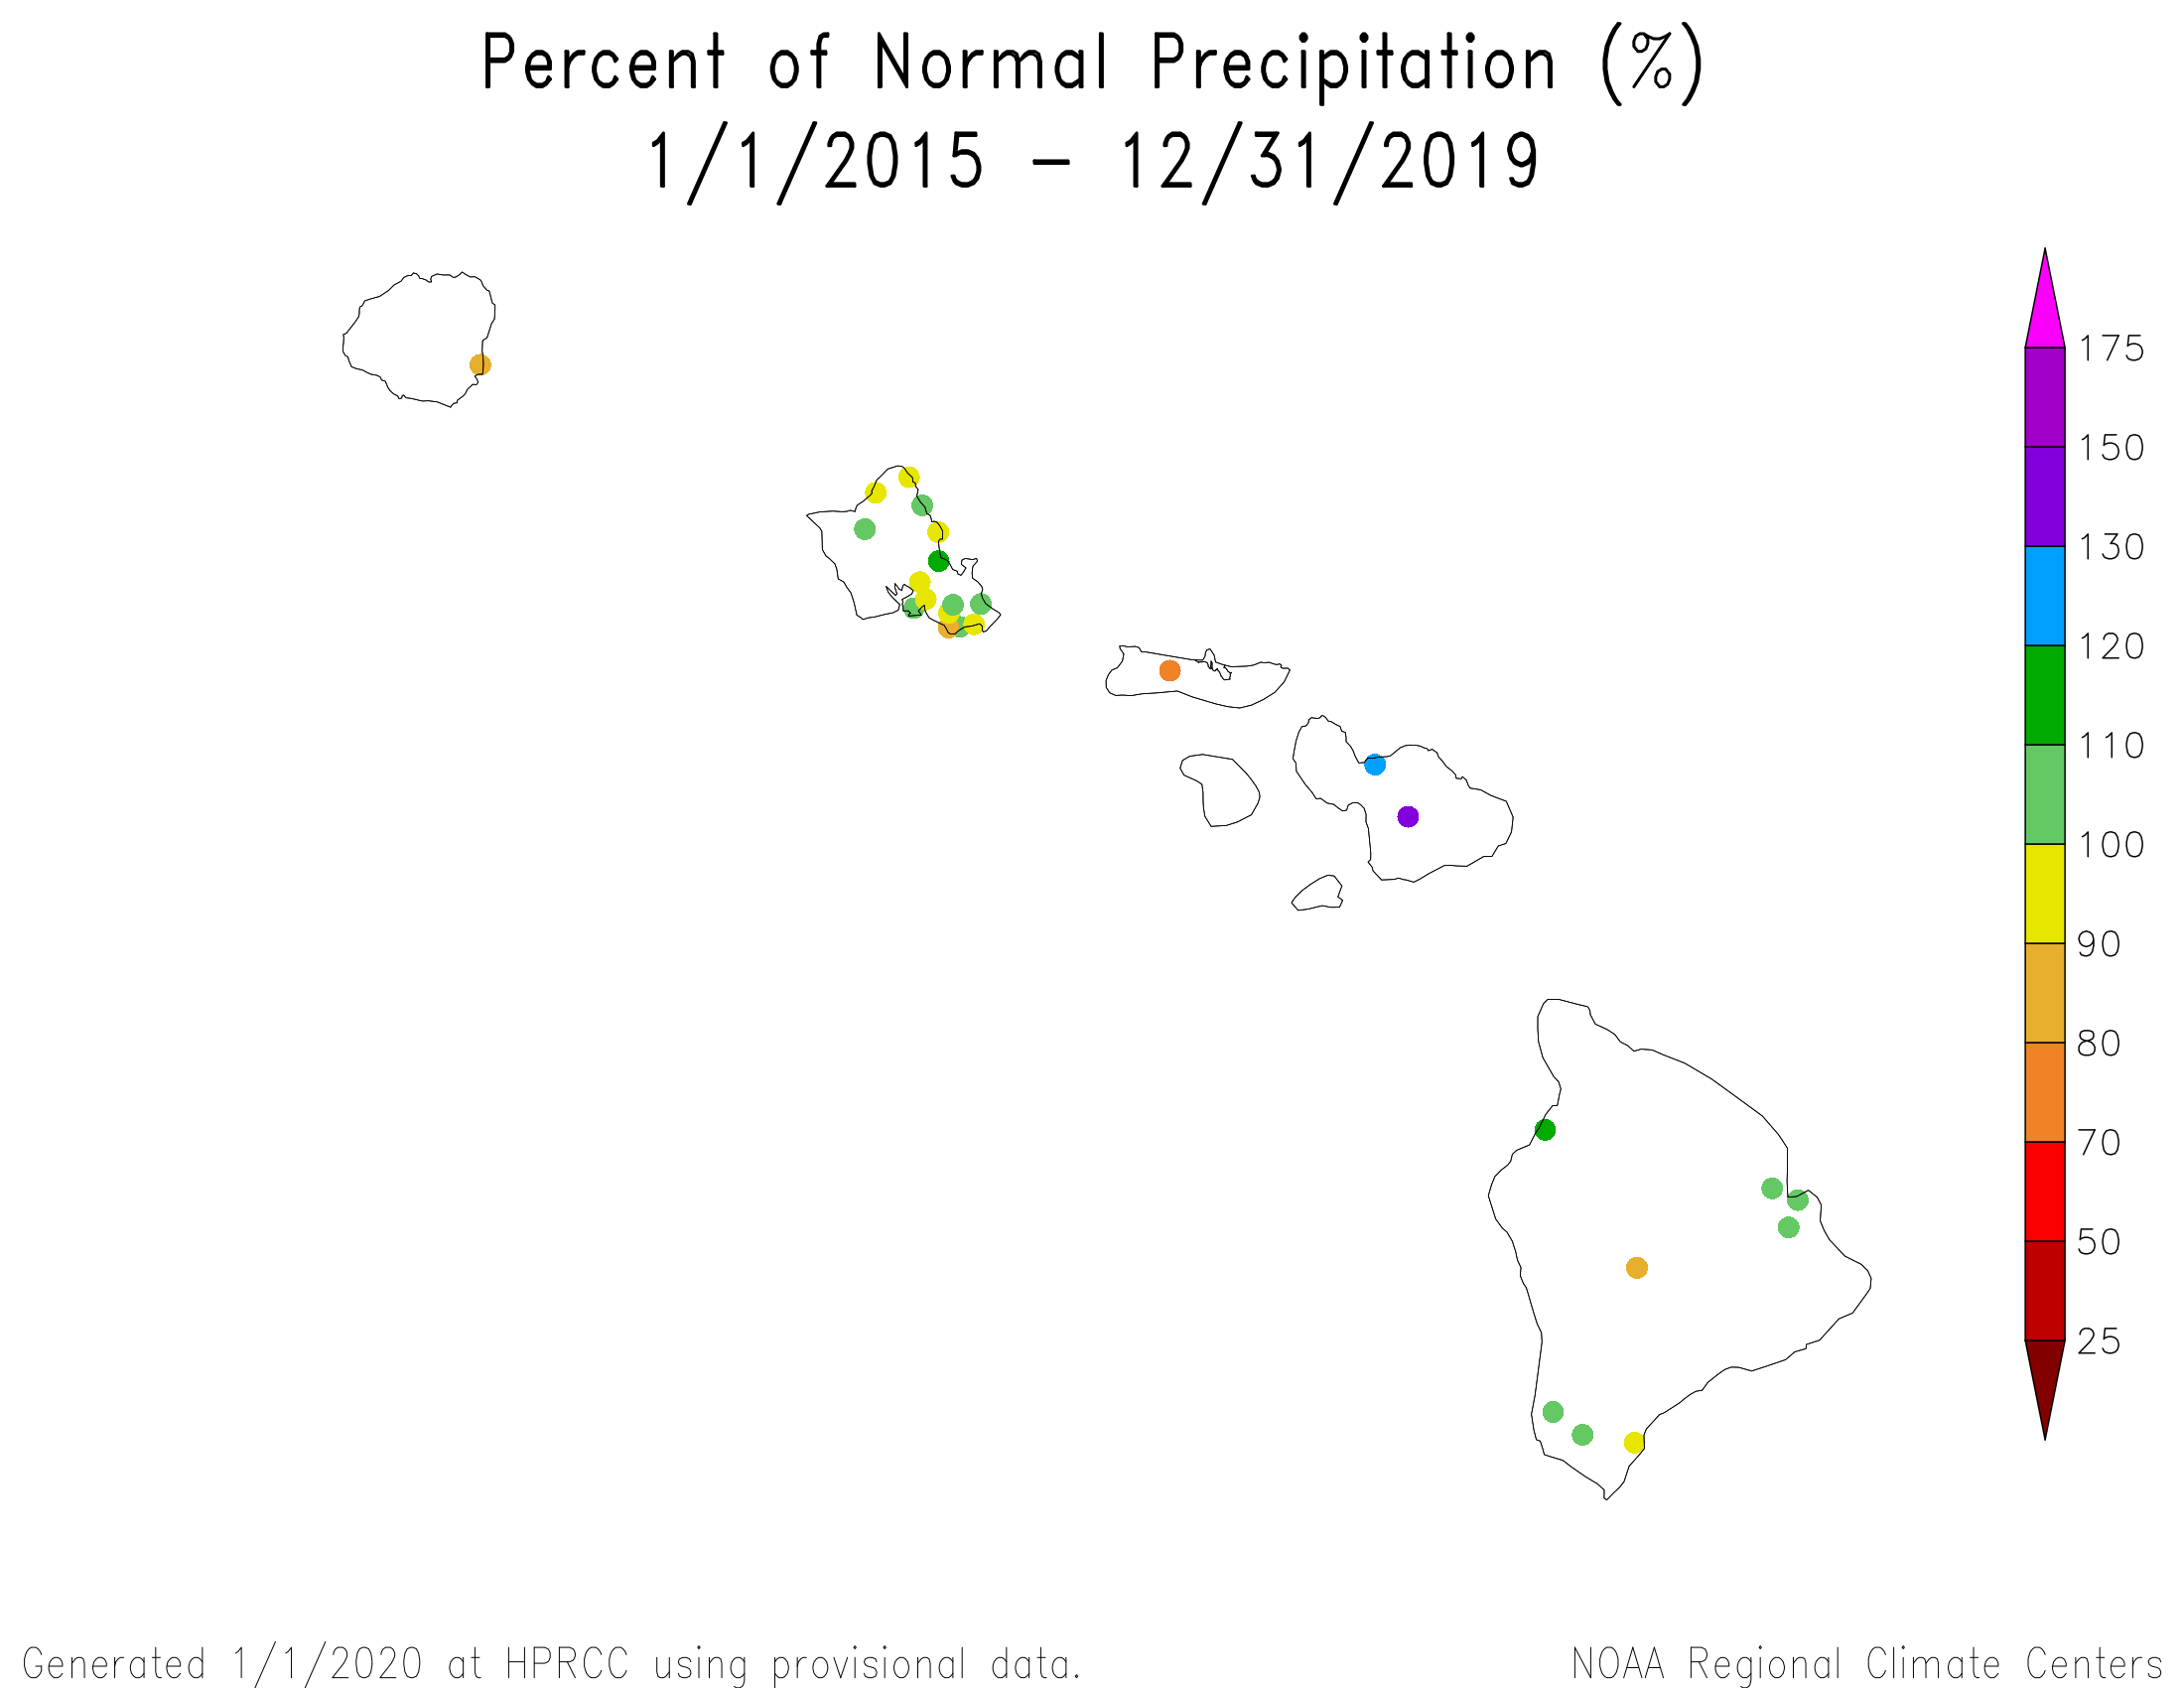
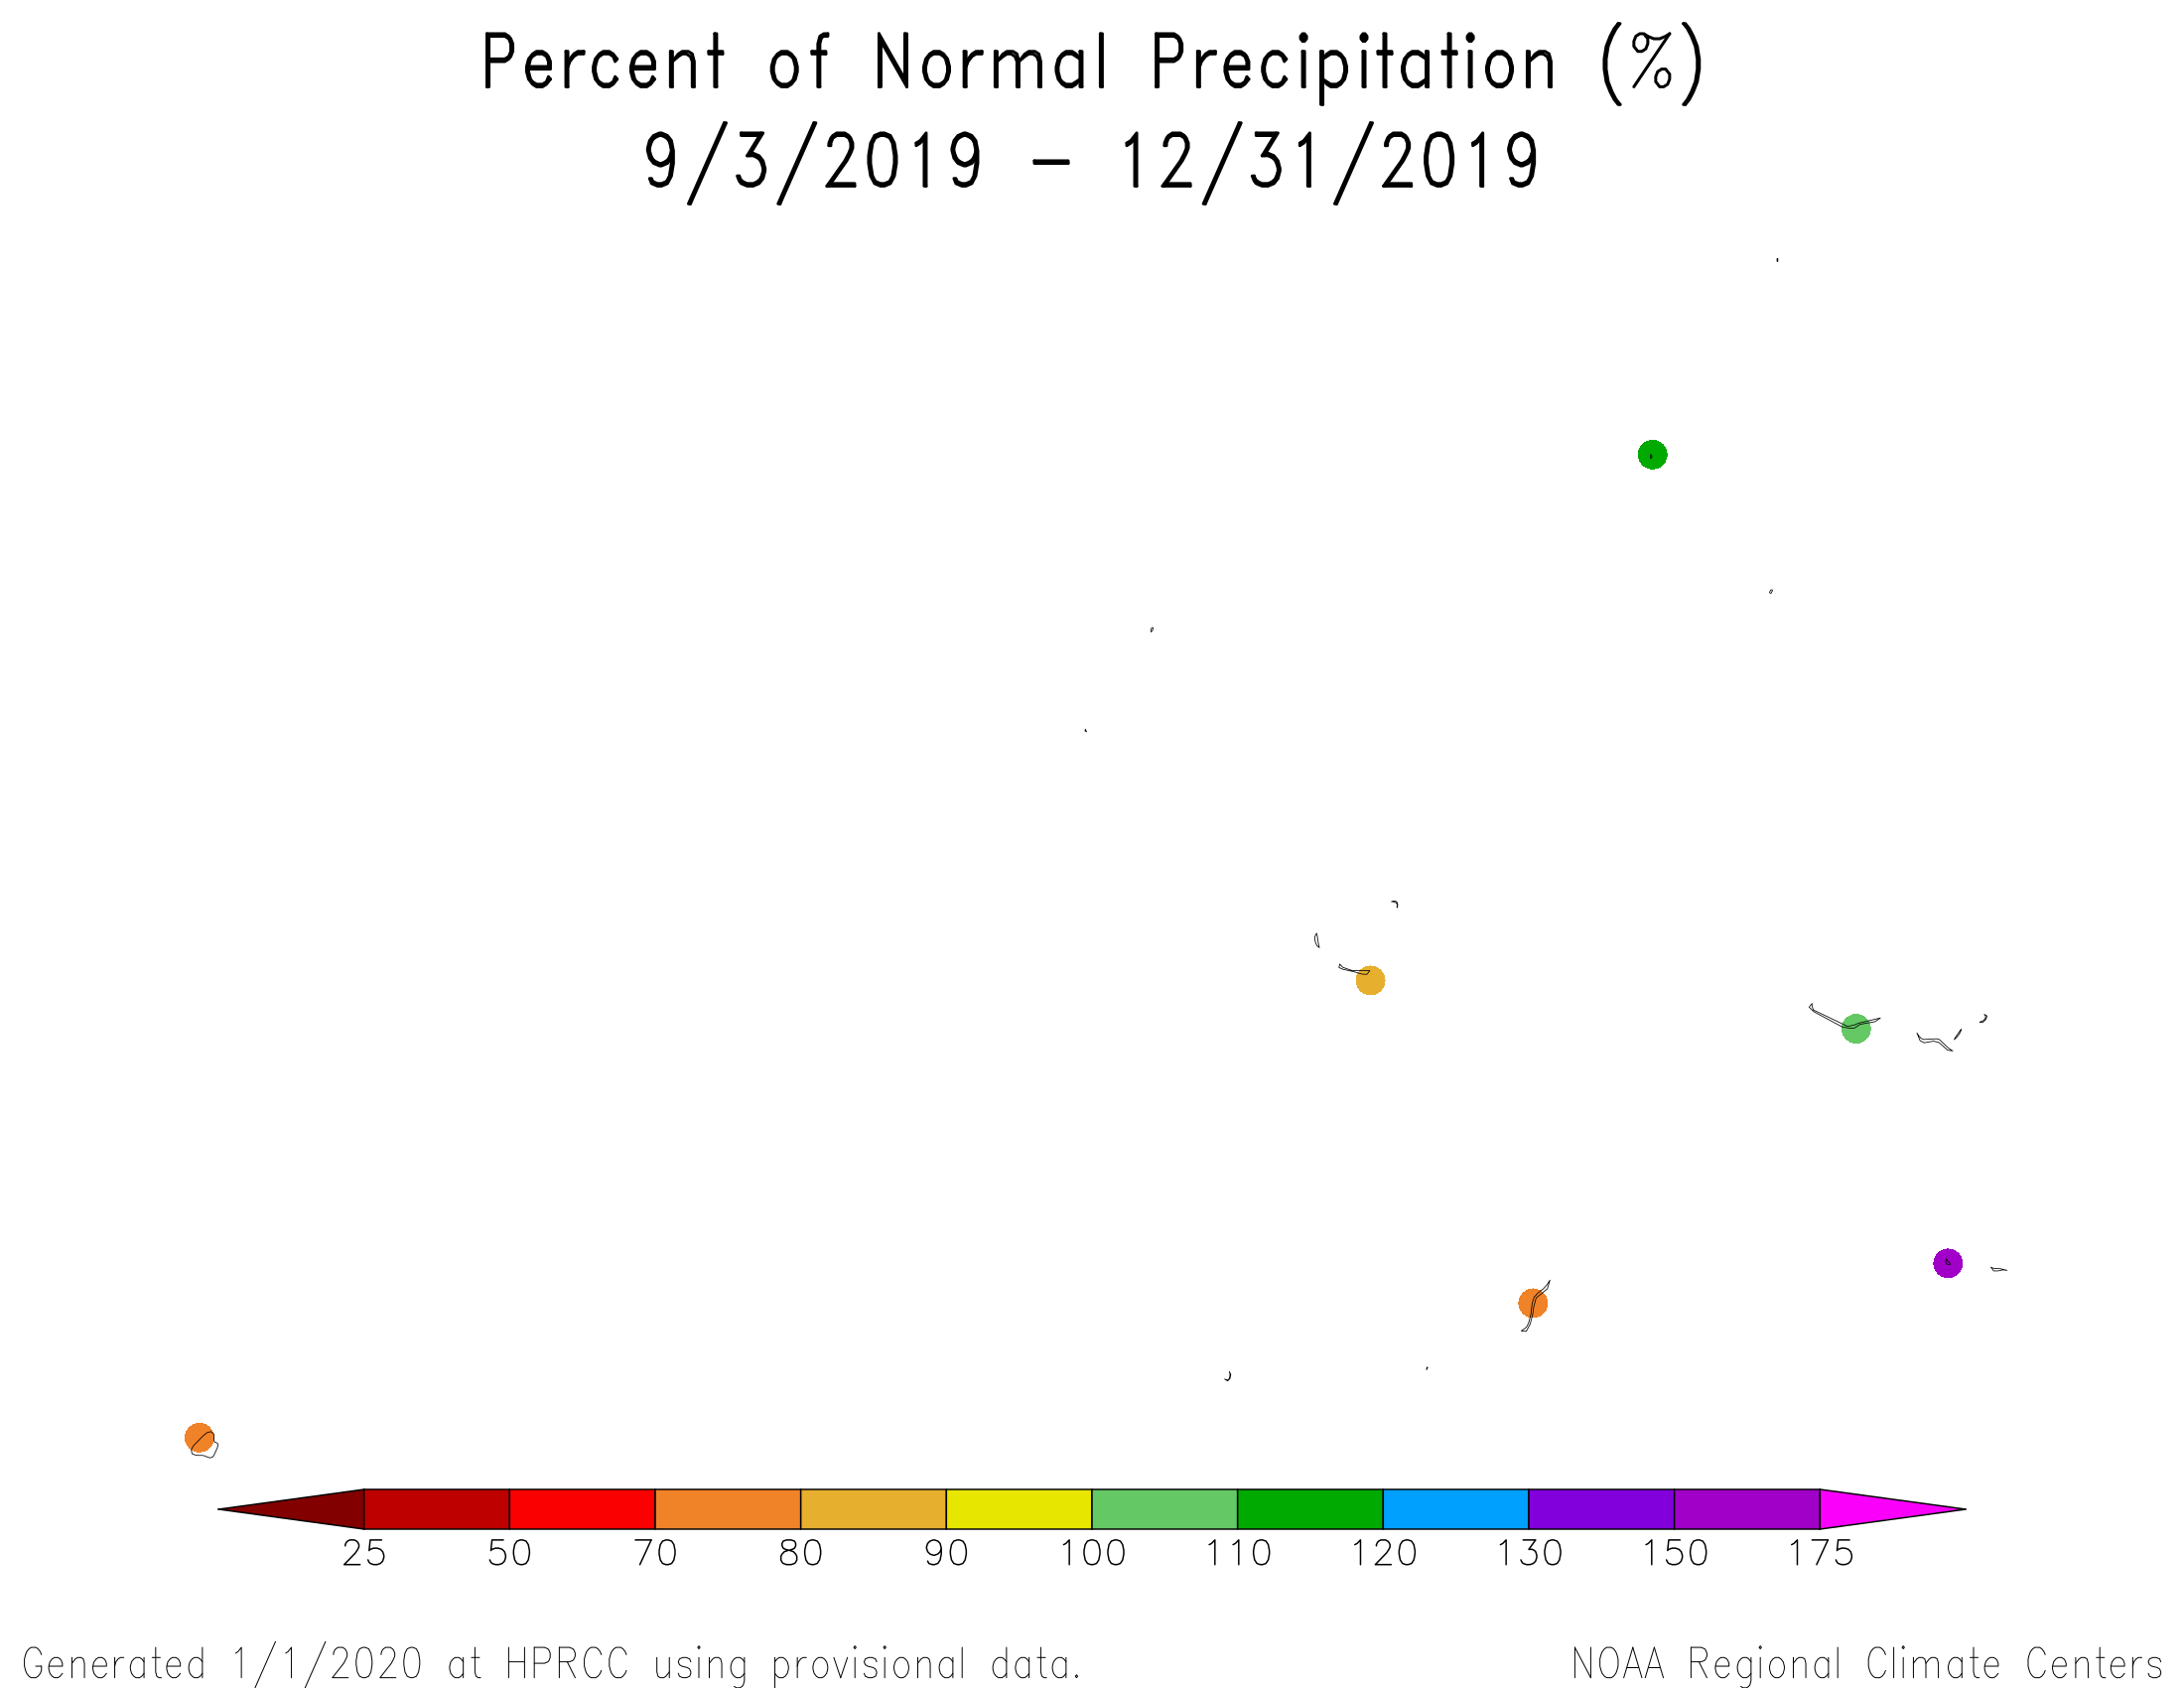
Hawaii percent of normal precipitation map, September-December 2019.
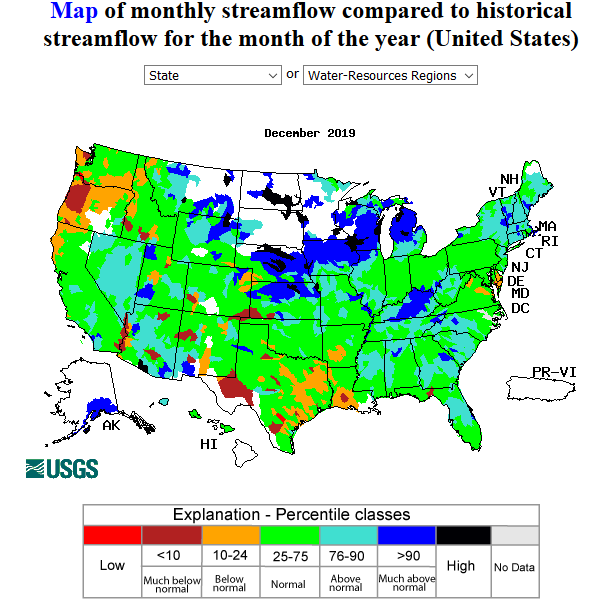
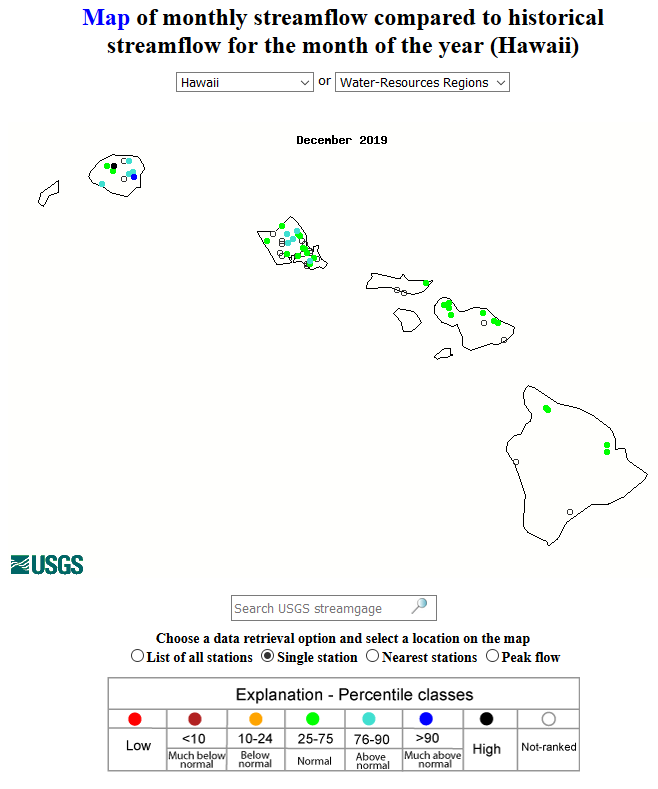
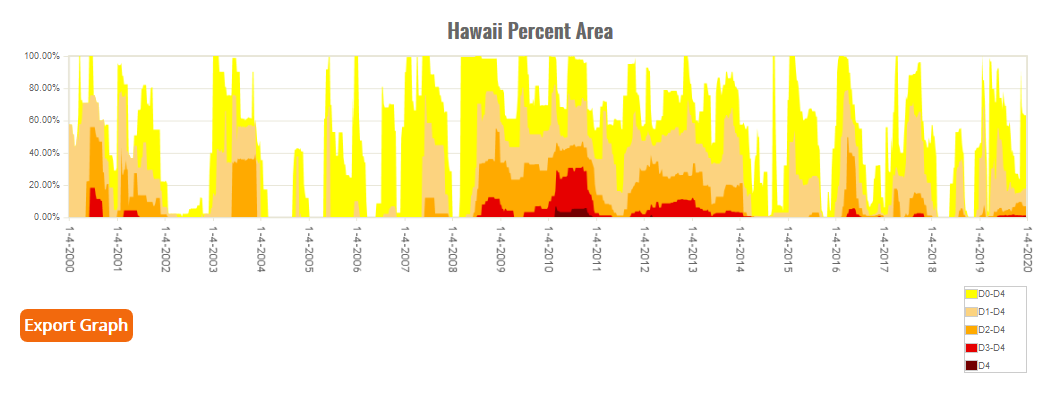
It was drier than normal across much of the Hawaiian Islands during December 2019 and out to the last four months. Generally drier-than-normal conditions were observed more often than wetter-than-normal conditions for most of the time periods over the last year (last 1, 2, 3, 4, 6, 9, 12 months). Wetter-than-normal conditions dominated at longer time periods (last 24, 36, 48, 60 months). Streamflow was mostly near normal. Drought and abnormal dryness changed little during December. The statewide drought area increased slightly from 16.4 percent at the end of November to 17.6 percent at the end of December. A spot of exceptional drought was added to Maui on December 10.
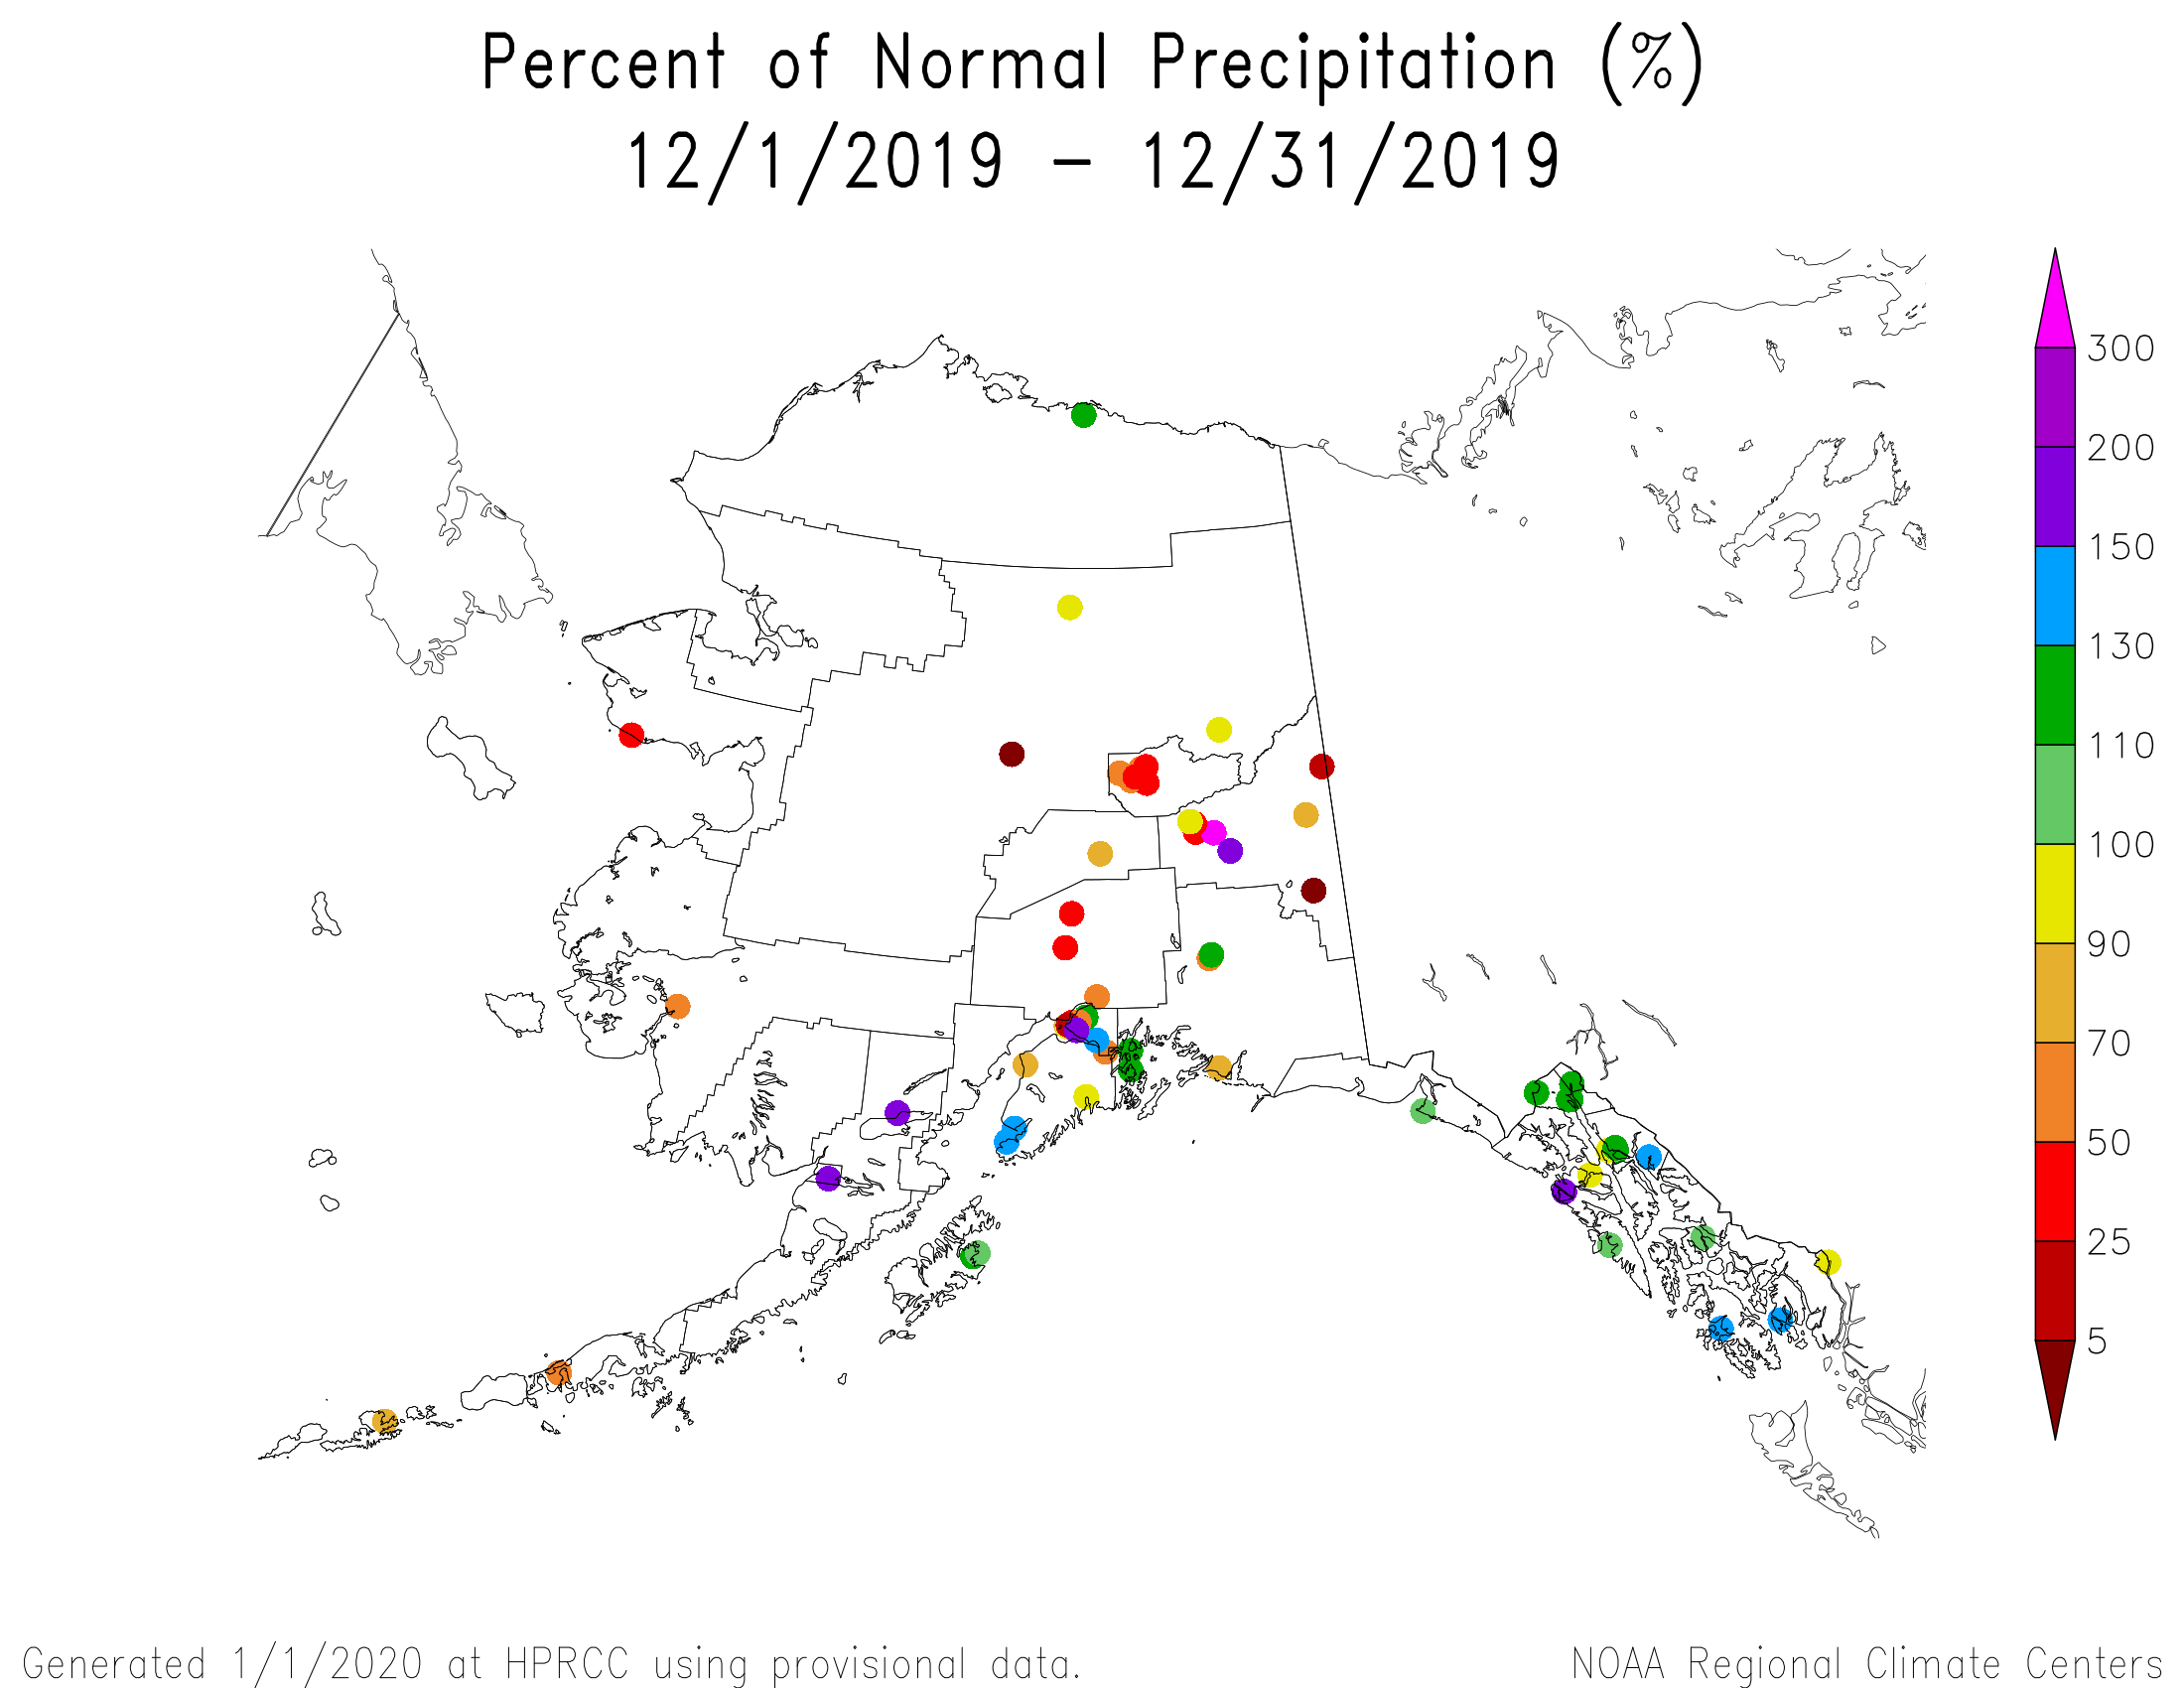
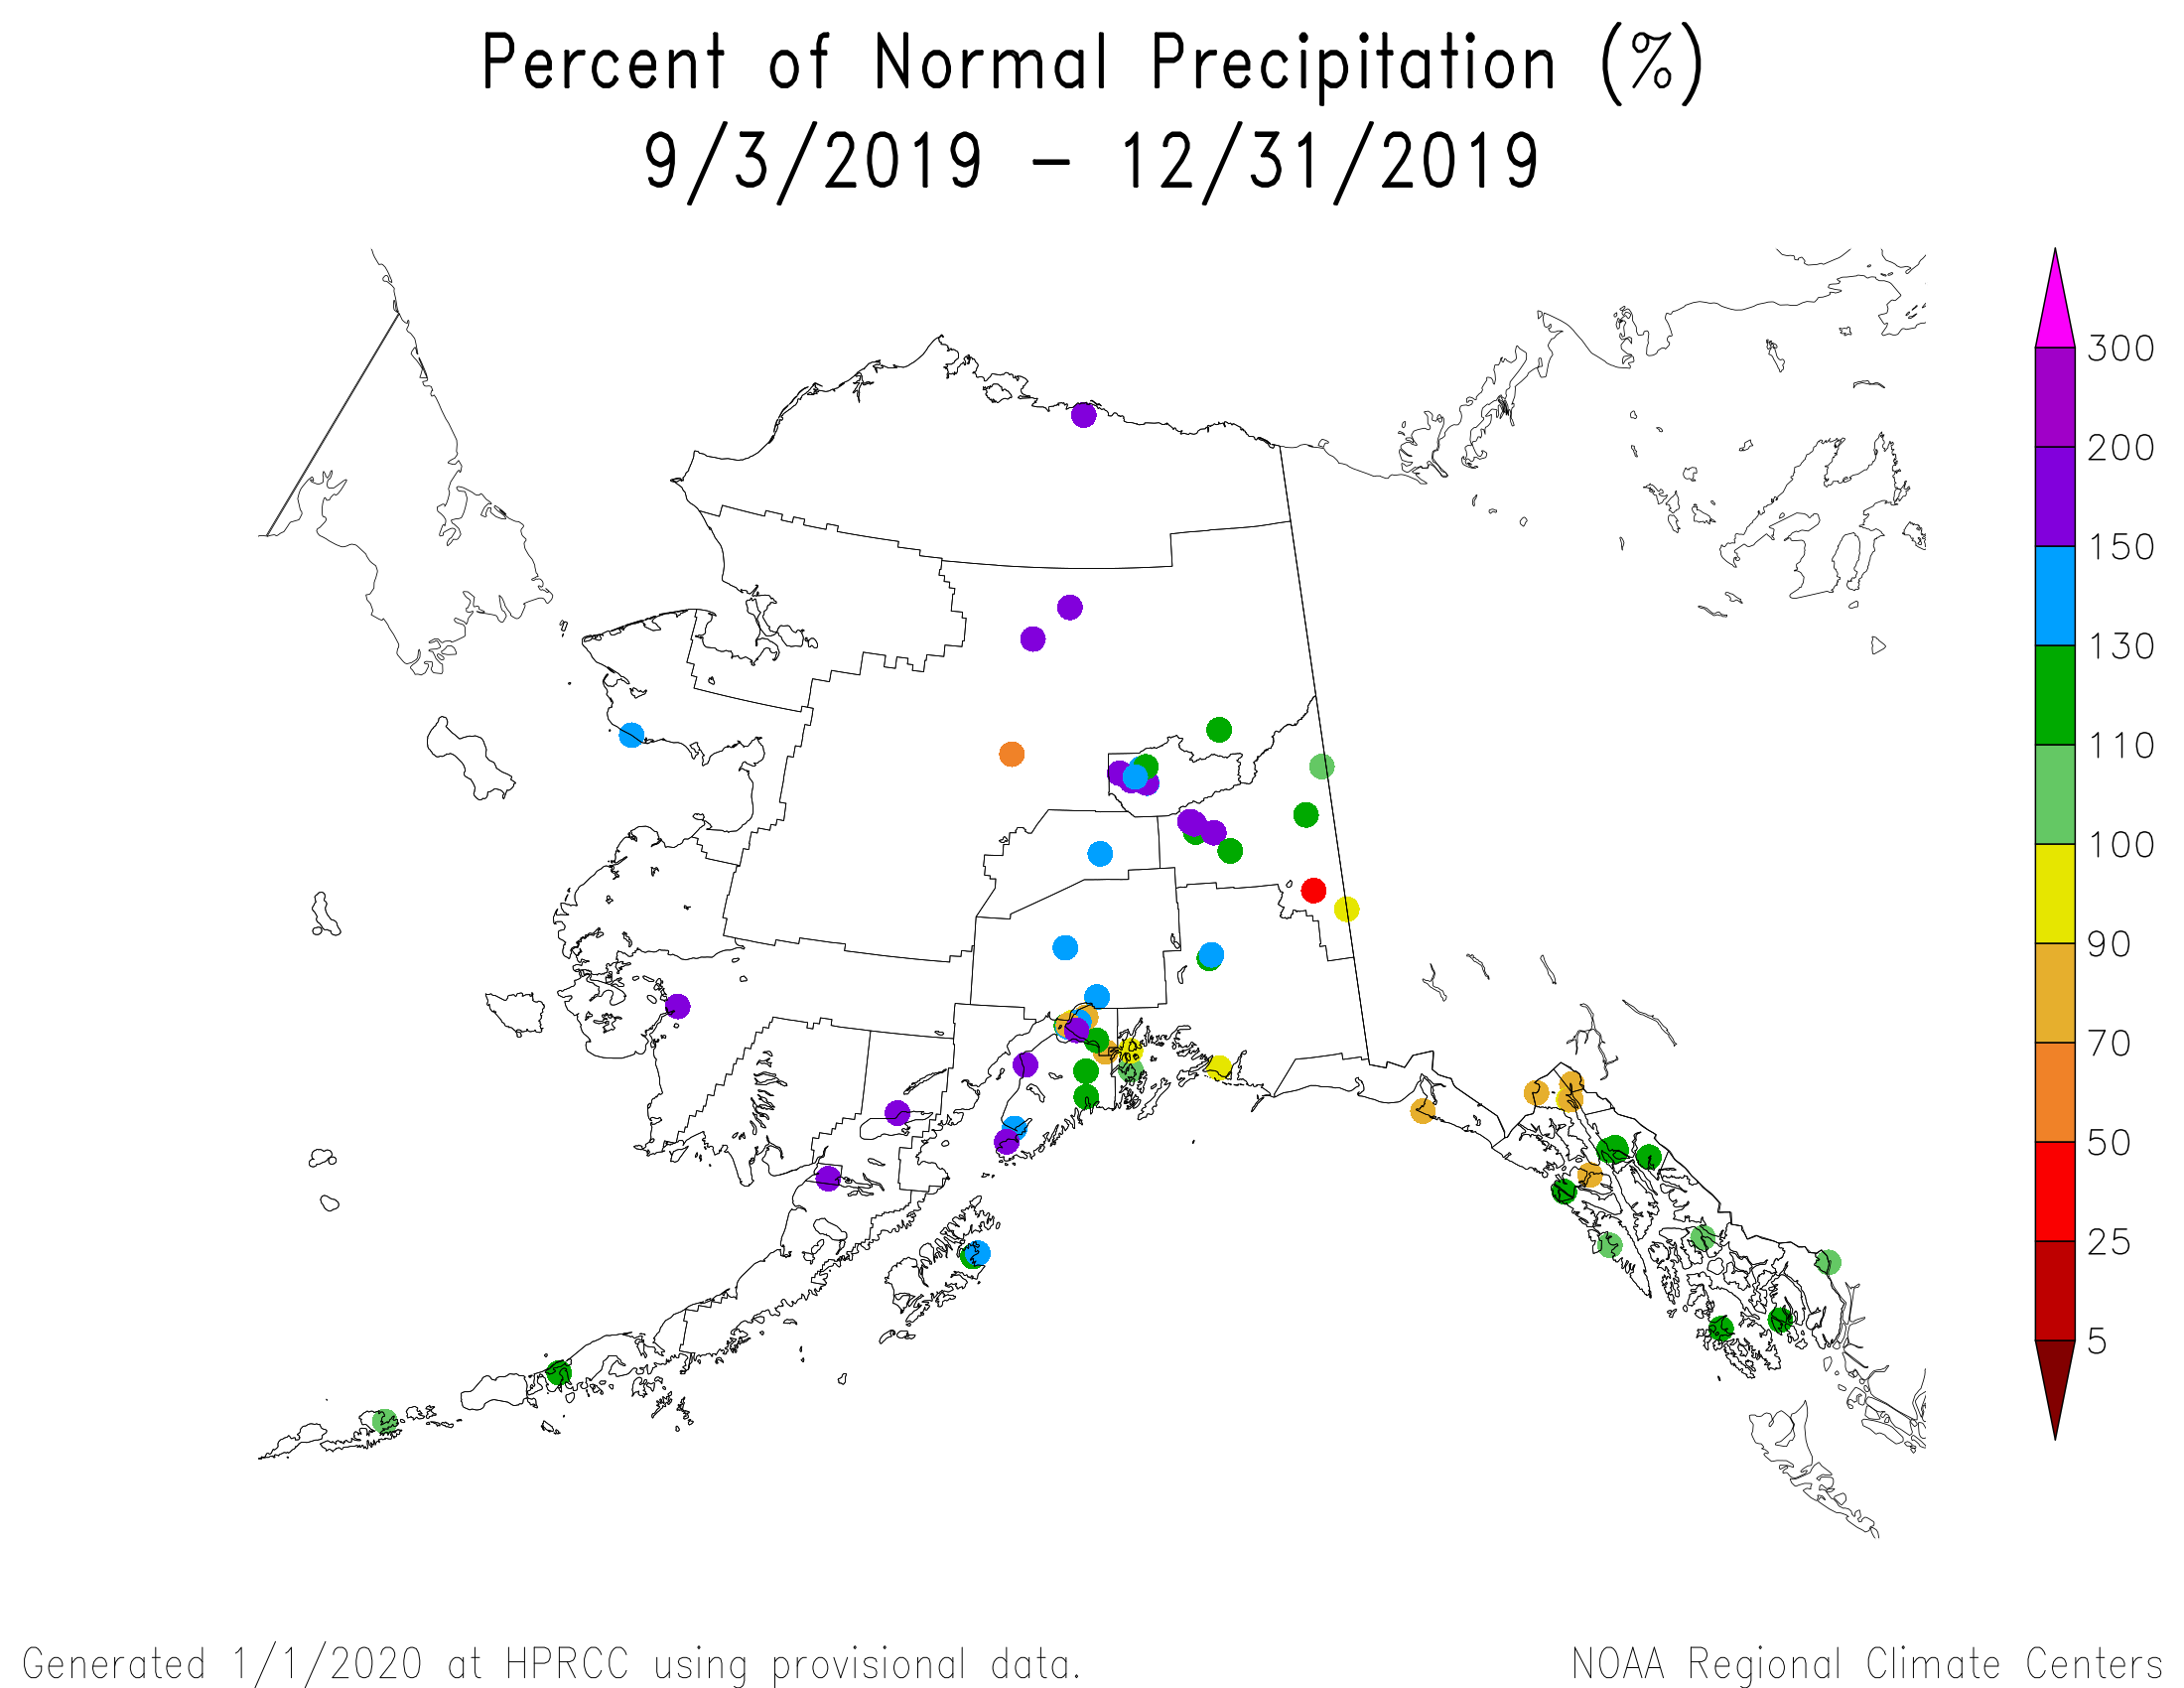
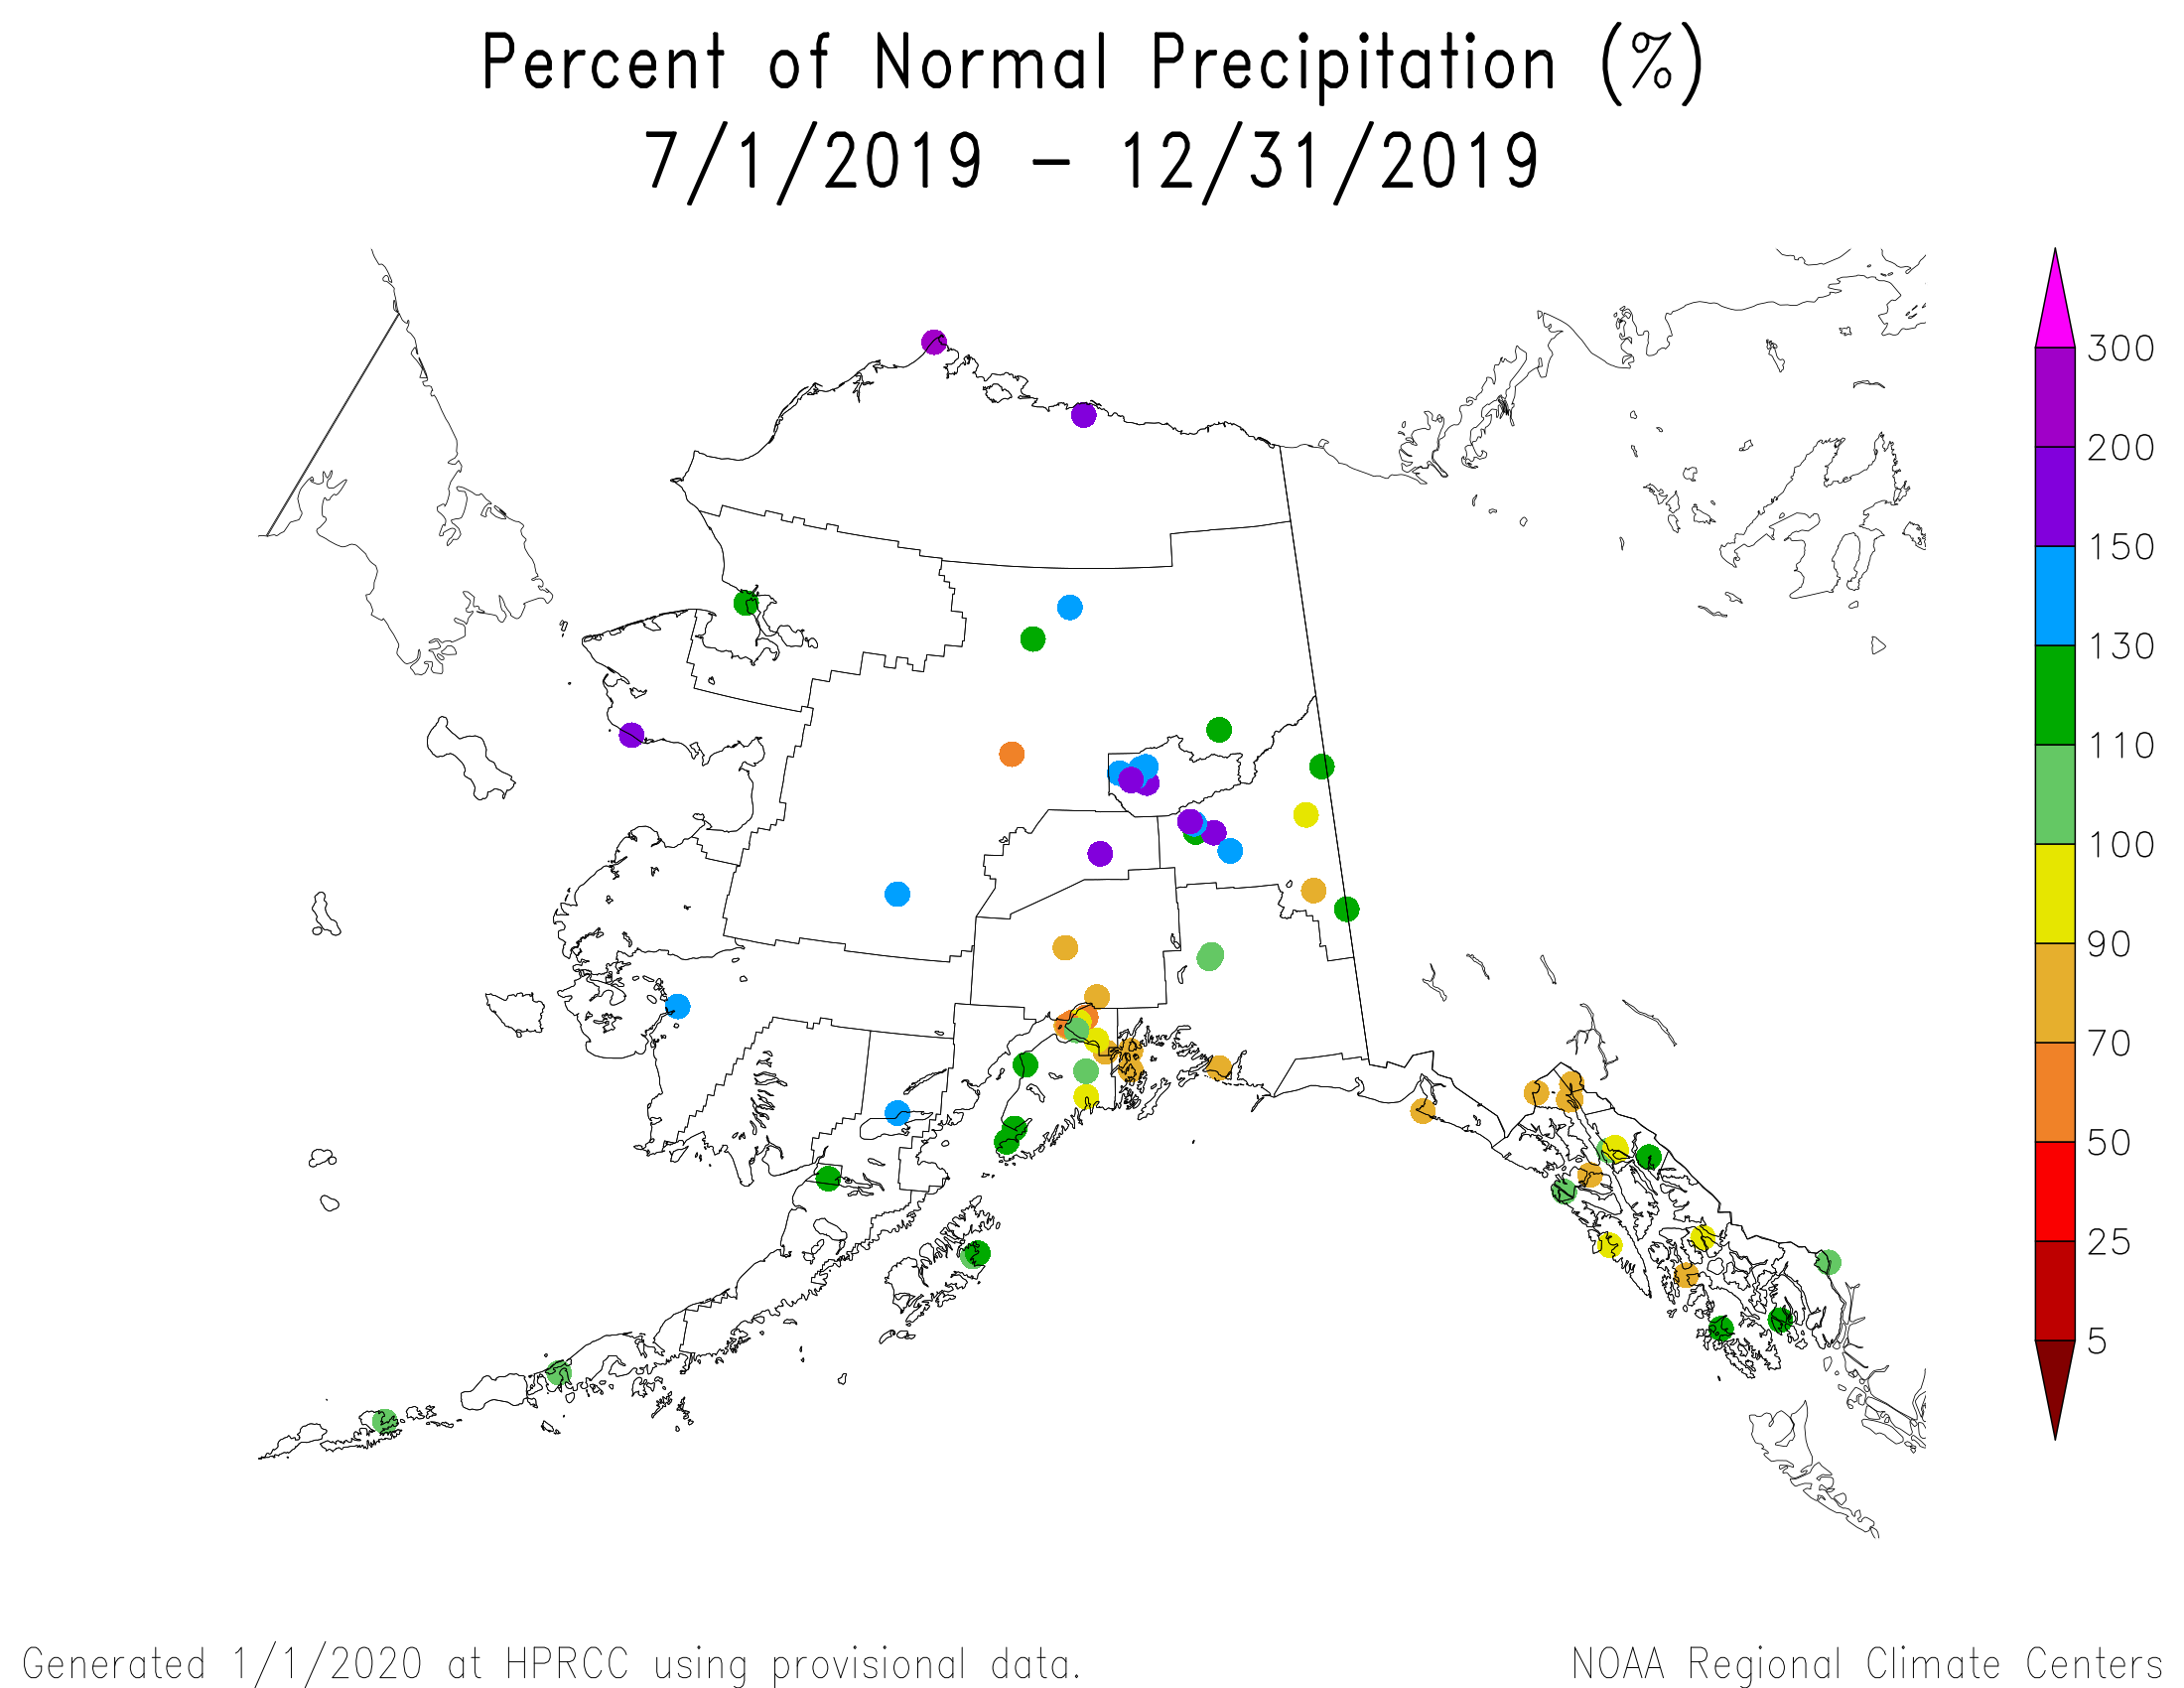
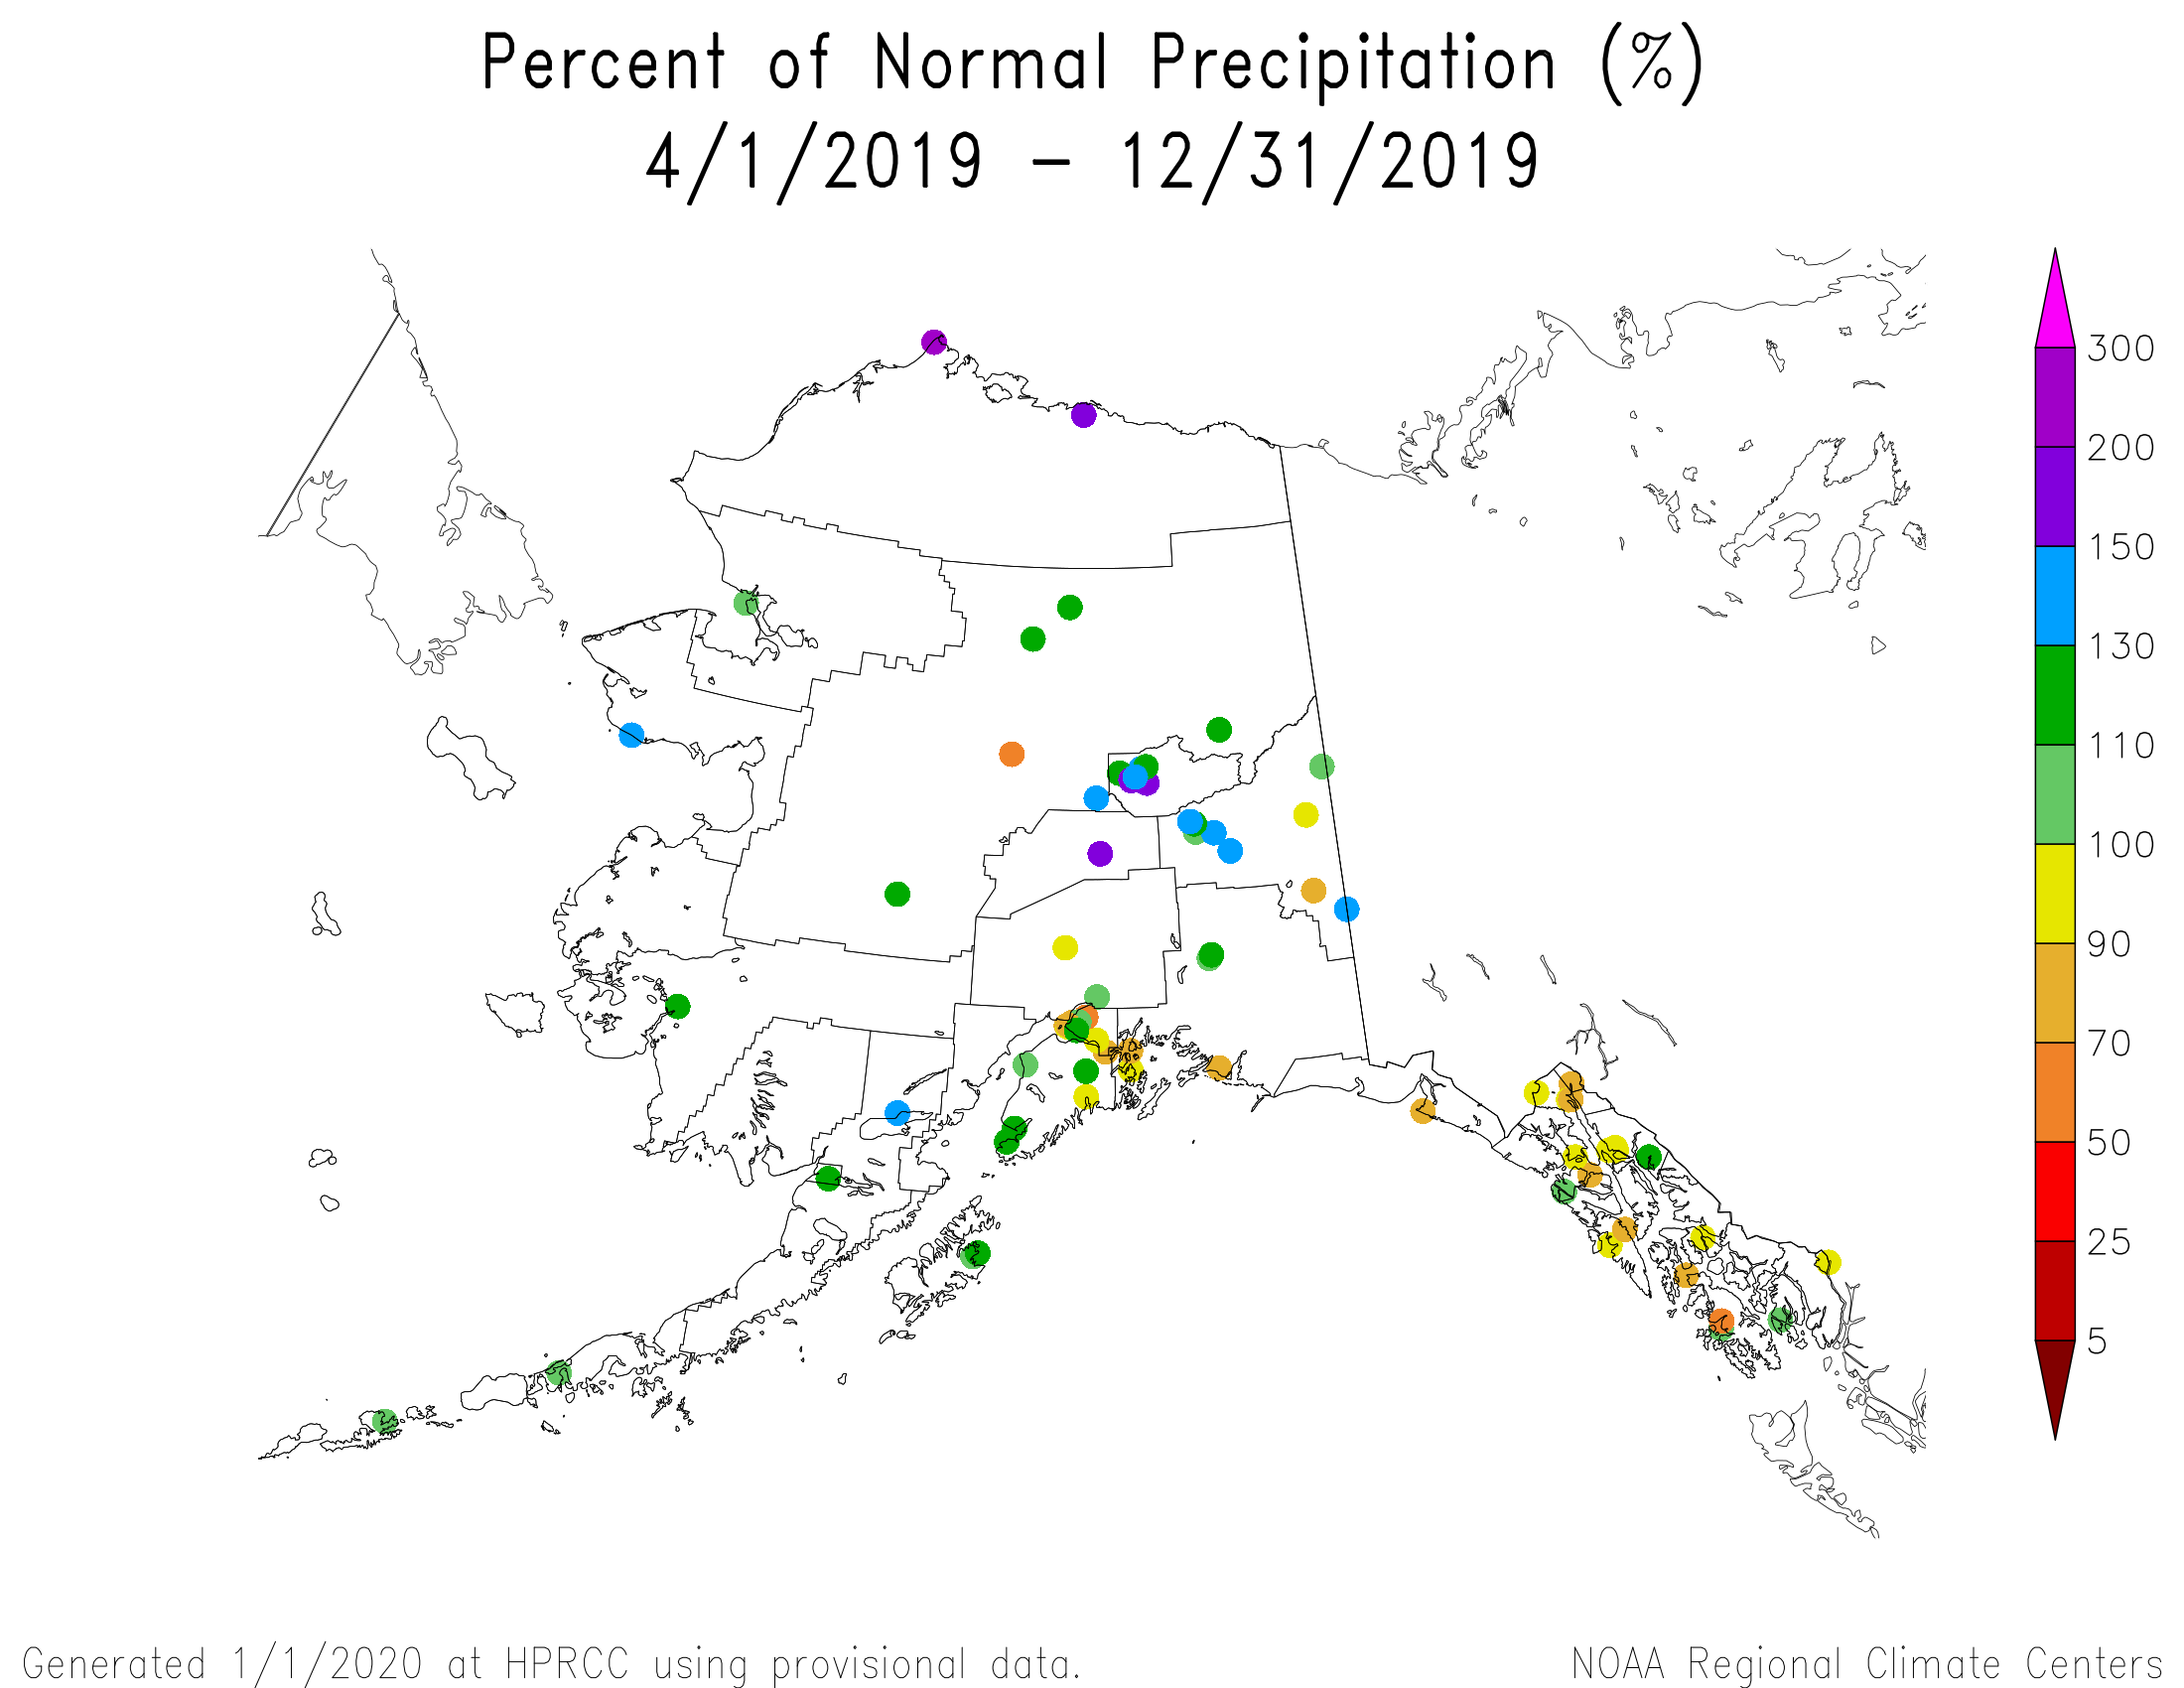
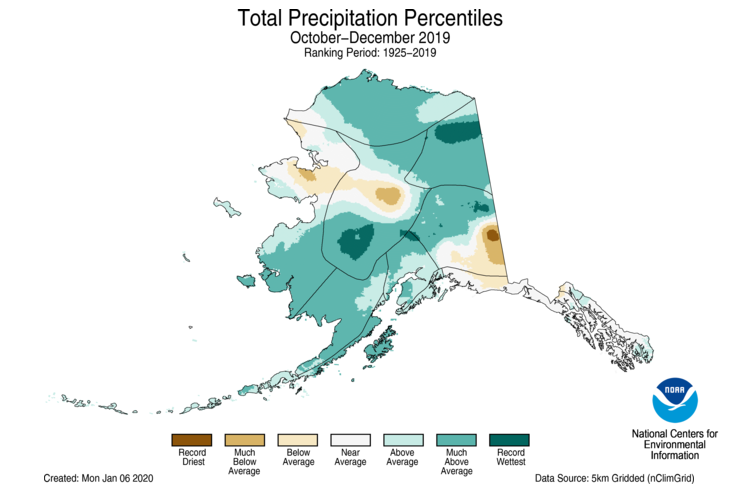
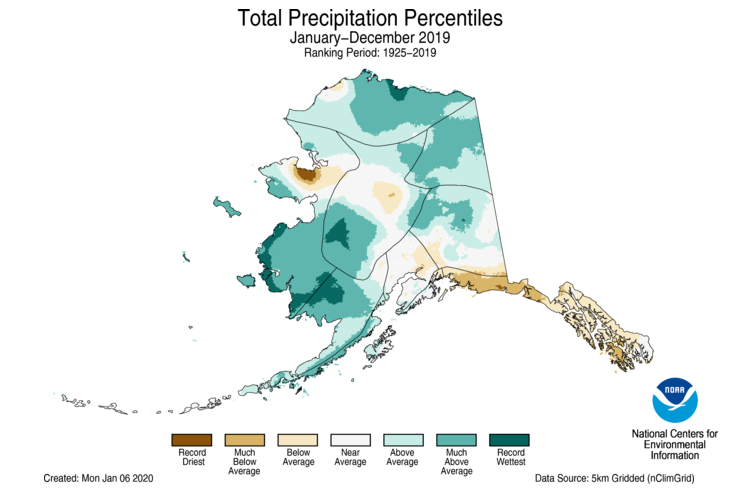
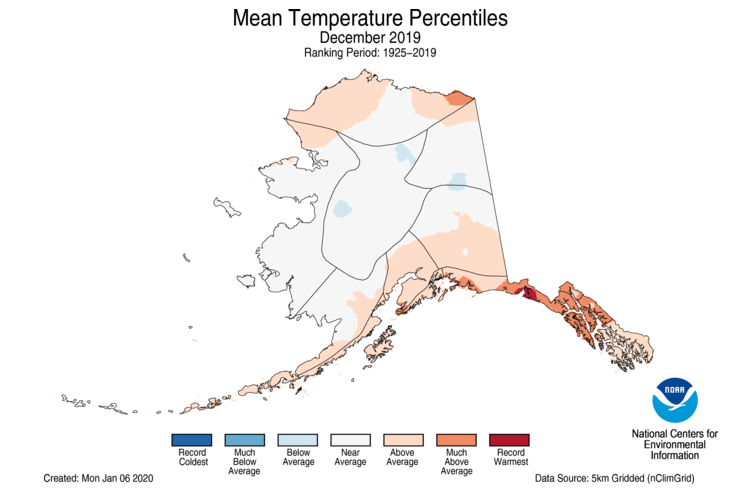
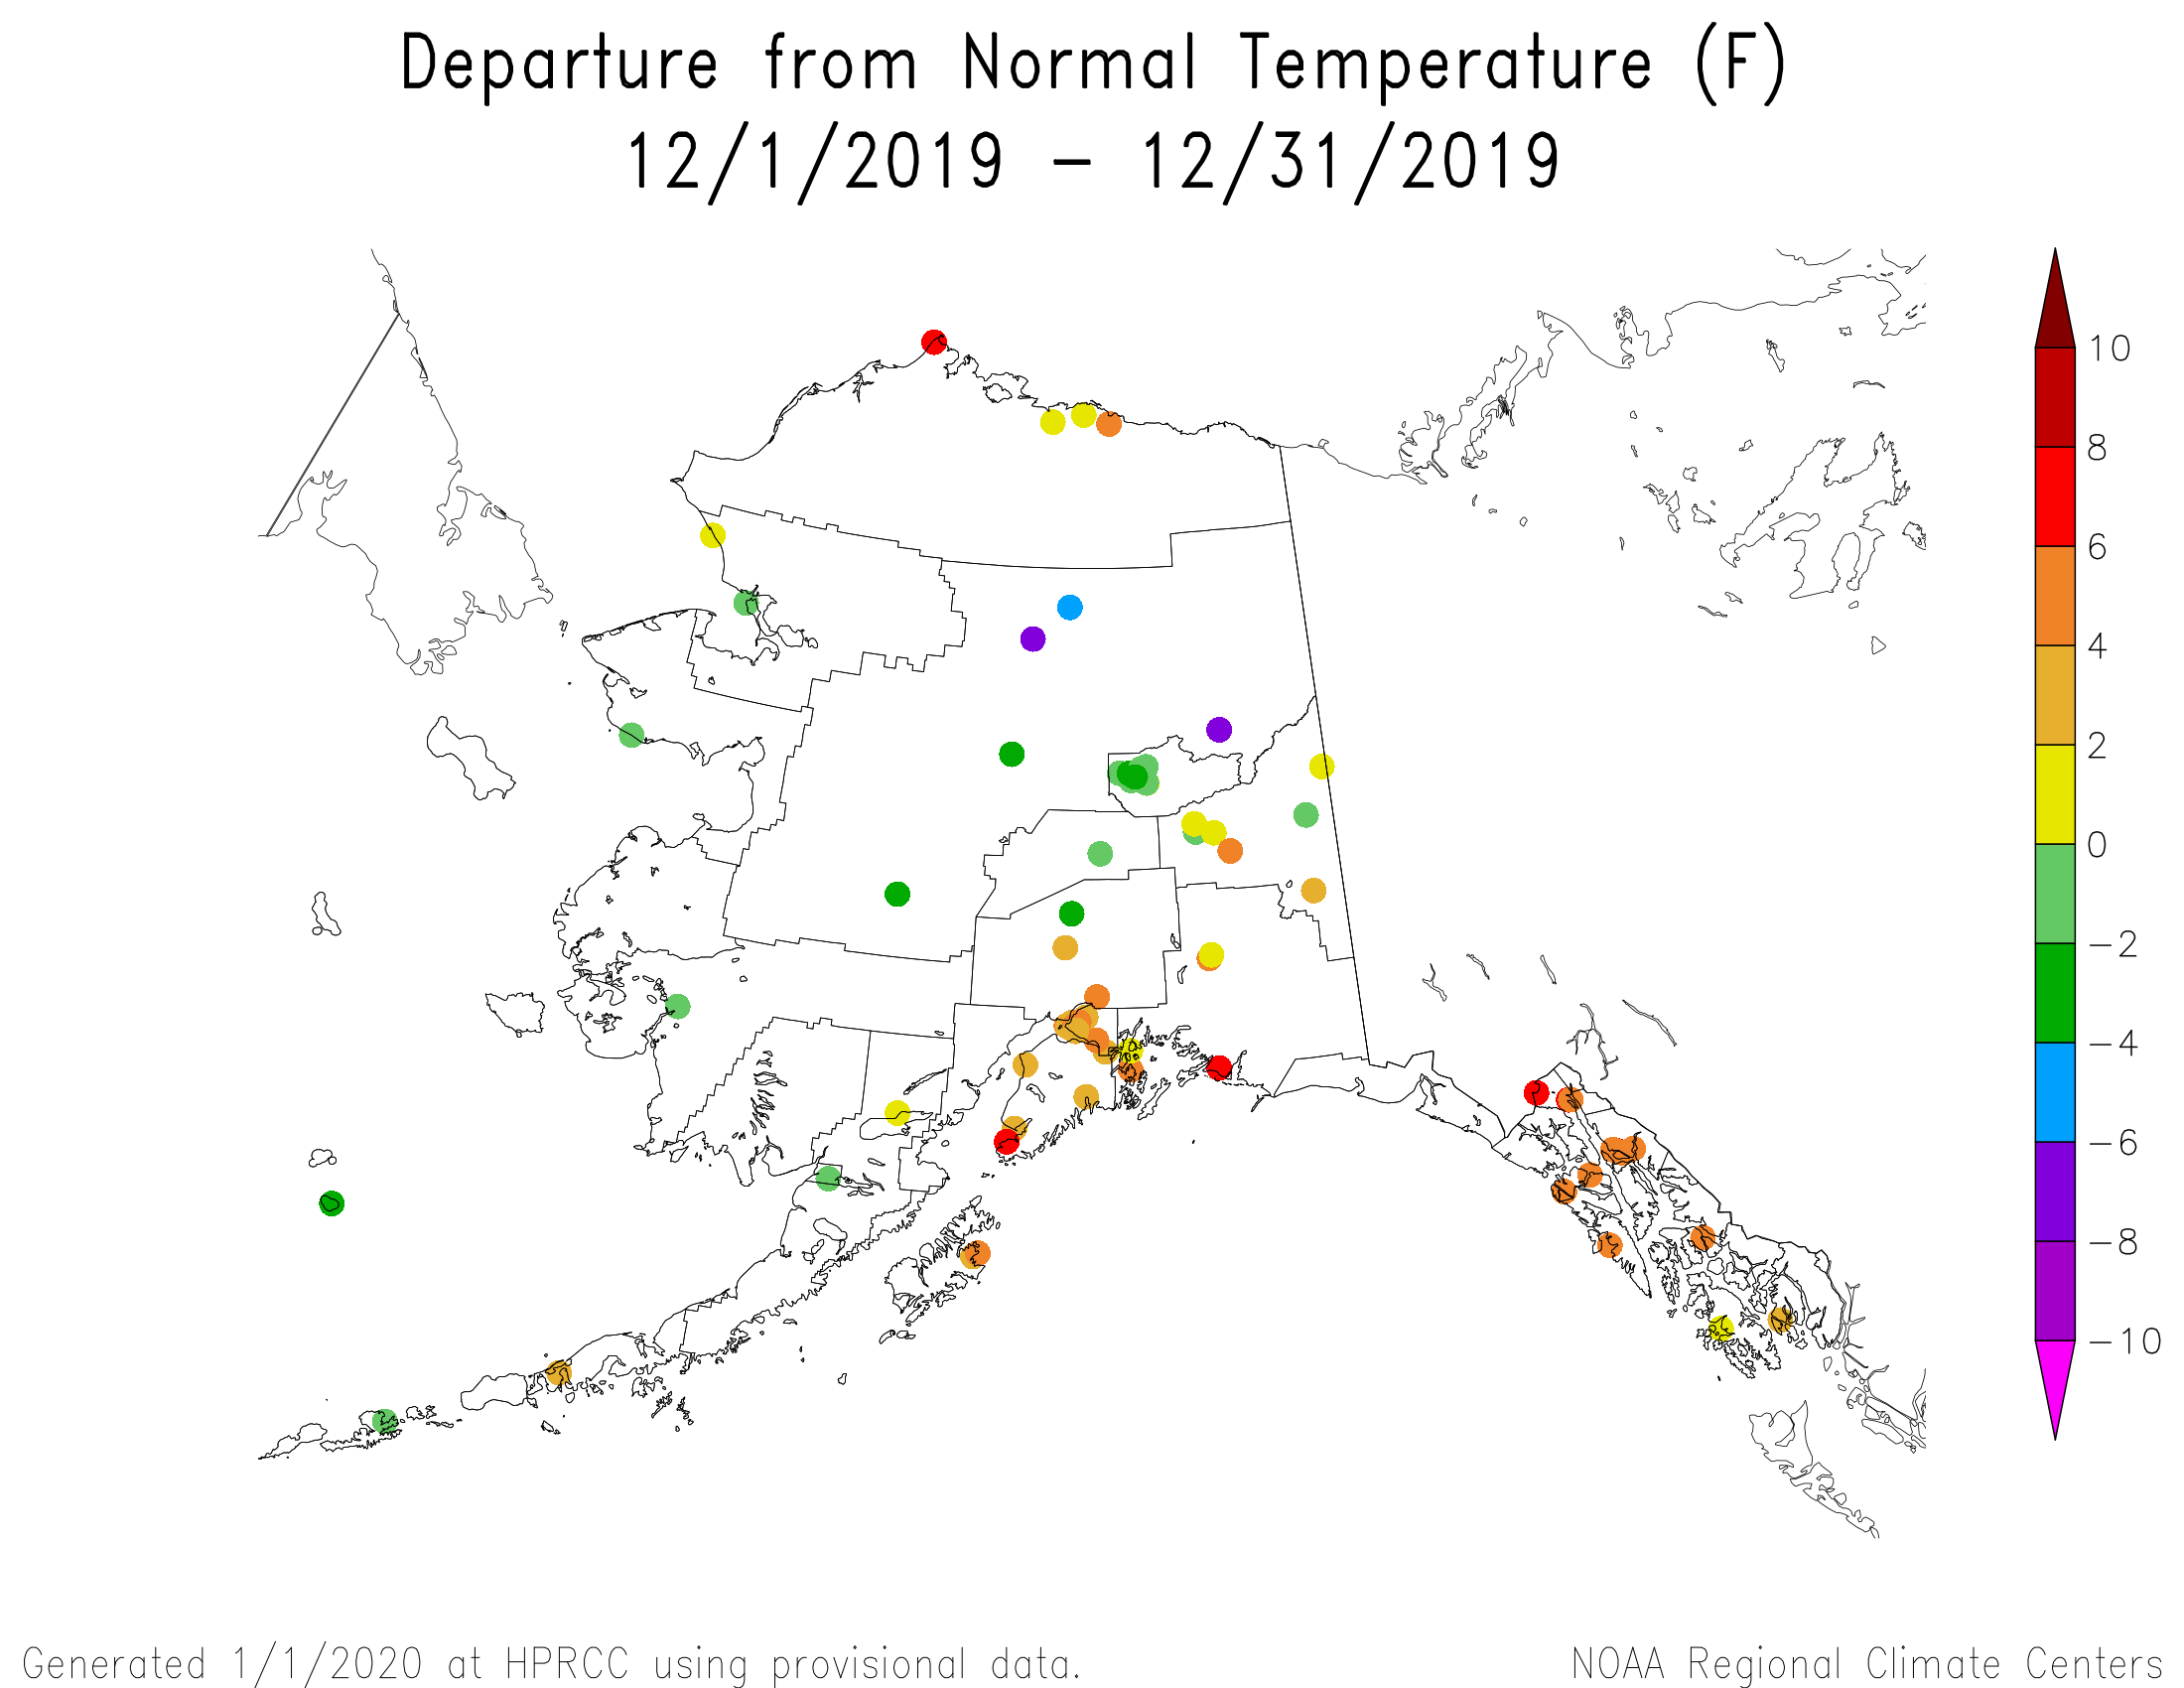
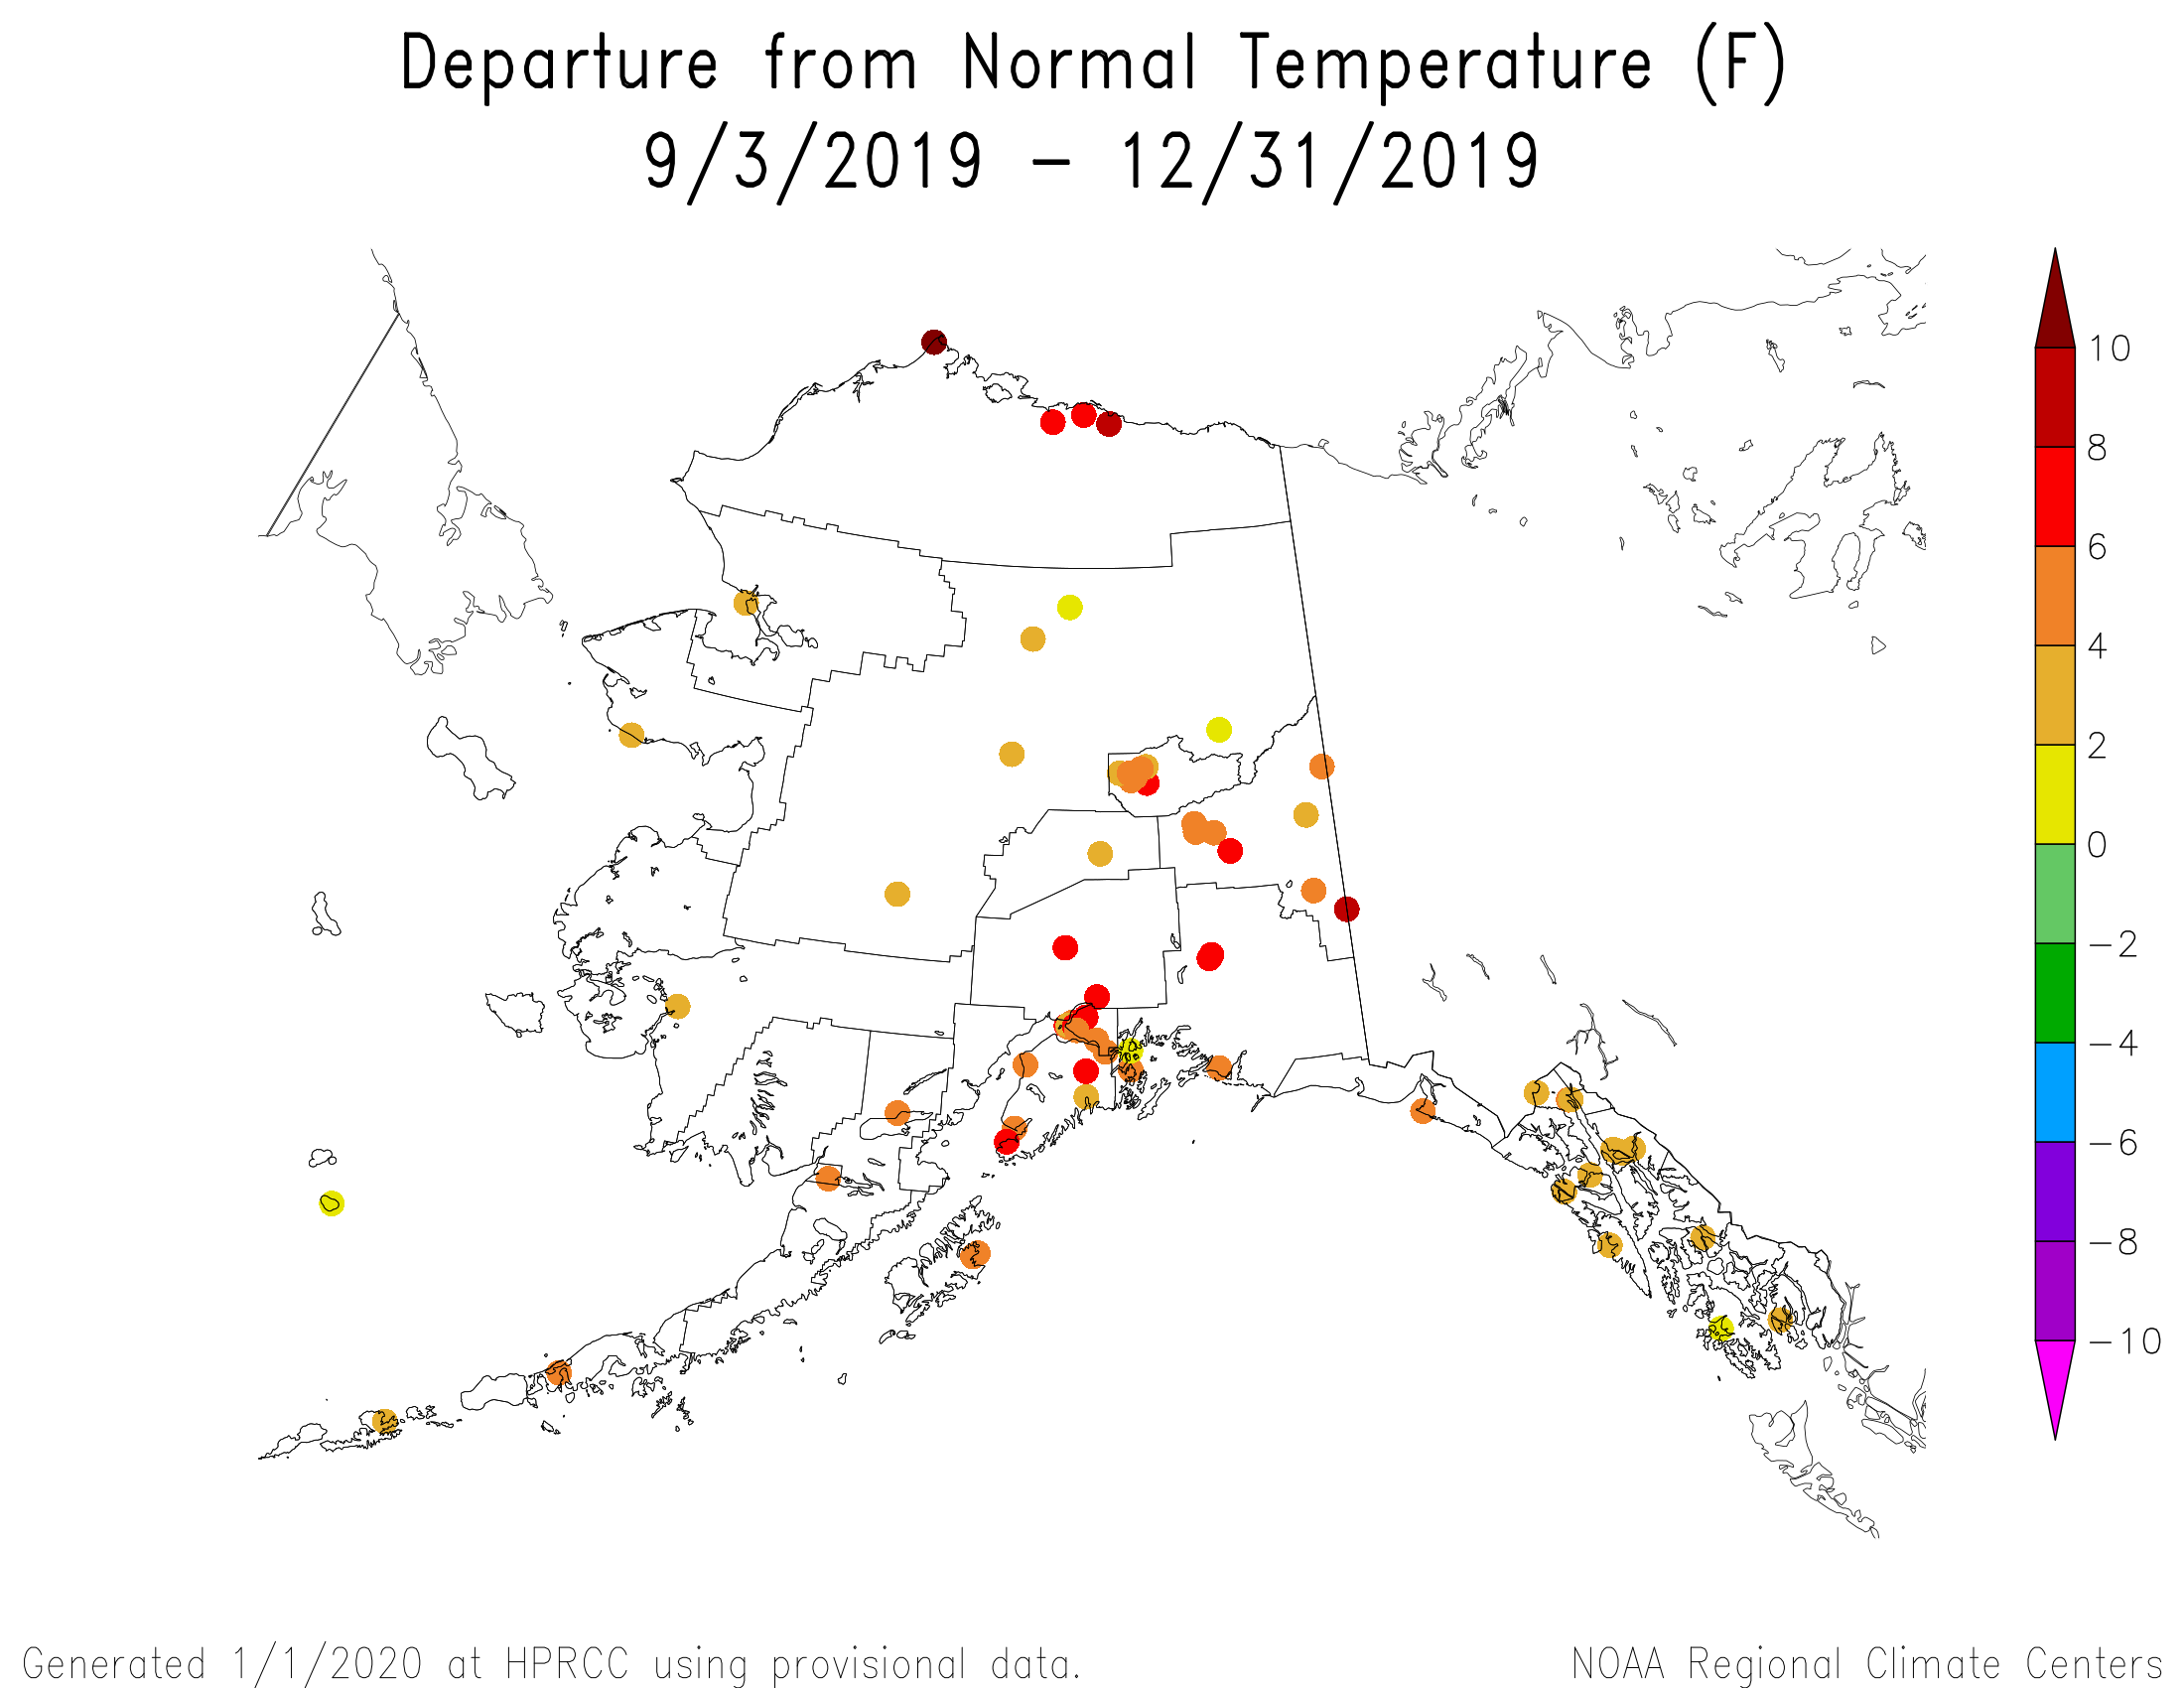
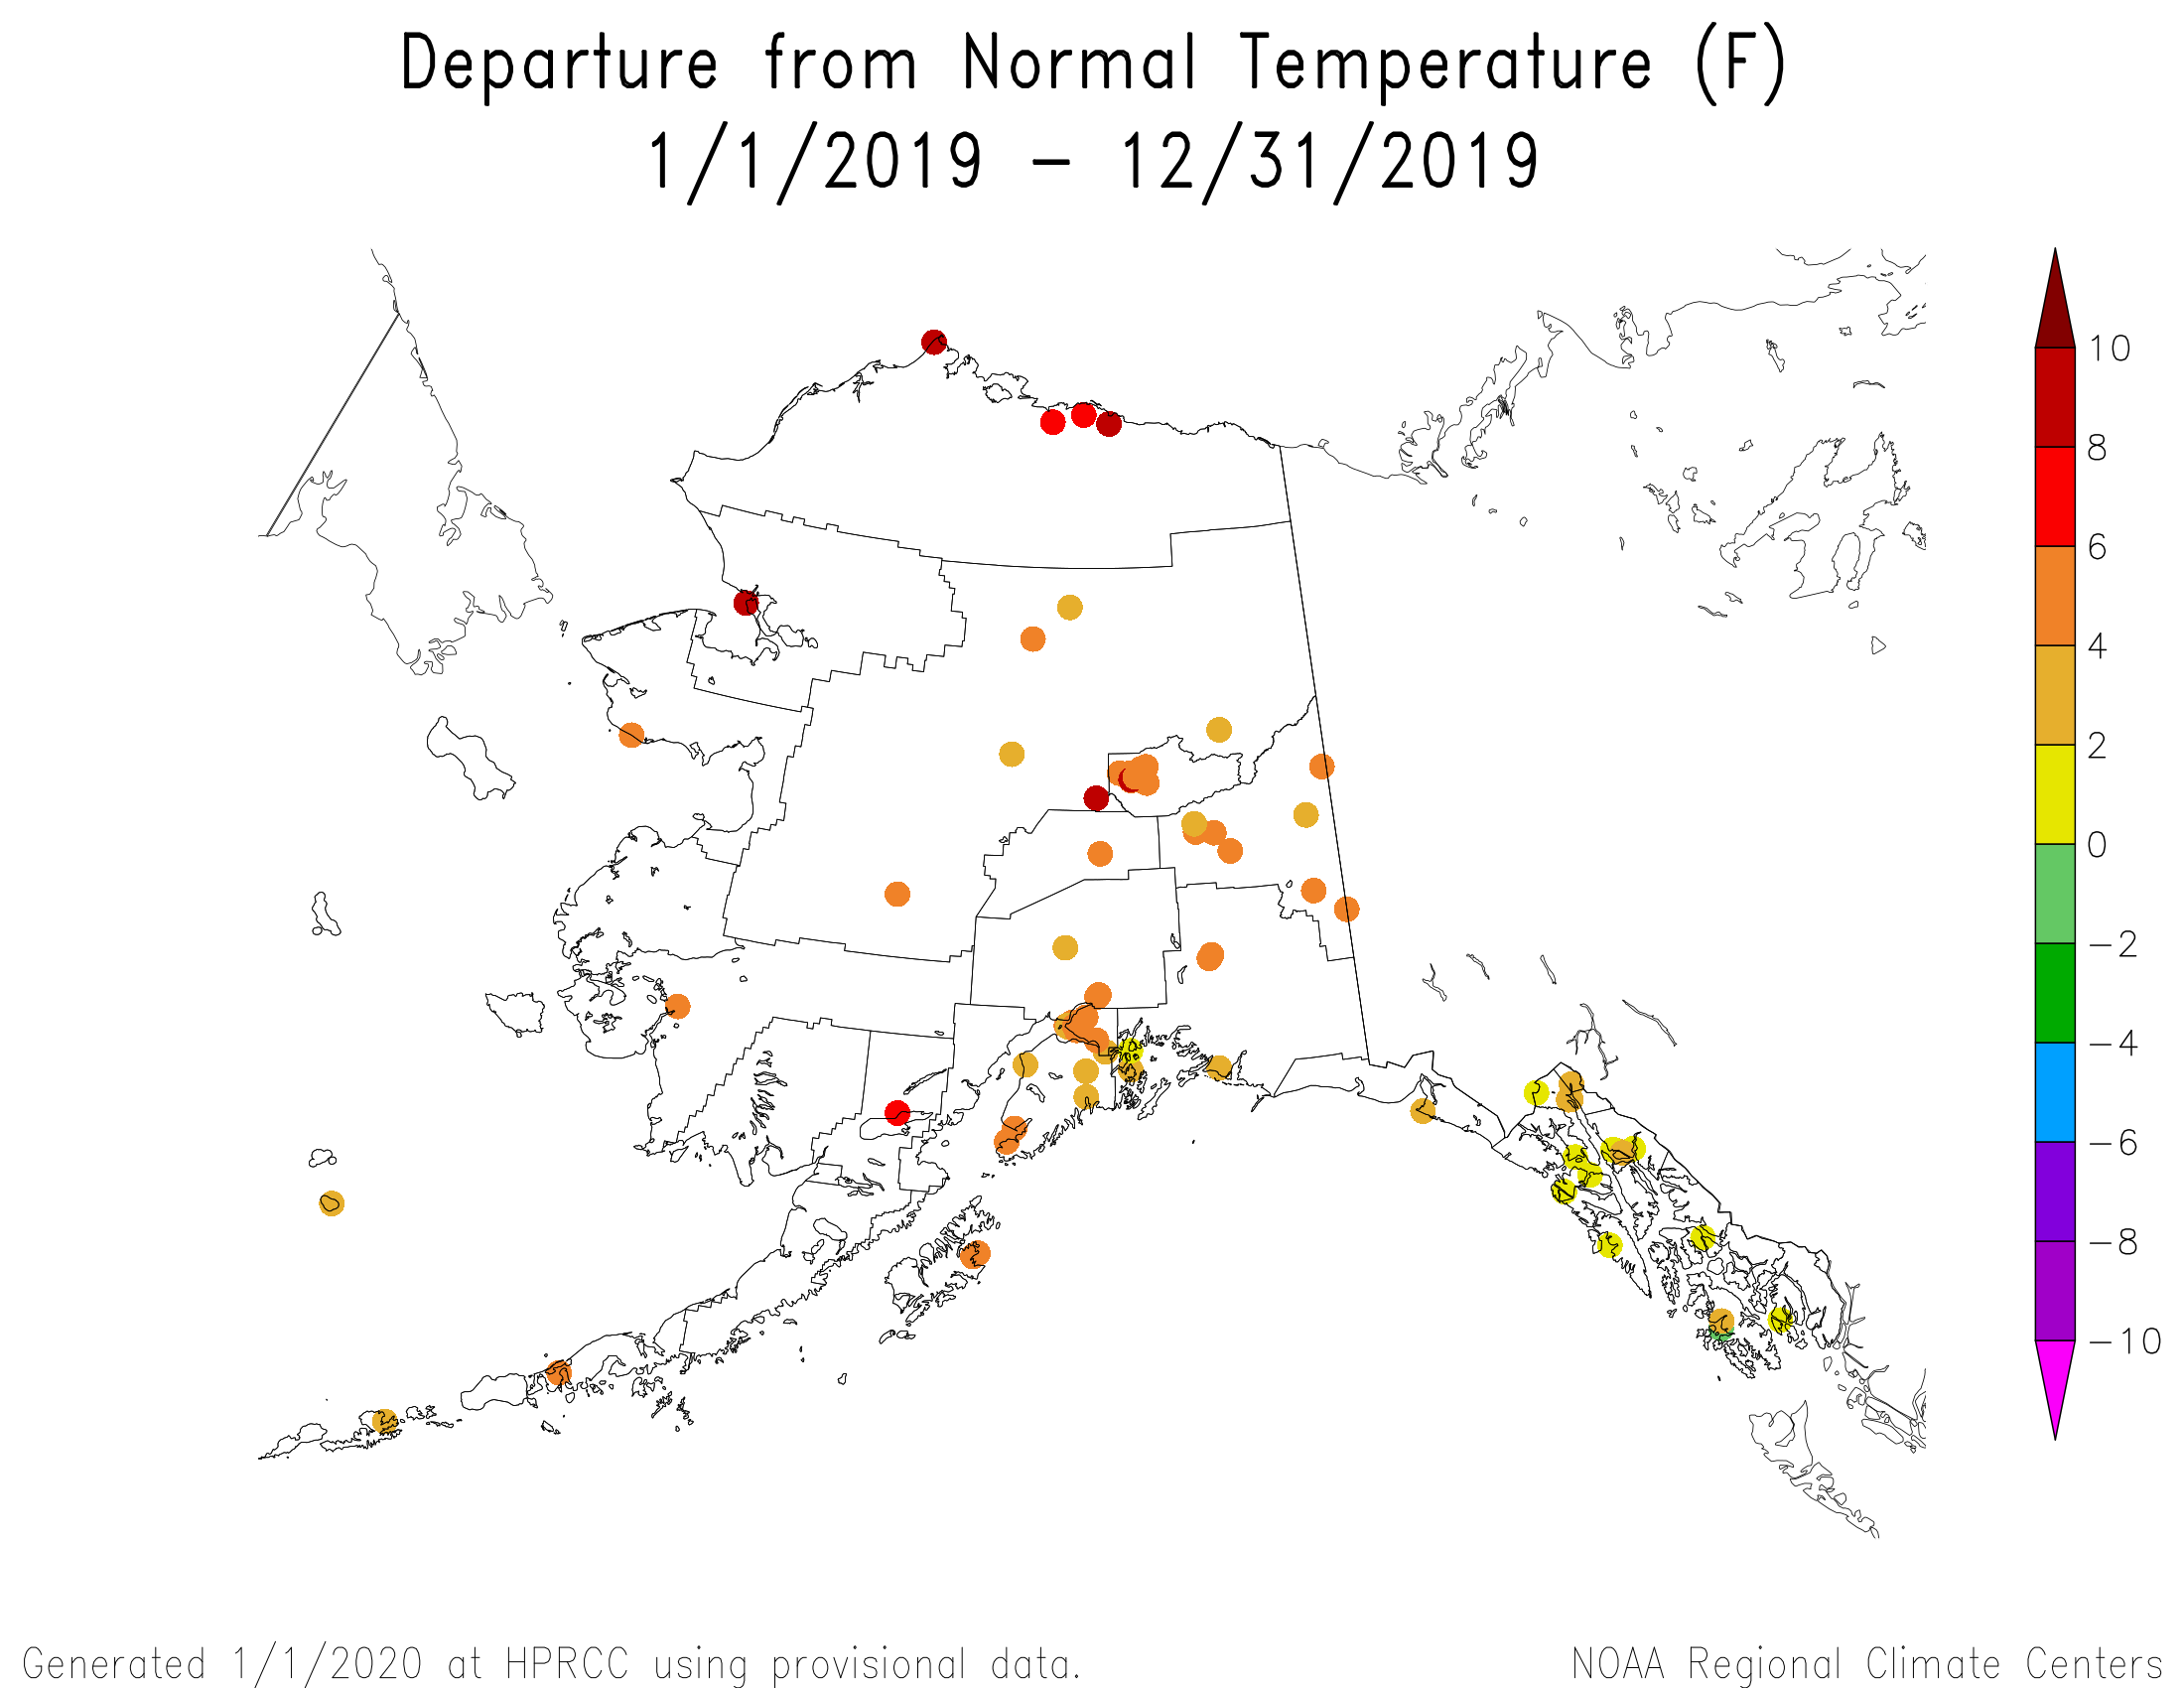
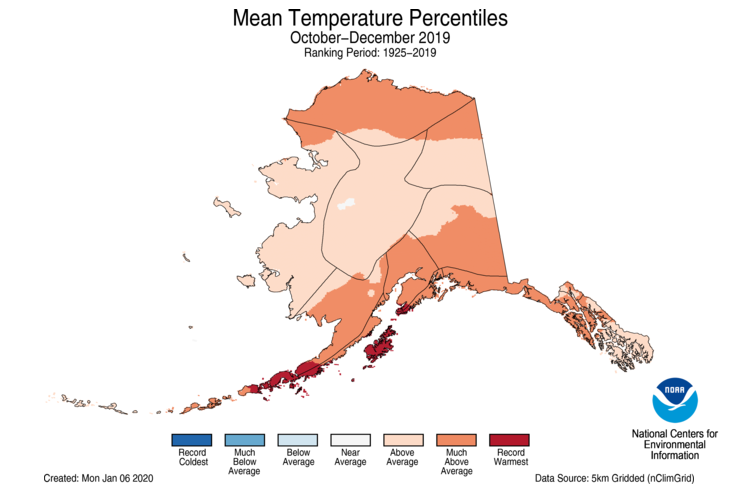
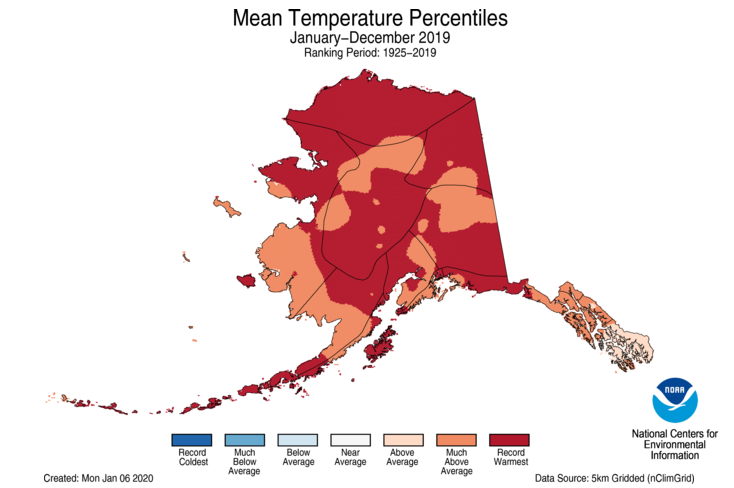
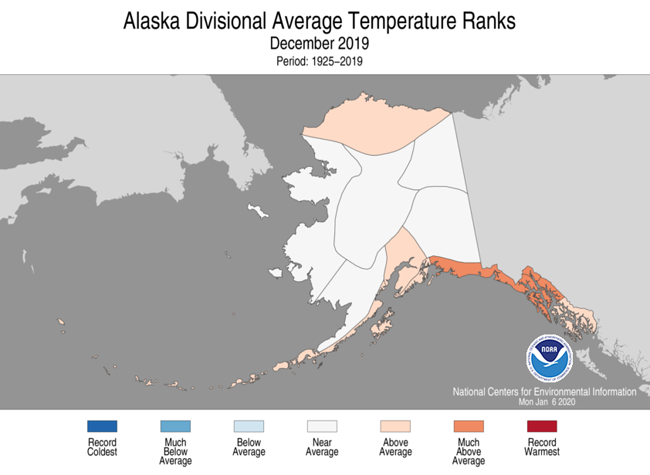
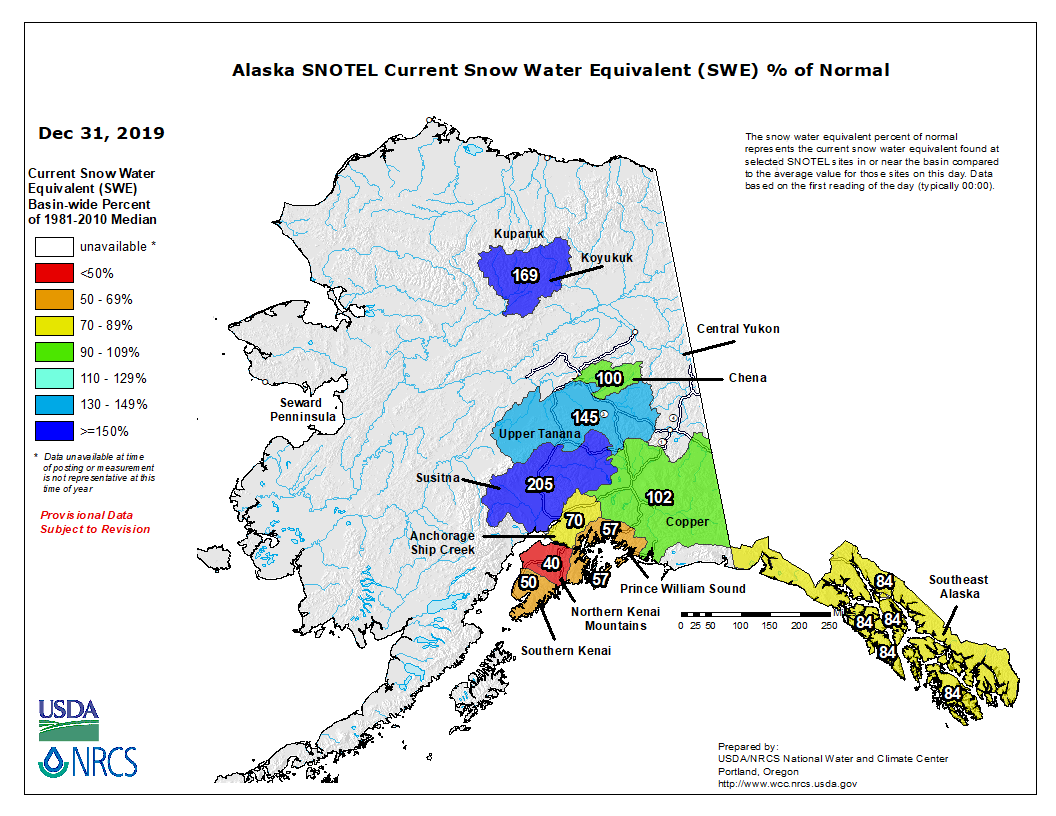
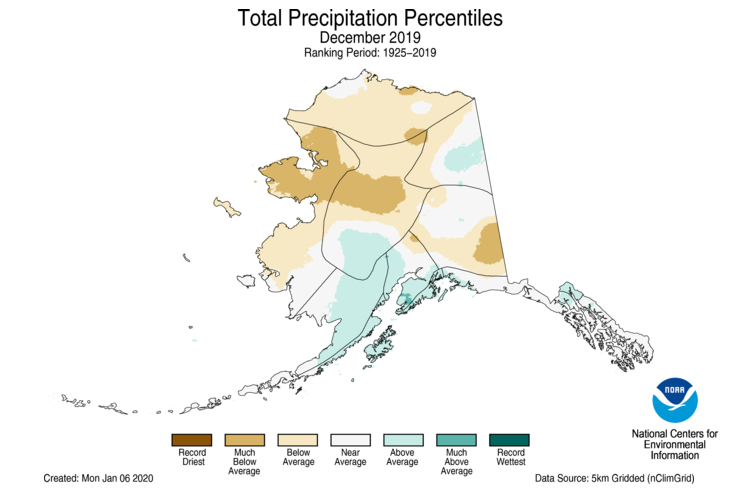 Gridded precipitation percentile map for Alaska, December 2019.
|
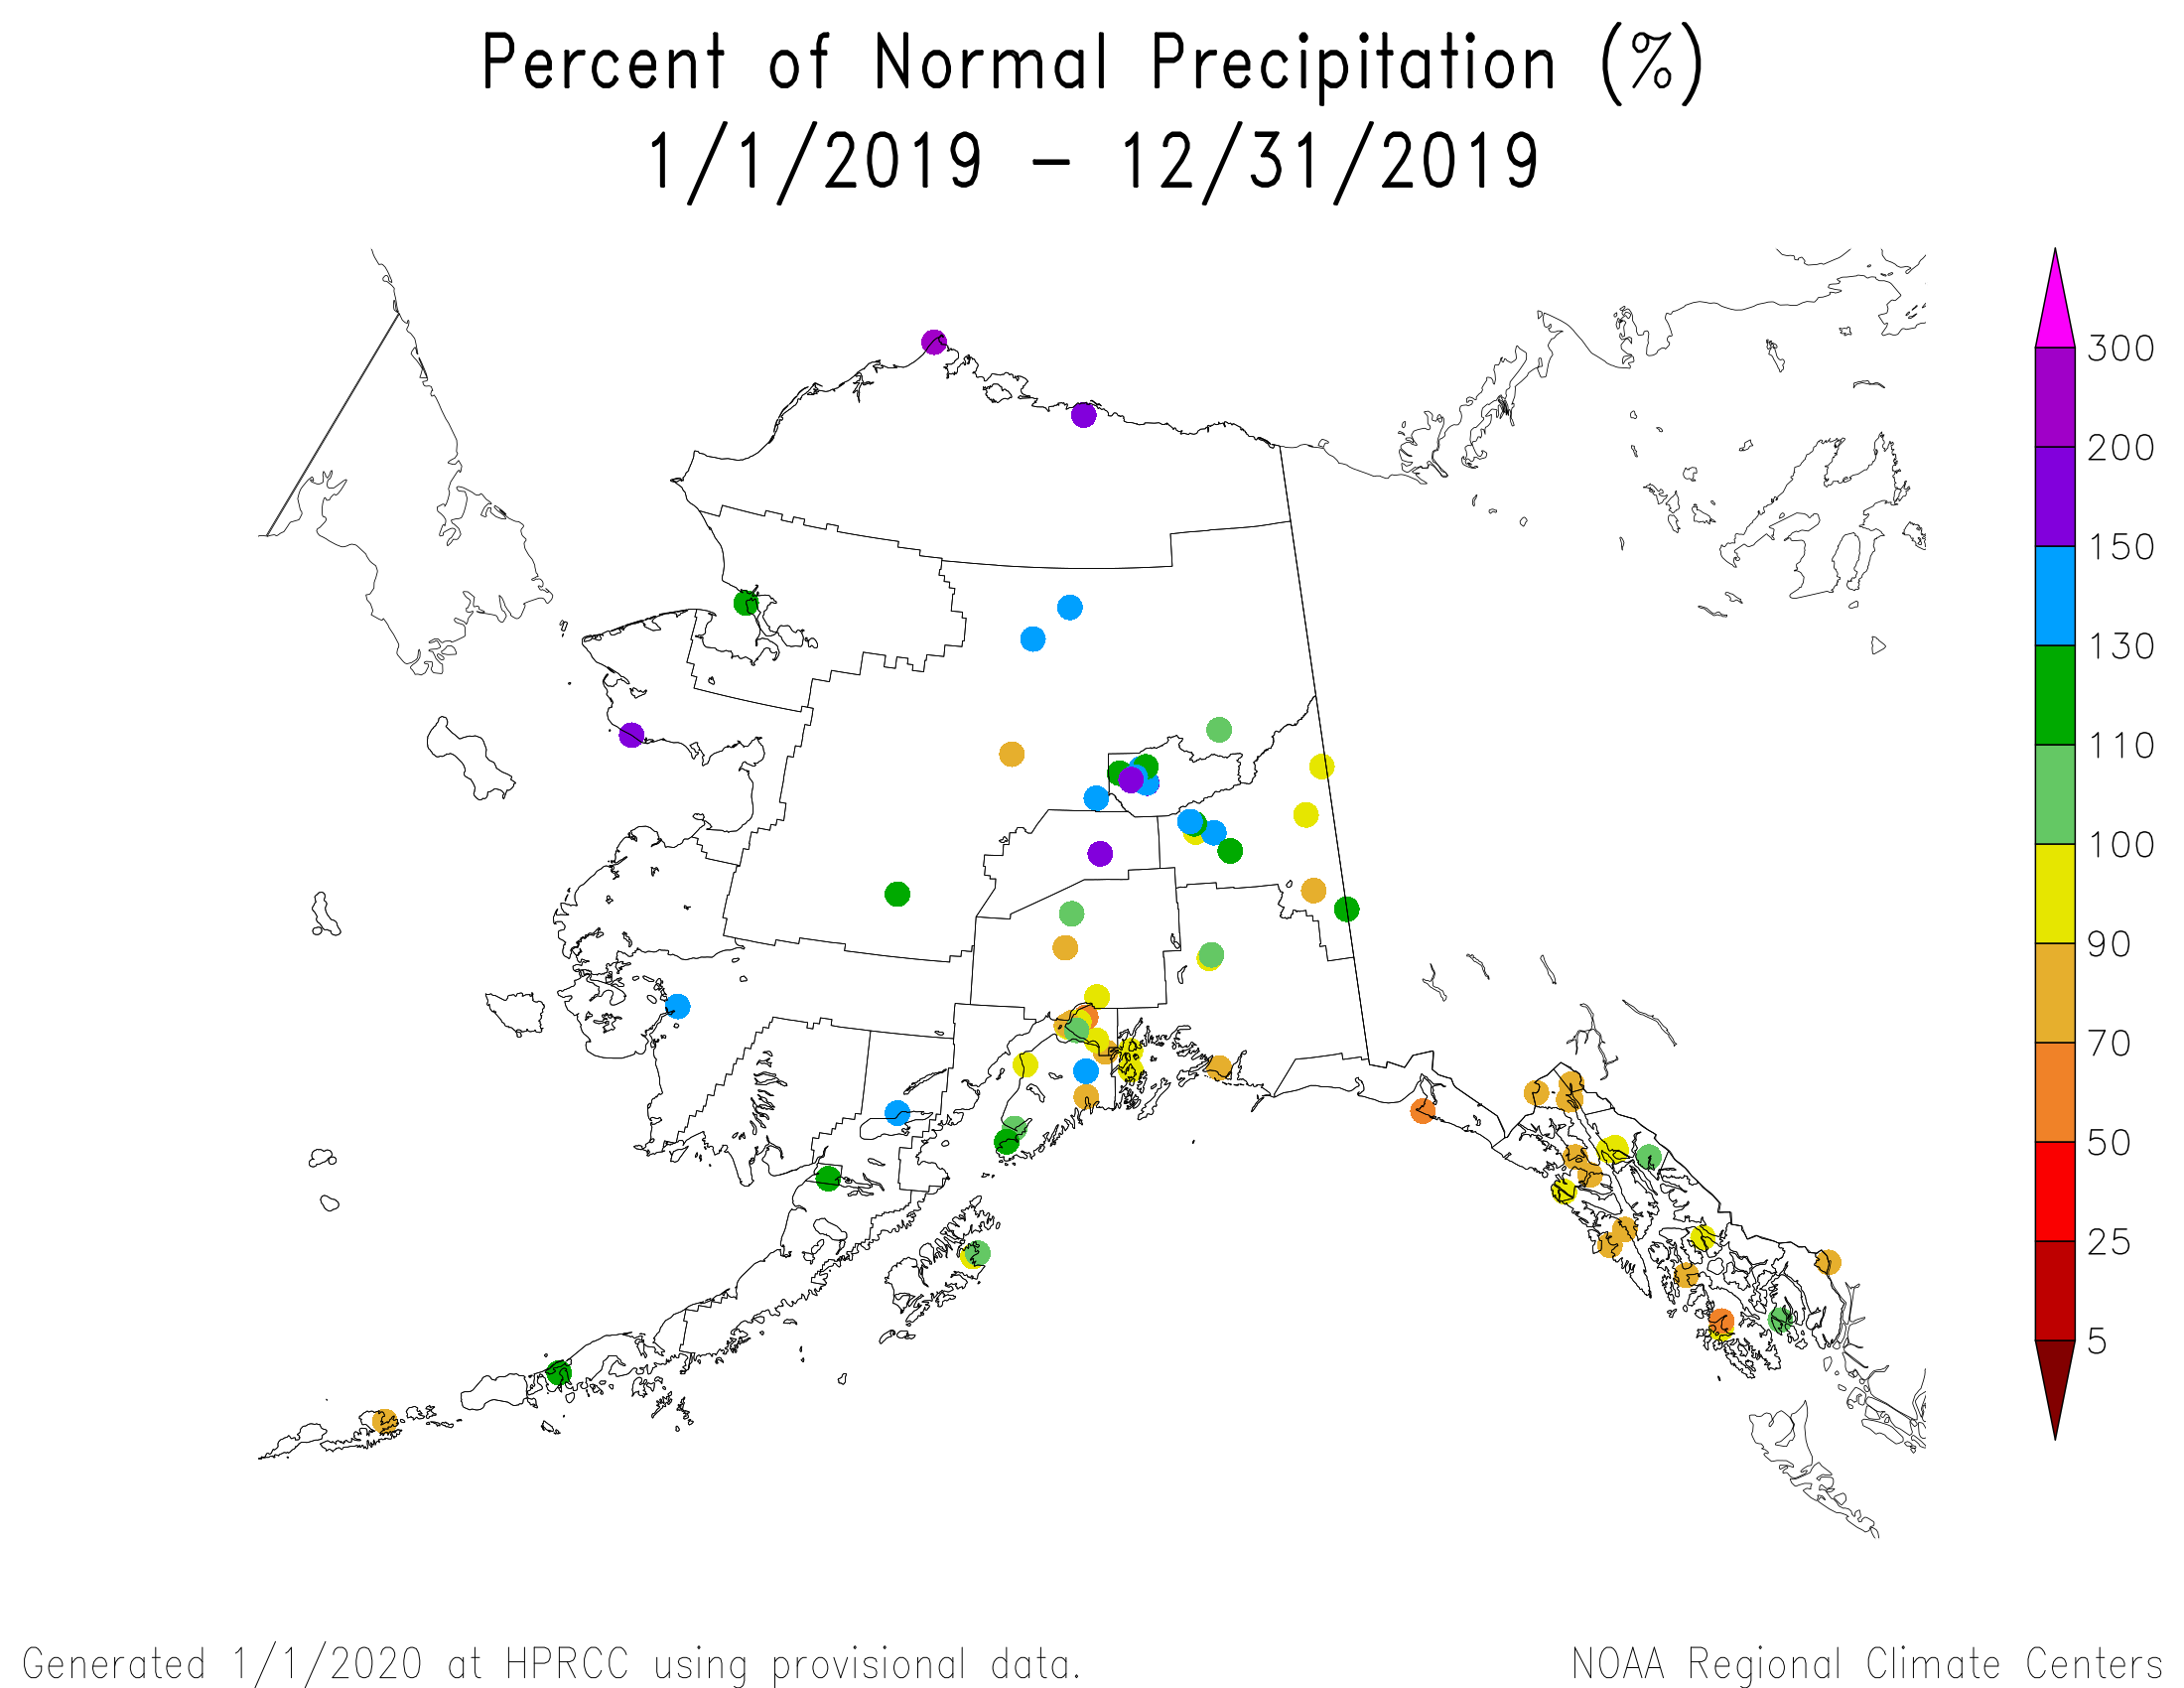
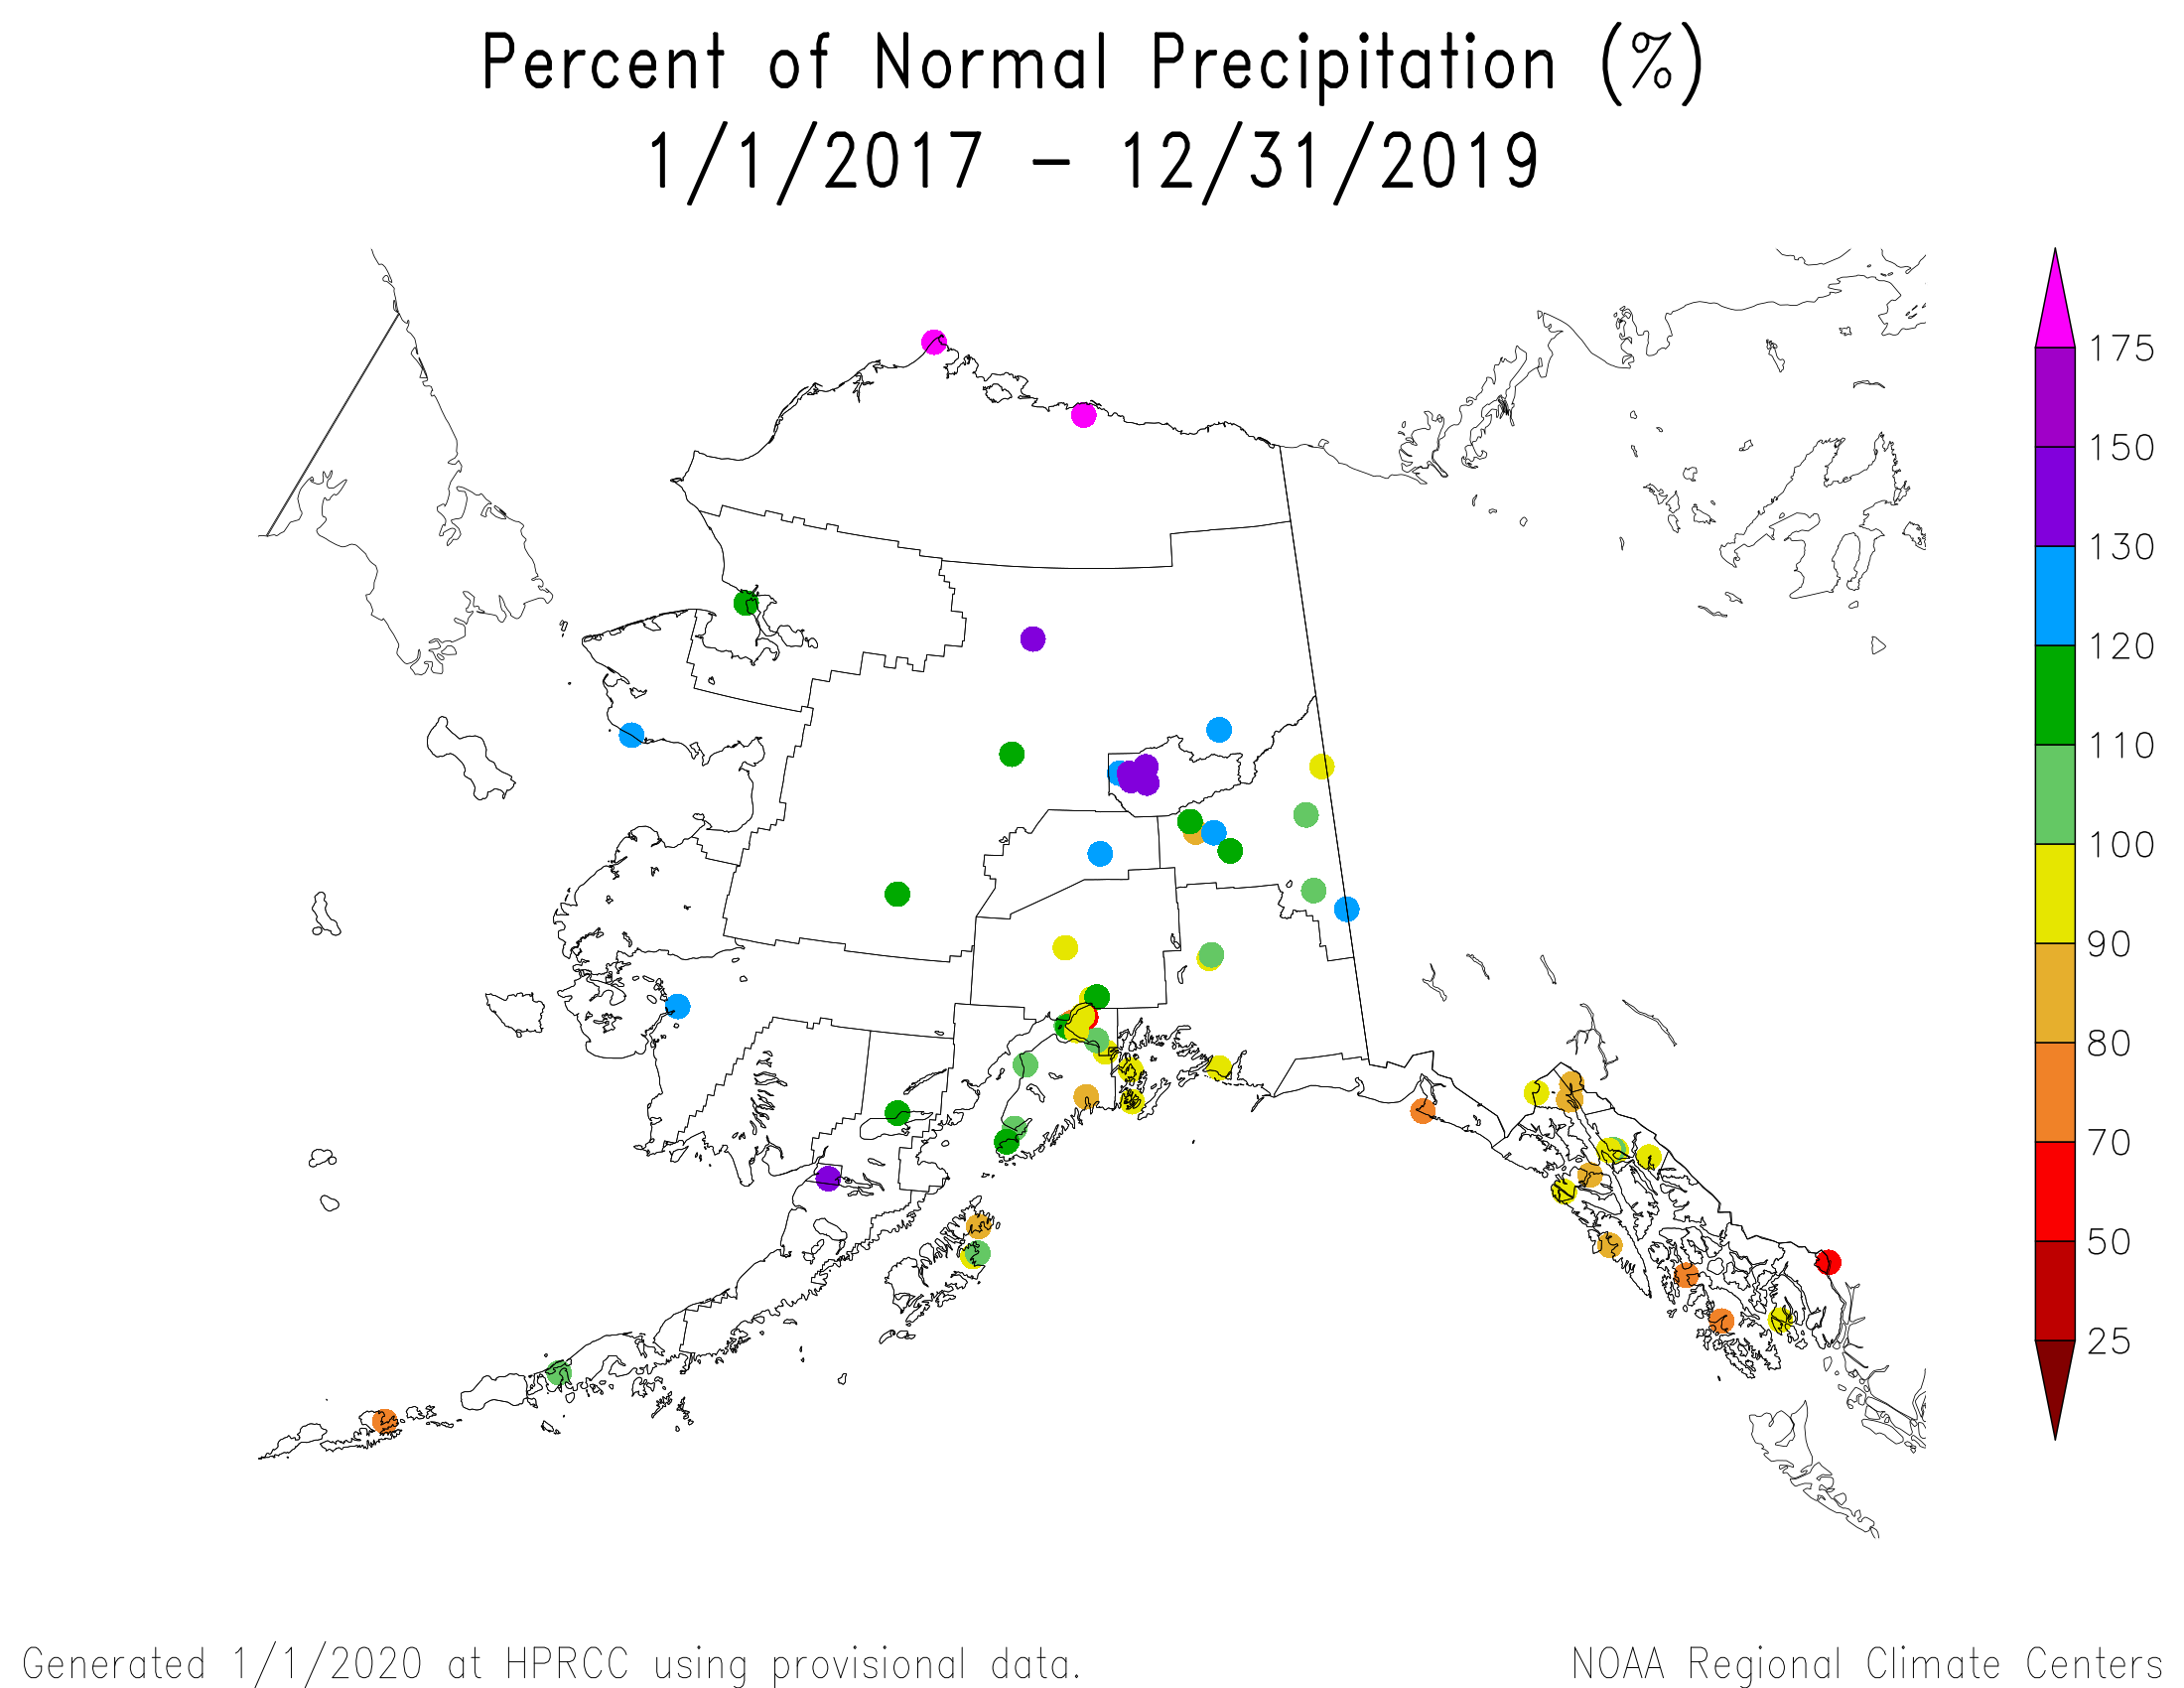
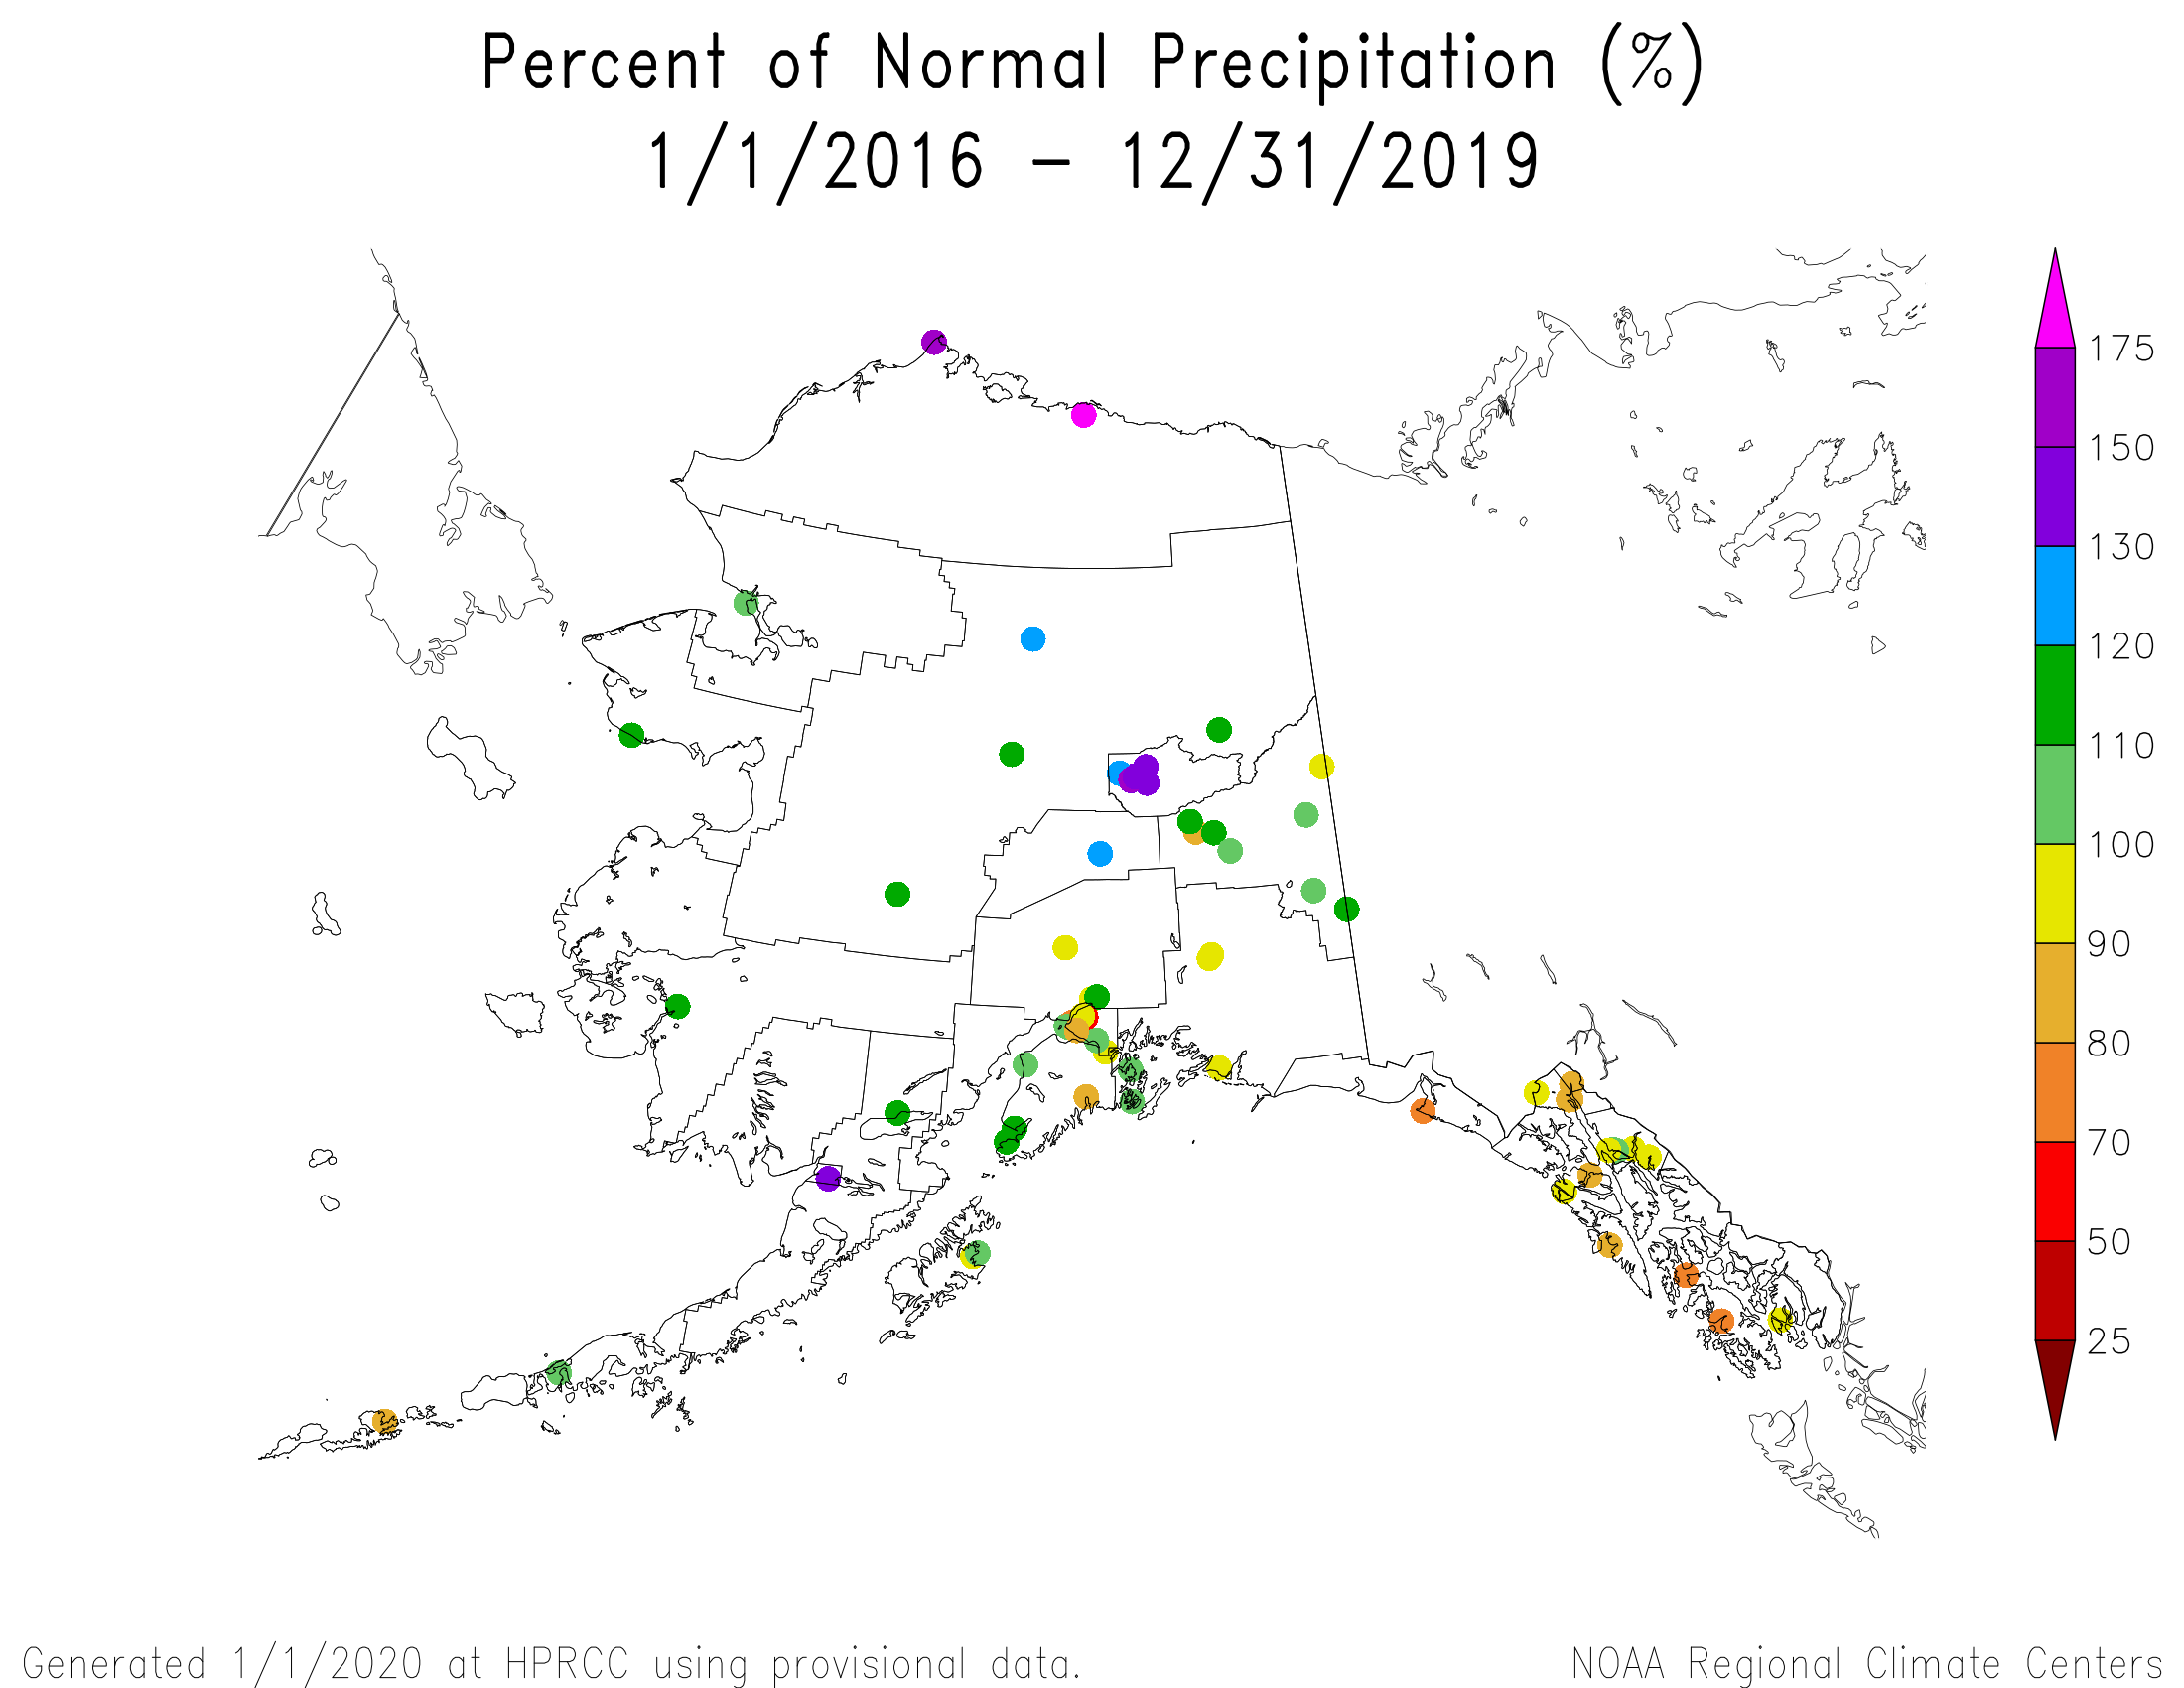
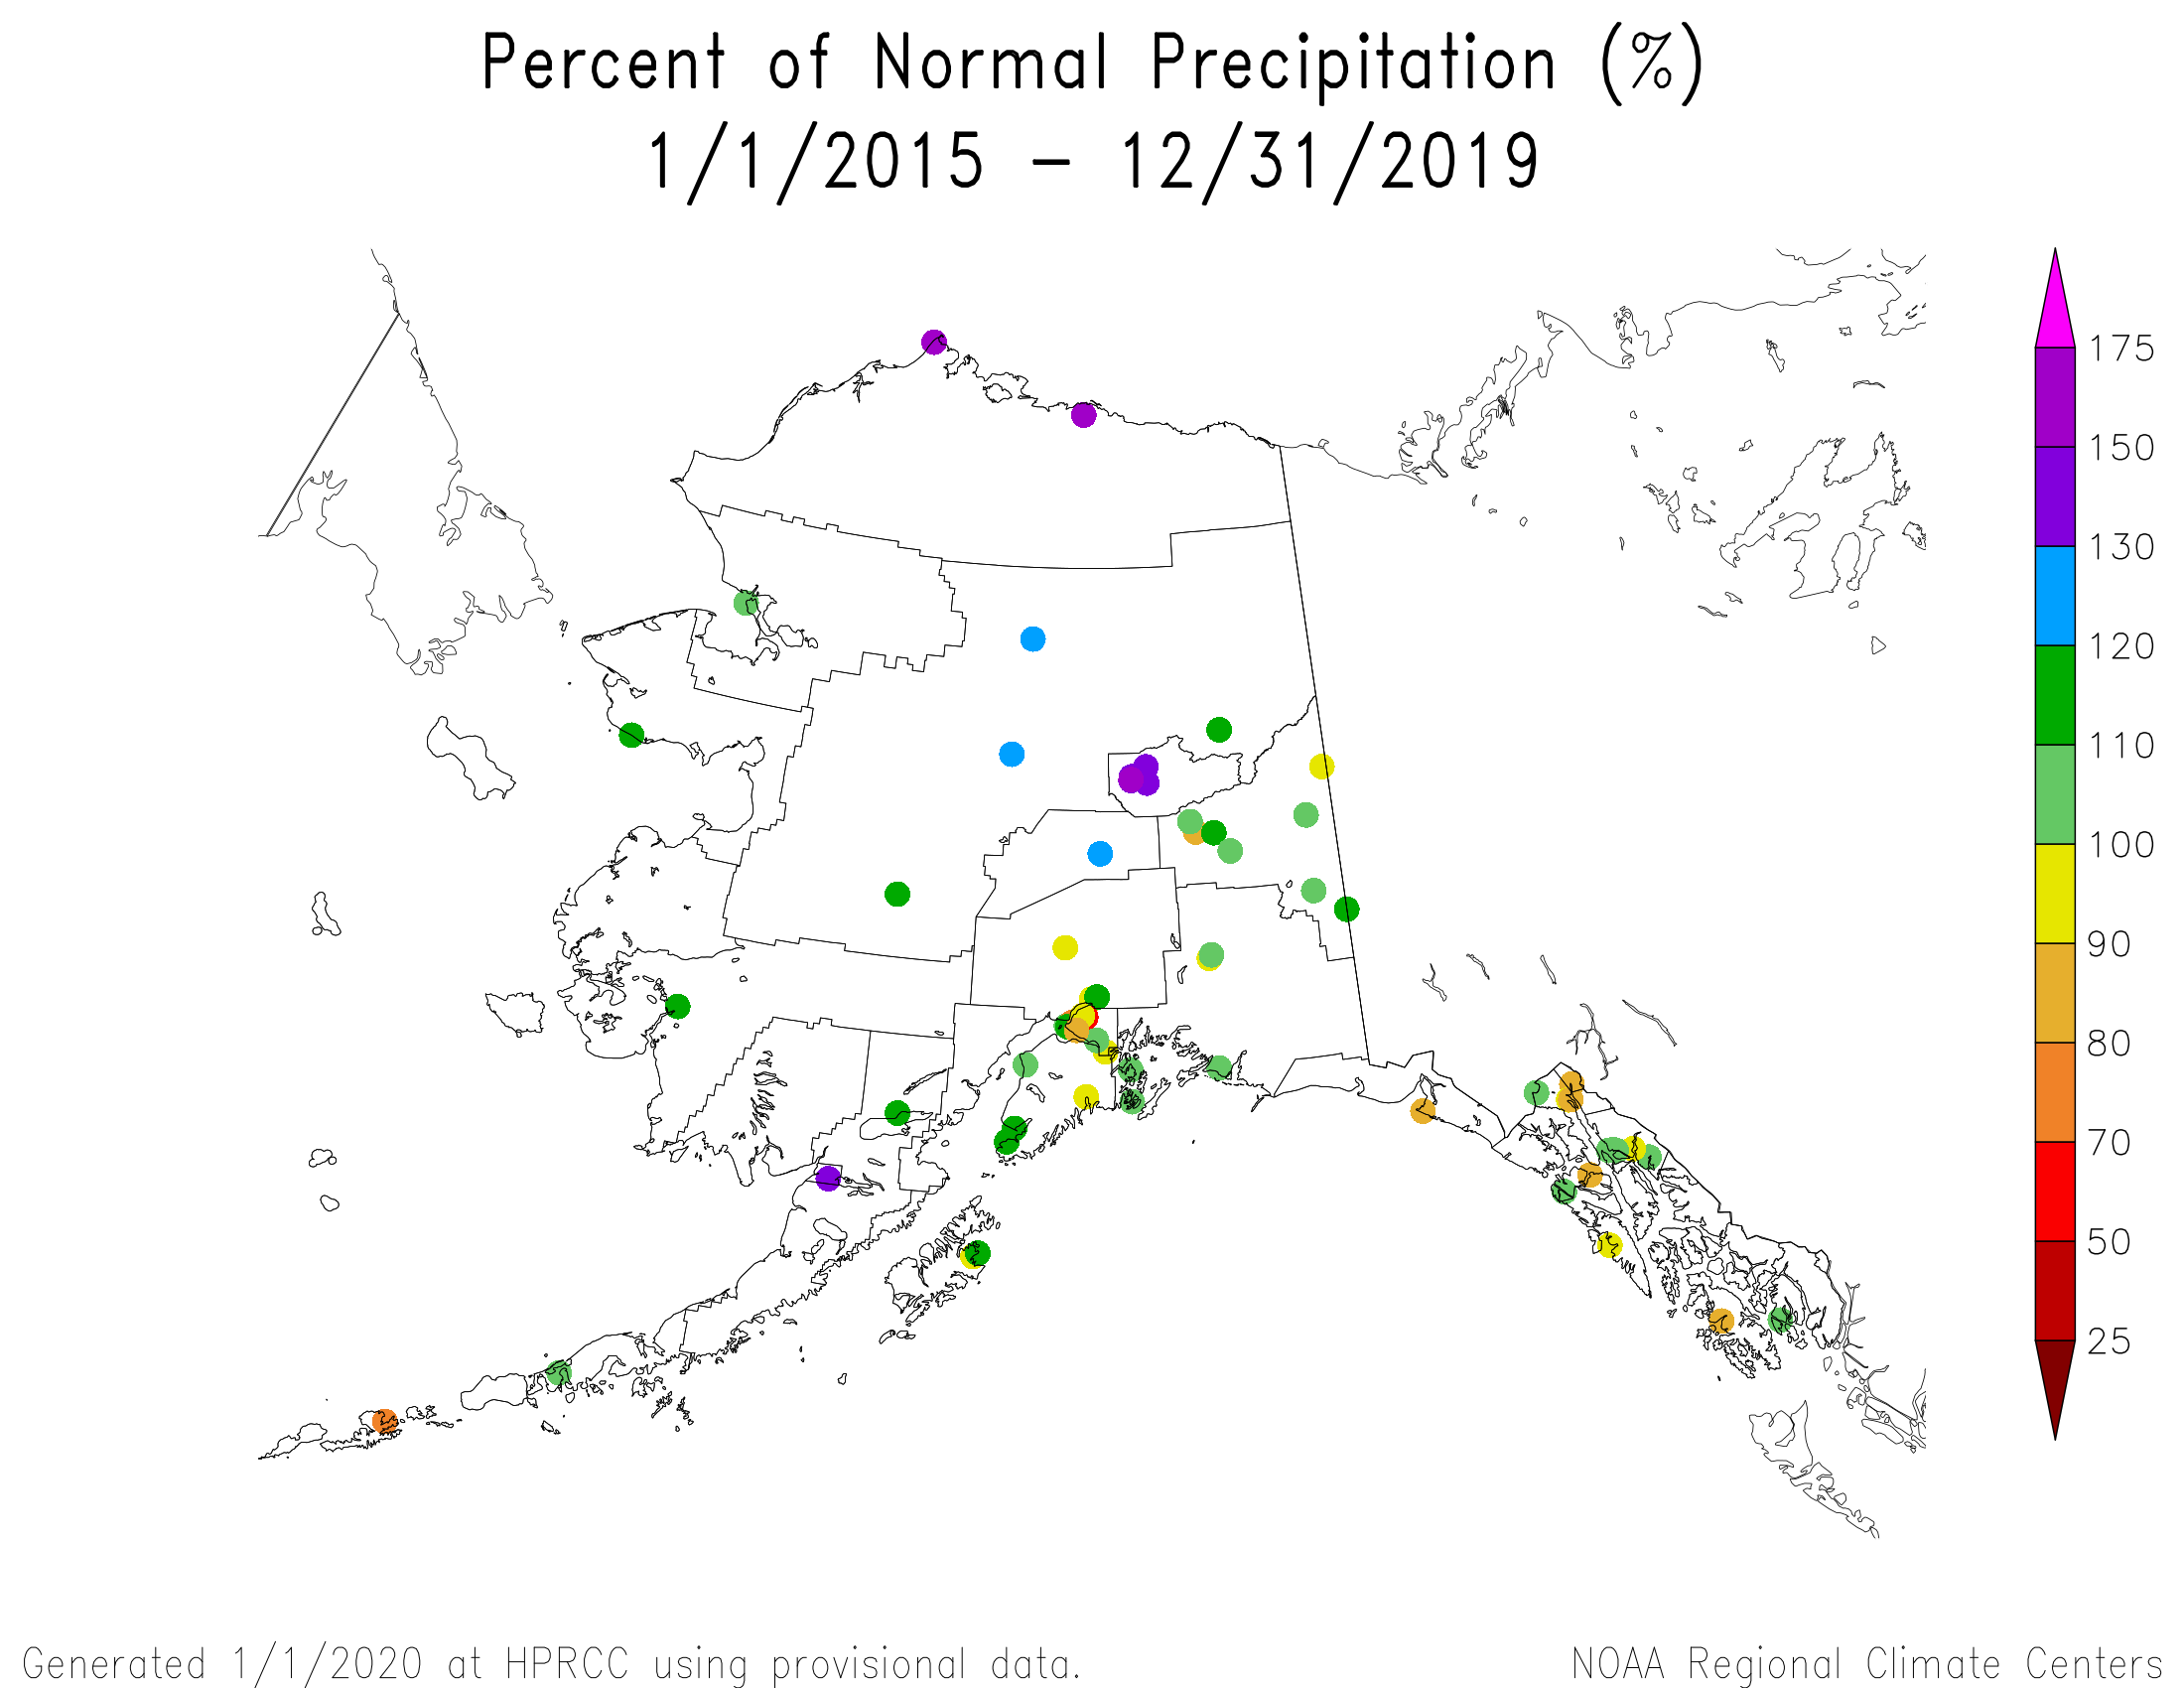
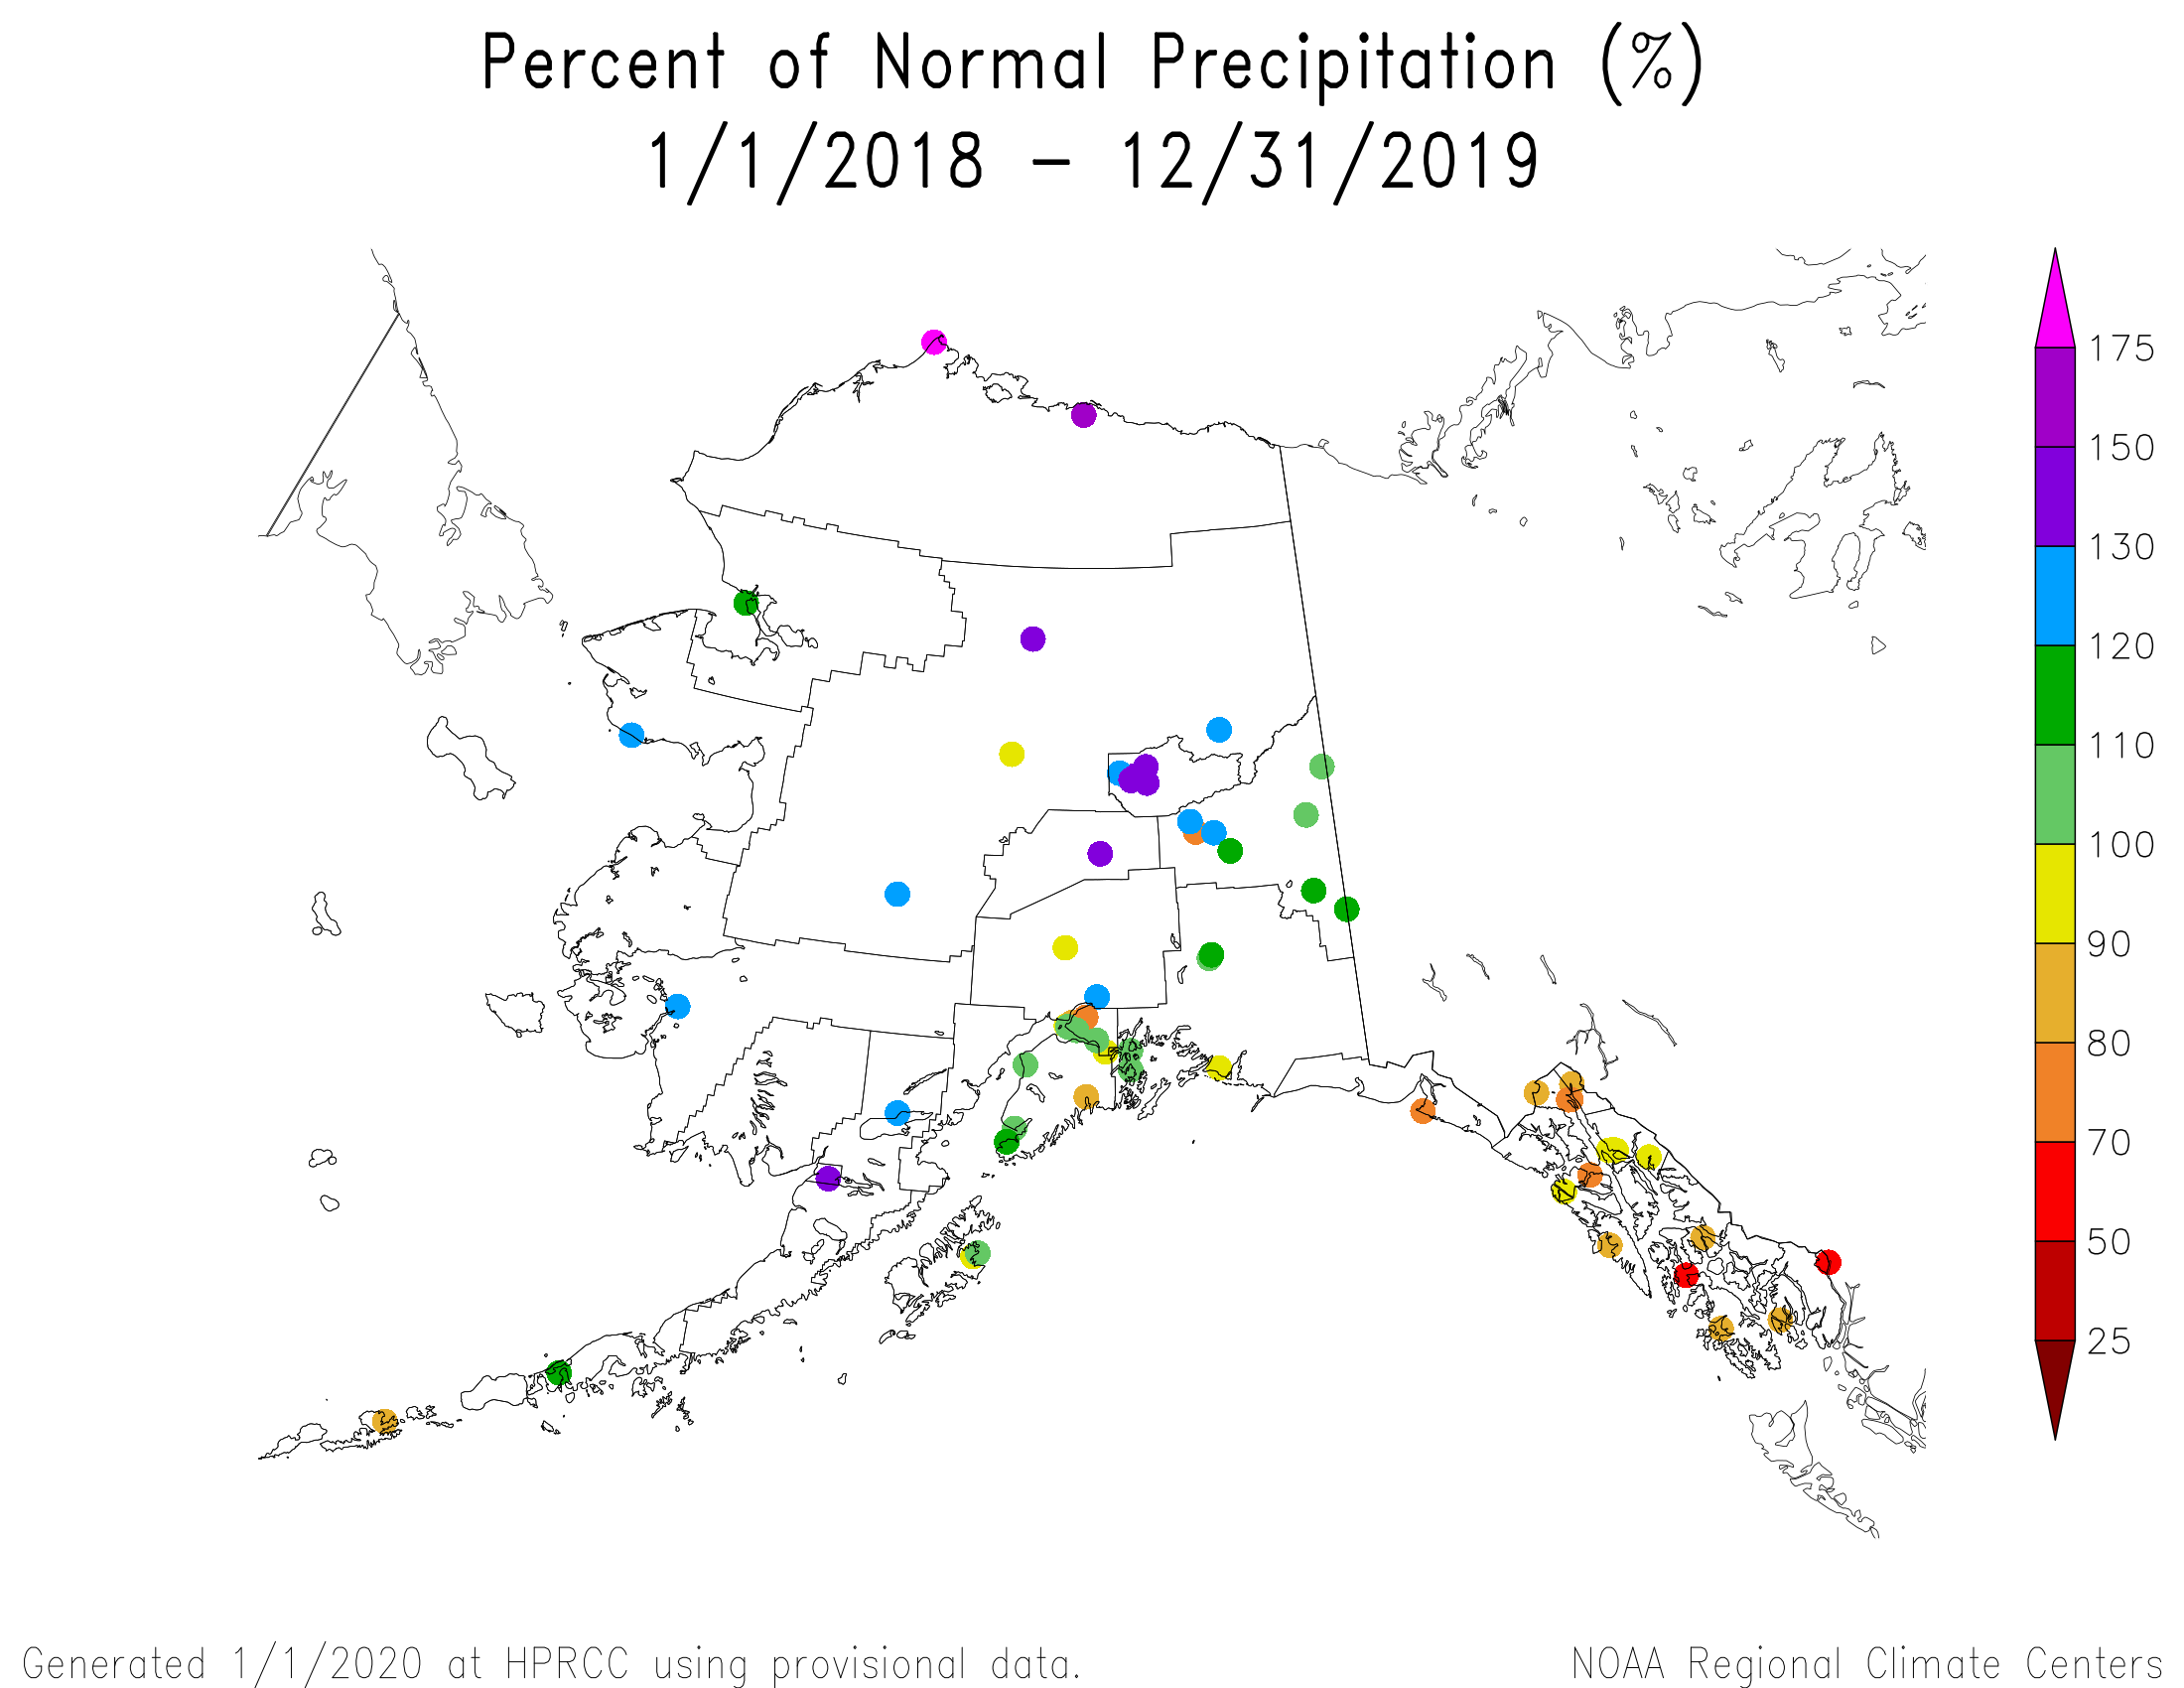 Alaska 24-month percent of normal precipitation map, January 2018-December 2019.
|
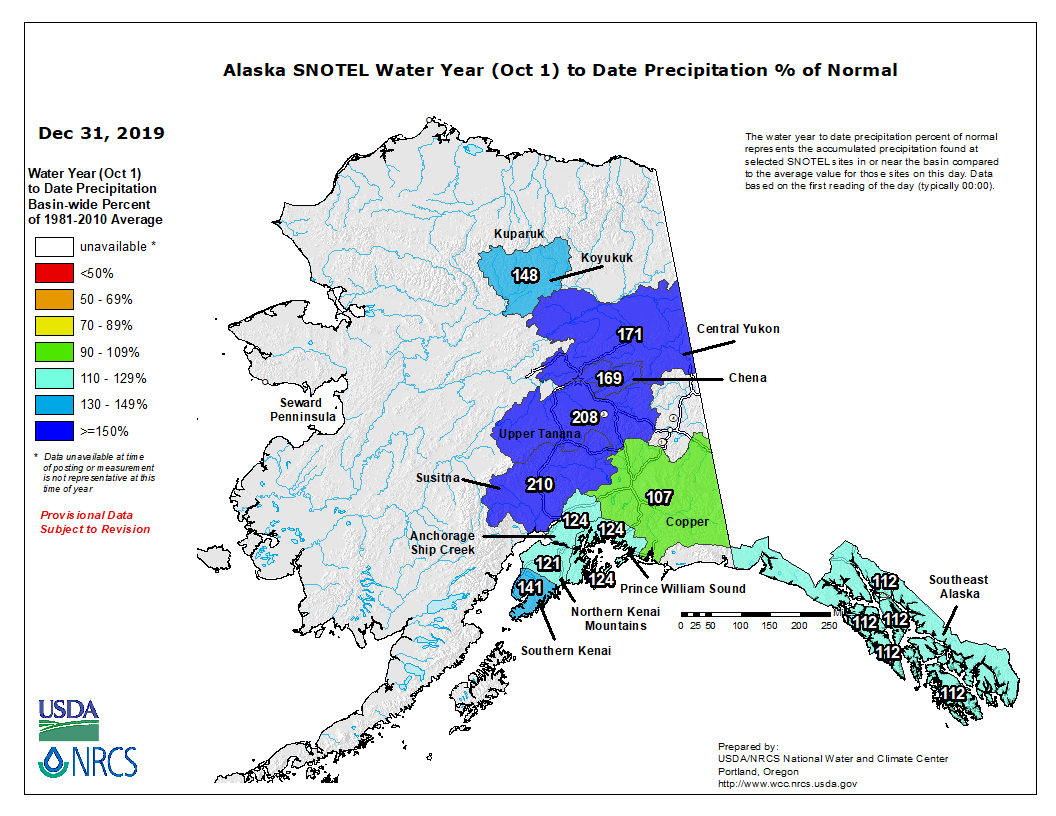
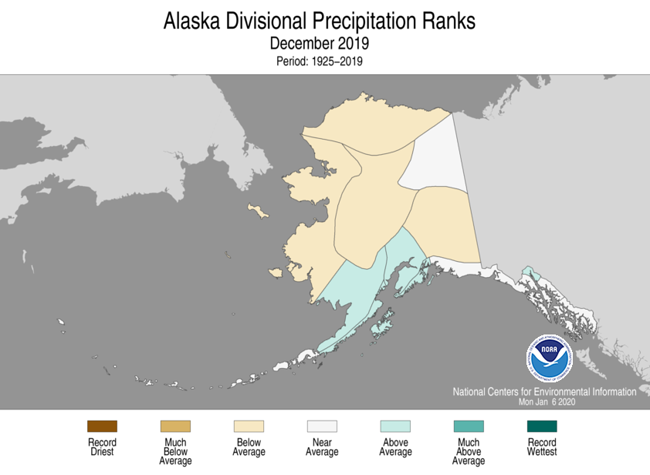
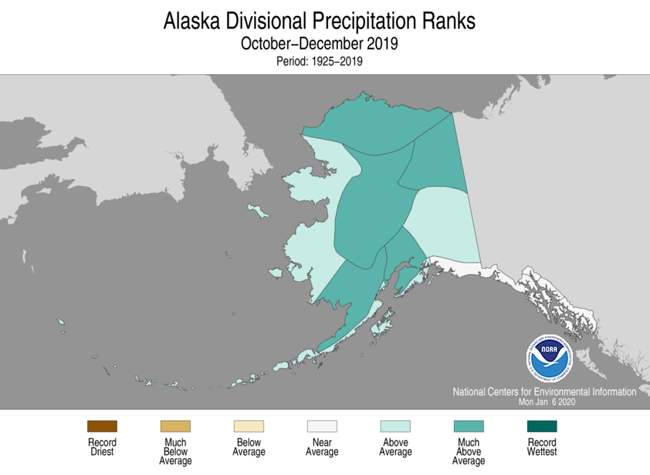
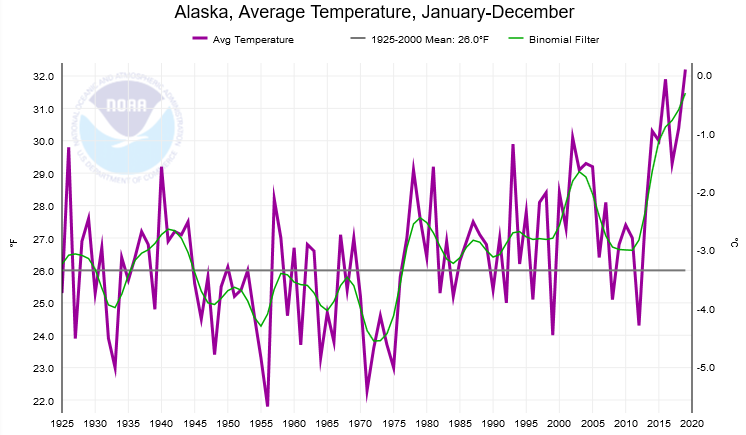
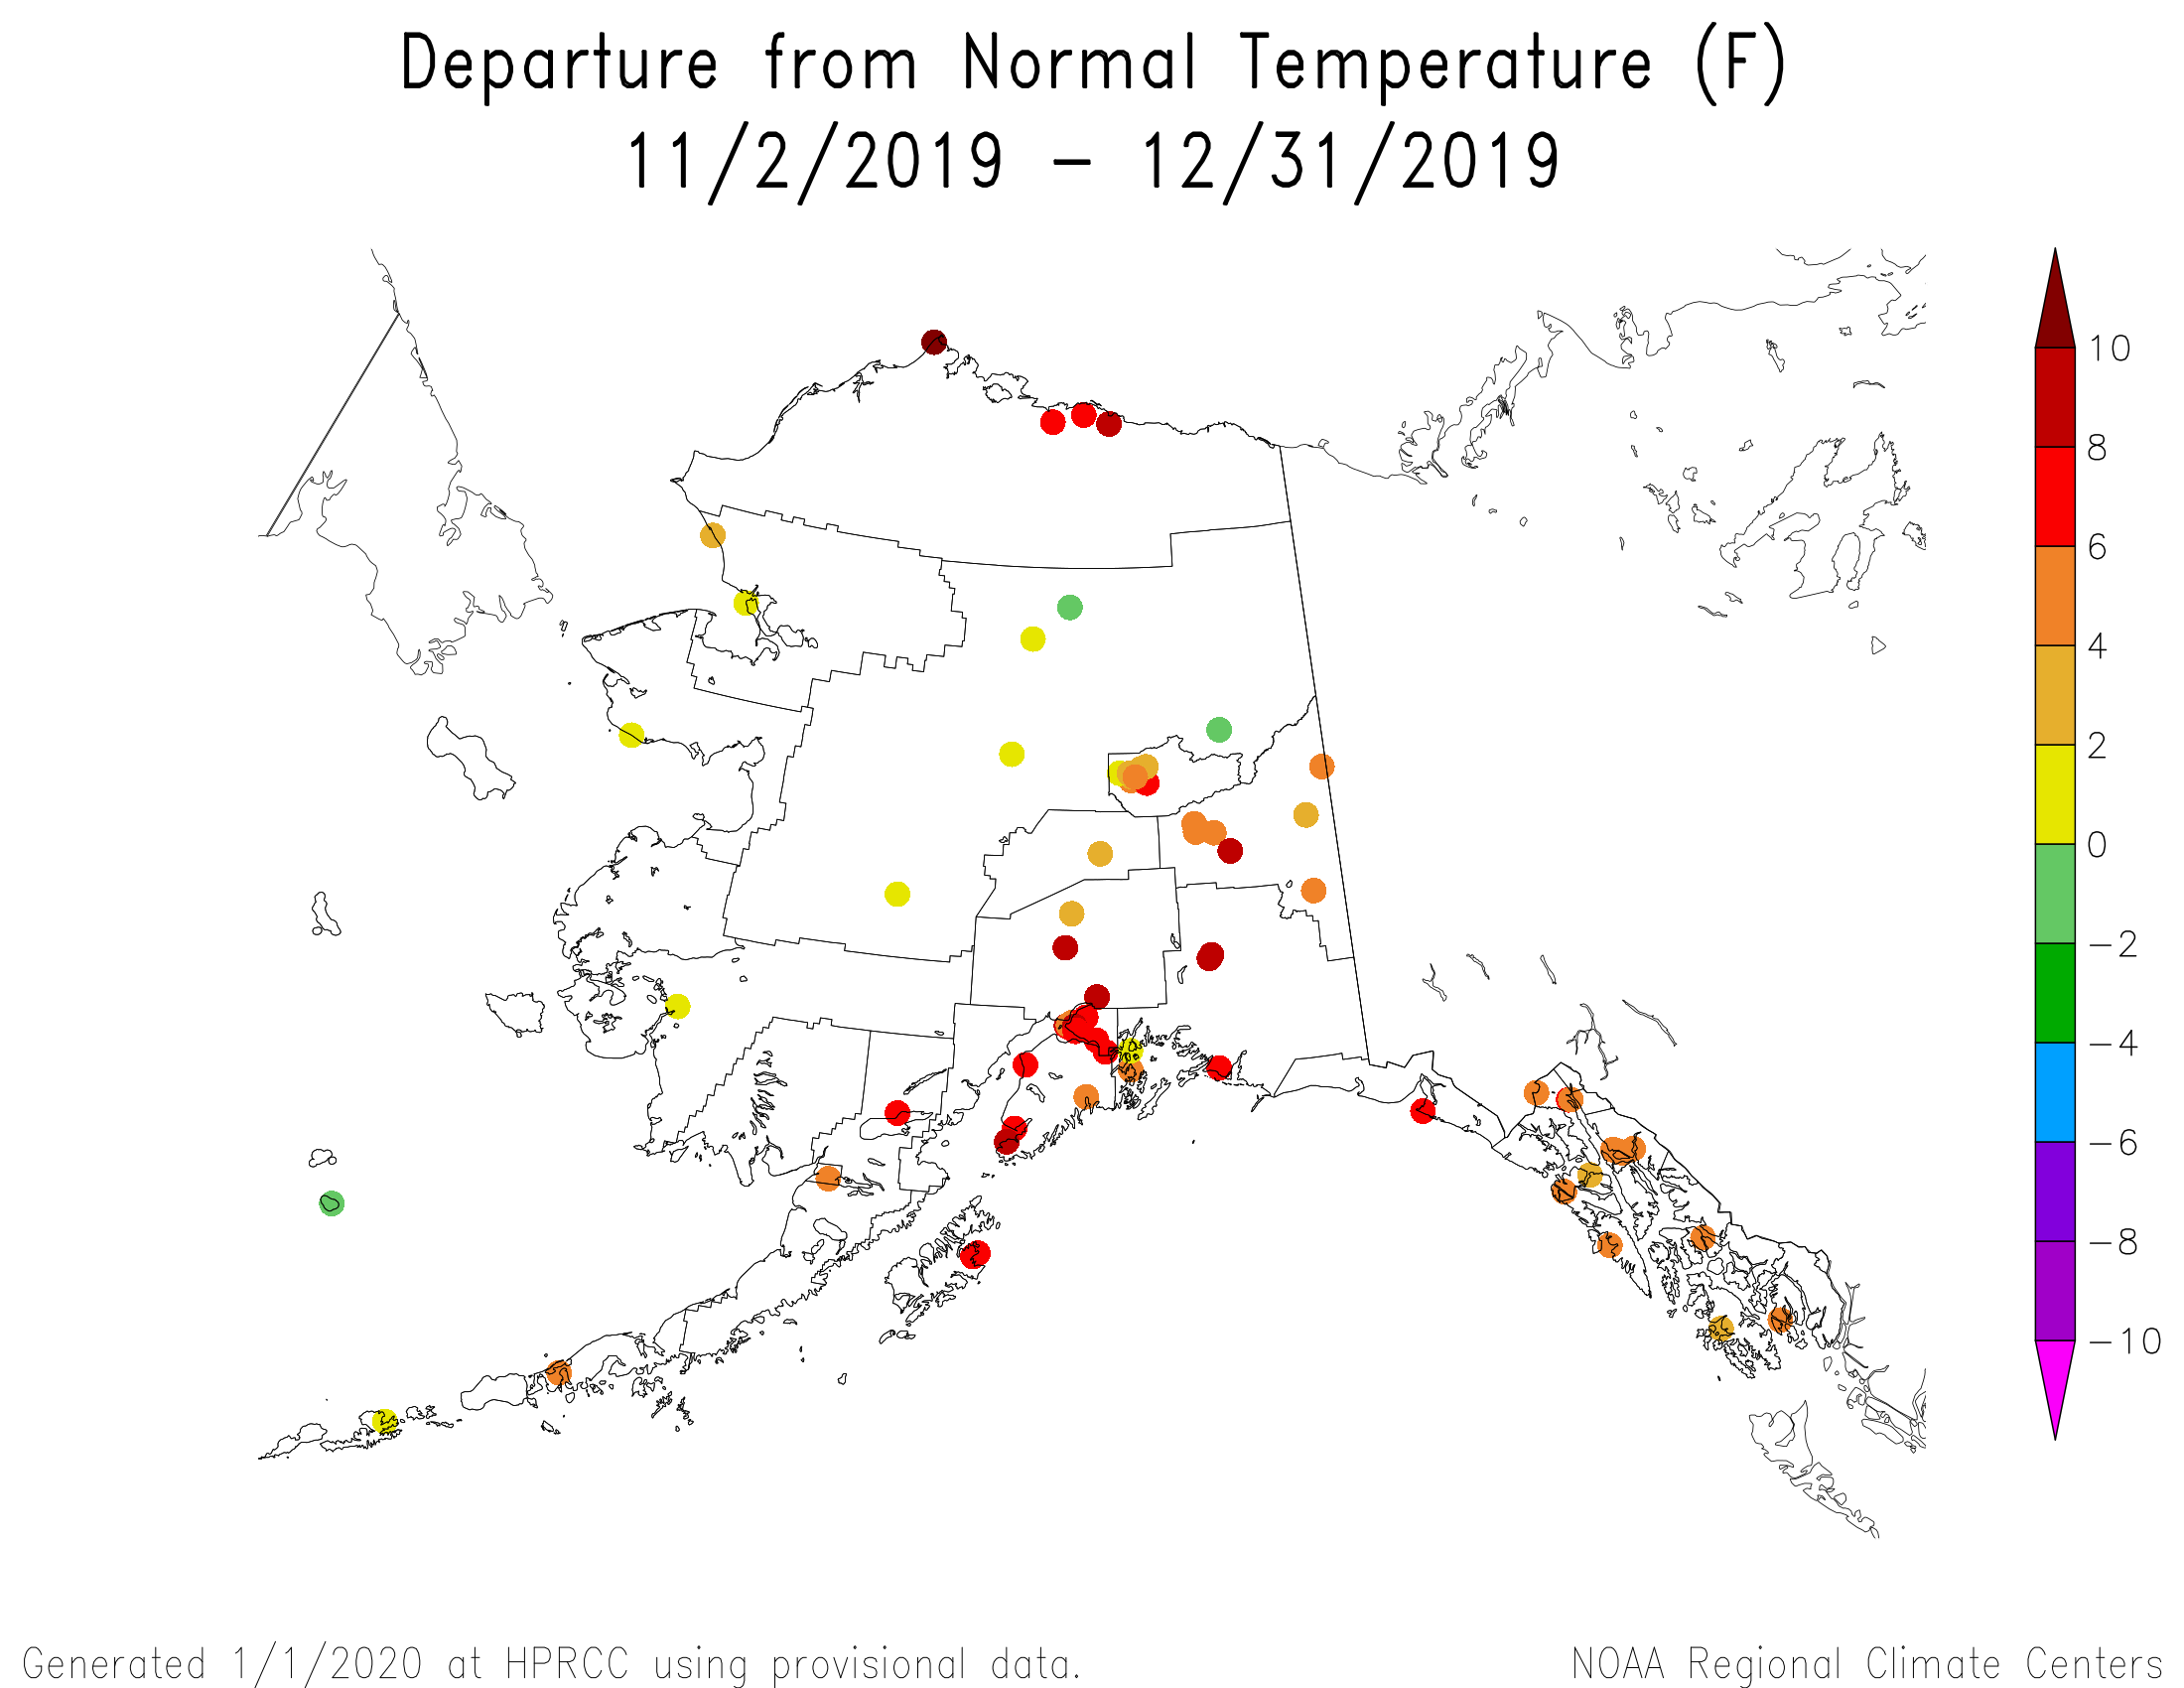
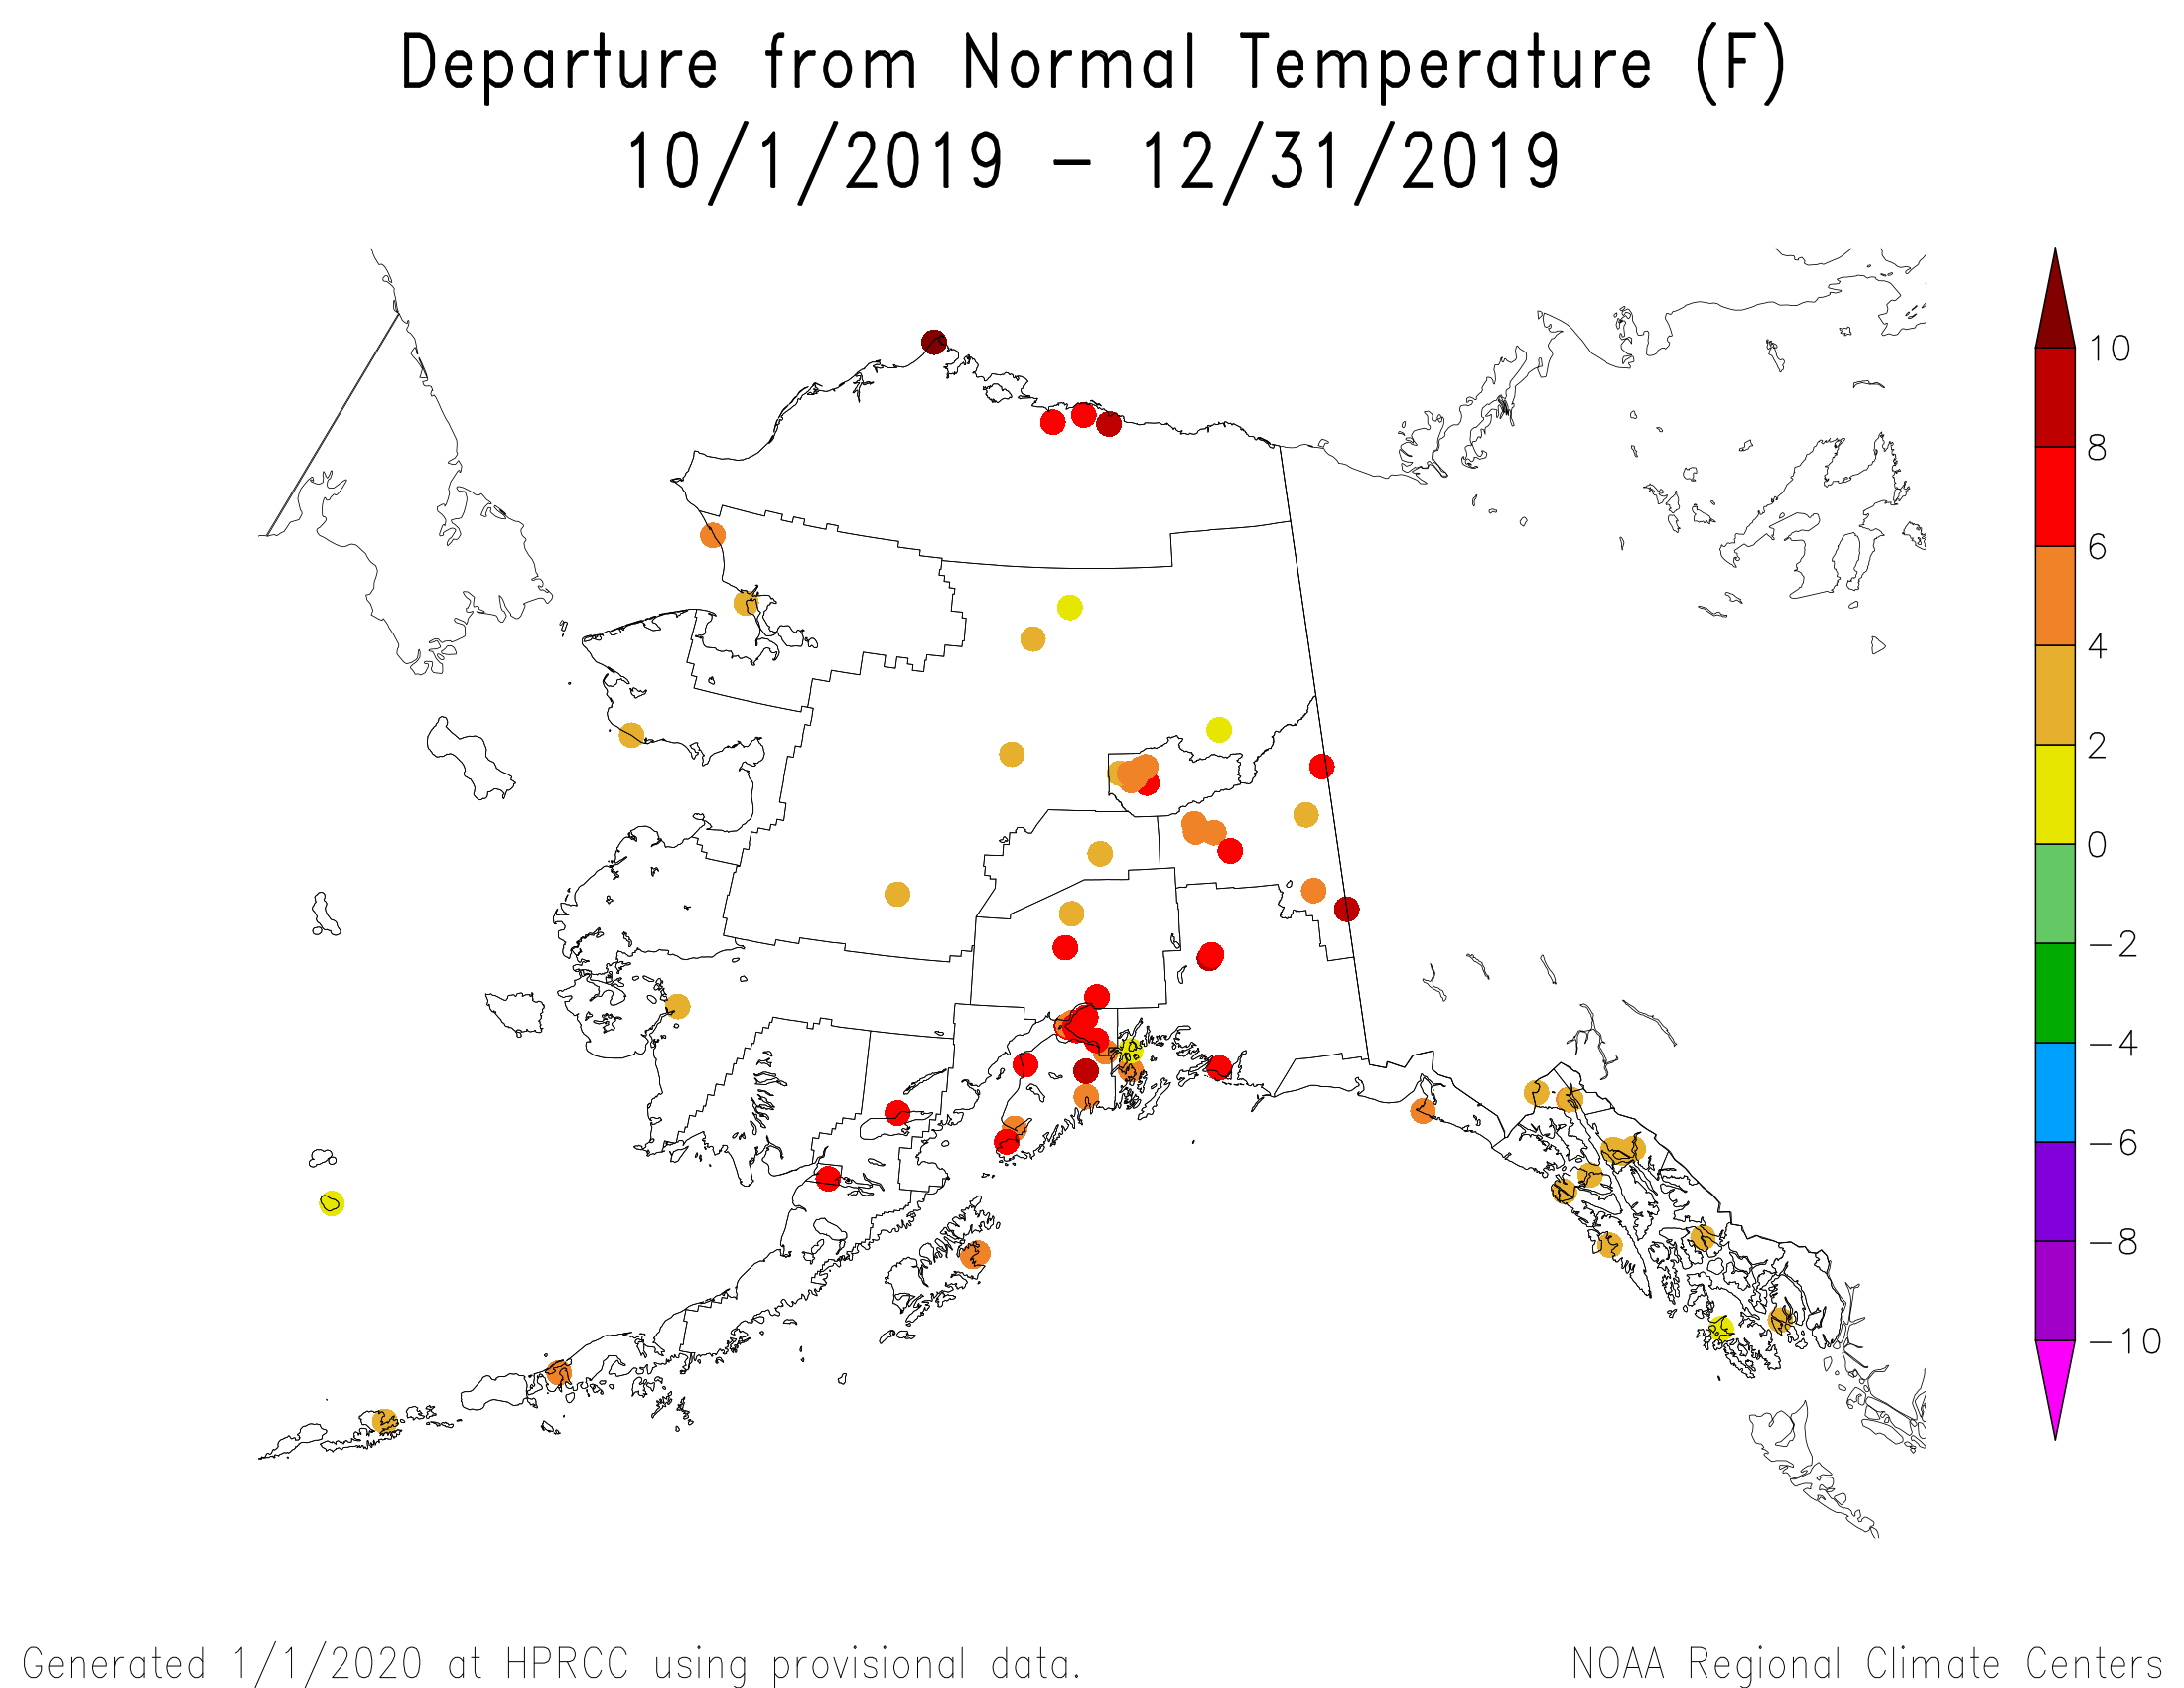
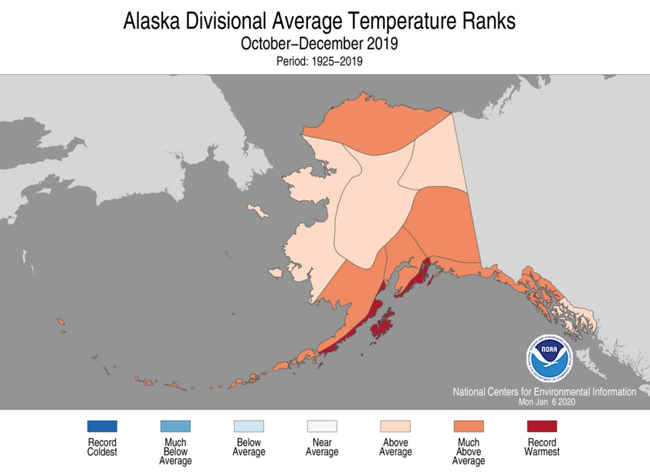
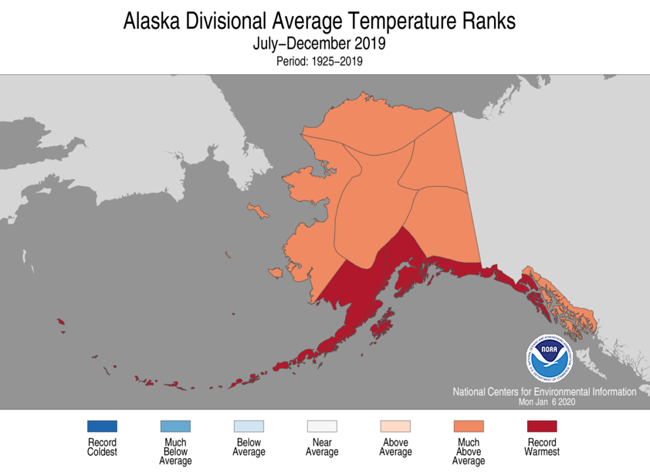
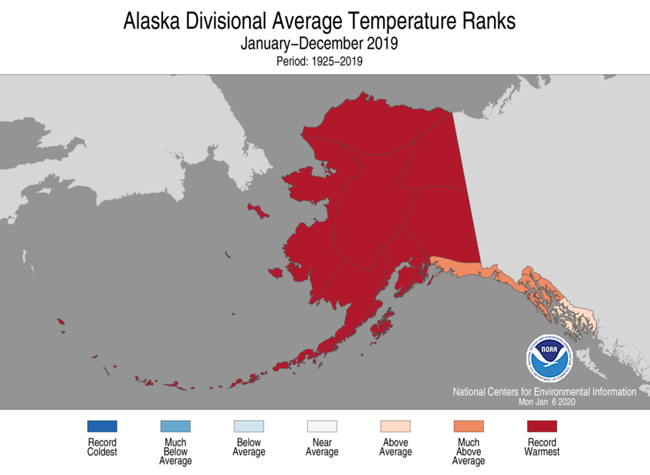
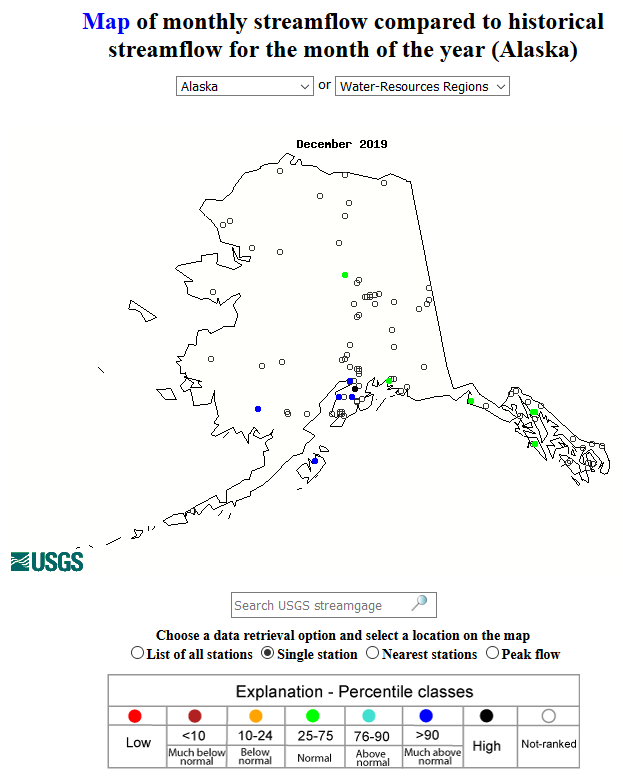
December 2019 was wetter than normal across the southern coast of Alaska and drier than normal to the north. Wetter-than-normal conditions dominate much of the state from the 2- to 6-month time scales, but drier-than-normal conditions become dominate along the south central coast to panhandle, especially the panhandle, at longer time scales (low elevation station precipitation anomaly maps for the last 1, 2, 3, 4, 6, 9, 12, 24, 36, 48, 60 months) (high elevation SNOTEL basin map for last 3 months) (gridded precipitation percentile maps for the last 1, 3, 12 months) (climate division precipitation rank maps for the last 1, 3, 6, 12 months) (Leaky Bucket model precipitation percentile map). Temperatures during December were warmer than normal along the southern and northern coasts and cooler than normal in the interior locations. Warmer-than-normal temperatures dominate statewide at longer time scales, with 2019 ranking as the warmest year for the state in the 1925-2019 record (low elevation station temperature maps for the last 1, 2, 3, 4, 12 months) (gridded temperature percentile maps for the last 1, 3, 12 months) (climate division temperature rank maps for the last 1, 3, 6, 12 months). (Leaky Bucket model temperature percentile map). Snow pack was below average in the southern SNOTEL basins. Streamflow was near to above normal at the unfrozen streams in the south. There was little change on the USDM map compared to last month as abnormally dry and moderate drought conditions continued, with moderate drought covering less then one percent of the state.
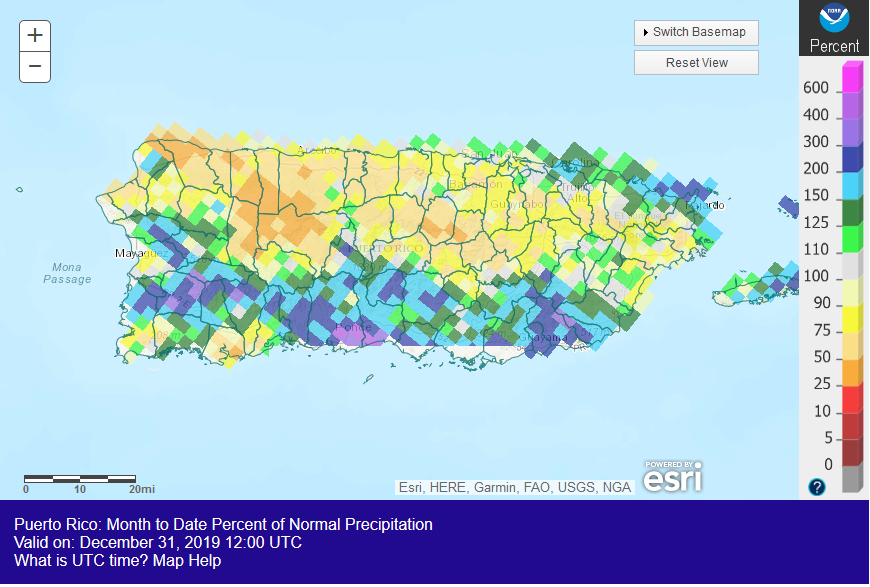
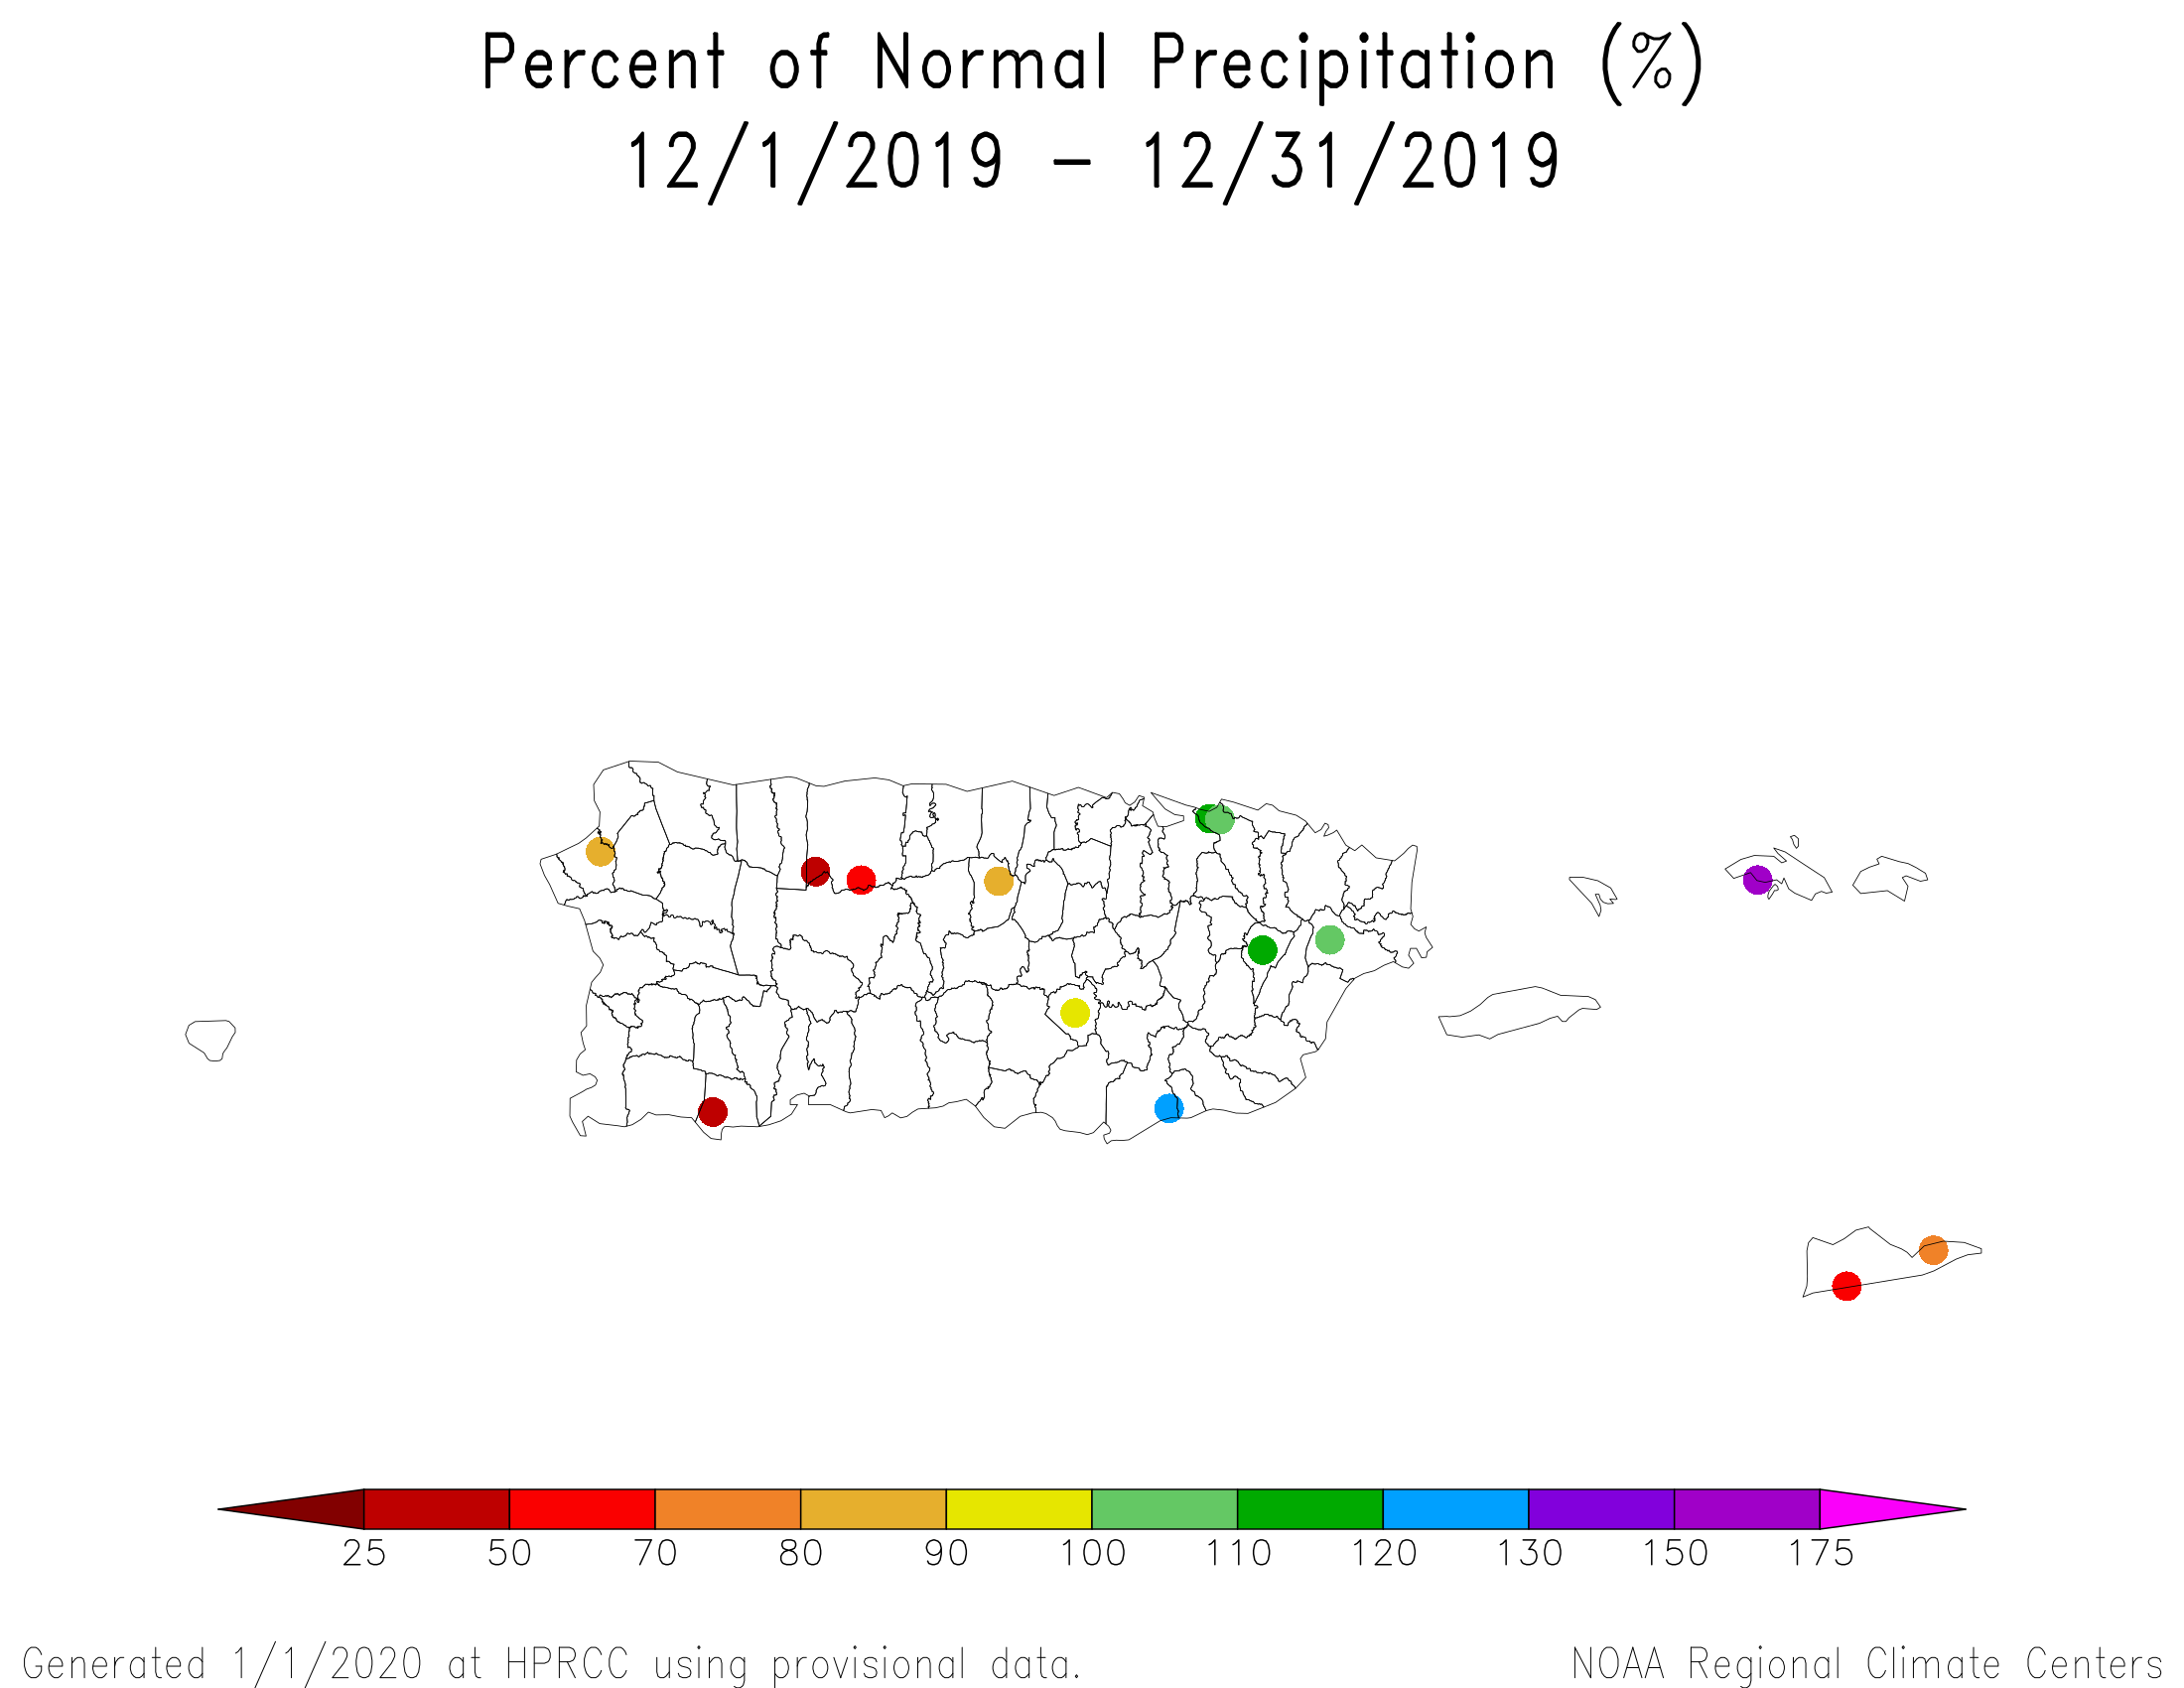
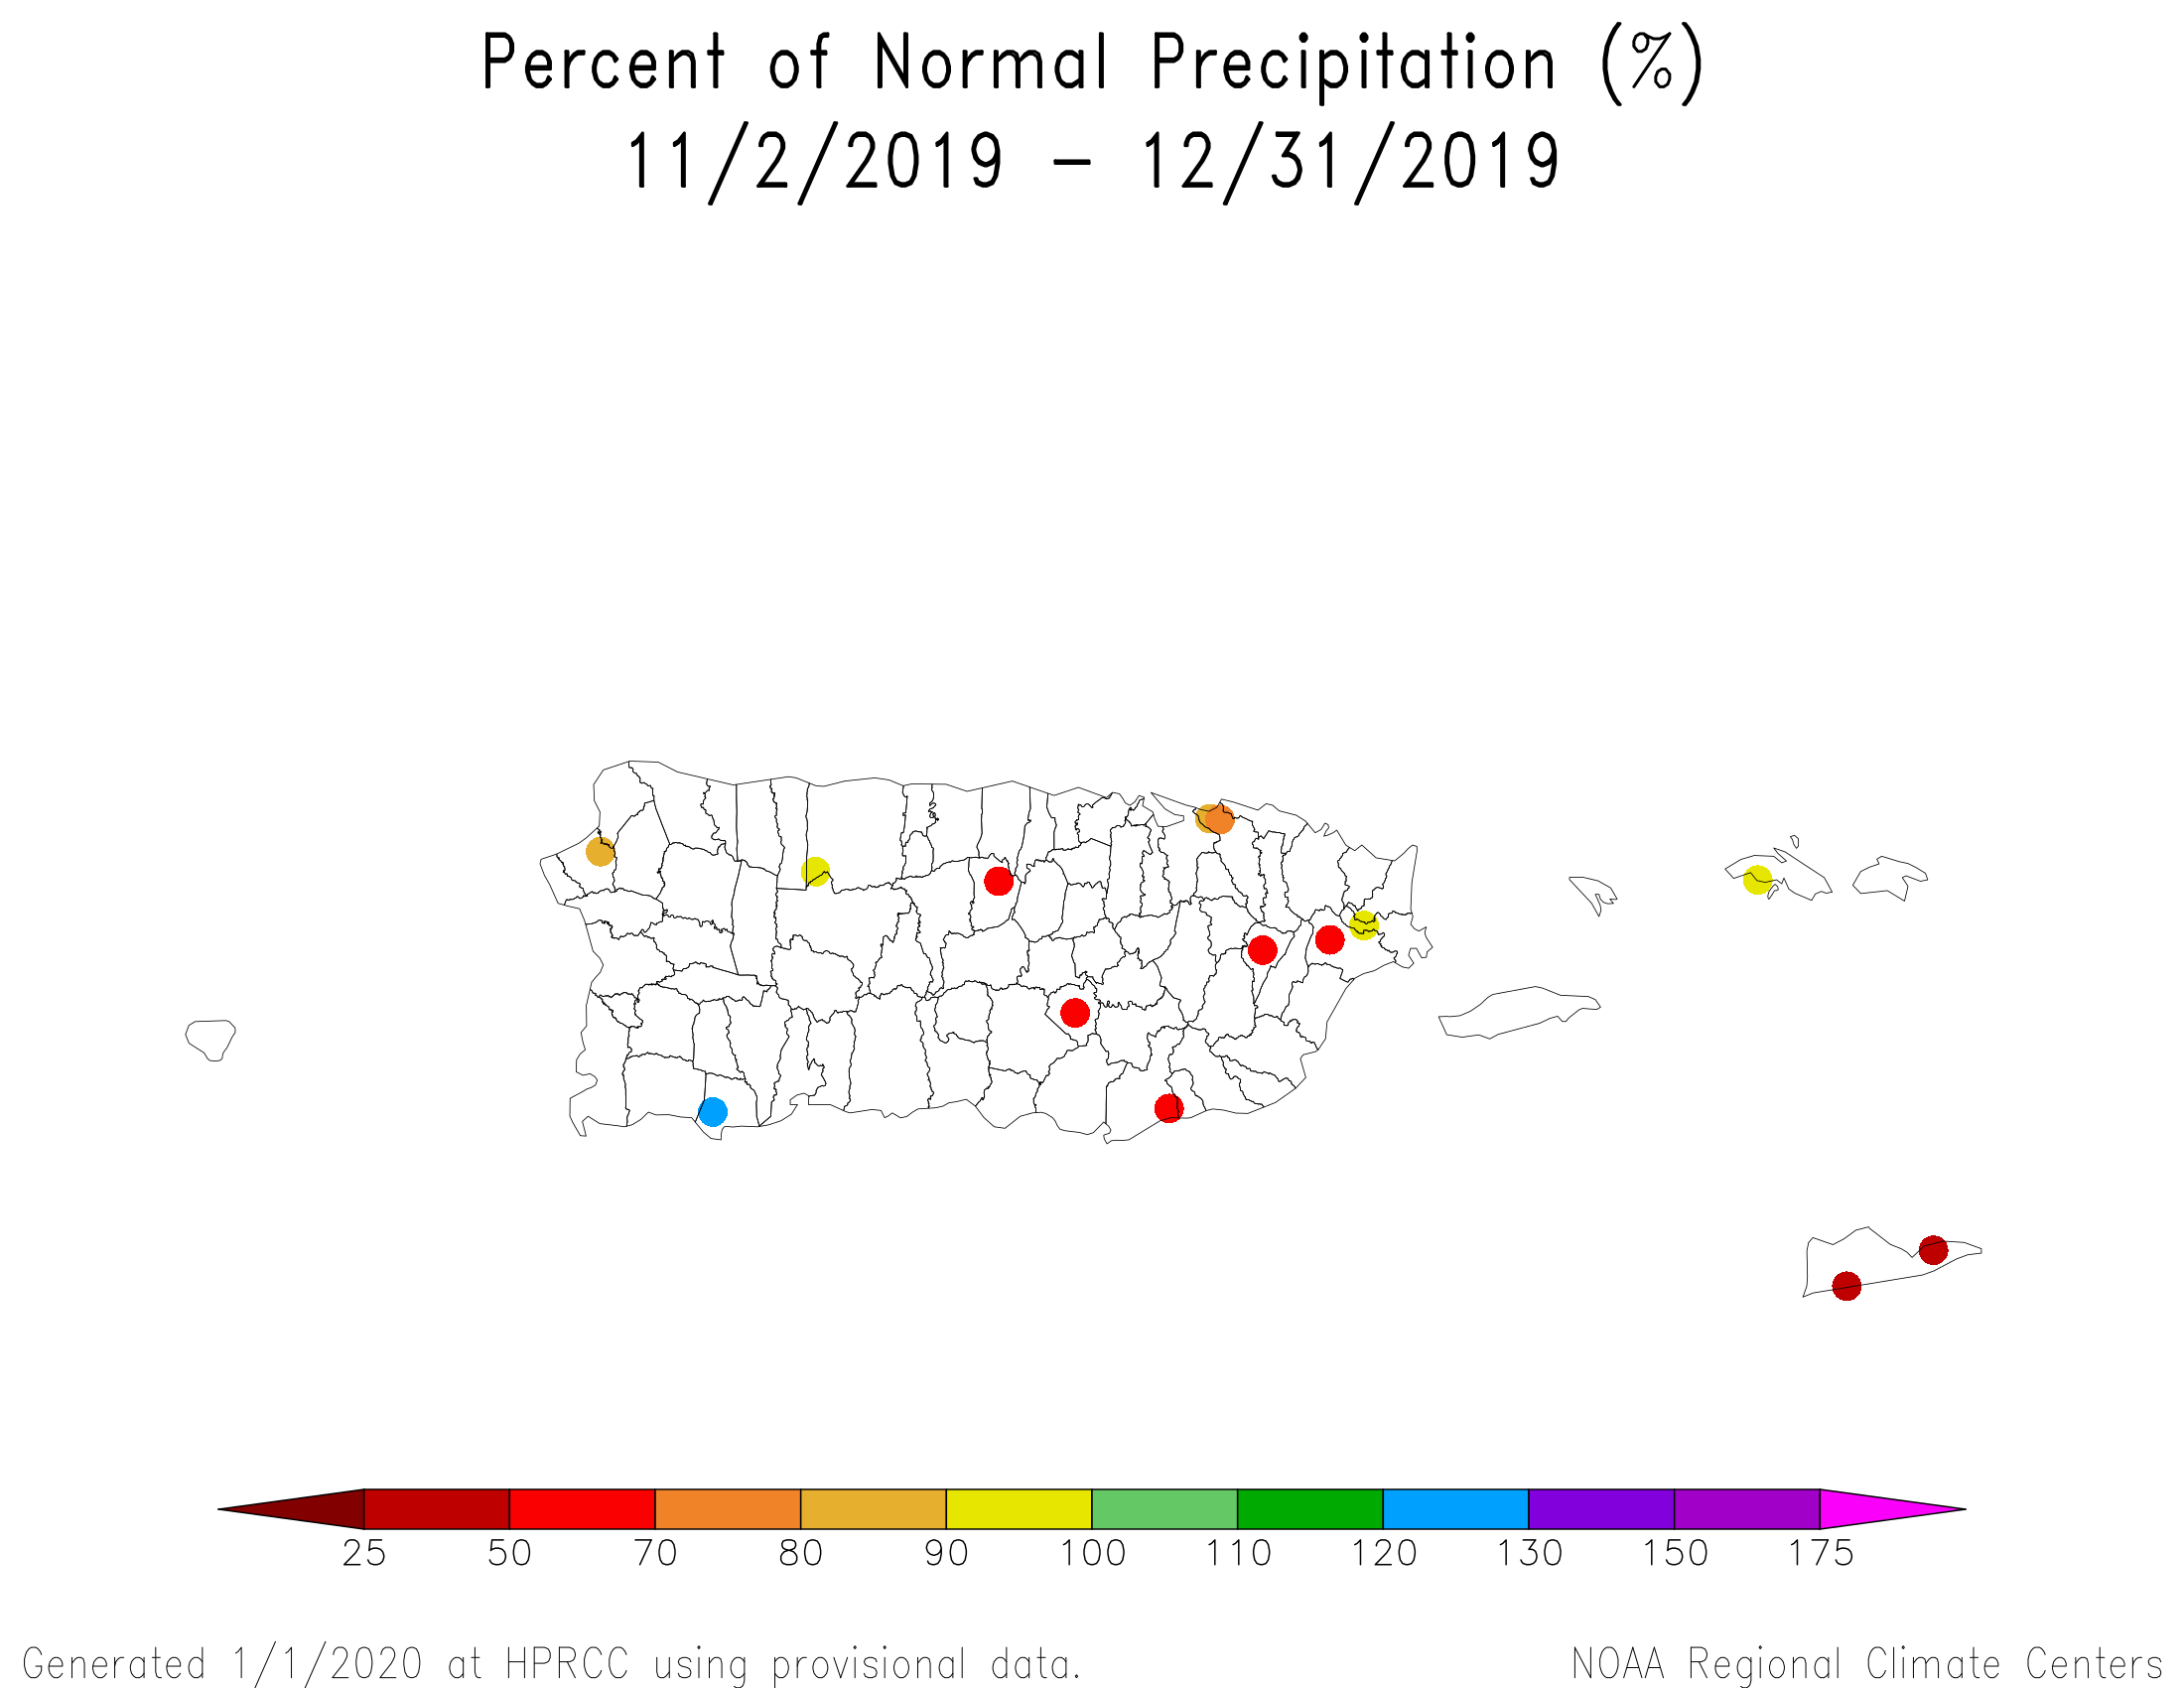
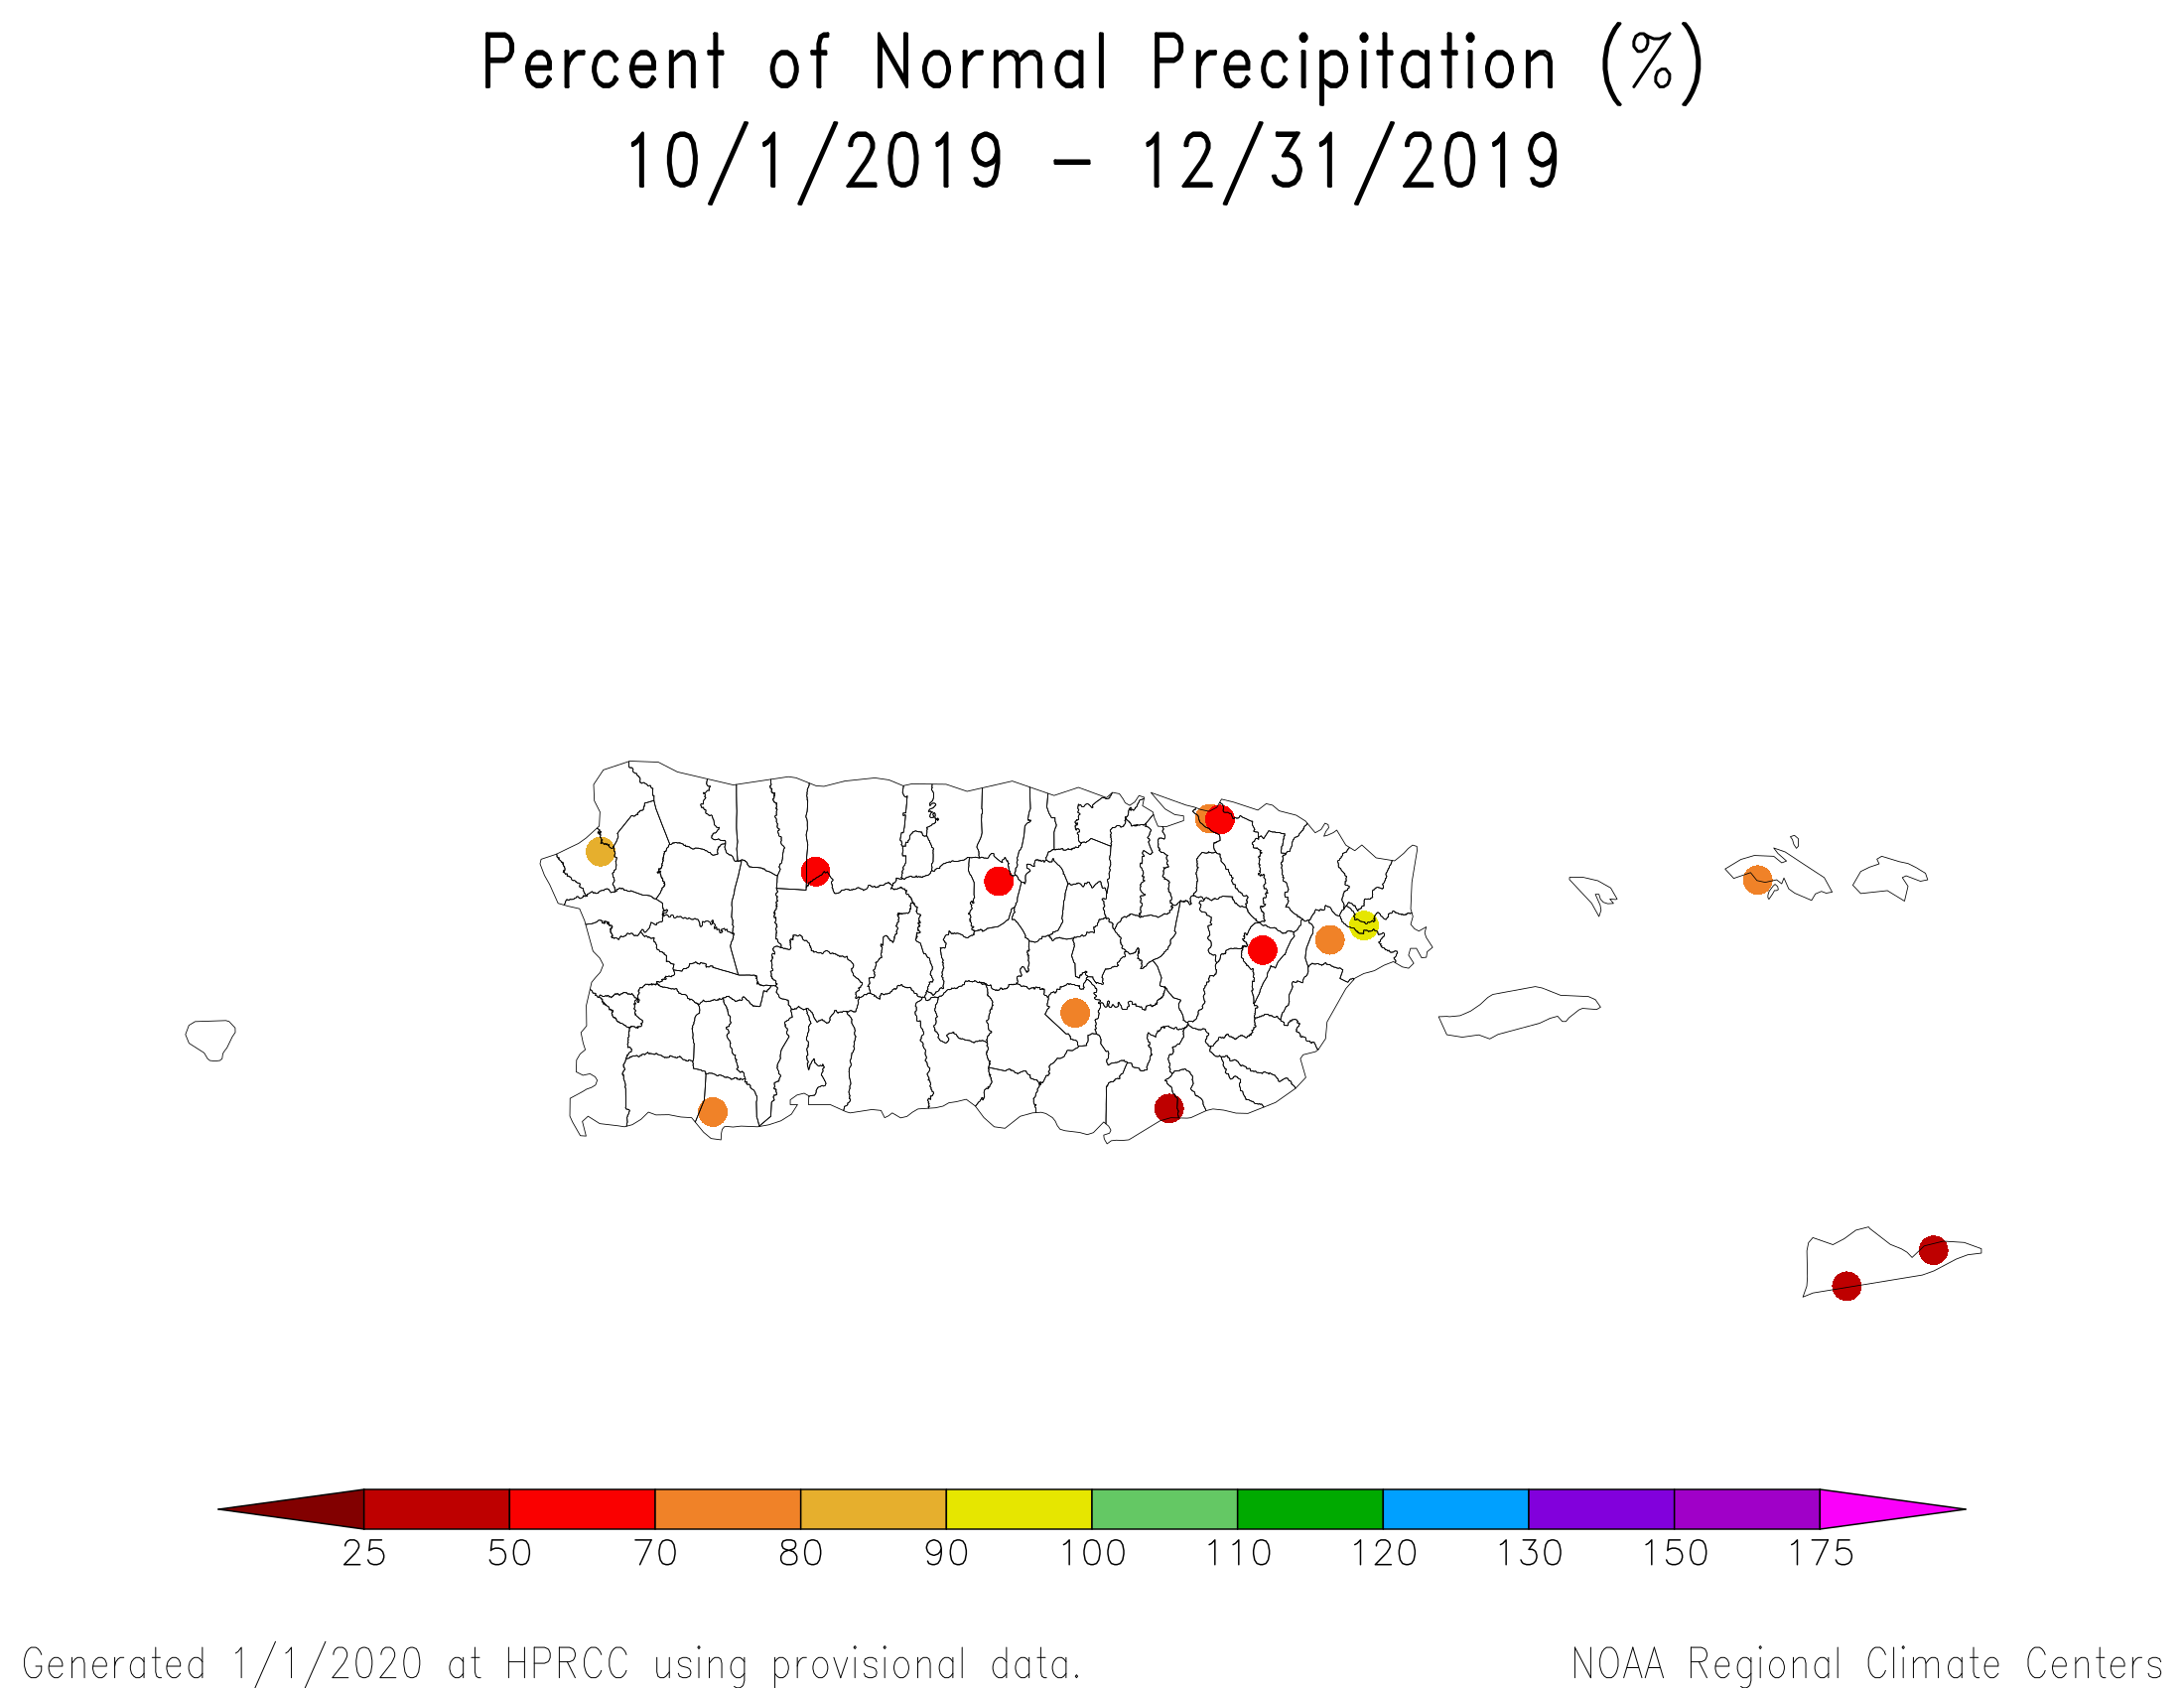
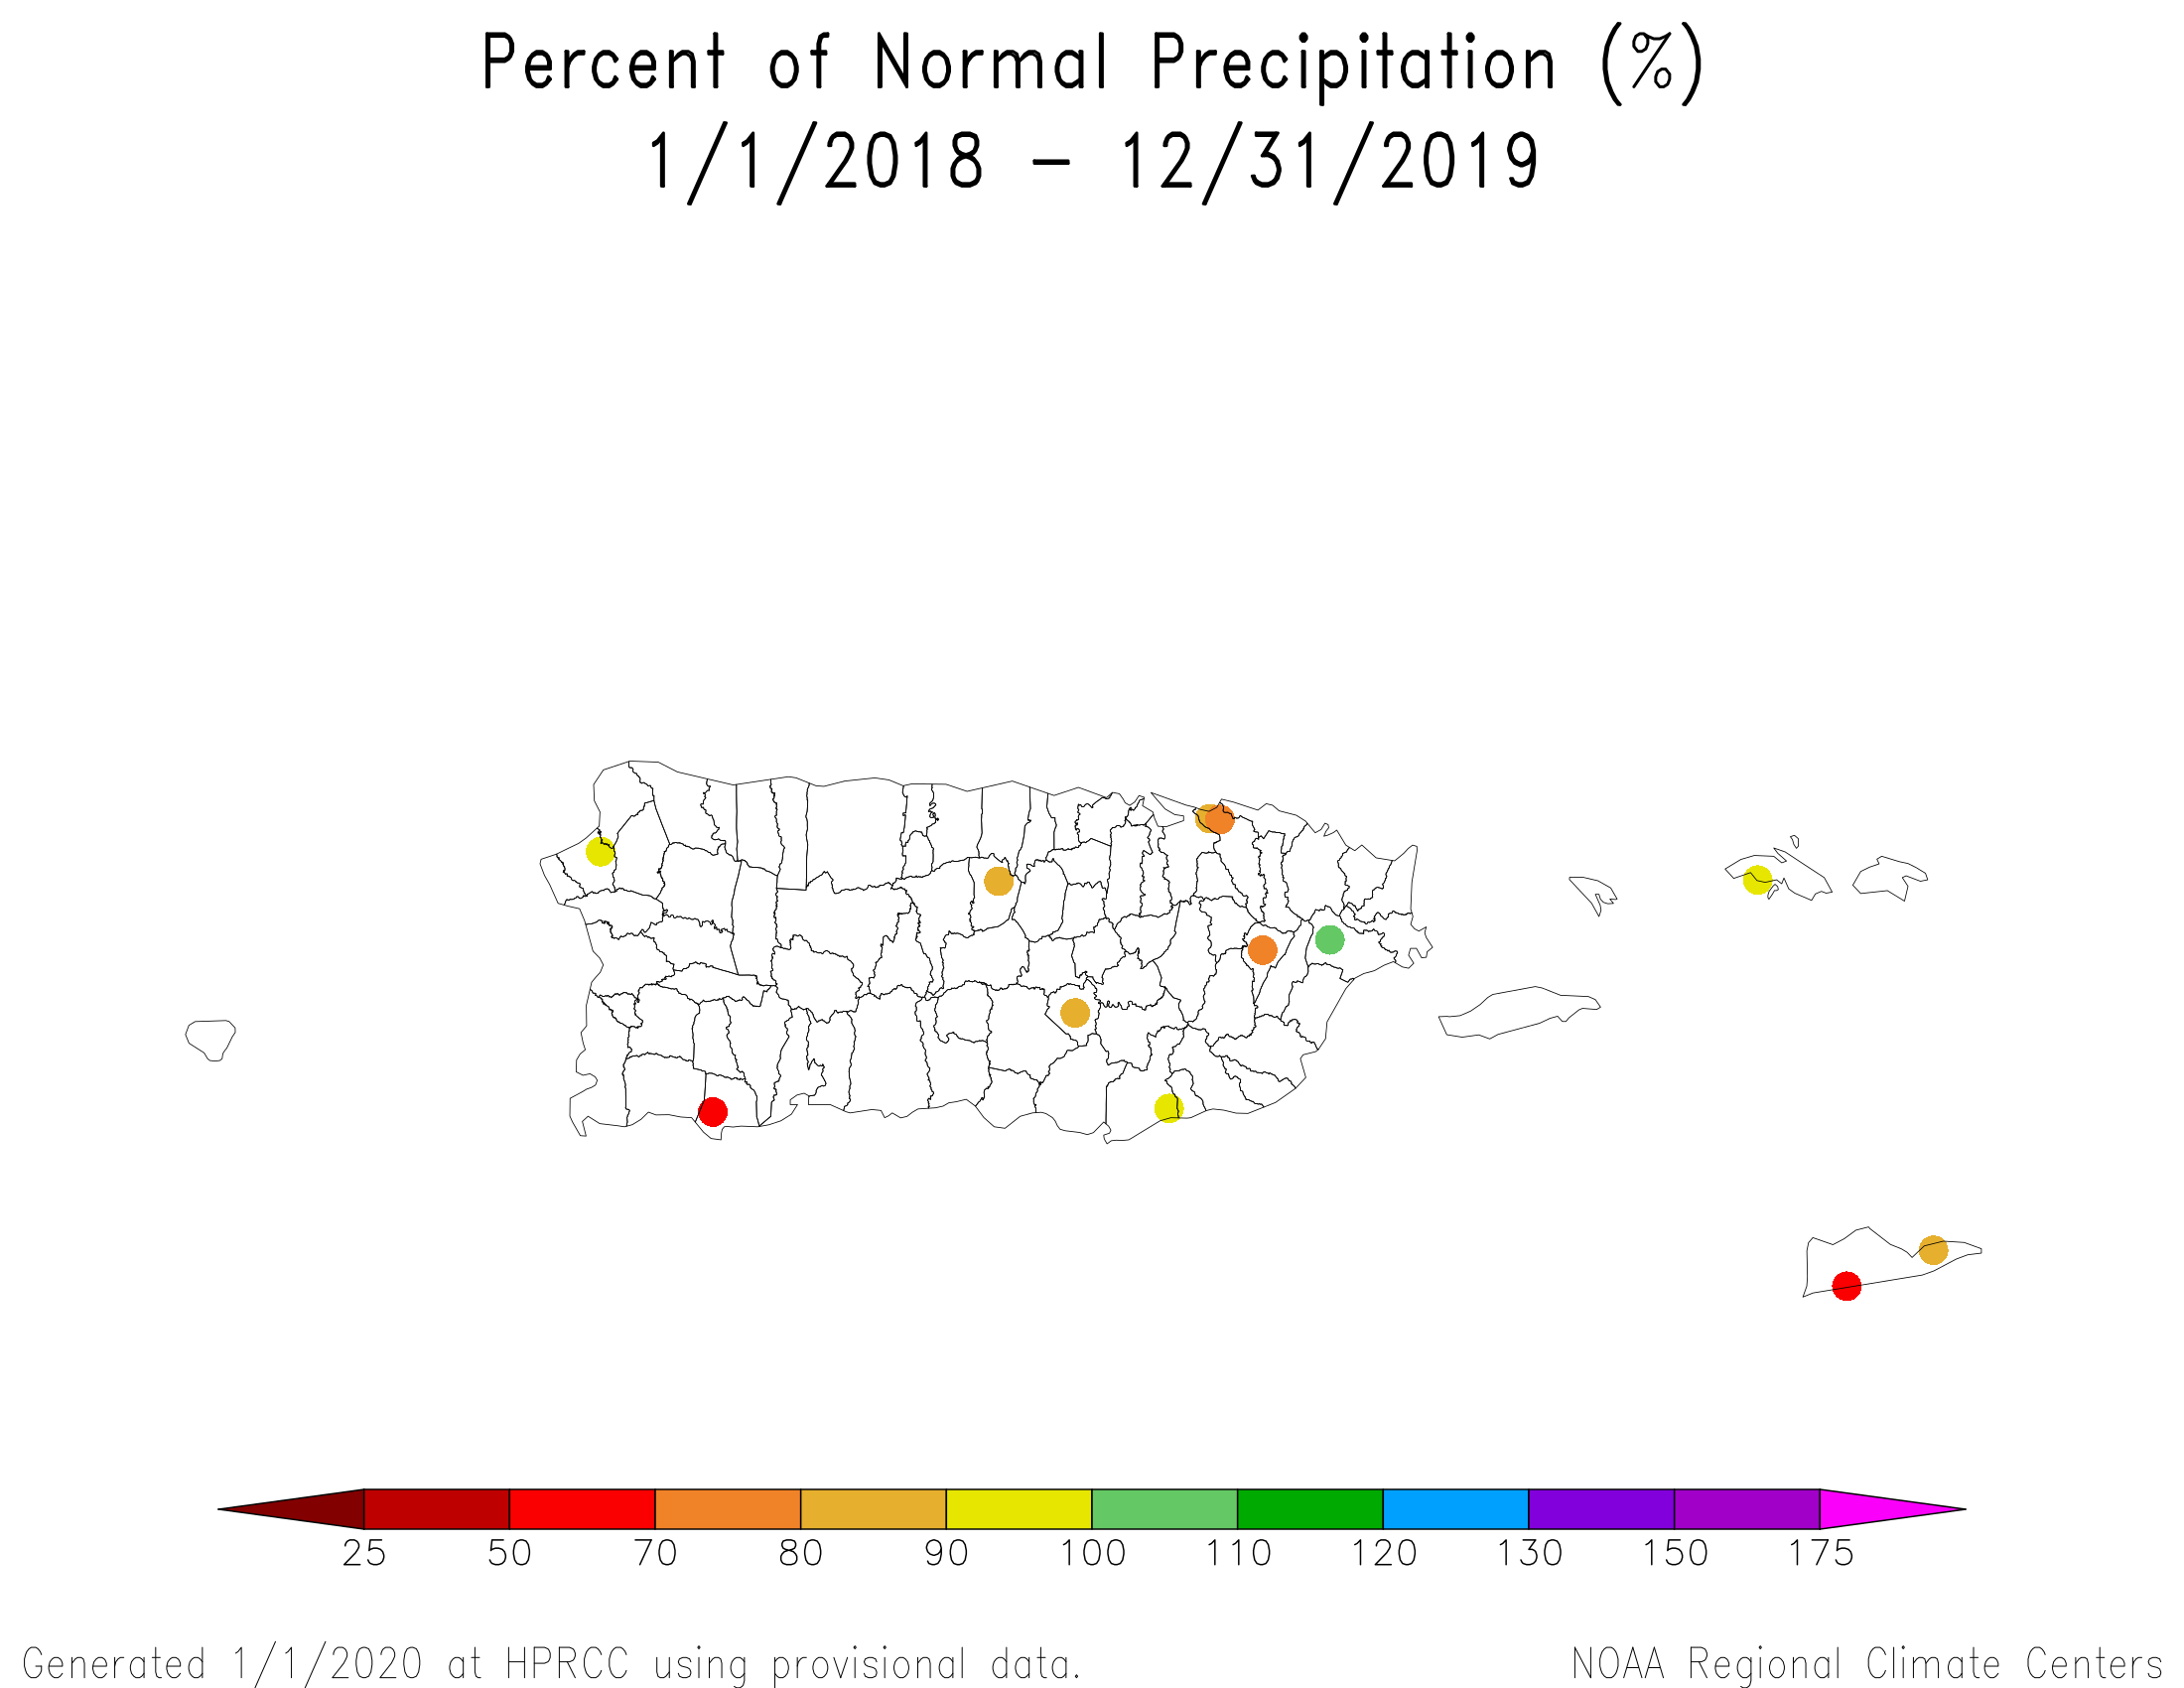
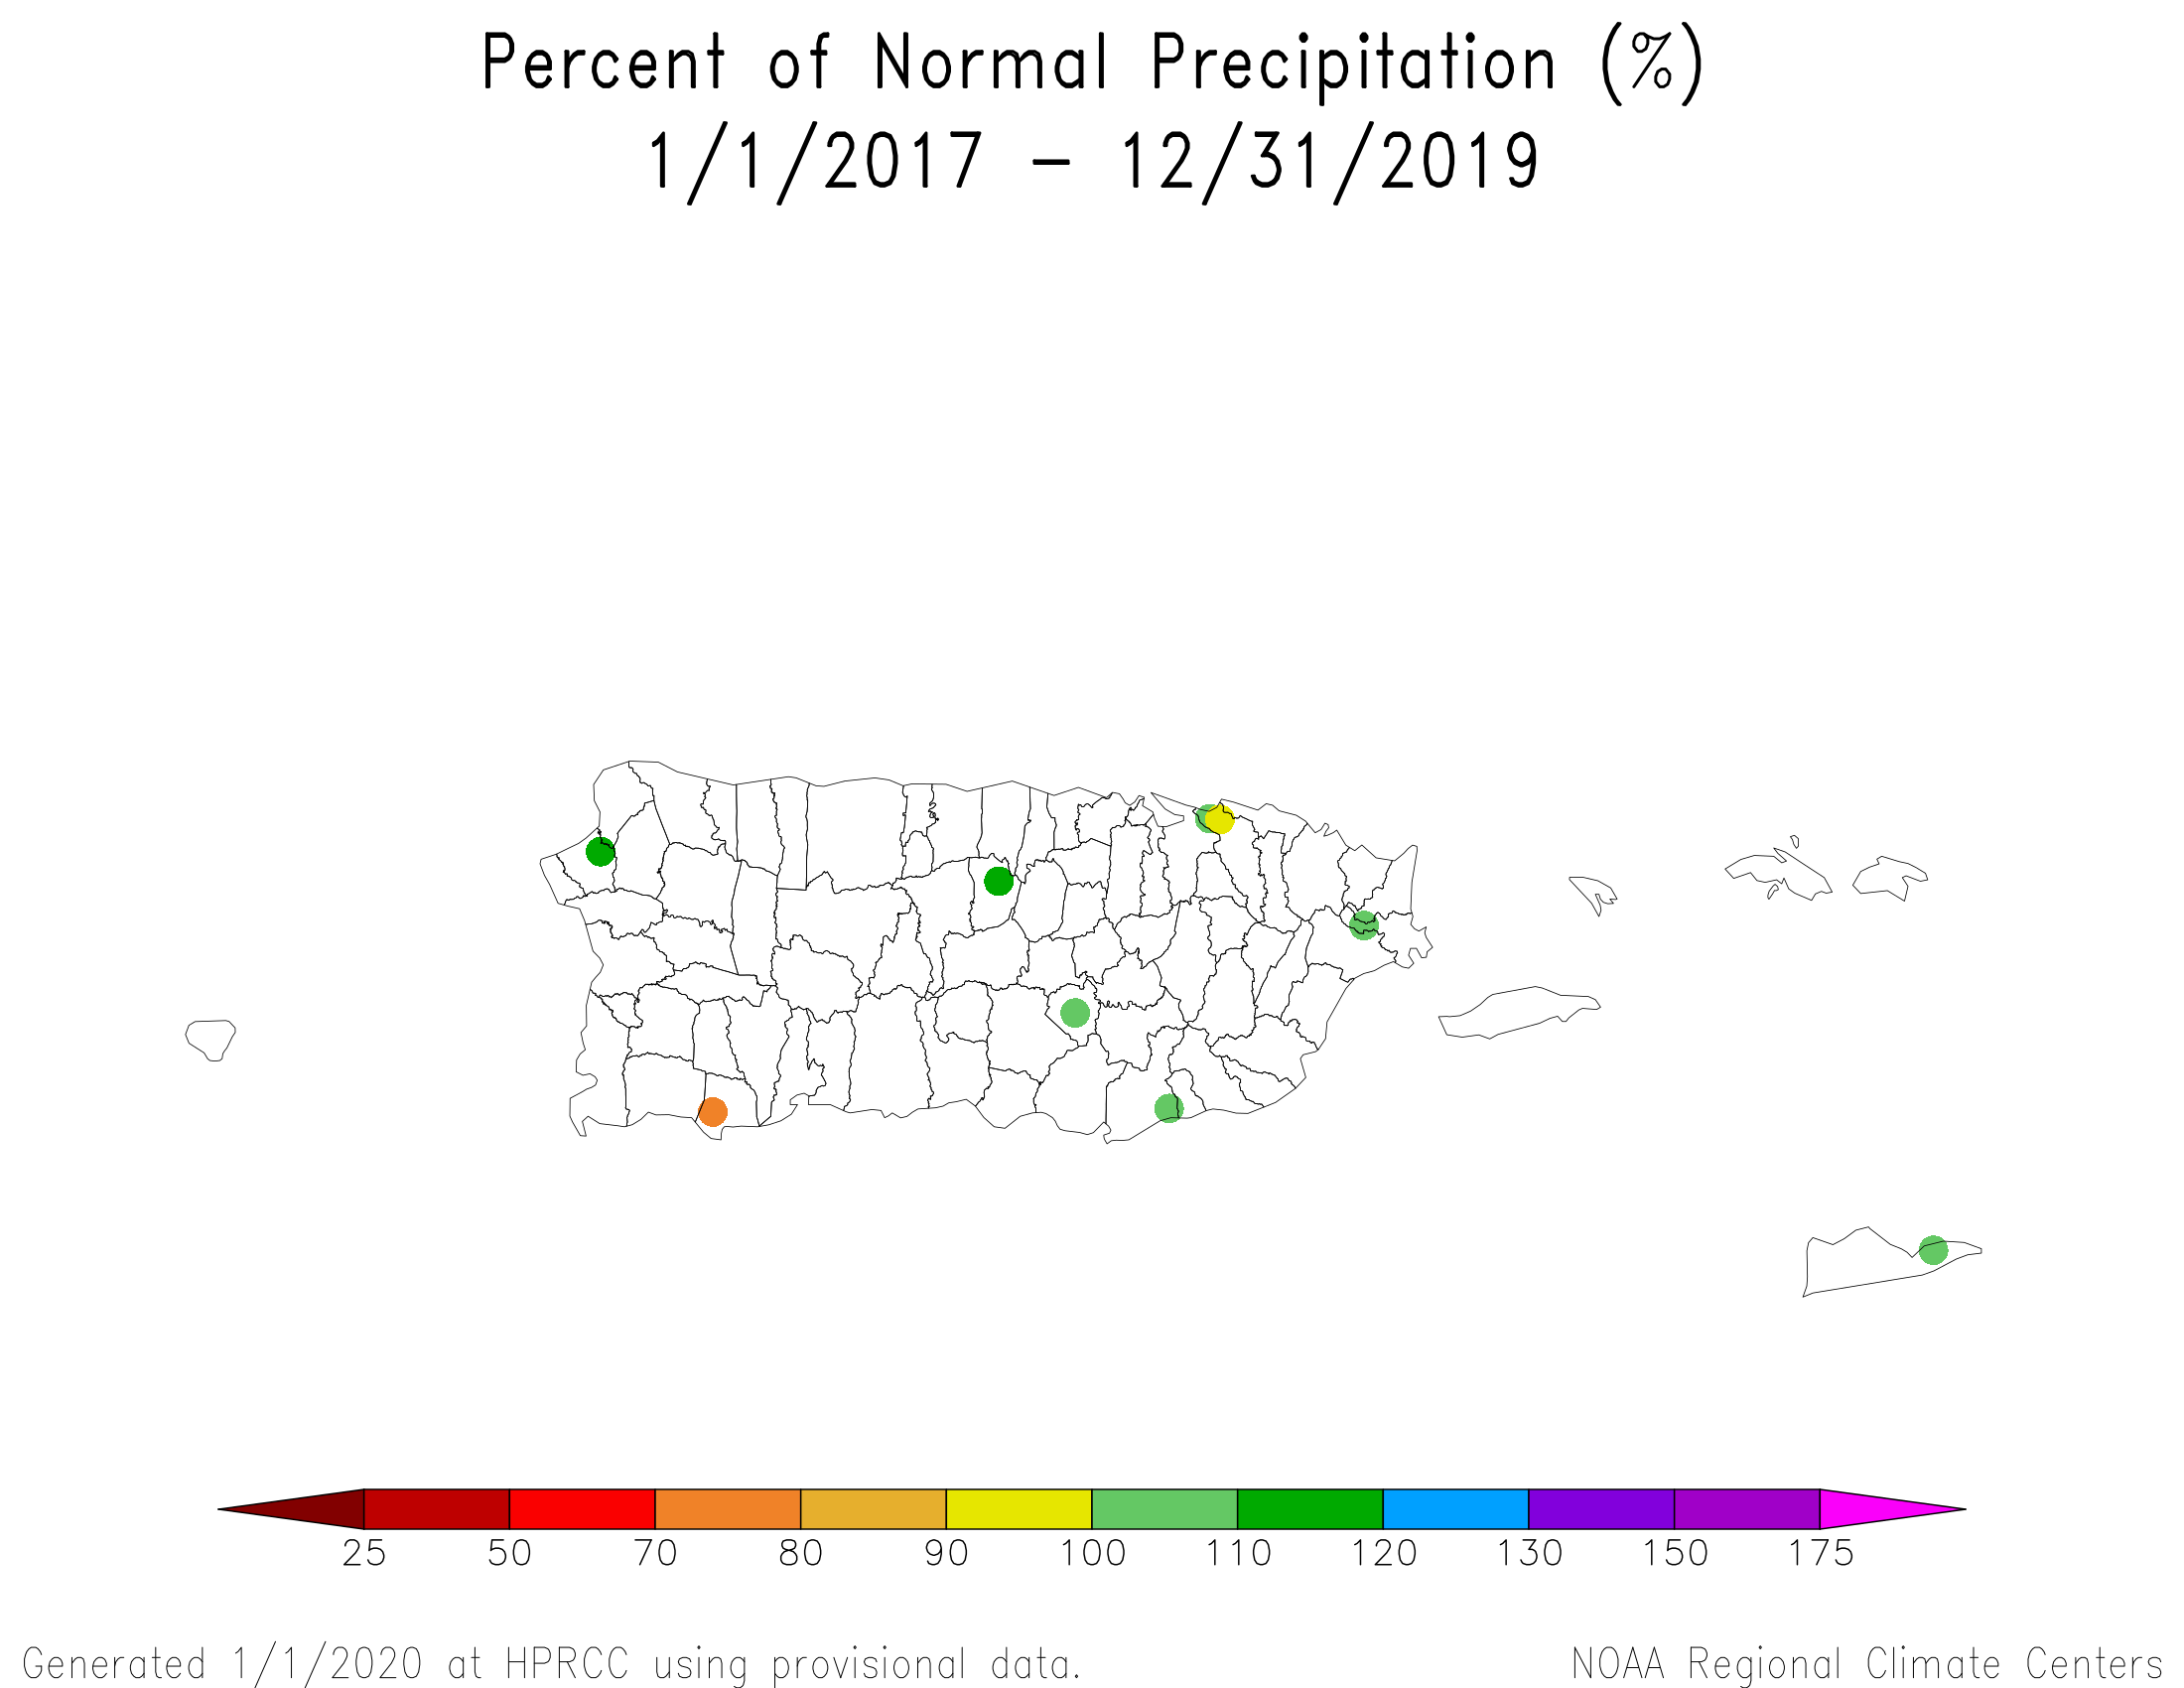
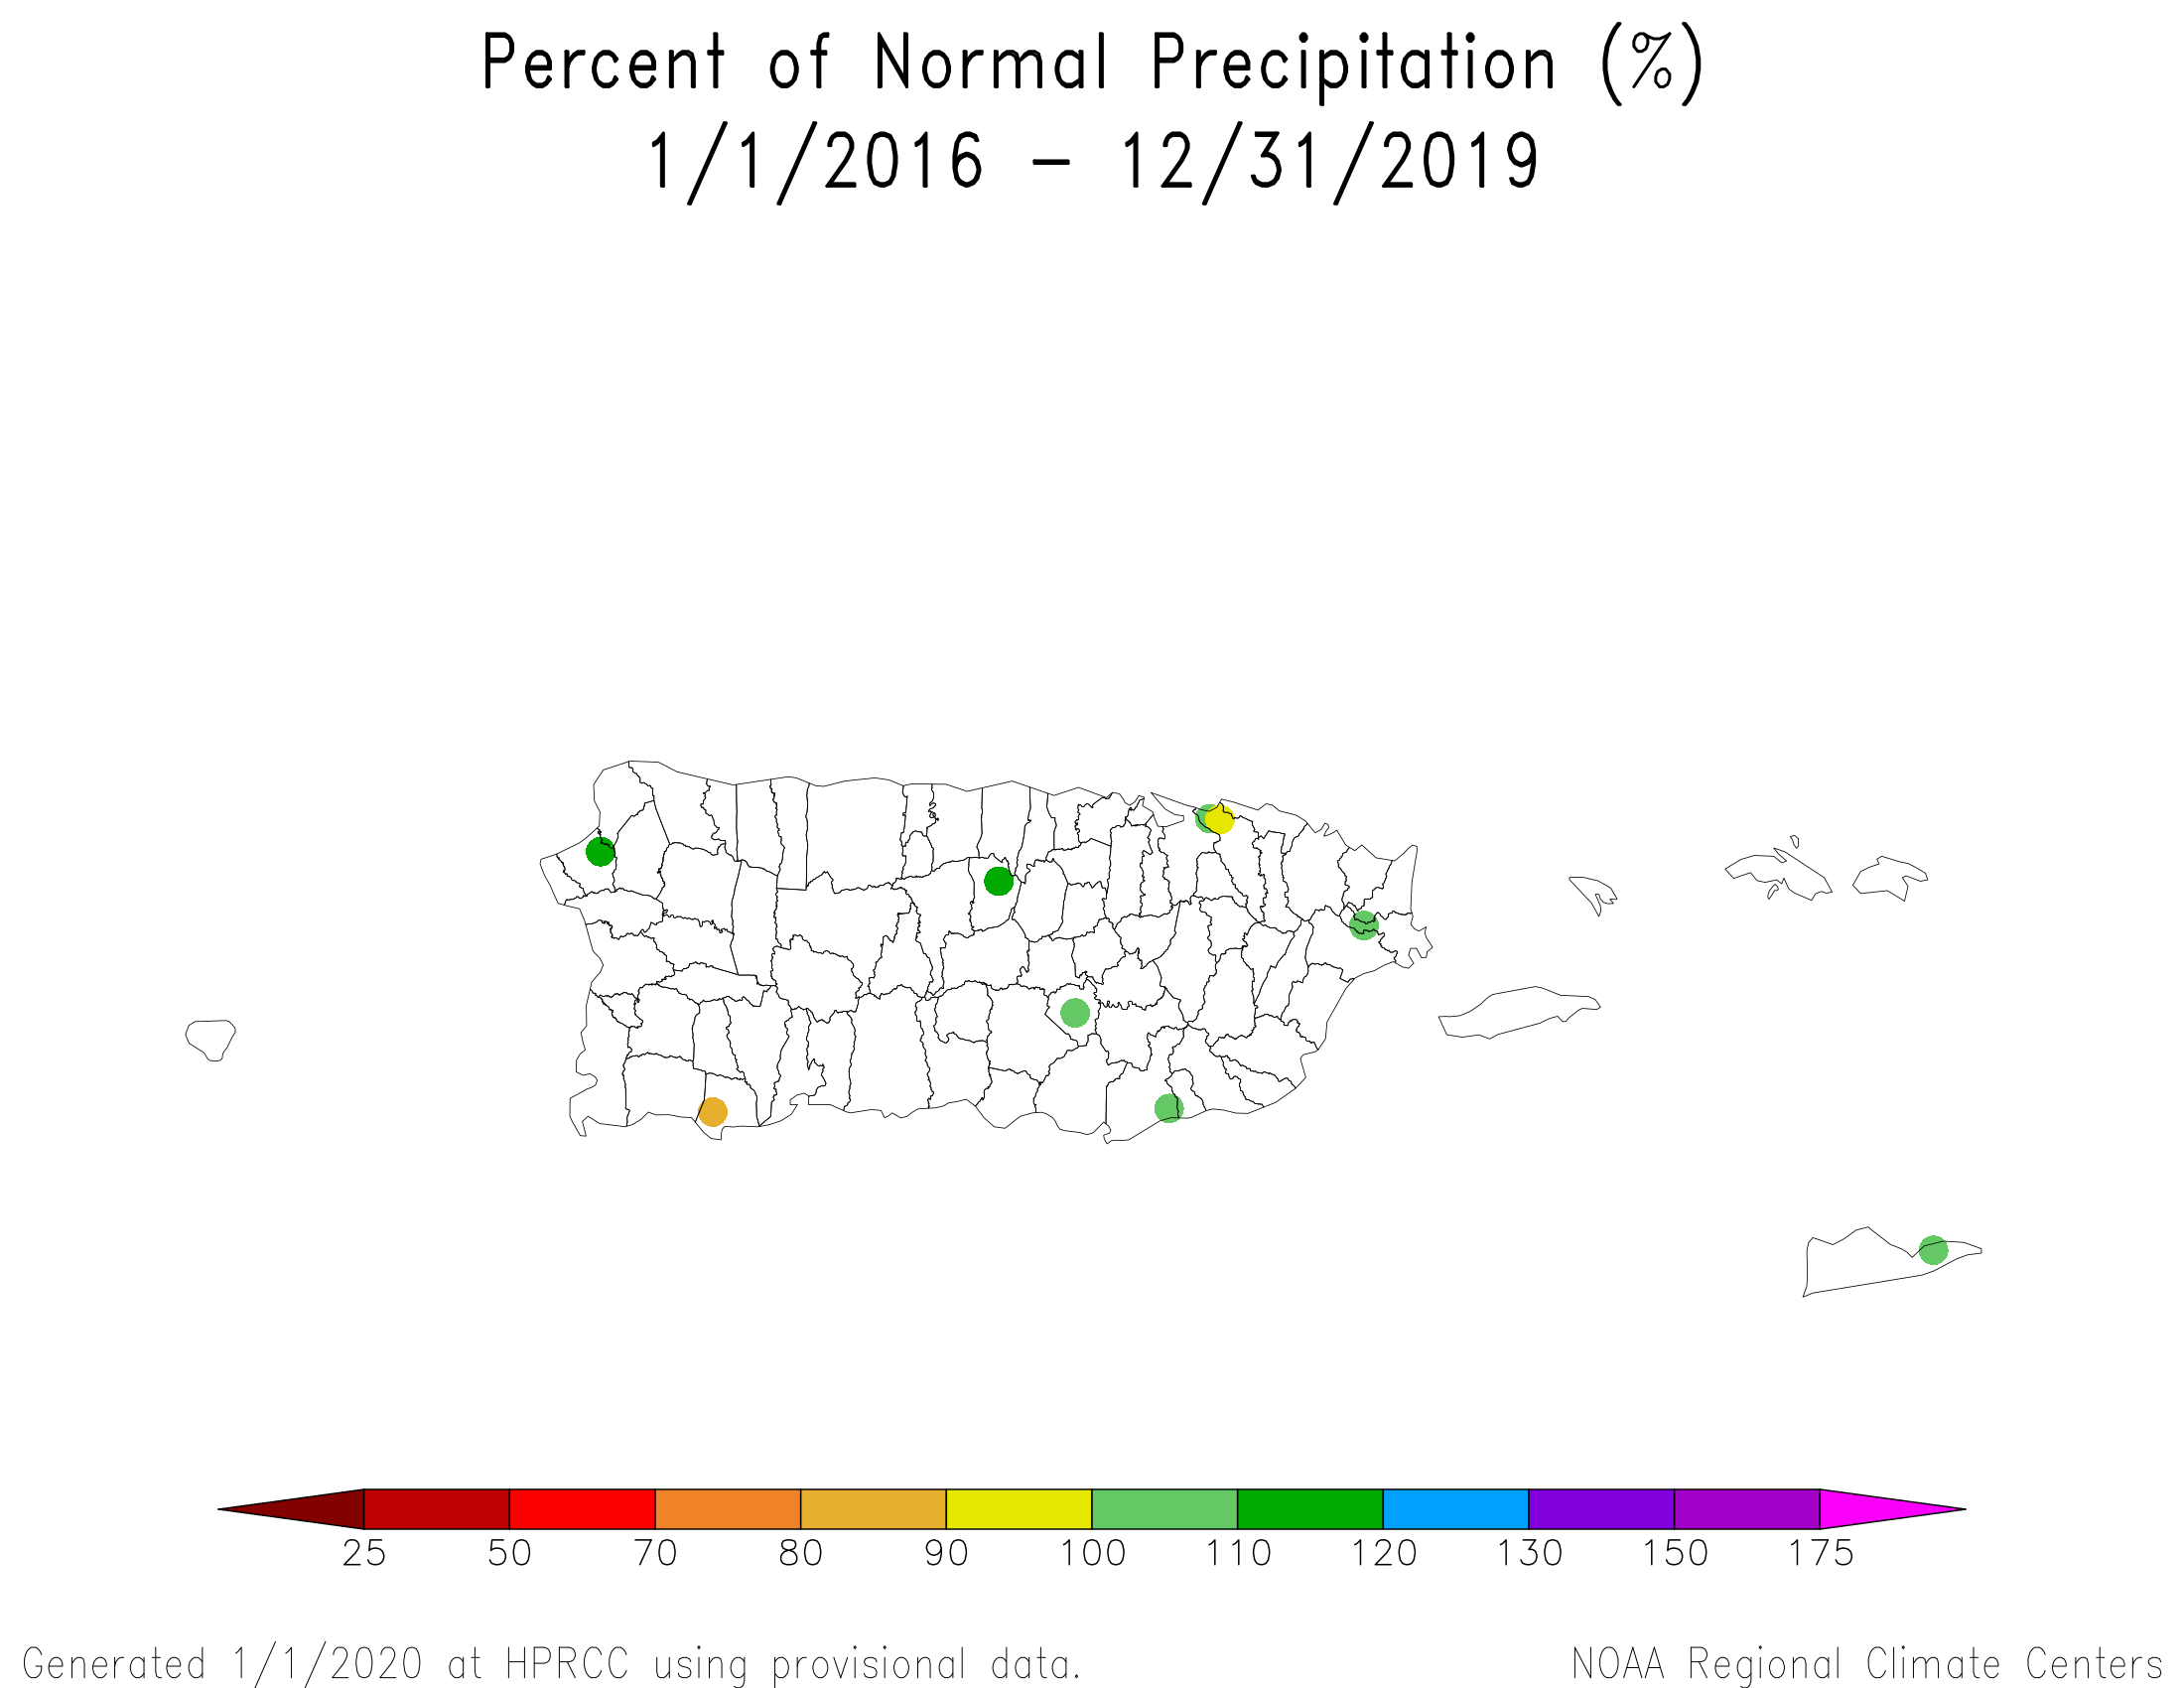
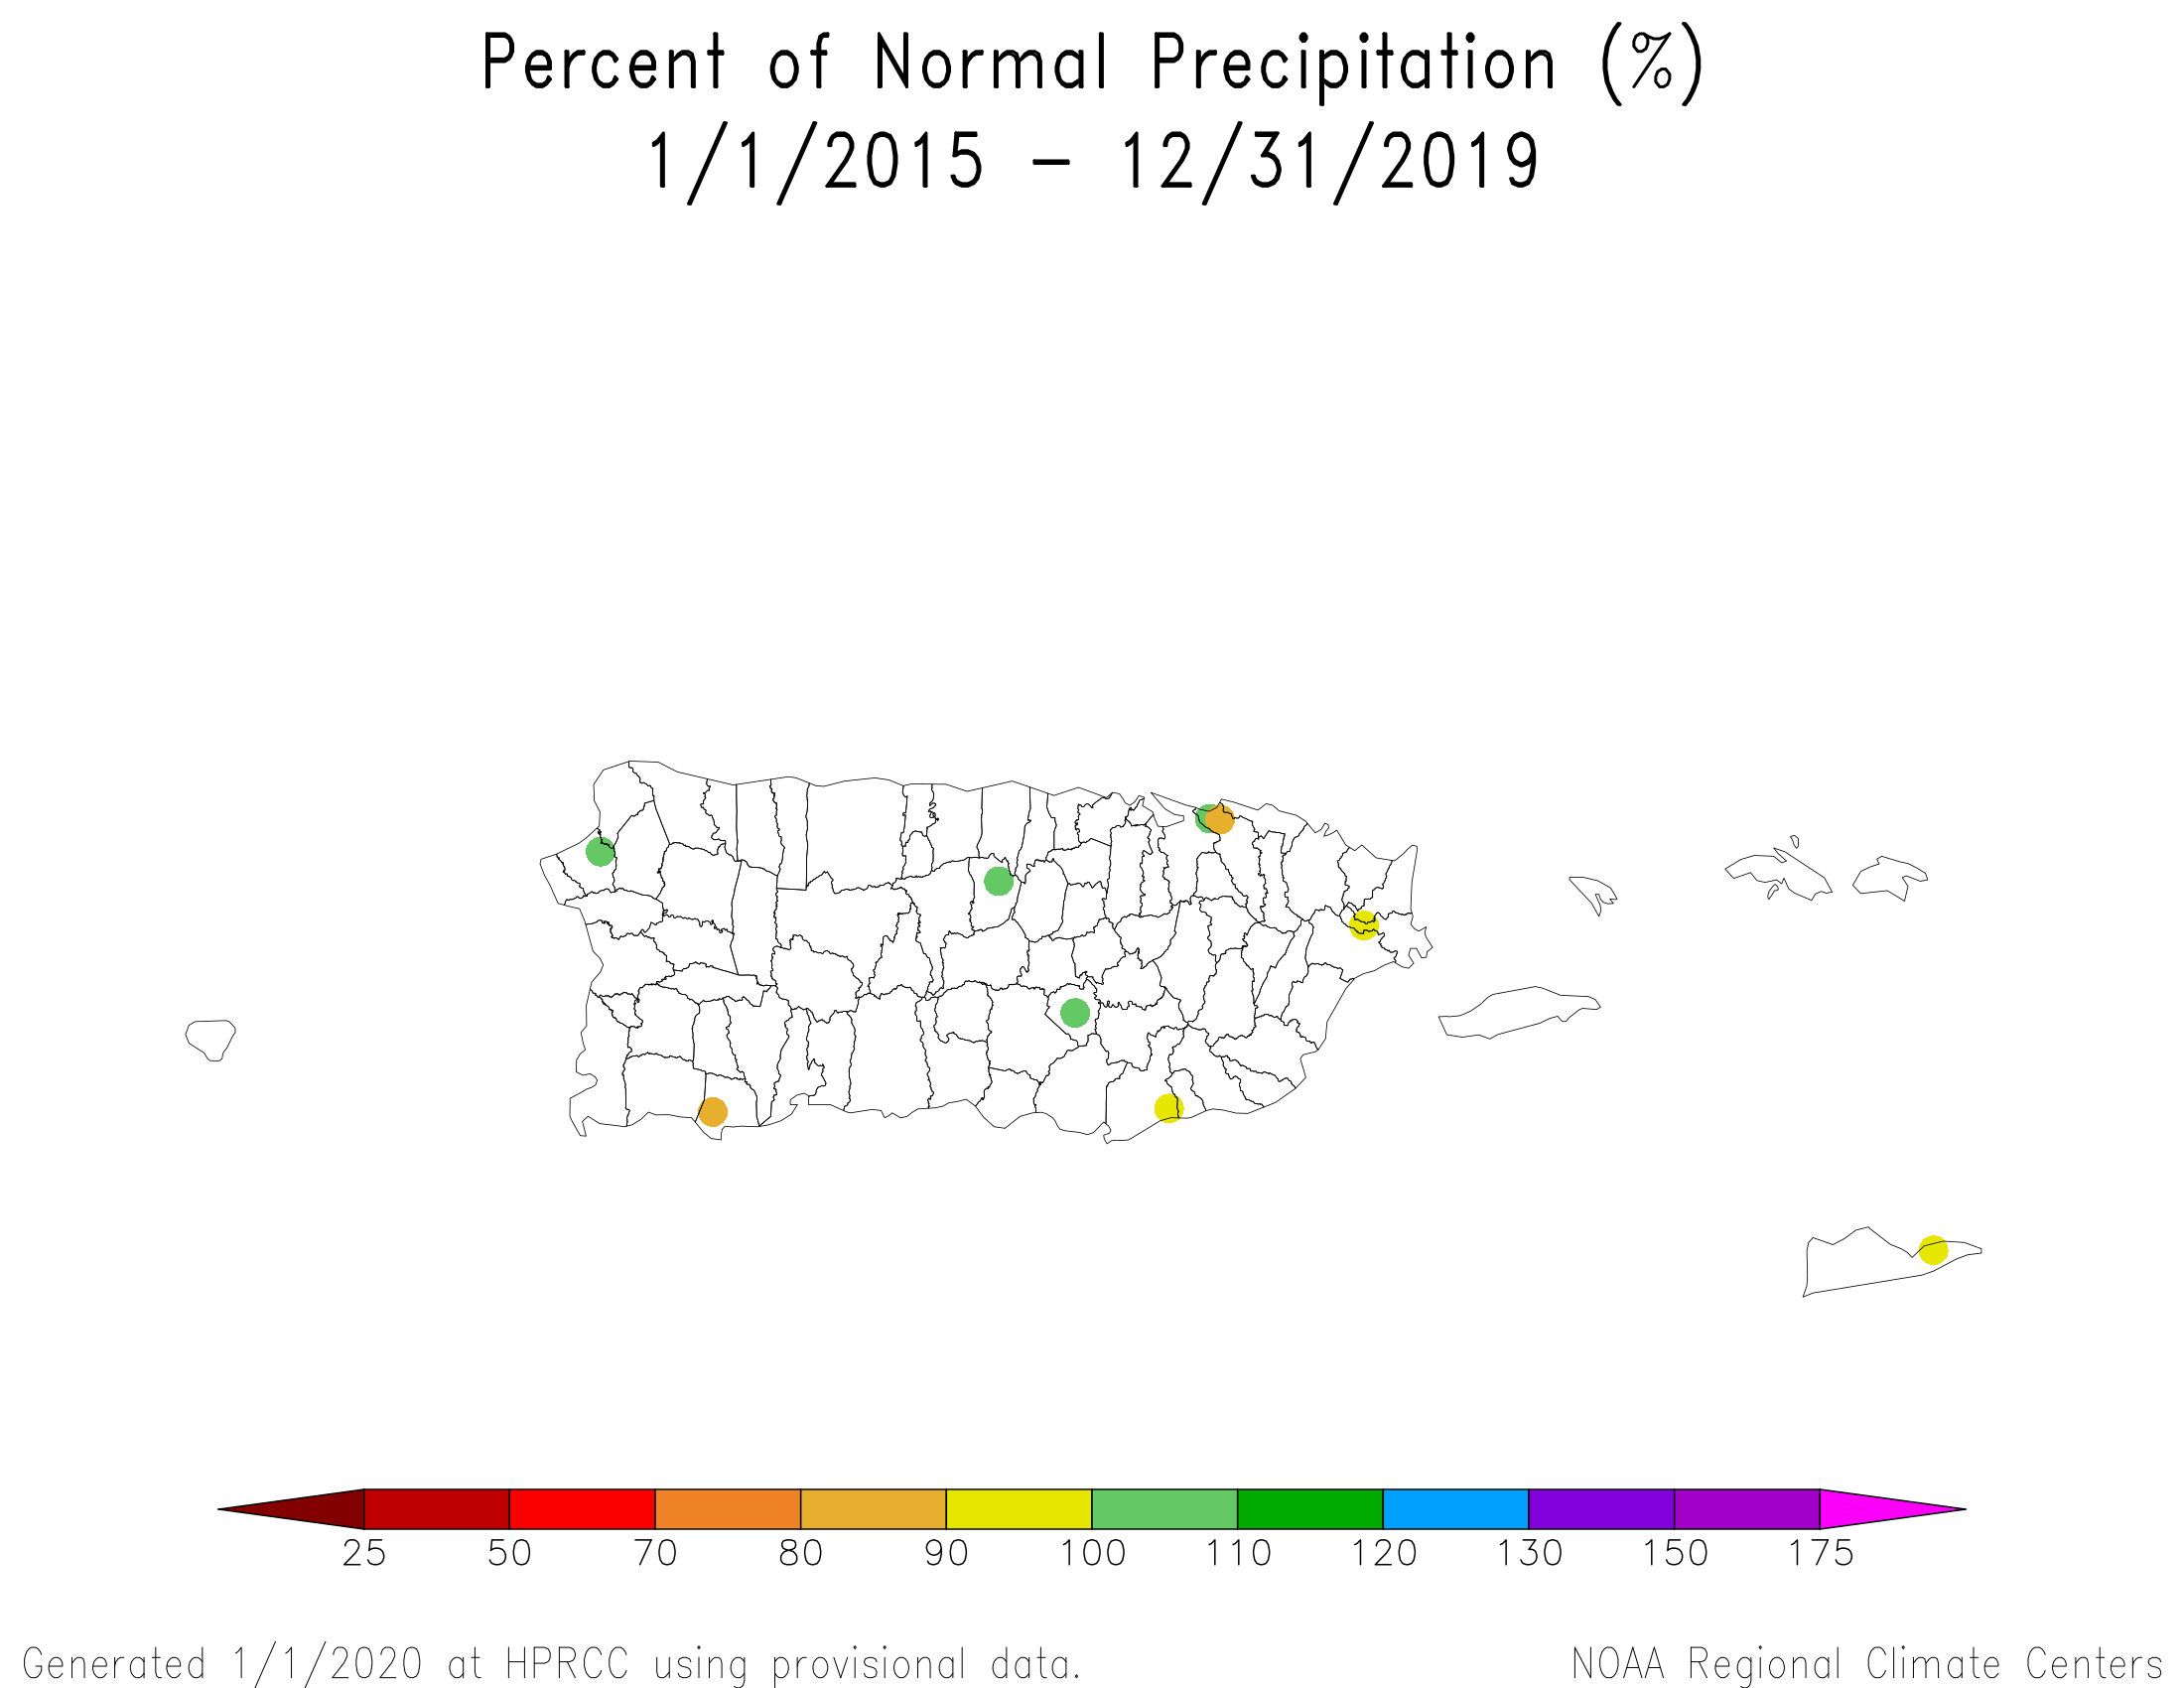
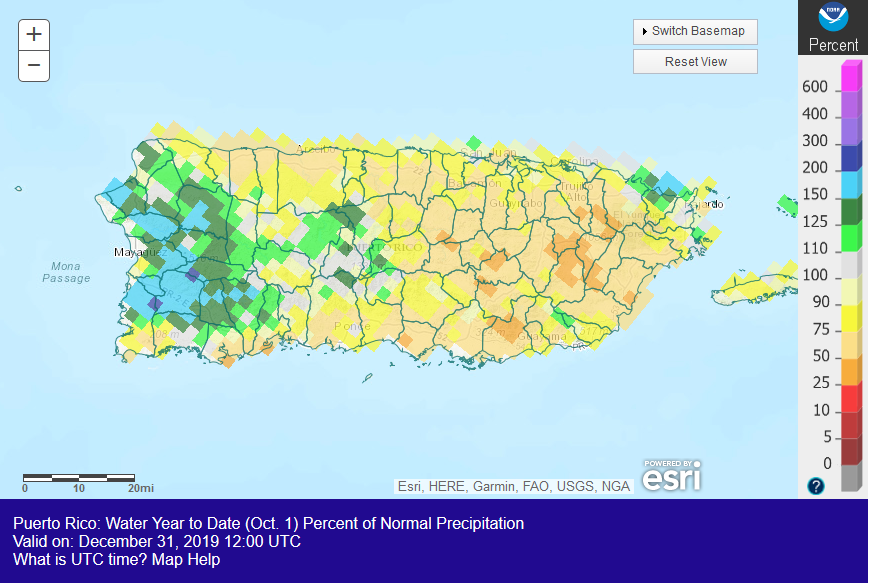 Puerto Rico percent of normal precipitation map for October-December 2019.
|
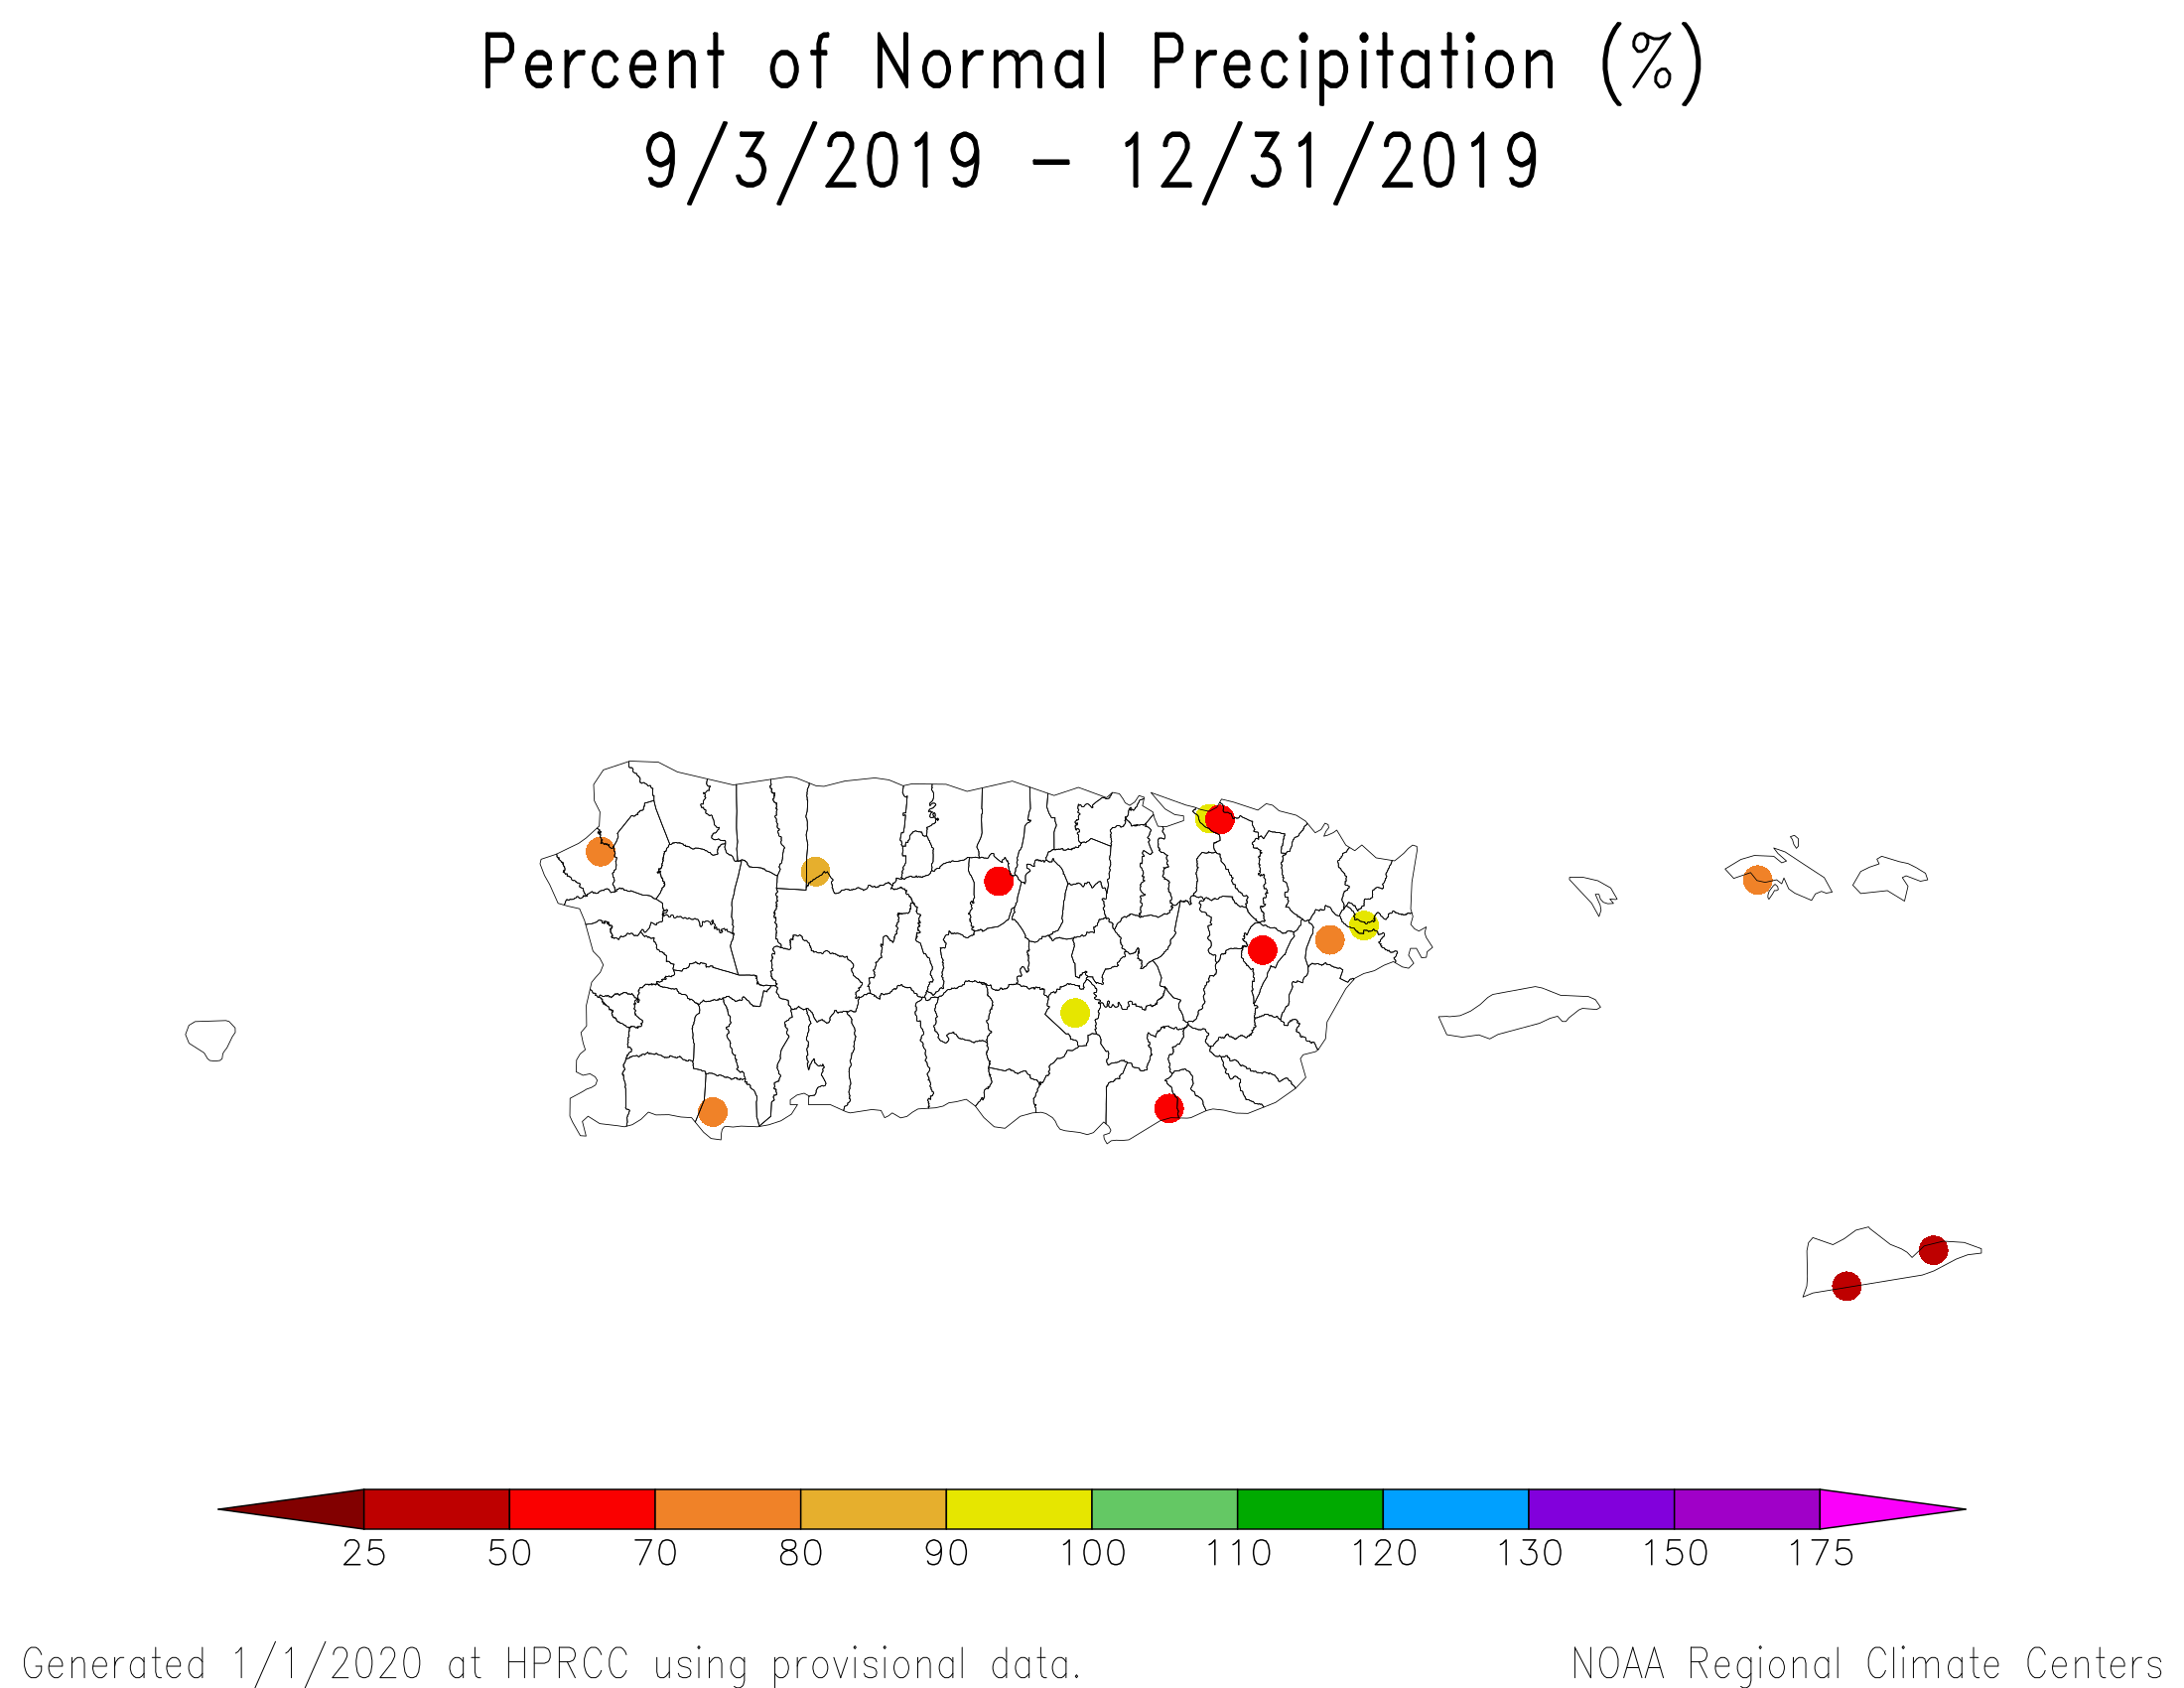 Puerto Rico and the U.S. Virgin Islands percent of normal precipitation map for September-December 2019.
|
Puerto Rico and U.S. Virgin Islands:
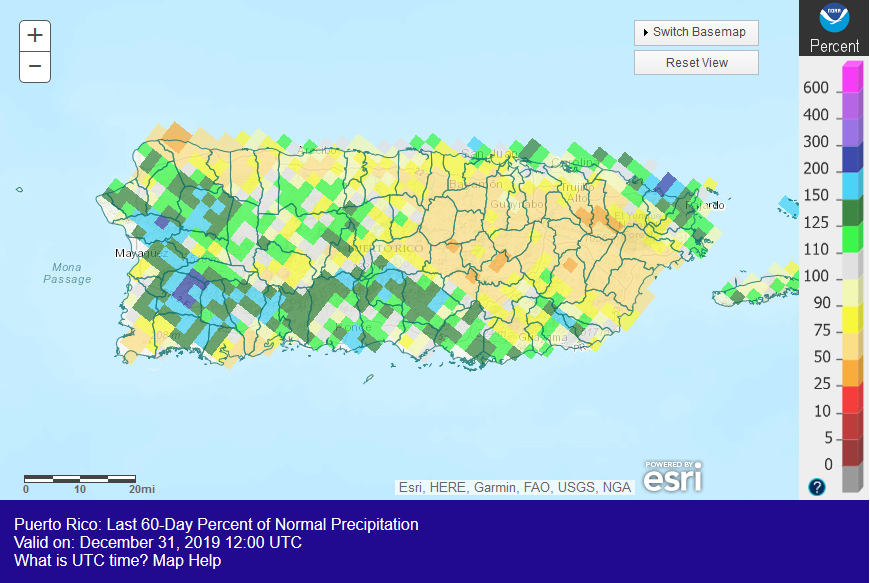
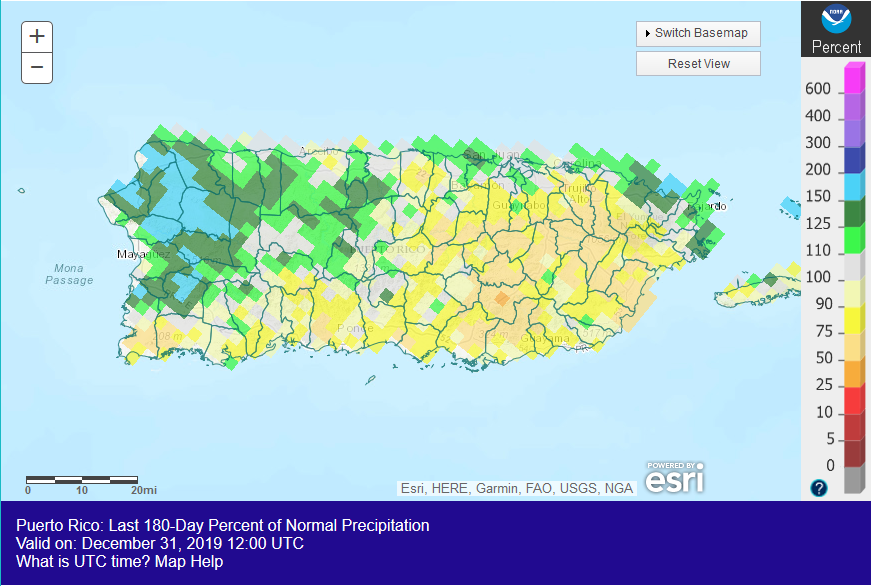
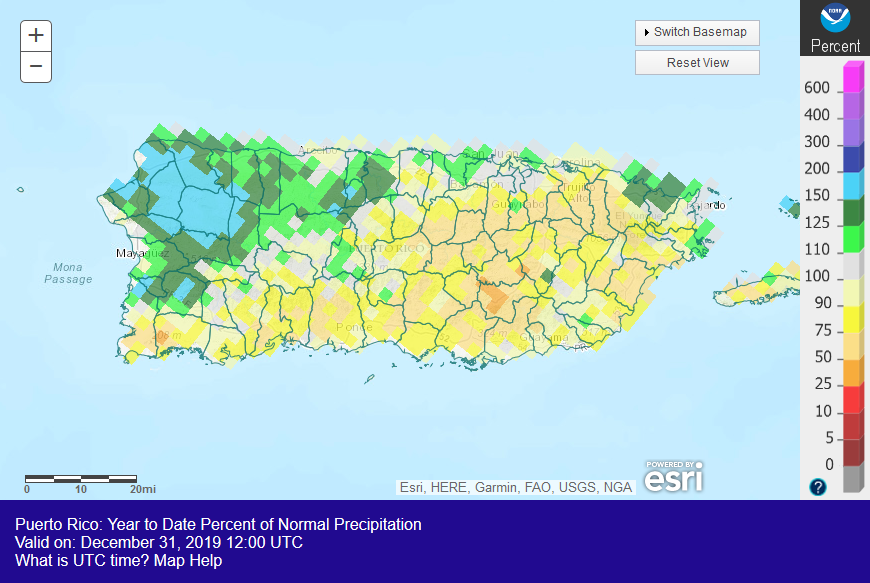
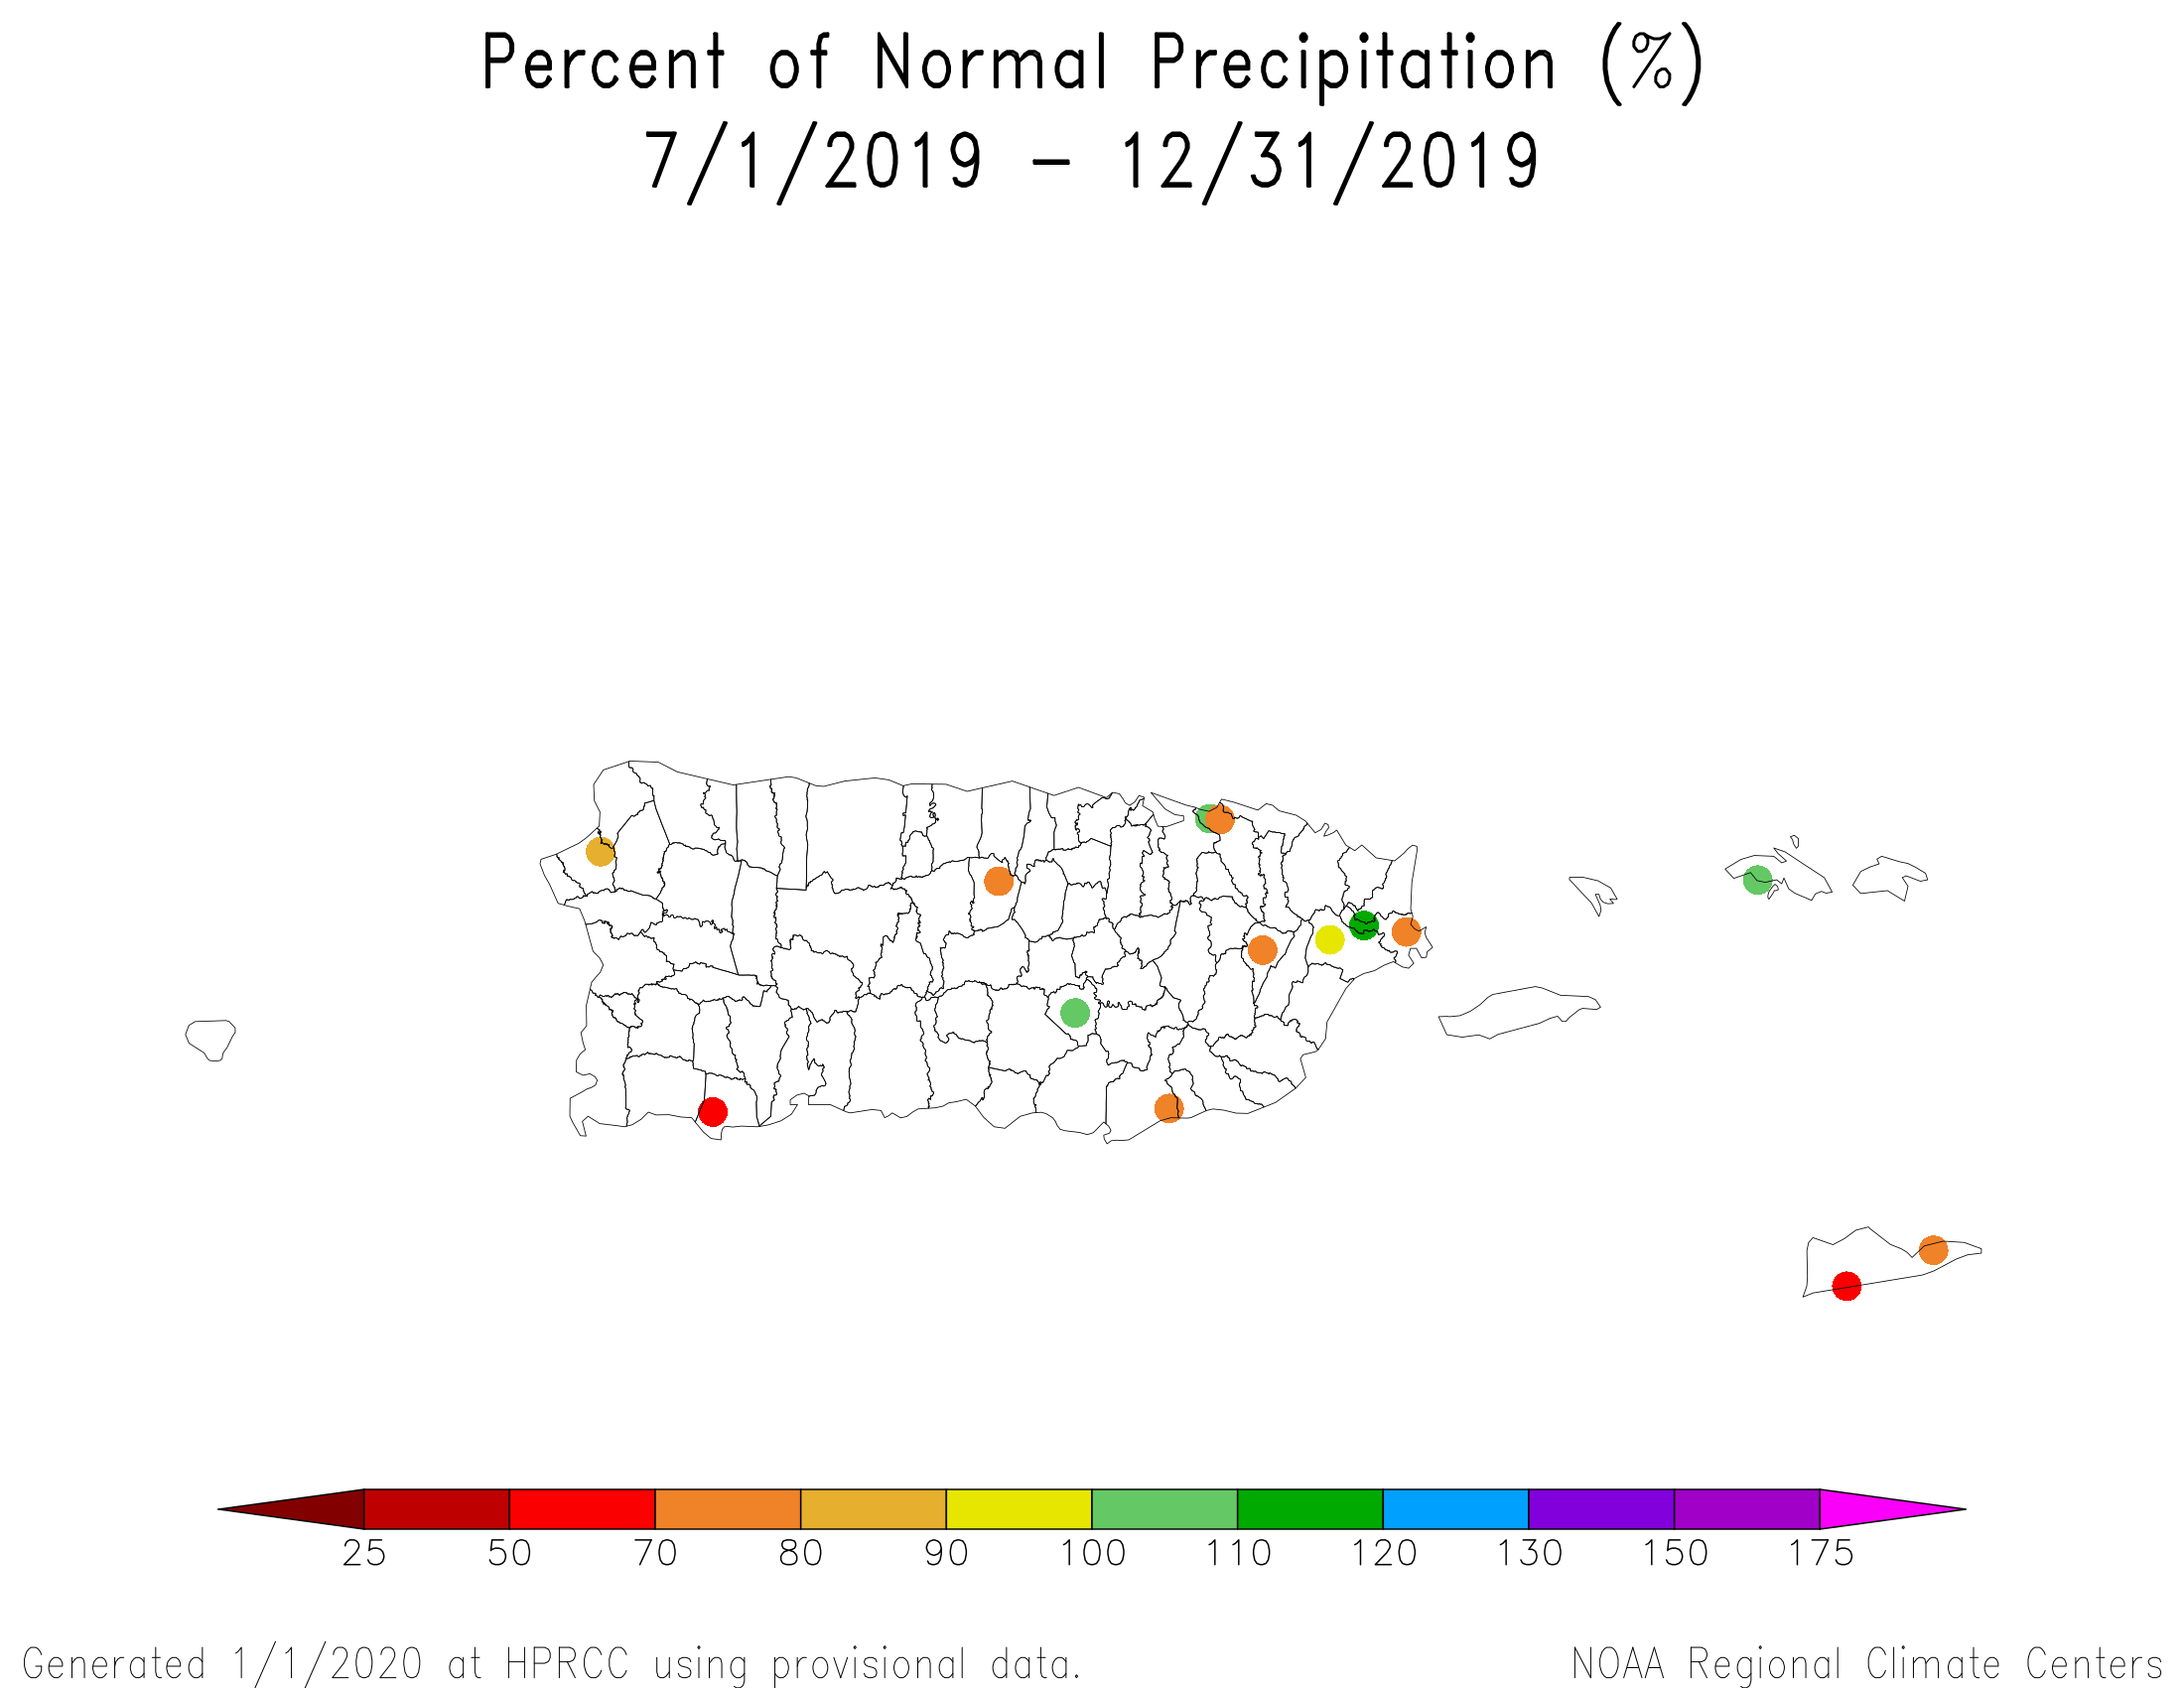
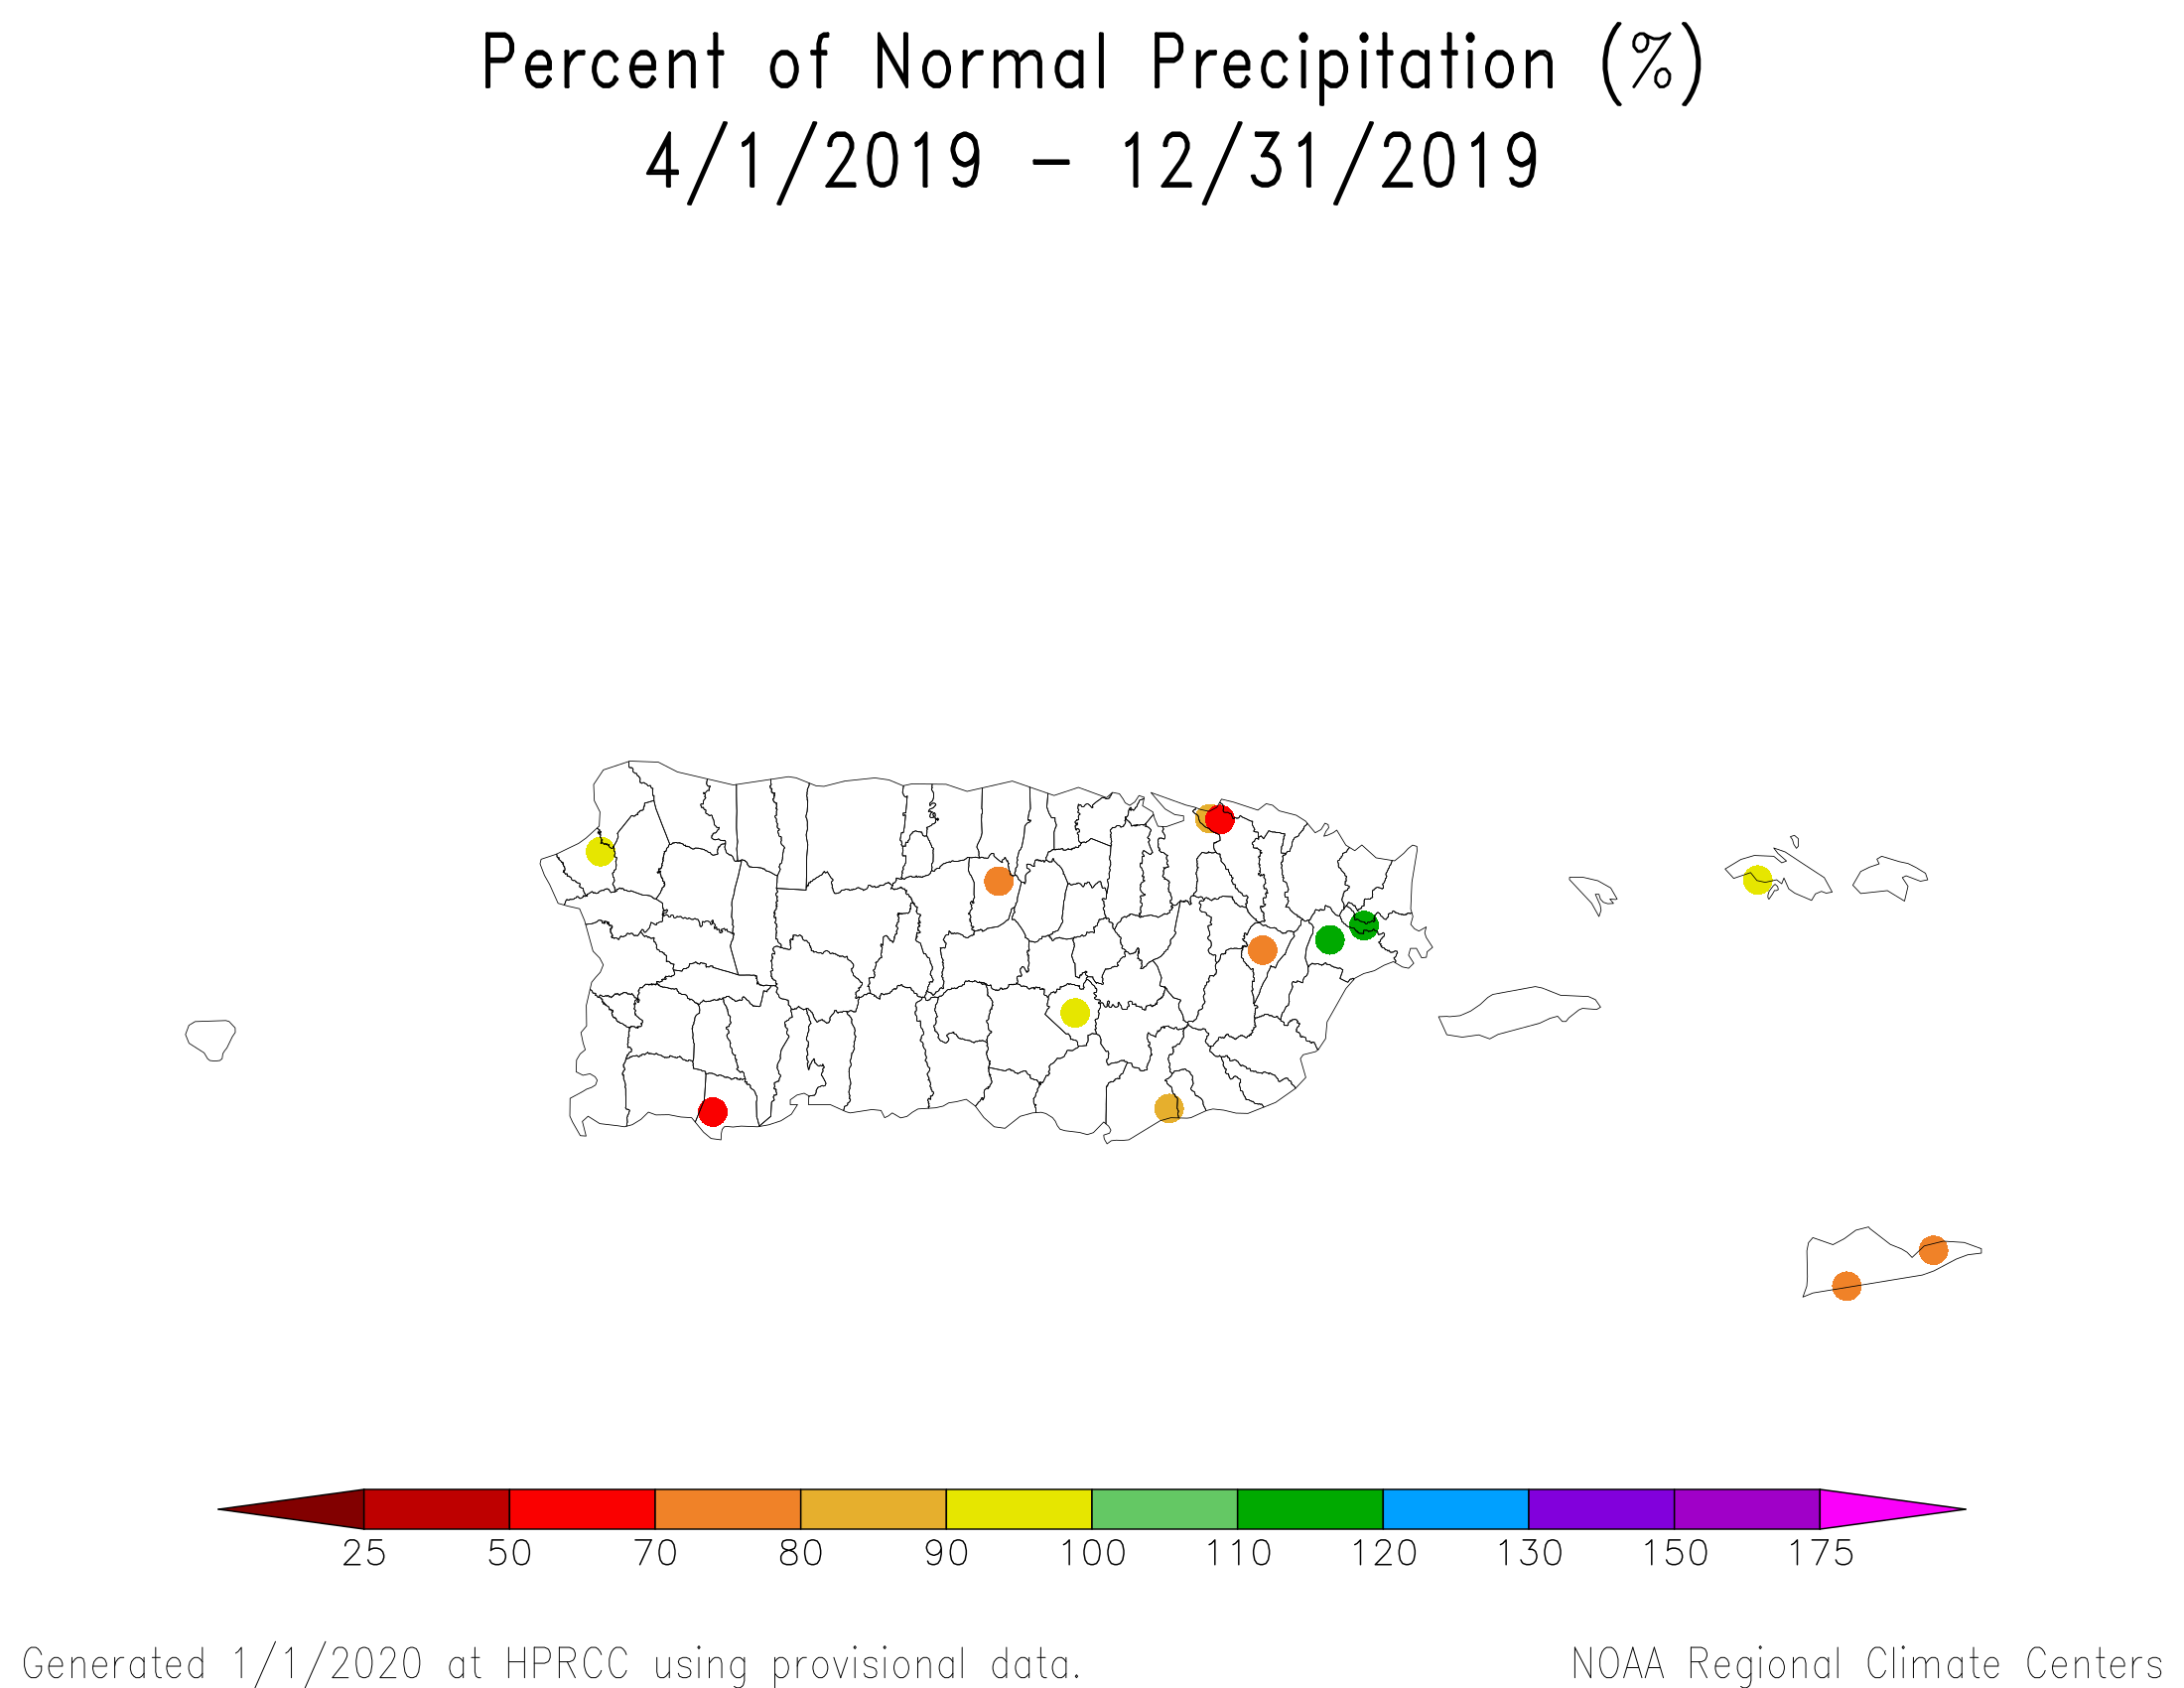
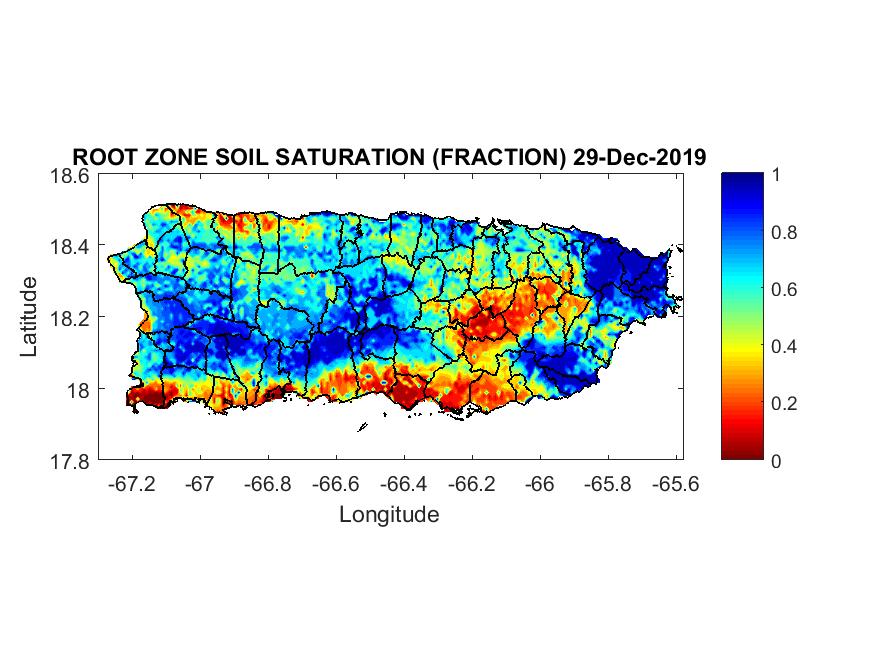
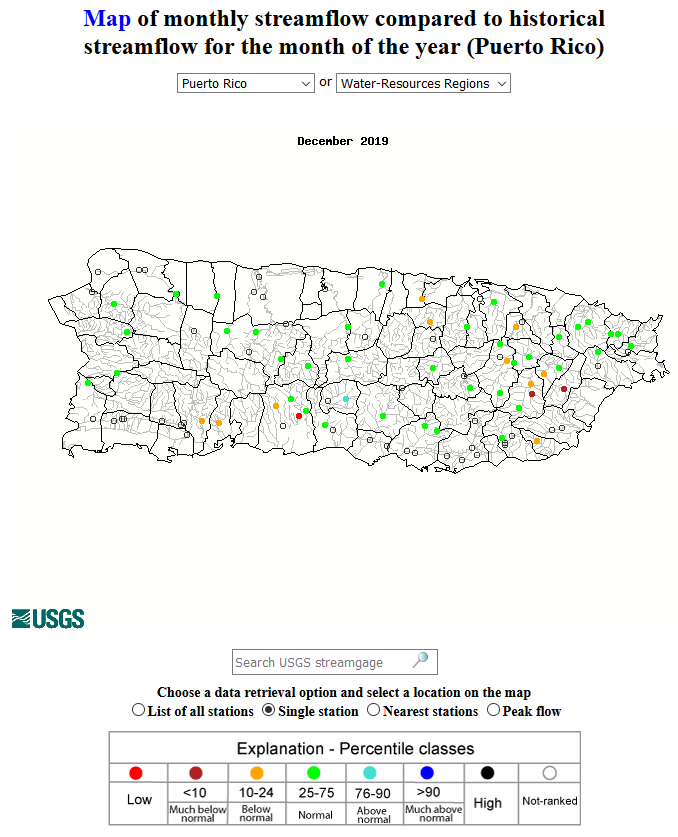
Southern portions of Puerto Rico and the northern U.S. Virgin Islands (USVI) were wetter than normal during December, while the southern USVI and northern portions of Puerto Rico were drier than normal. Drier-than-normal conditions dominated at 3 to 24 months, wetter-than-normal conditions dominated at 36 to 48 months, and the anomaly pattern was mixed at 60 months (radar-based precipitation anomaly estimates for the last 1, 2, 3, 6, 12 months) (low elevation station precipitation maps for the last 1, 2, 3, 4, 6, 9, 12, 24, 36, 48, 60 months). Soil conditions continued dry along the southern coast and in parts of east central Puerto Rico. December streamflow was mostly near normal with some streams below normal across eastern and southwestern Puerto Rico. Moderate drought continued across parts of eastern Puerto Rico but contracted during December, covering 10.9 percent of the island as seen on the December 31st USDM map. In the USVI, moderate drought continued on St. Croix and abnormal dryness continued on St. John, with St. Thomas continuing free of drought and abnormal dryness.
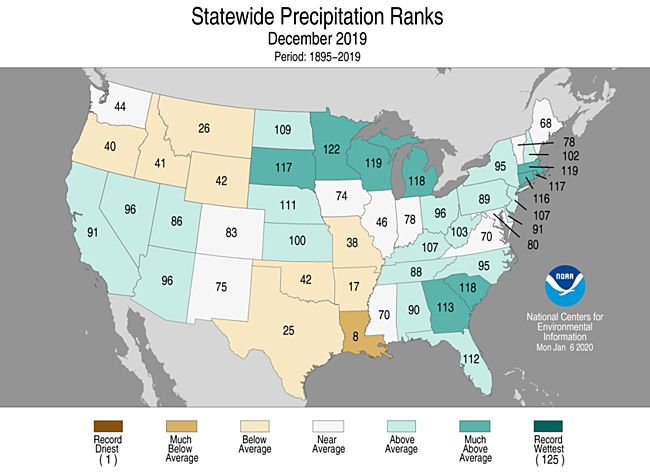
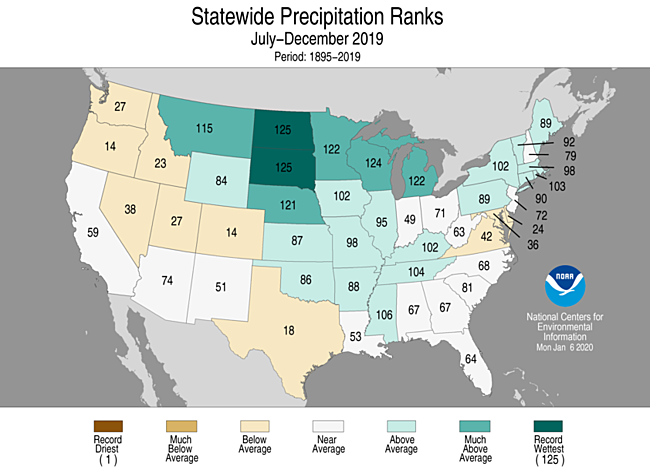
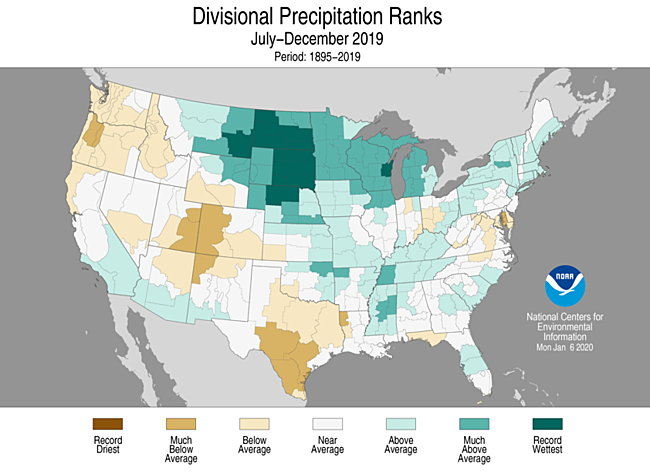
CONUS State Precipitation Ranks:
|
|
December 2019 was drier than normal across the Pacific Northwest into adjacent northern Rockies and northern High Plains, and from New Mexico and Texas to the Mid-Mississippi Valley. Nine states in these regions had a rank in the driest third of the 125-year historical record for December, including Louisiana which ranked eighth driest.
|
|
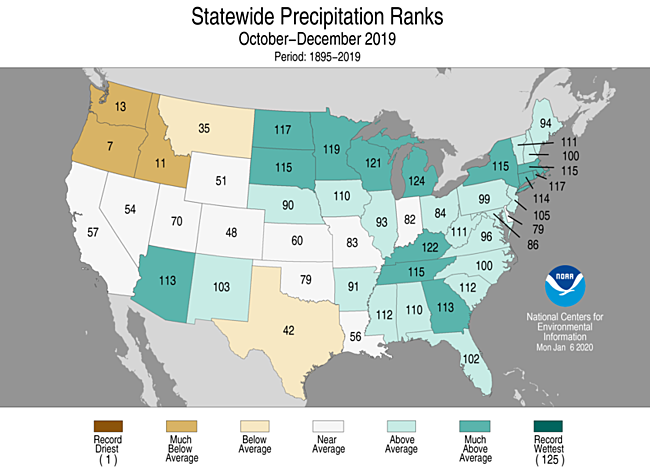
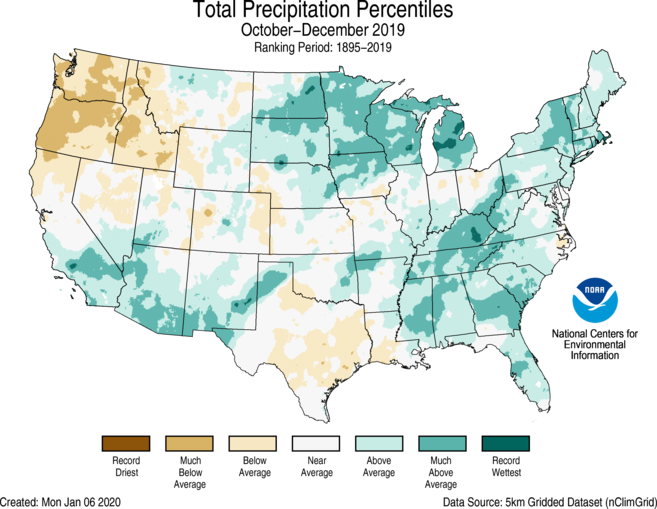
October-December 2019 was drier than normal across the Pacific Northwest into adjacent northern Rockies and northern High Plains, parts of the central High Plains, and parts of Texas. Five states had a rank in the driest third of the 125-year historical record for October-December, including Oregon which ranked seventh driest. Oregon's seventh driest rank, Idaho's eleventh driest, and Washington's 13th driest put the Pacific Northwest region in the top ten driest category with a rank of eighth driest October-December for the region.
|
|
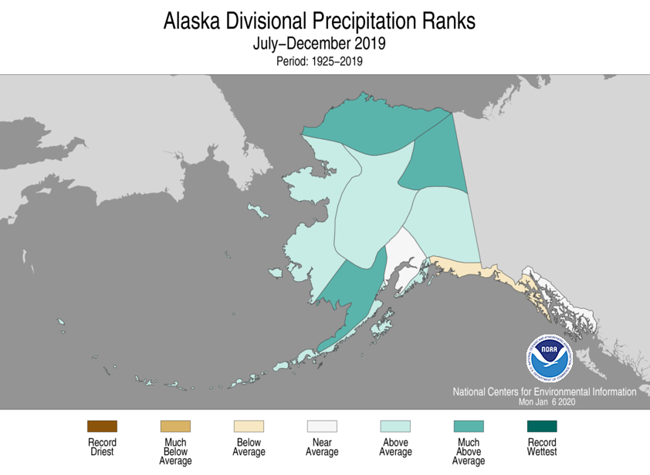
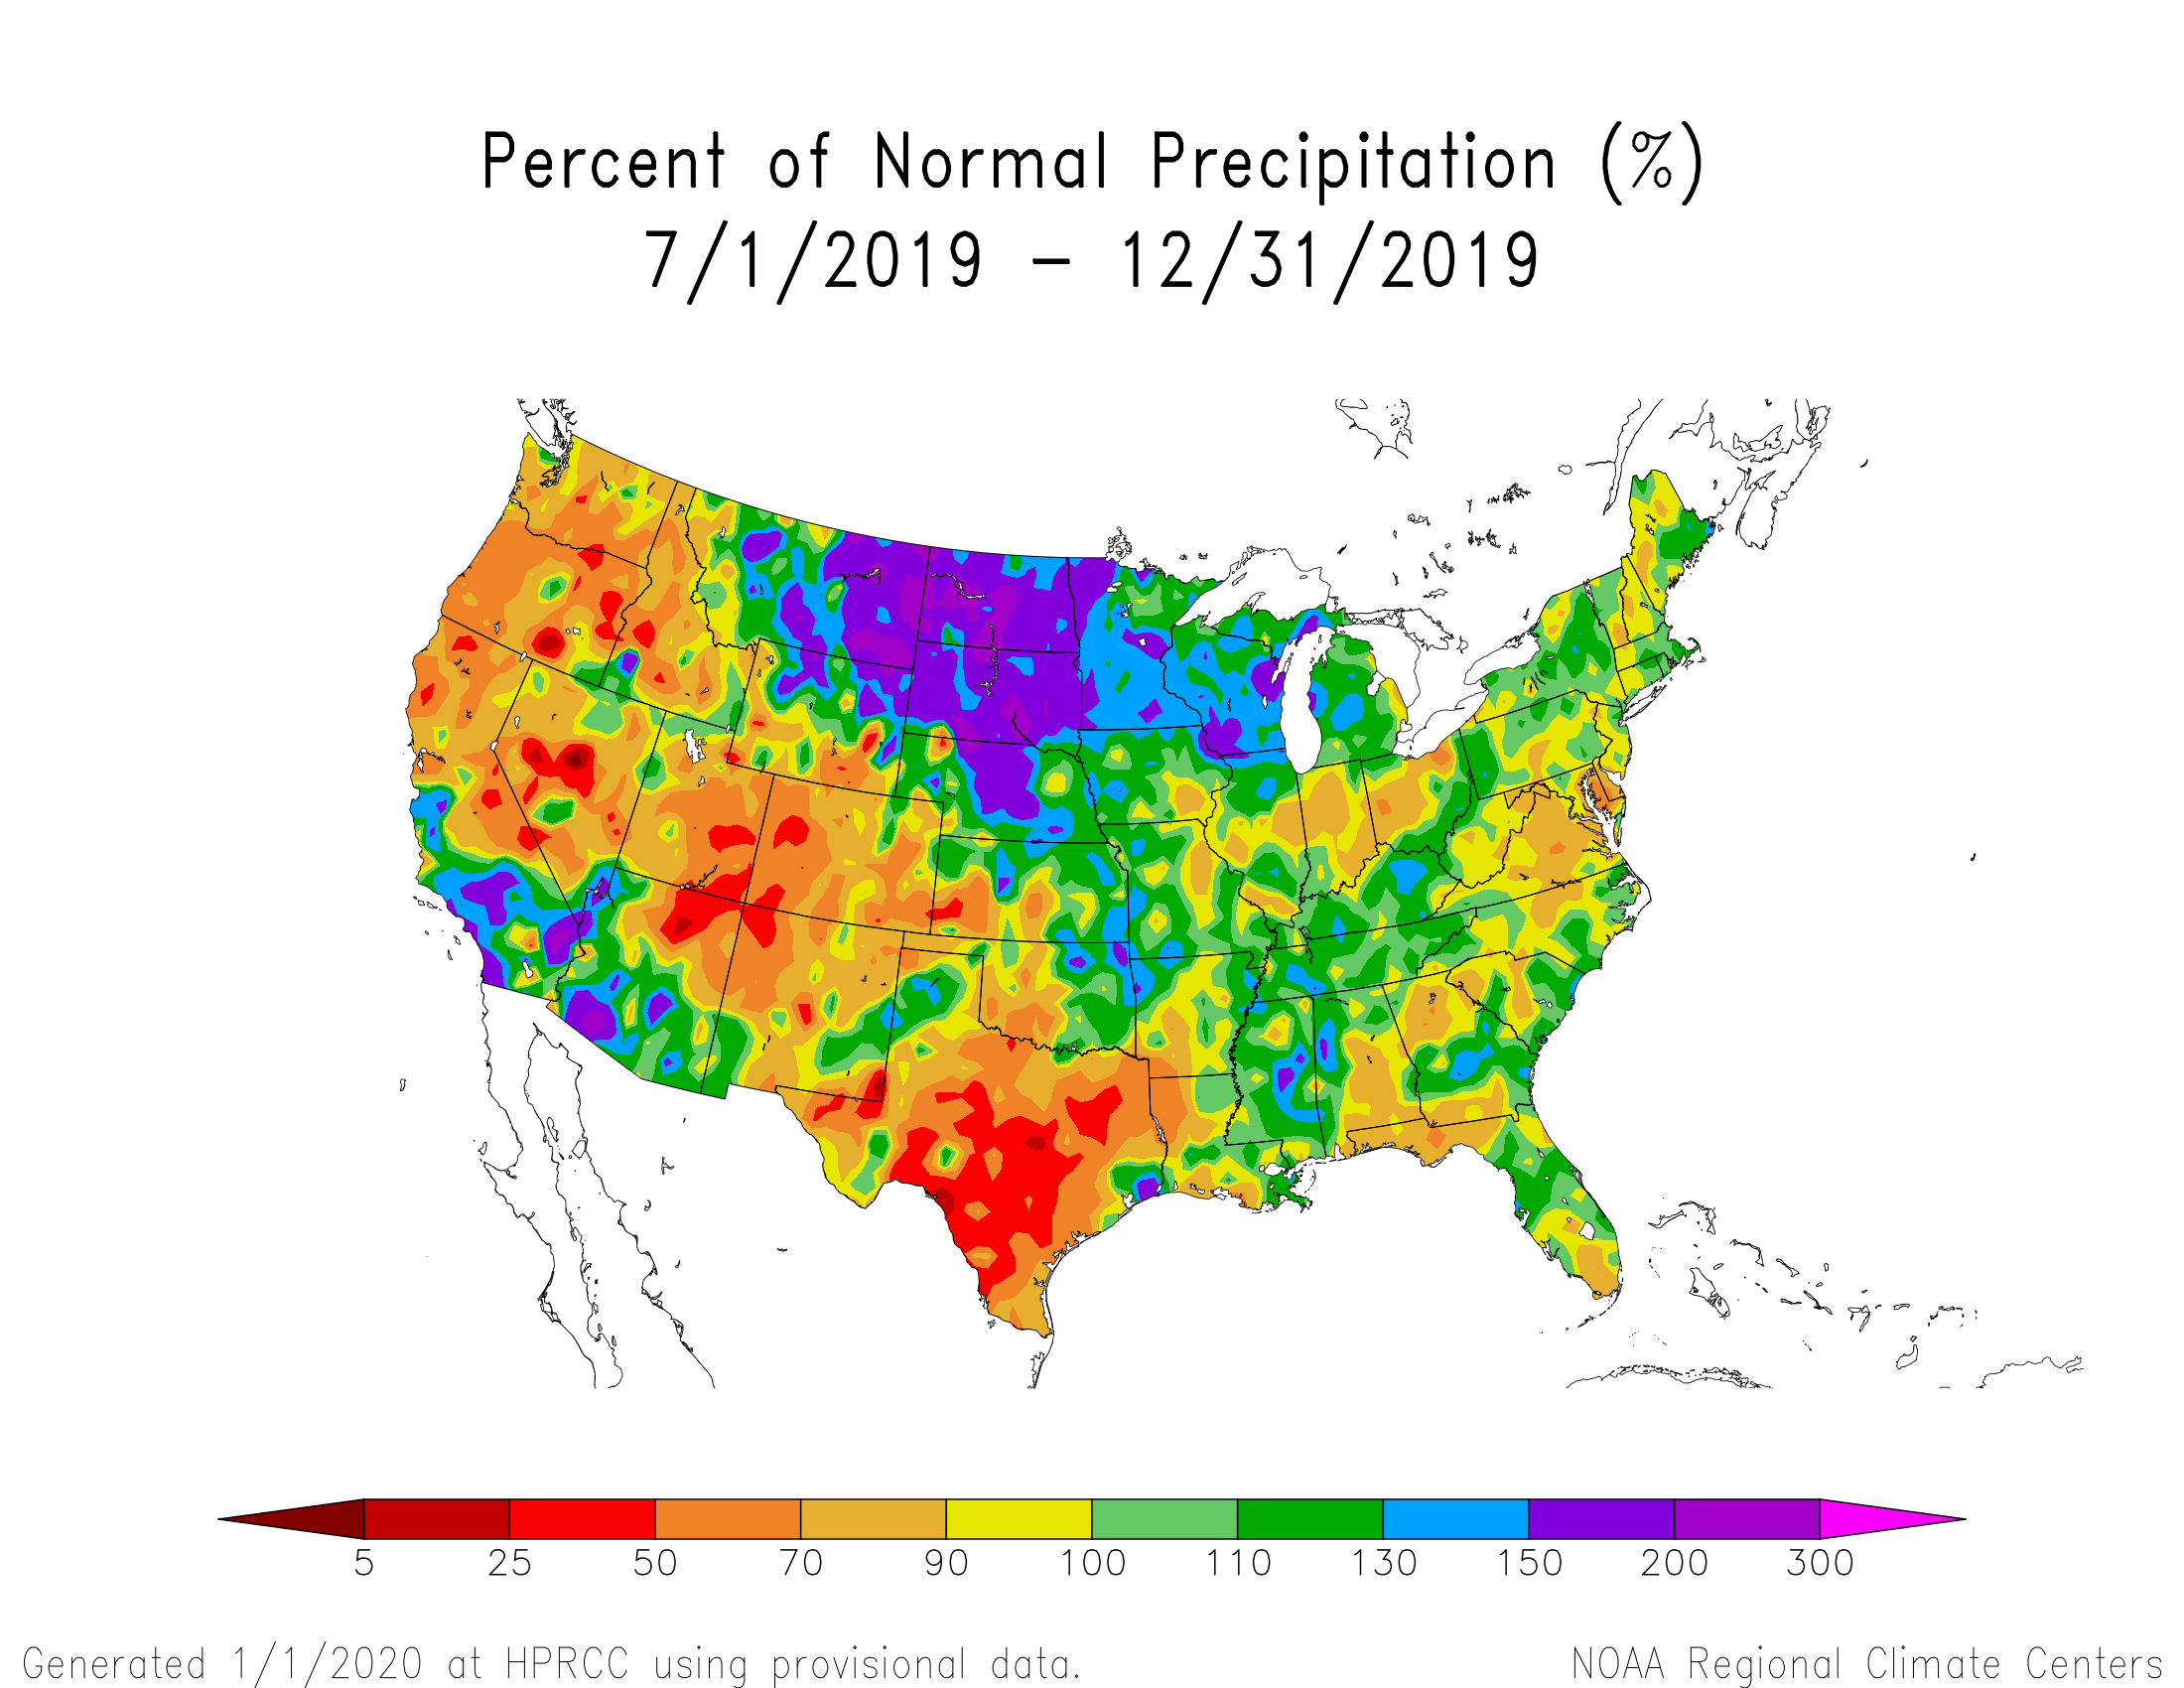
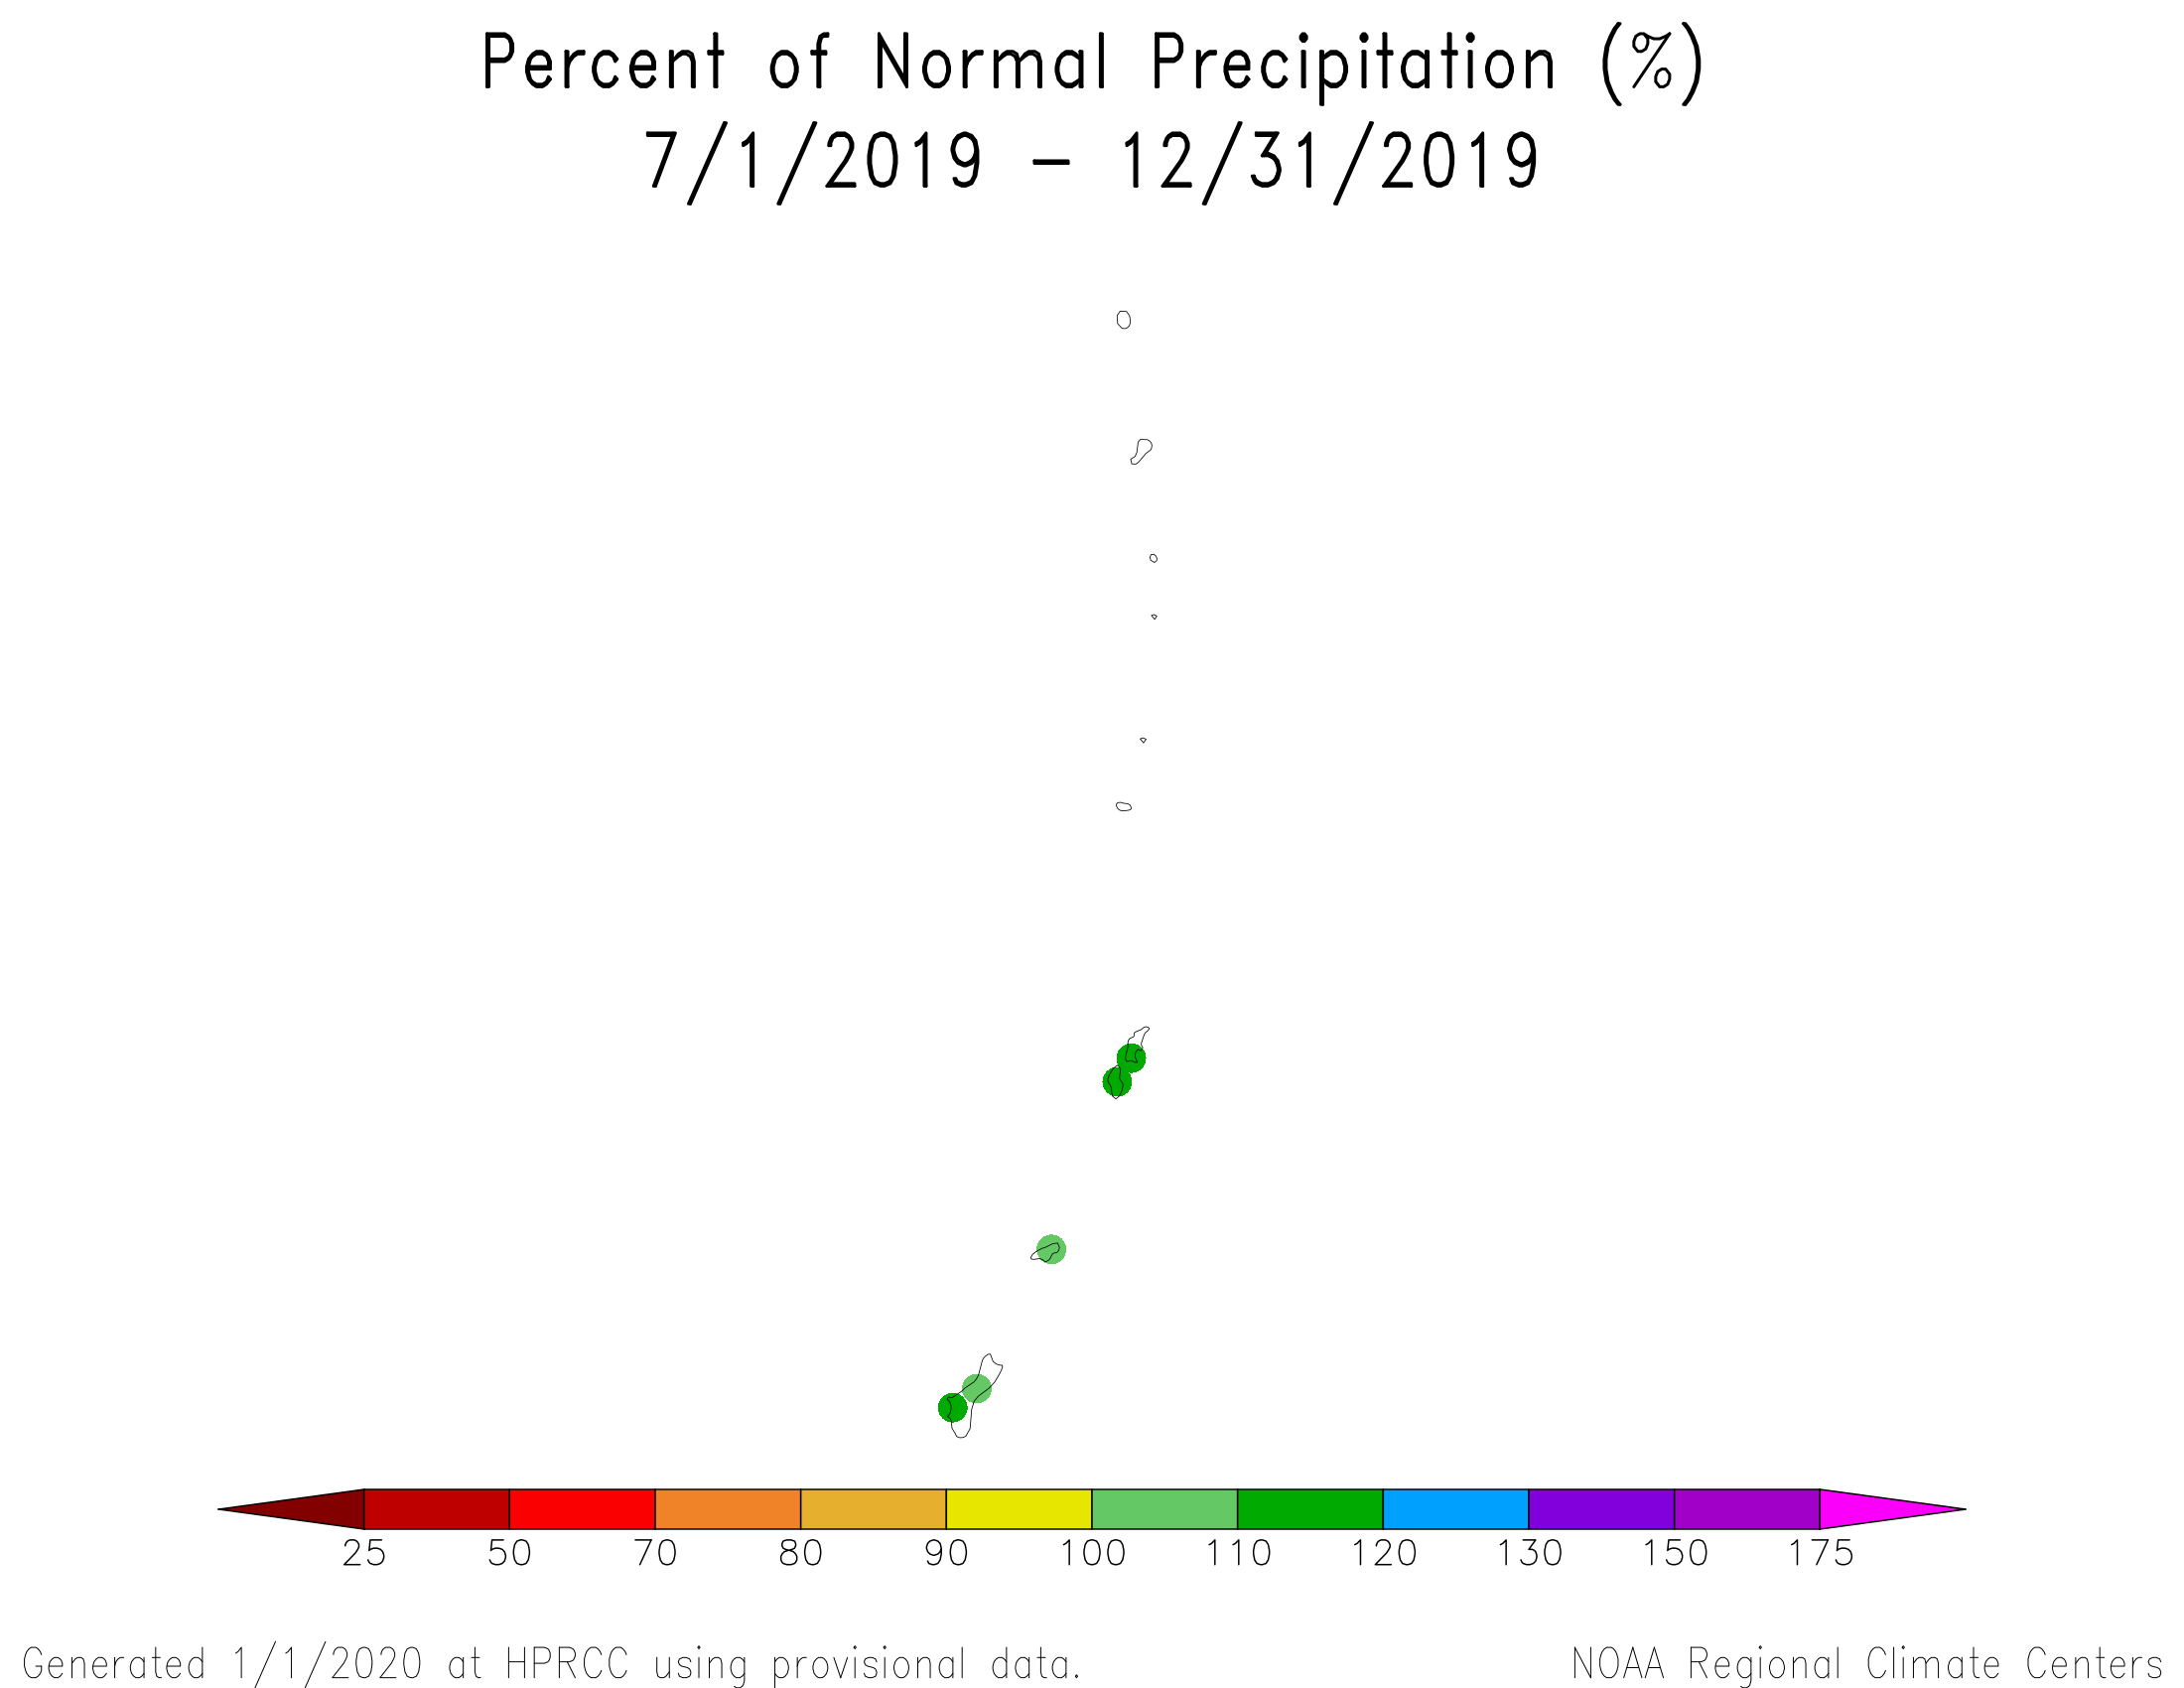
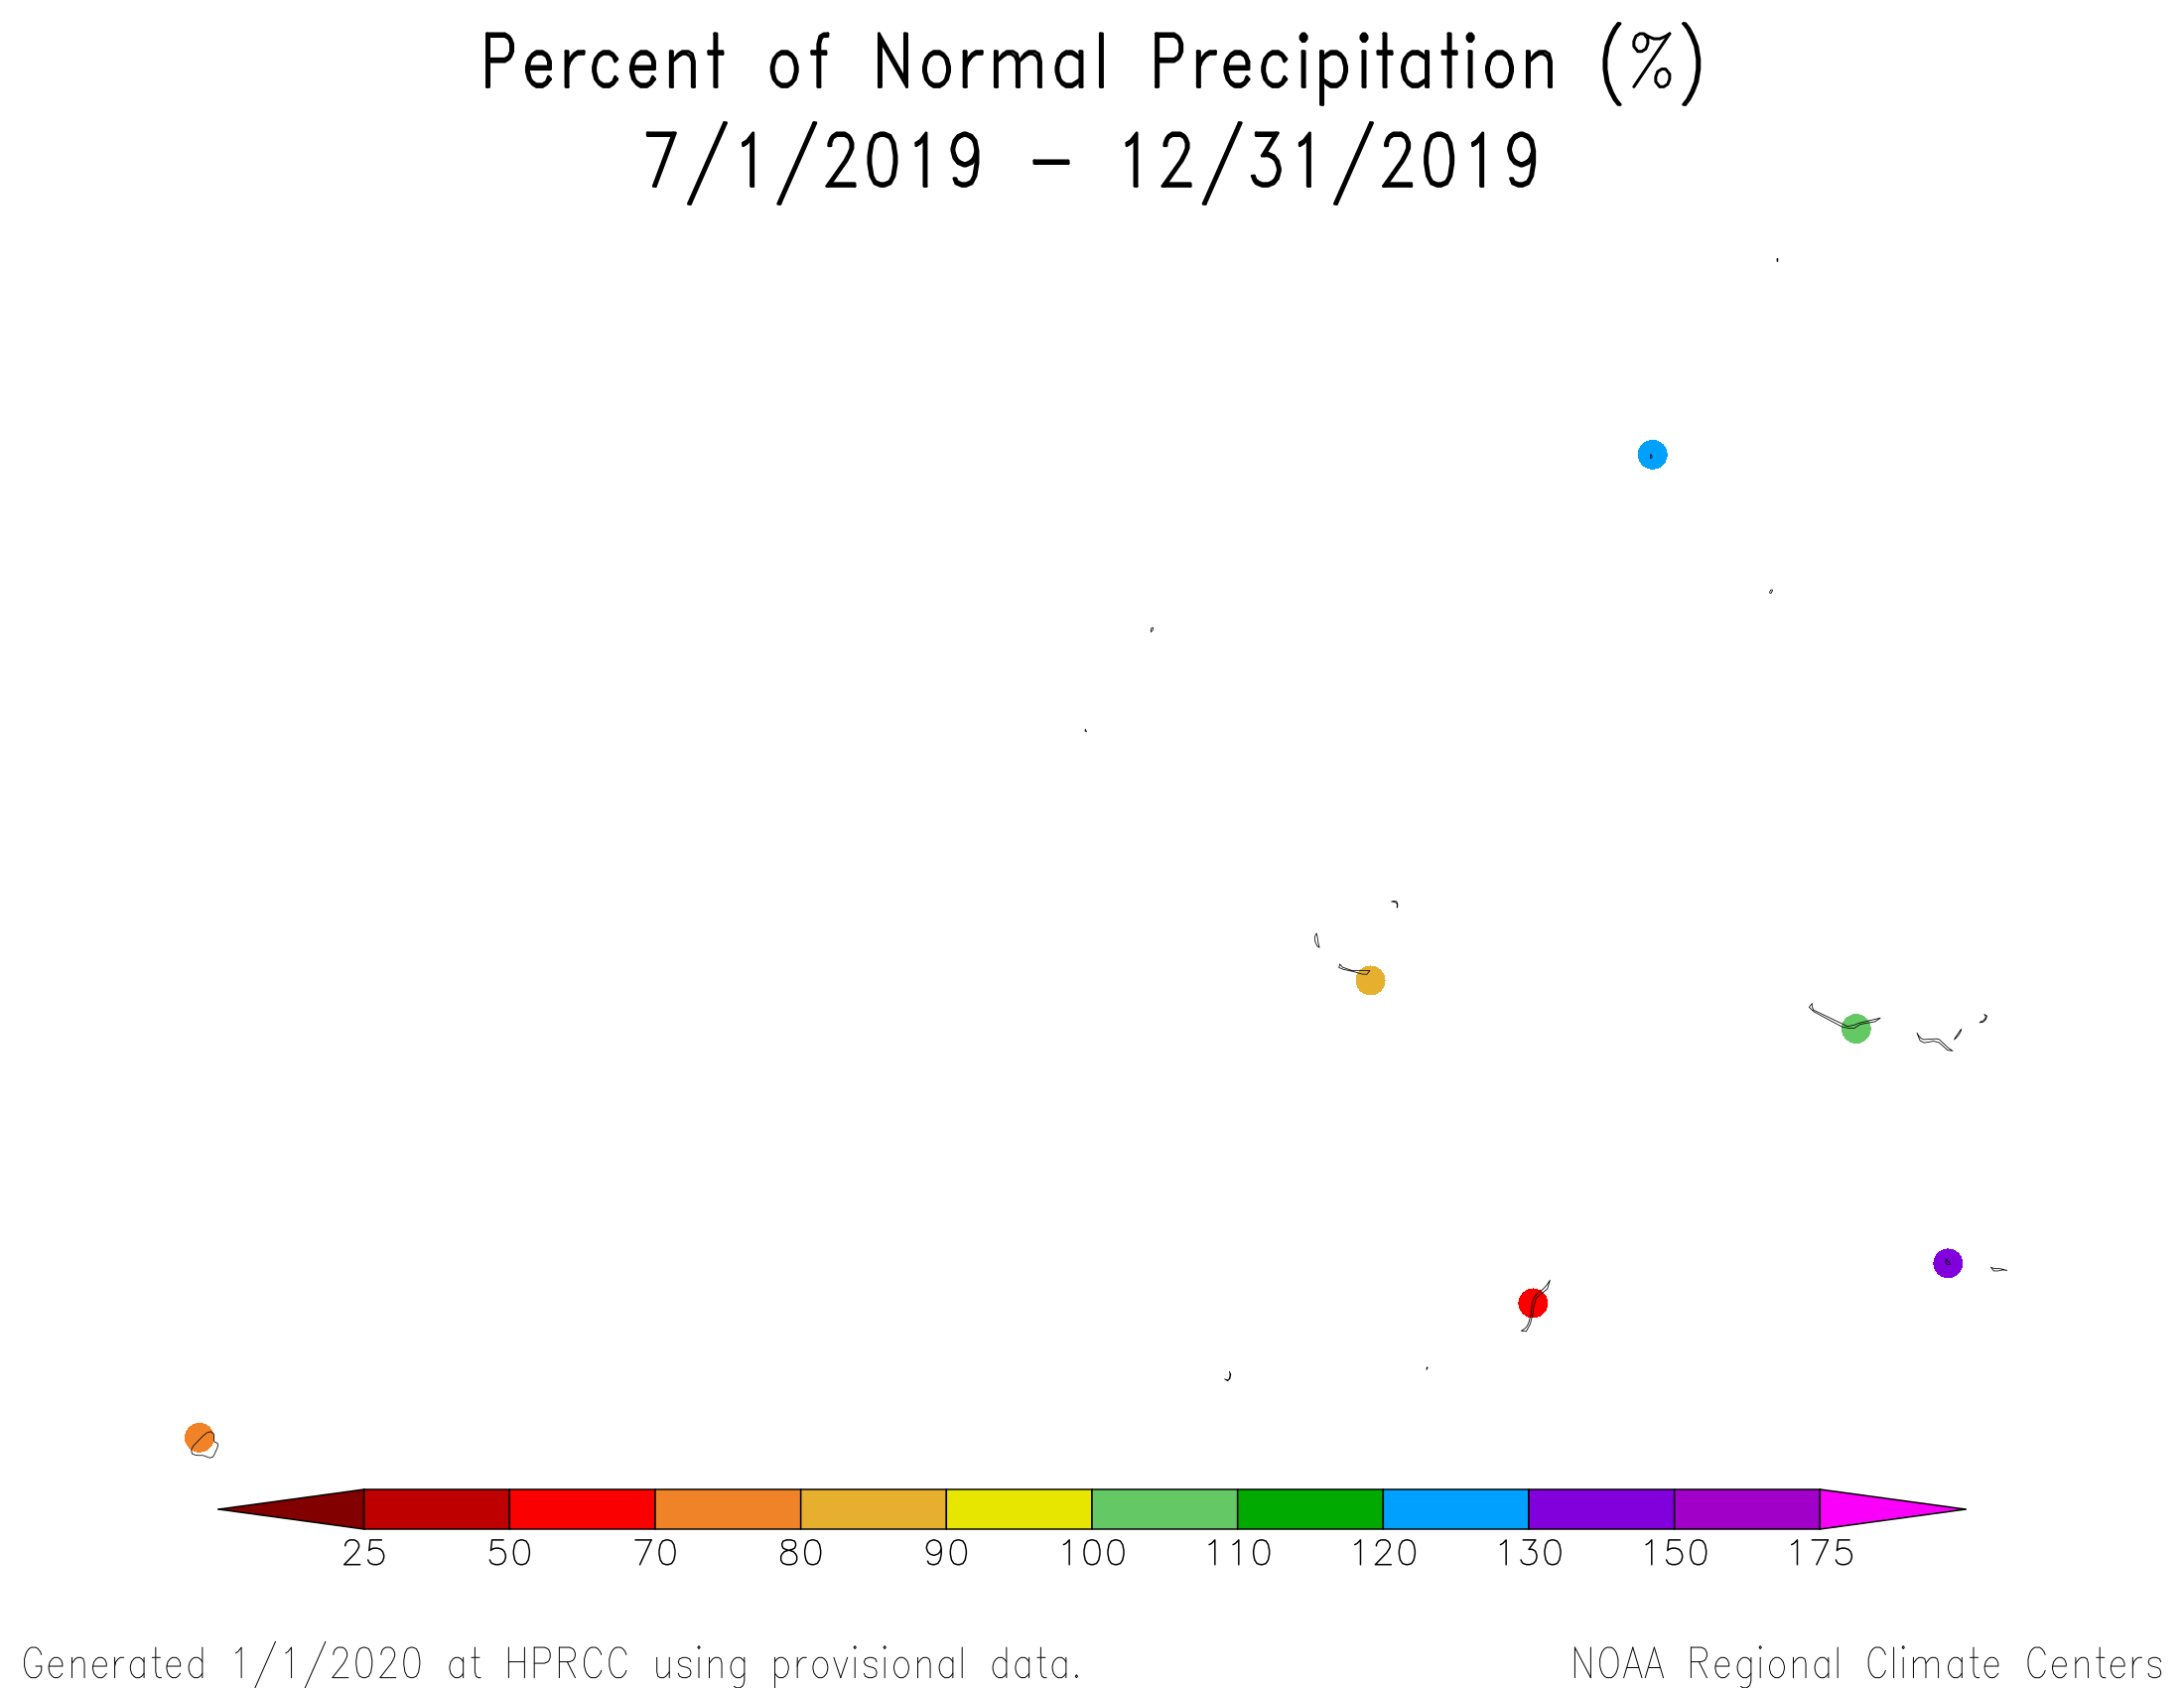
July-December 2019 was drier than normal from the Pacific Northwest to Texas and in parts of the Ohio Valley, Mid-Atlantic region, and Southeast. Ten states had a rank in the driest third of the 125-year historical record for July-December, but none ranked in the top ten driest category.
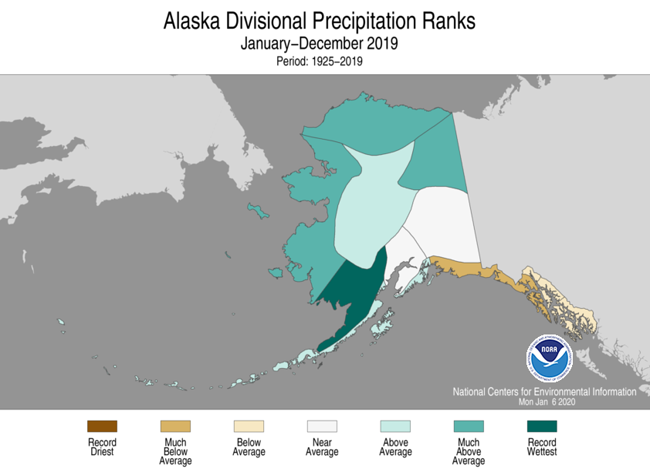
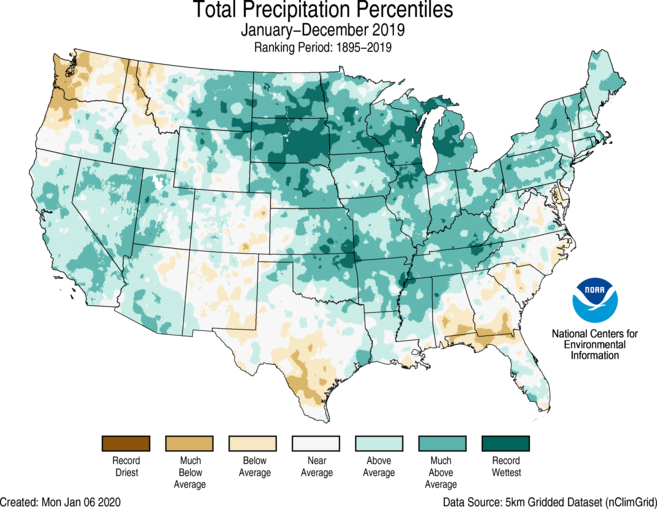
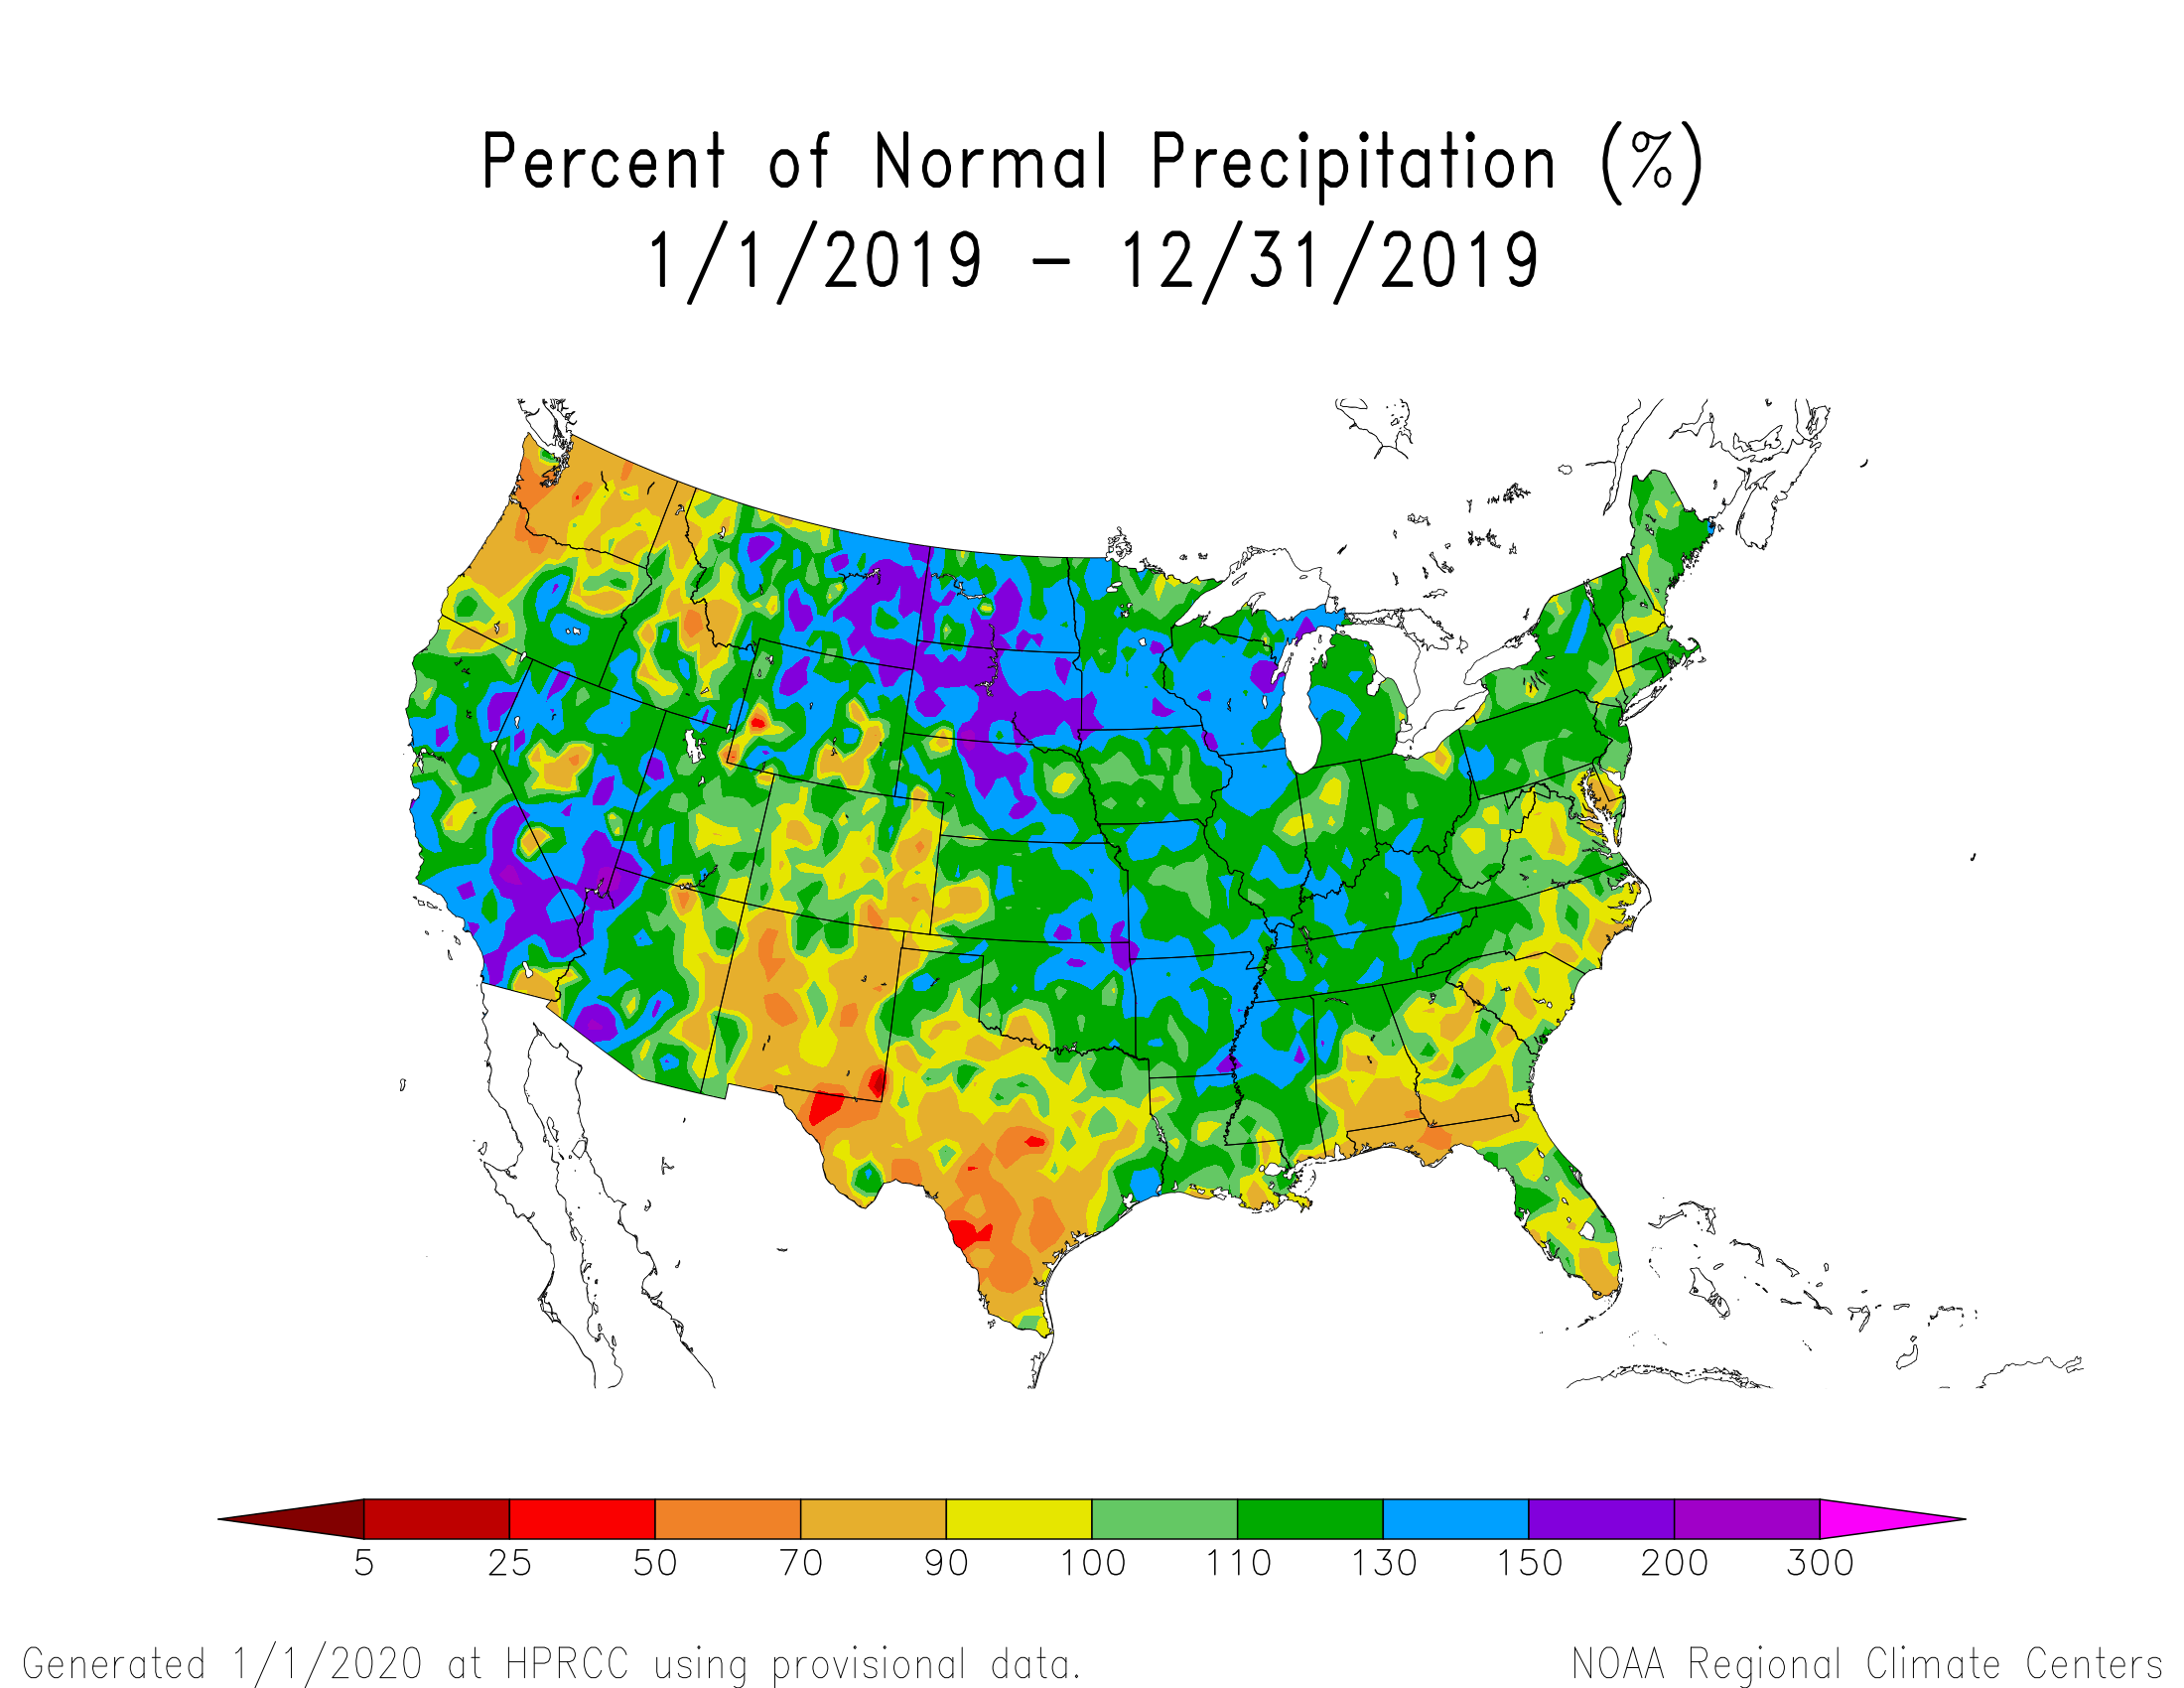
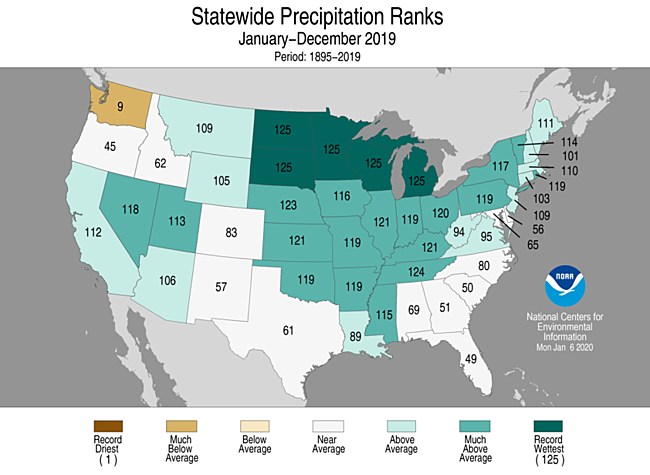
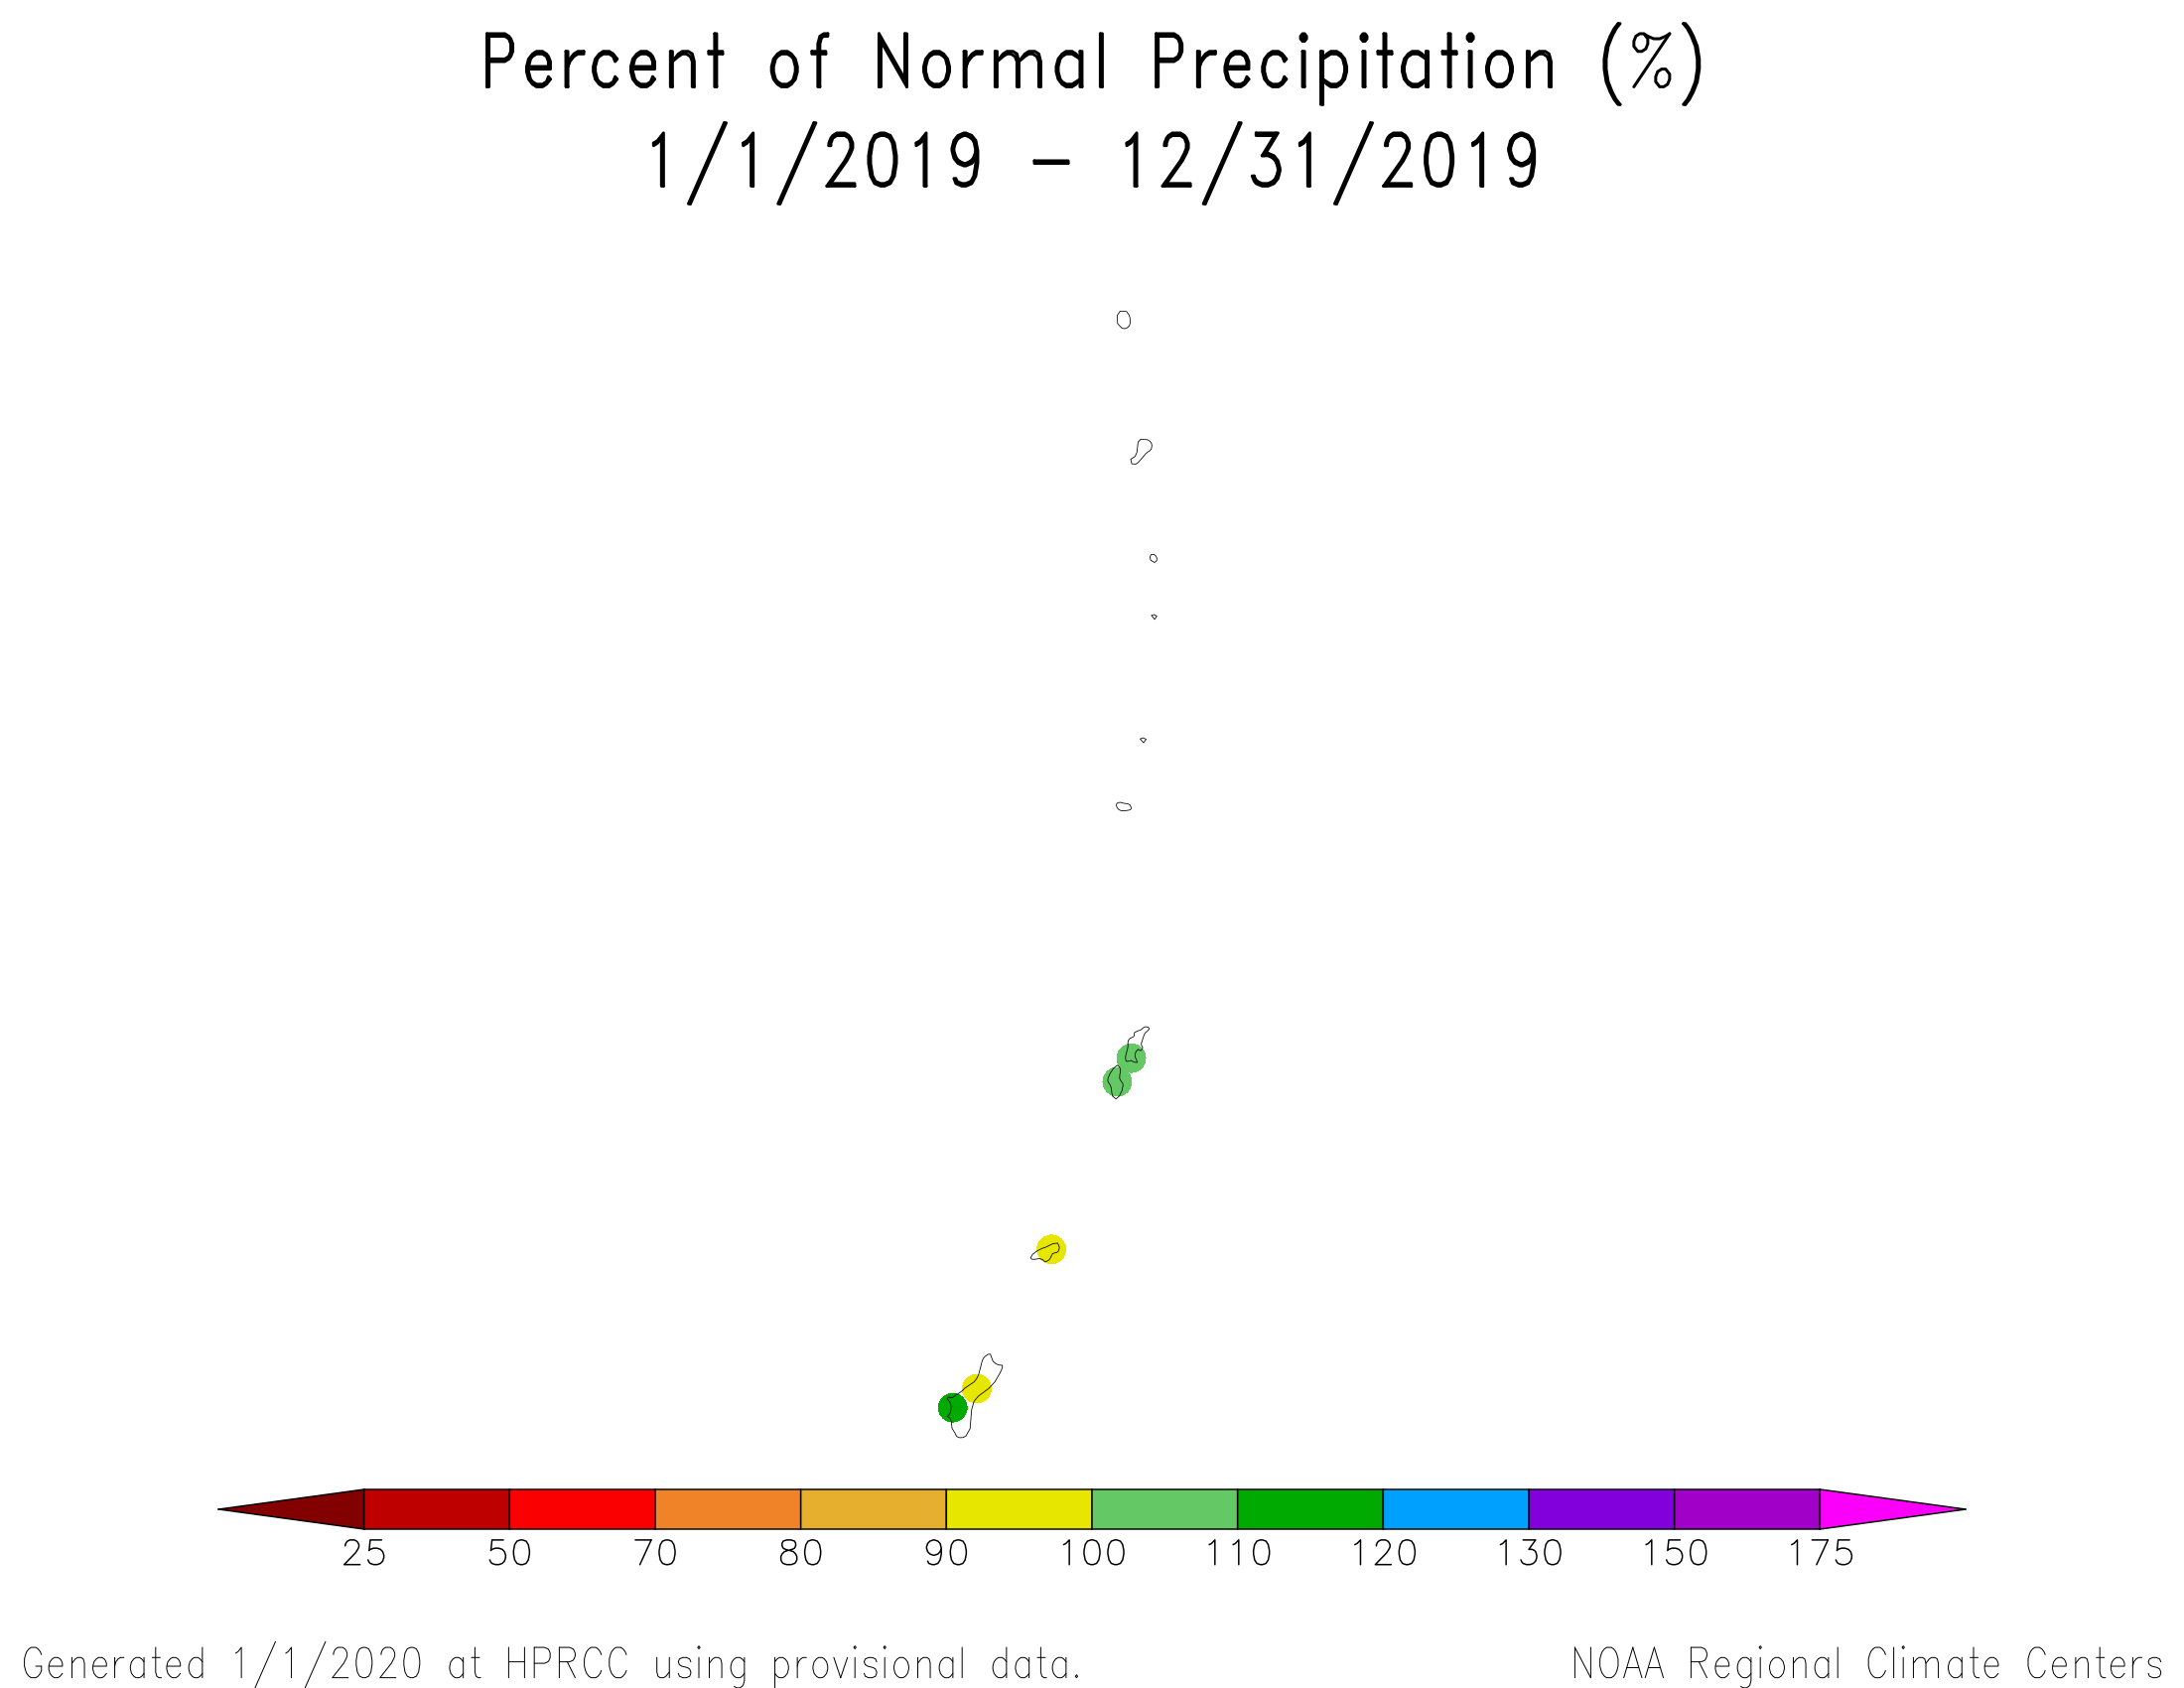
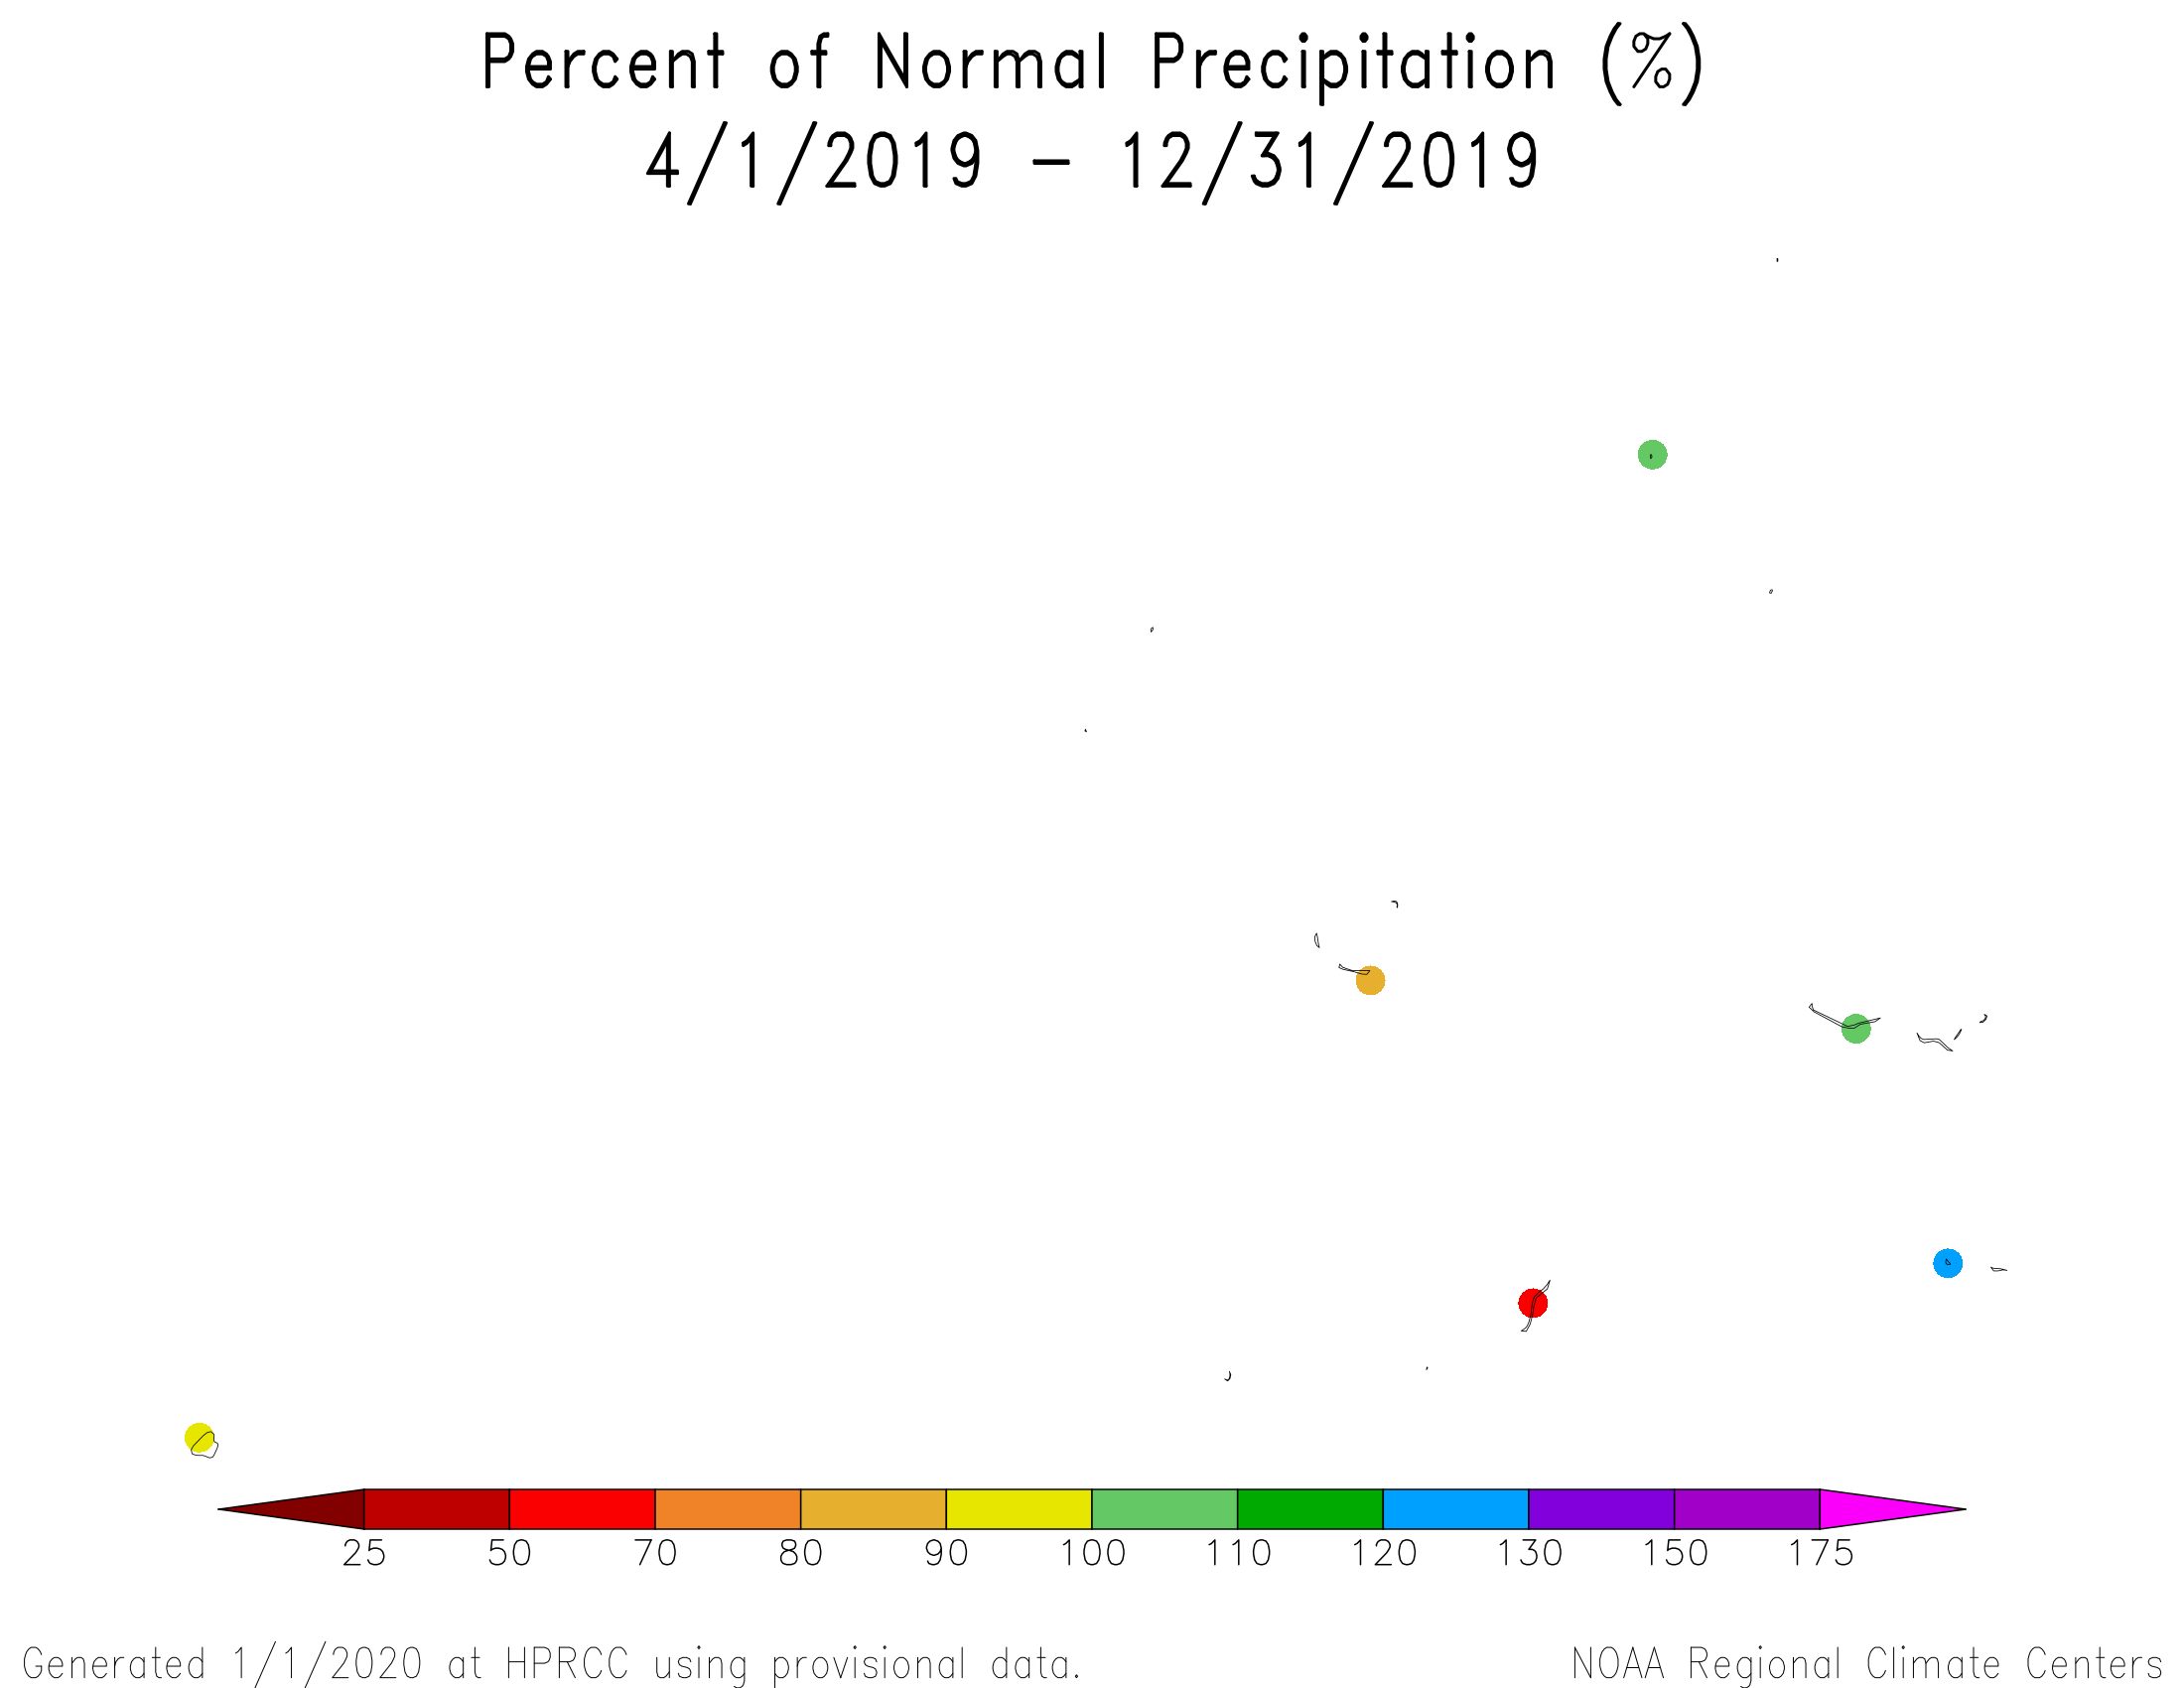
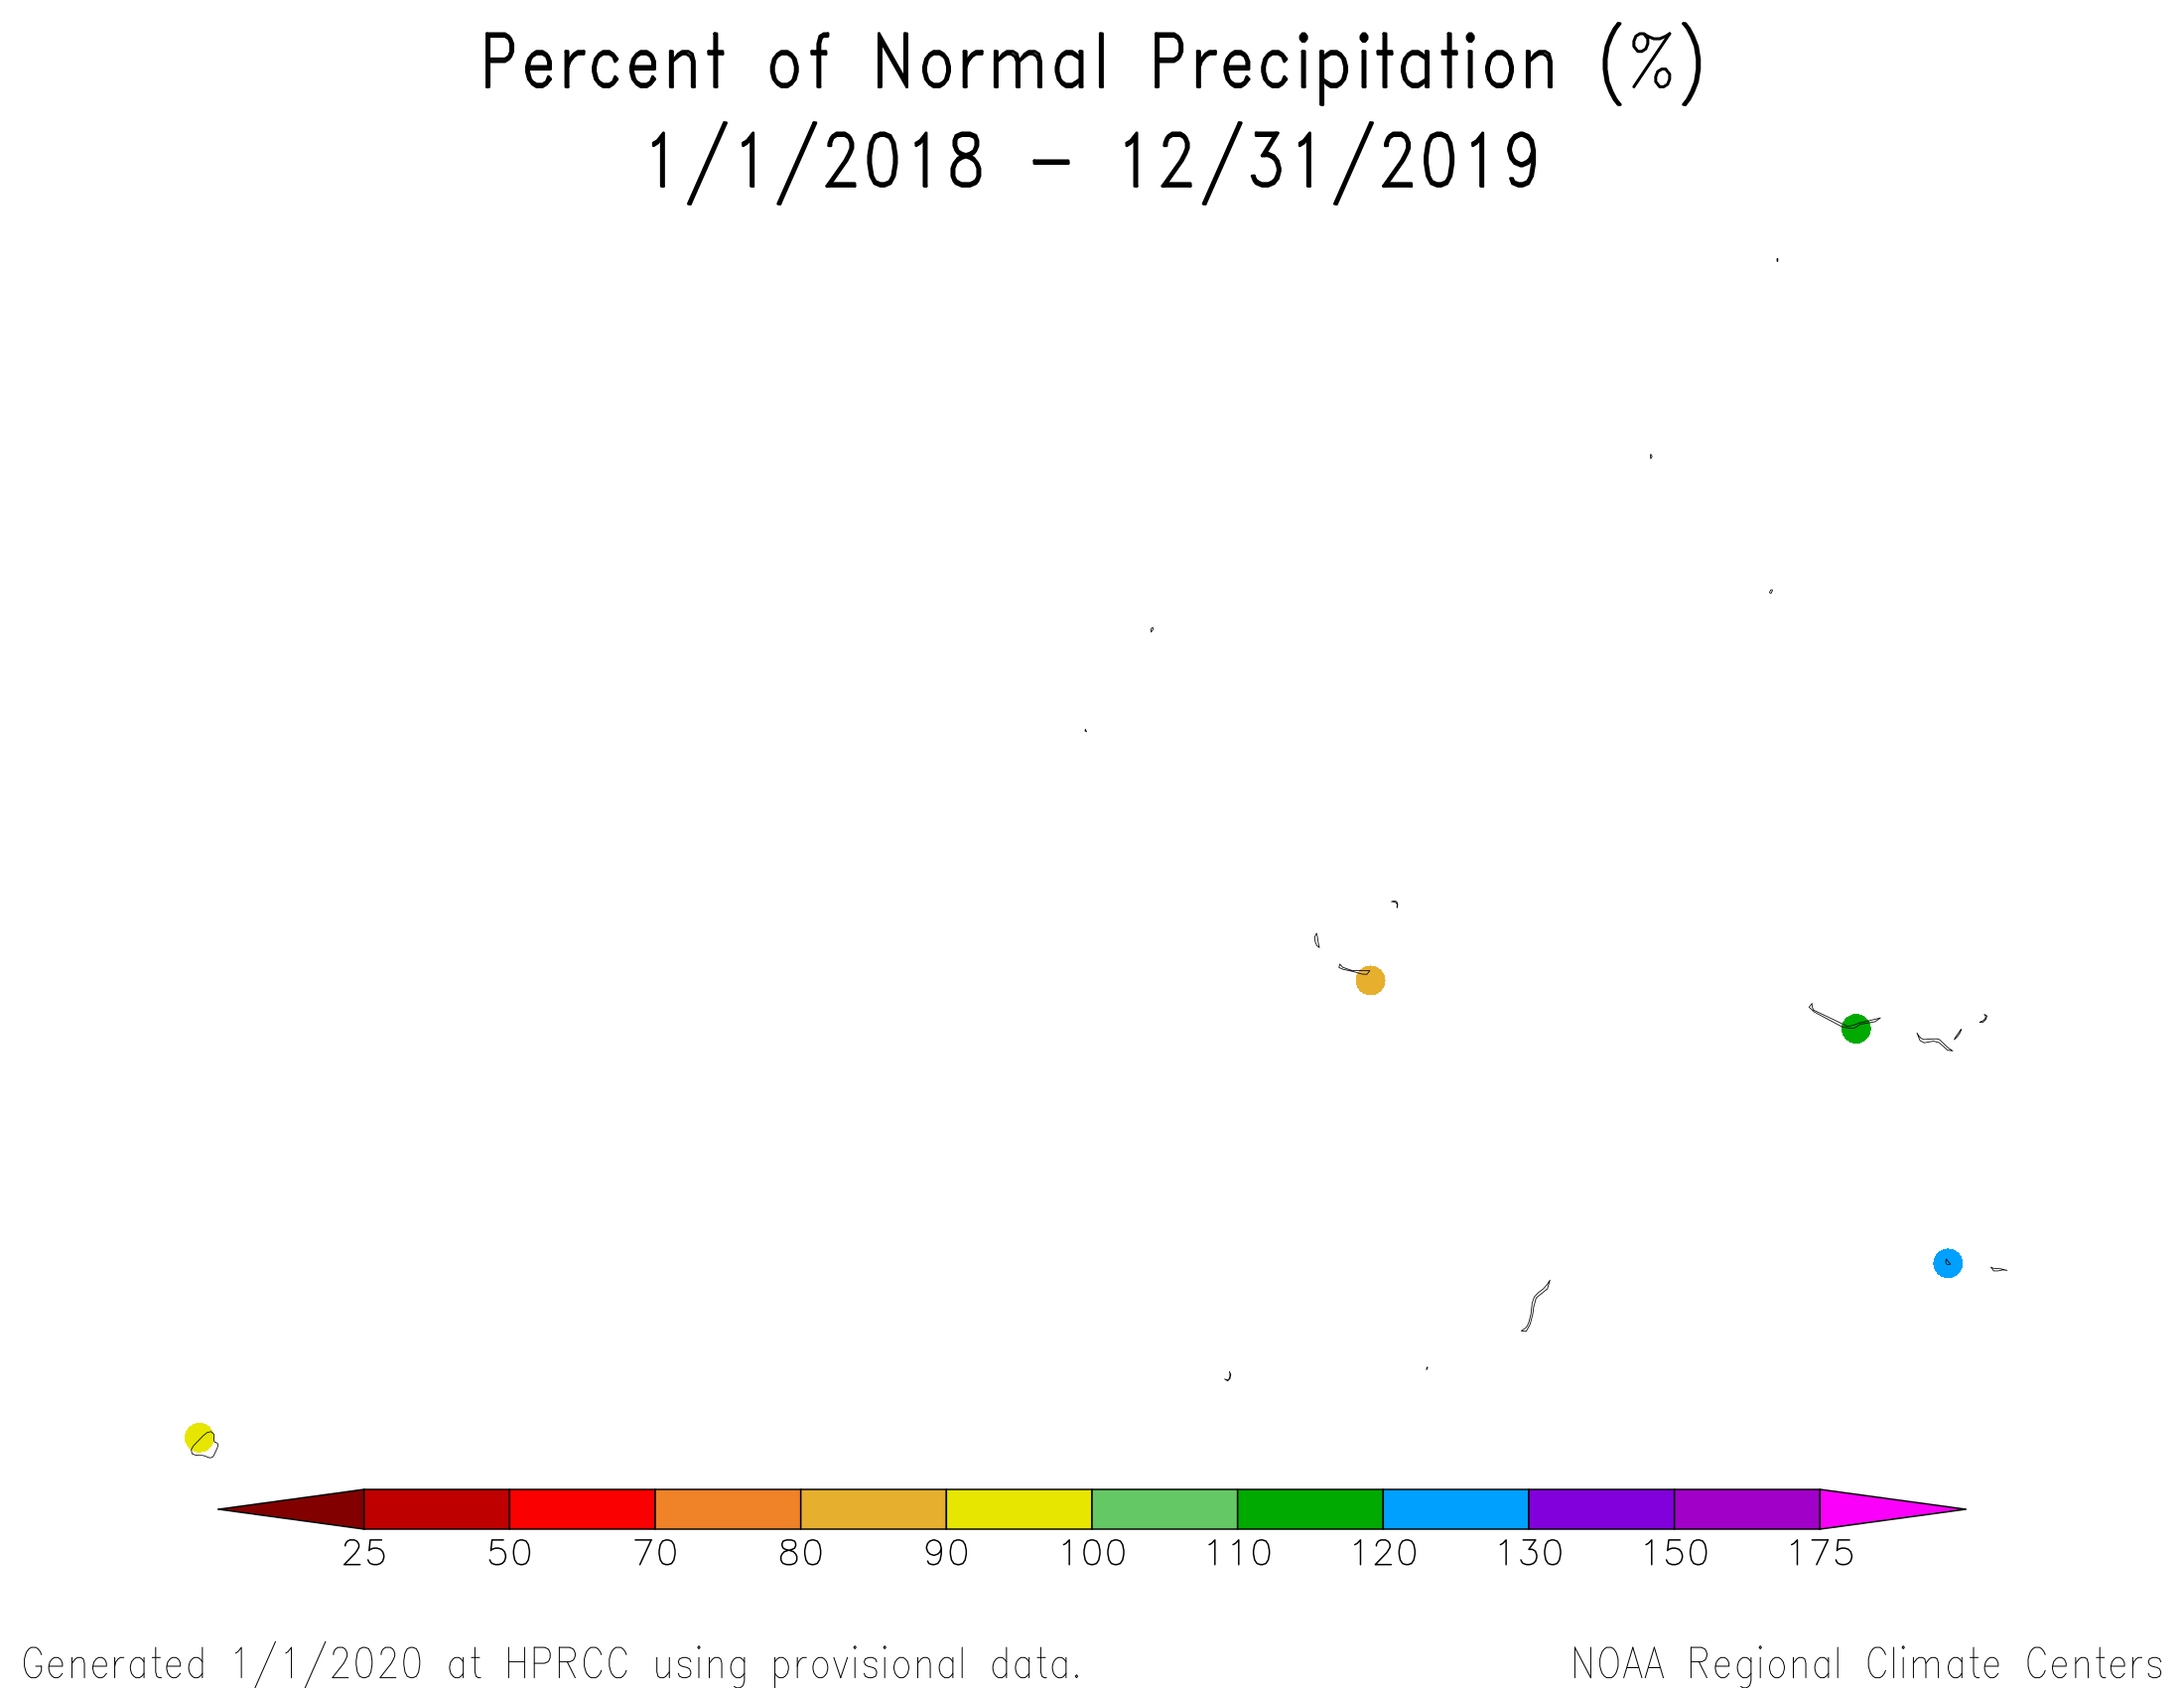
January-December 2019 was drier than normal in Washington to coastal Oregon, in New Mexico and Texas, and in parts of the coastal Southeast. Except for Washington, the dryness was spotty with other parts of the states receiving above-normal precipitation, so Washington was the only state in the CONUS having a dry rank with a rank of ninth driest year on record.
 Primary Hard Red Winter Wheat Belt precipitation, December, 1895-2019.
|
 Primary Hard Red Winter Wheat Belt precipitation, October-December, 1895-2019.
|
During December 2019, the Primary Hard Red Winter Wheat agricultural belt was warmer than normal and much of it was wetter than normal. The month ranked as the 32nd wettest and seventh warmest December, regionwide, in the 1895-2019 record.
October marks the beginning of the growing season for the Primary Hard Red Winter Wheat agricultural belt. October-December 2019 was colder than normal with precipitation having a mixed anomaly pattern. The 3-month period ranked as the 56th wettest and 42nd coldest October-December, regionwide, in the 1895-2019 record.
As of December 31st, drought affected approximately ten percent of winter wheat production, nine percent of cattle inventory, eight percent of hay acreage, two percent of corn production, and one percent of spring wheat production. None of the soybean producing areas were in a drought status as of December 31.
NOAA Regional Climate Centers:
More information, provided by the NOAA Regional Climate Centers and others, can be found below.
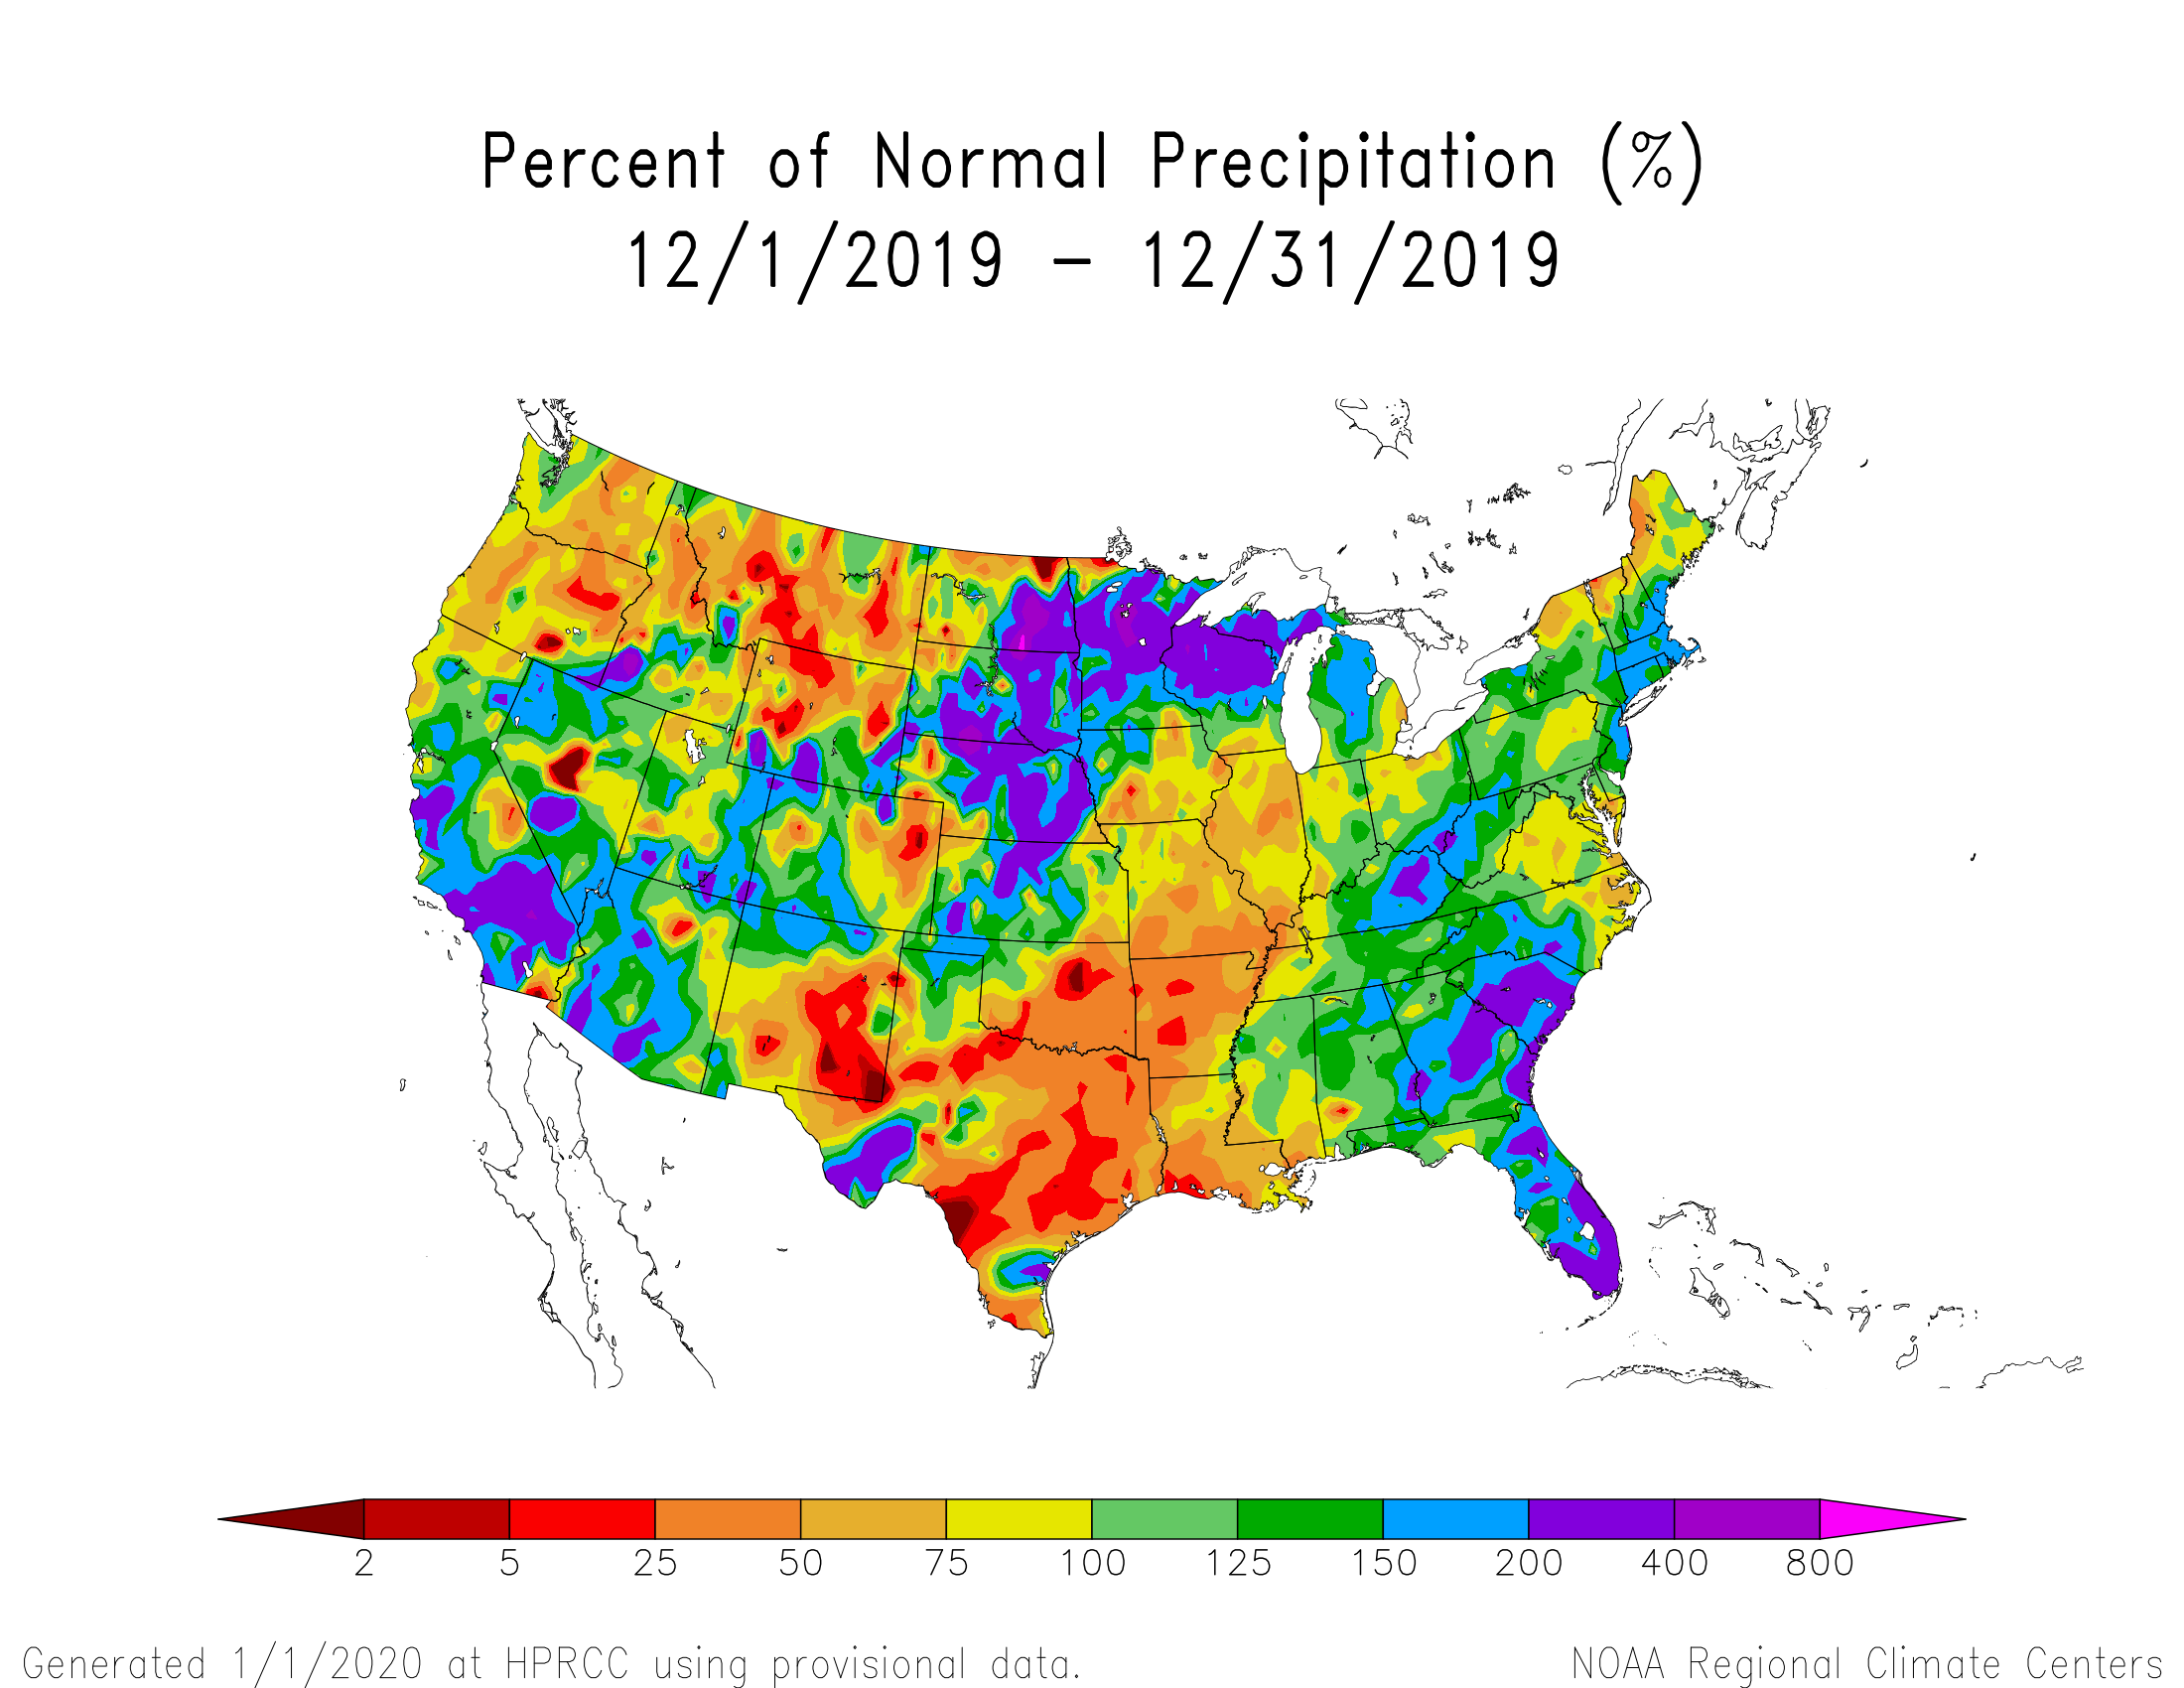
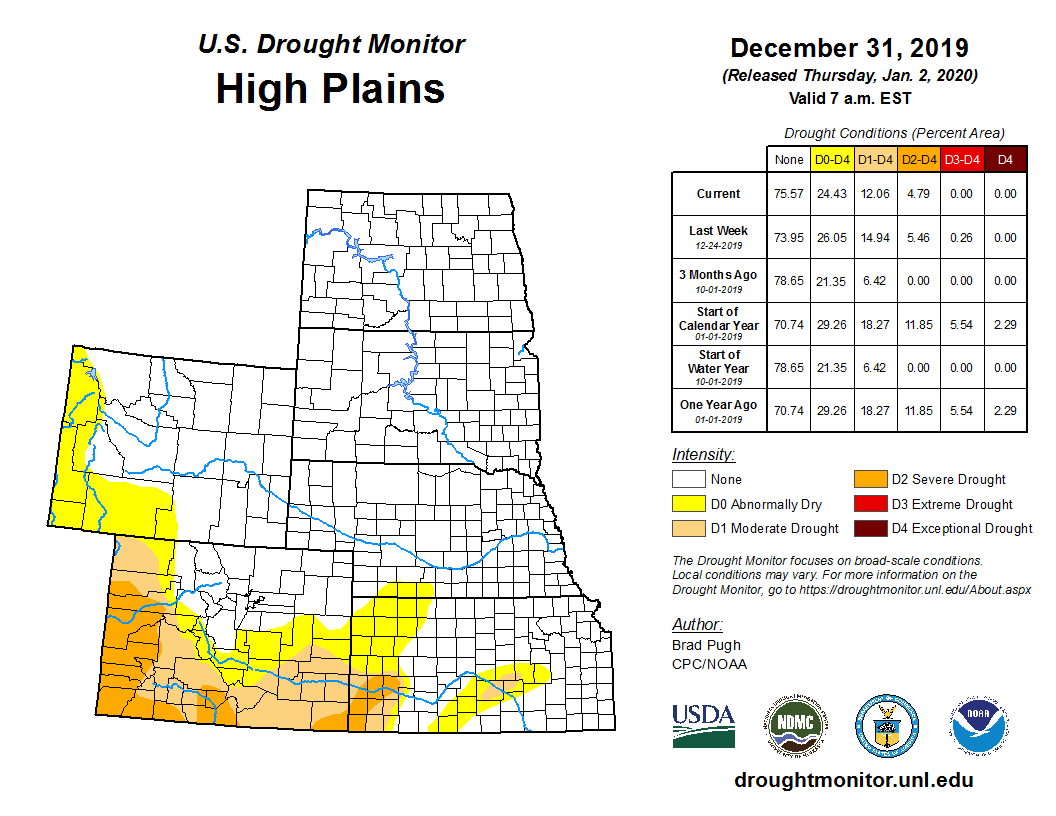
As summarized by the High Plains Regional Climate Center, in contrast to the past couple of months, the start of winter was generally mild for the High Plains region. Precipitation varied quite significantly across the region during the month of December. Across central and northern sections of the High Plains there were areas that observed widespread precipitation amounts of 200 to 400 percent of normal, with embedded pockets where amounts were up to 800 percent of normal. Meanwhile, on the other end of the spectrum, precipitation was much below normal across some portions of eastern Colorado, northern Wyoming, the panhandle of Nebraska, and northern North Dakota. Although precipitation in these areas was less than half of normal, these deficits are not large this time of the year. Mountain snowpack was generally in good shape this month across much of Colorado and Wyoming.
Drought conditions improved or were removed across southern and western portions of the High Plains region during the month of December. According to the USDM, the area experiencing drought (D1-D4) in the High Plains region decreased from approximately 15 percent at the end of November to just over 12 percent by the end of December. This improvement was the result of storm systems bringing wetter conditions to the western portion of the High Plains region in December. This month, abnormally dry conditions (D0) shrank across portions of western Kansas and central and eastern Colorado. There was some expansion of D0 conditions across western Wyoming, with a small area of D0 remaining in far southwestern Nebraska. Some improvement was observed over northern Colorado during the month, with a slight reduction of abnormally dry conditions in this area. Meanwhile, across southern Colorado and western Kansas, moderate drought (D1) and severe drought (D2) decreased in area through the month of December. A small pocket of extreme drought (D3) that had developed across southwestern Kansas during October and November was removed by the end of December. The remainder of the region remained free of drought and abnormally dry conditions. As of the December 31st release of the USDM, both Nebraska and South Dakota were drought-free all of 2019.
As explained by the Southern Regional Climate Center, temperatures for the month of December were above normal across the Southern region while precipitation values varied spatially across the region. At the end of December, drought conditions both improved and deteriorated across the Southern region. Extreme drought conditions persisted across southwestern Texas, while areas in central Texas experienced development of extreme drought conditions. Severe drought classifications were still present in central and southern Texas as well as southwestern and extreme western Oklahoma, while new areas developed in southwestern Arkansas and eastern Texas. Moderate drought classifications decreased across southwestern and extreme western Oklahoma, northern Texas, northeastern Louisiana, and west-central Texas, while new areas developed in eastern and southeastern Texas, southwestern Arkansas, and northwestern Louisiana. There was an increase in the overall area experiencing abnormally dry conditions despite improvement across southwestern and extreme western Oklahoma, central Tennessee, and extreme western Tennessee. This was due to an increase in abnormally dry conditions across southeastern and eastern Texas, southern, north-central, and northwestern Louisiana, southwestern Mississippi, and southwestern Arkansas.
As described by the Midwest Regional Climate Center, December temperatures were above normal for nearly the entire Midwest. December precipitation was above normal in the upper Midwest and in the Ohio River Valley. Values were drier than normal in all of Illinois, along with most of Missouri and Iowa, and parts of other states. The driest areas were in southern Missouri where totals were less than half of the normal December totals.
As noted by the Southeast Regional Climate Center, temperatures were much above average across the Southeast and Puerto Rico for the month of December. The Southeast was exceptionally wet in December, except for Virginia, eastern North Carolina and Mobile, AL. Parts of Puerto Rico also reported below-normal precipitation, with St. Croix (1951-2019) observing only 1.8 inches (46 mm) of rain.
Overall drought conditions have improved for the month of December, with no areas of severe drought (D2). By the end of the month, drought conditions were gone from Virginia, North Carolina, South Carolina, Georgia, and Alabama. There were pockets of moderate drought (D1), ringed by an area of dry conditions (D0), in the Panhandle and southern parts of Florida. Puerto Rico also developed an area of moderate drought (D1), ringed by an area of dry conditions (D0) in the eastern half of the country. The majority of wheat and winter forages were in good condition due to the rainfall and warm temperatures throughout Alabama and Georgia. However, some cattle producers still needed to supplement with hay and feed. Hay was in short supply due to the drought conditions that hurt pastures in autumn. In Florida, several pastures in the Panhandle received some frost damage at the beginning of the month. However, the warm weather toward the end of the month allowed vegetable growers to prepare land for spring plantings and allowed for citrus grove operations to be normal for this time of the year. The late season rainfall and high humidity in North Carolina delayed the harvest of the remaining soybean fields and limited field work. However, in South Carolina winter greens were being harvested and in good condition due to the adequate rainfall and mild temperatures. The persistent dry conditions early this winter, have resulted in damage to some pastures and feeding areas in Virginia.
As explained by the Northeast Regional Climate Center, the Northeast was warmer and generally wetter than normal. The USDM released on December 5 showed 2 percent of the region as abnormally dry. These areas included southern New Jersey, southeastern Pennsylvania, parts of Delaware, and southern and eastern Maryland. Conditions improved during the month for most areas, with abnormal dryness easing in southern New Jersey and southeastern Pennsylvania by December 10 and in southern Maryland by December 17. However, abnormal dryness lingered in eastern Maryland and southern Delaware through month's end. The December 31, 2019 USDM released on January 2, 2020, showed less than 1 percent of the region as abnormally dry.
As summarized by the Western Regional Climate Center, an equatorward displacement of the Pacific storm track and persistent trough in the eastern North Pacific Ocean favored active weather and anomalous moisture transport into the southwestern United States during December of 2019. Above average precipitation and drought amelioration occurred as a result in California, Nevada, and parts of Arizona. However, below average precipitation worsened drought conditions in Washington and Oregon and triggered drought onset in Idaho. Snowpack in the Pacific Northwest and northern Rockies was well below average at the end of December with most stations reporting less than 80% of 1981-2010 median conditions with many Cascade and Blue Mountain locations reporting 0-25% of median.
The Hawaiian Islands continued to experience record warm average temperatures as sea surface temperature anomalies remained above average. Precipitation was below average on all islands except Oahu. Precipitation anomalies varied throughout Alaska during December.
U.S.-Affiliated Pacific Islands
The NOAA National Weather Service (NWS) offices, the Pacific ENSO Applications Climate Center (PEAC), and partners provided reports on conditions across the Pacific Islands.
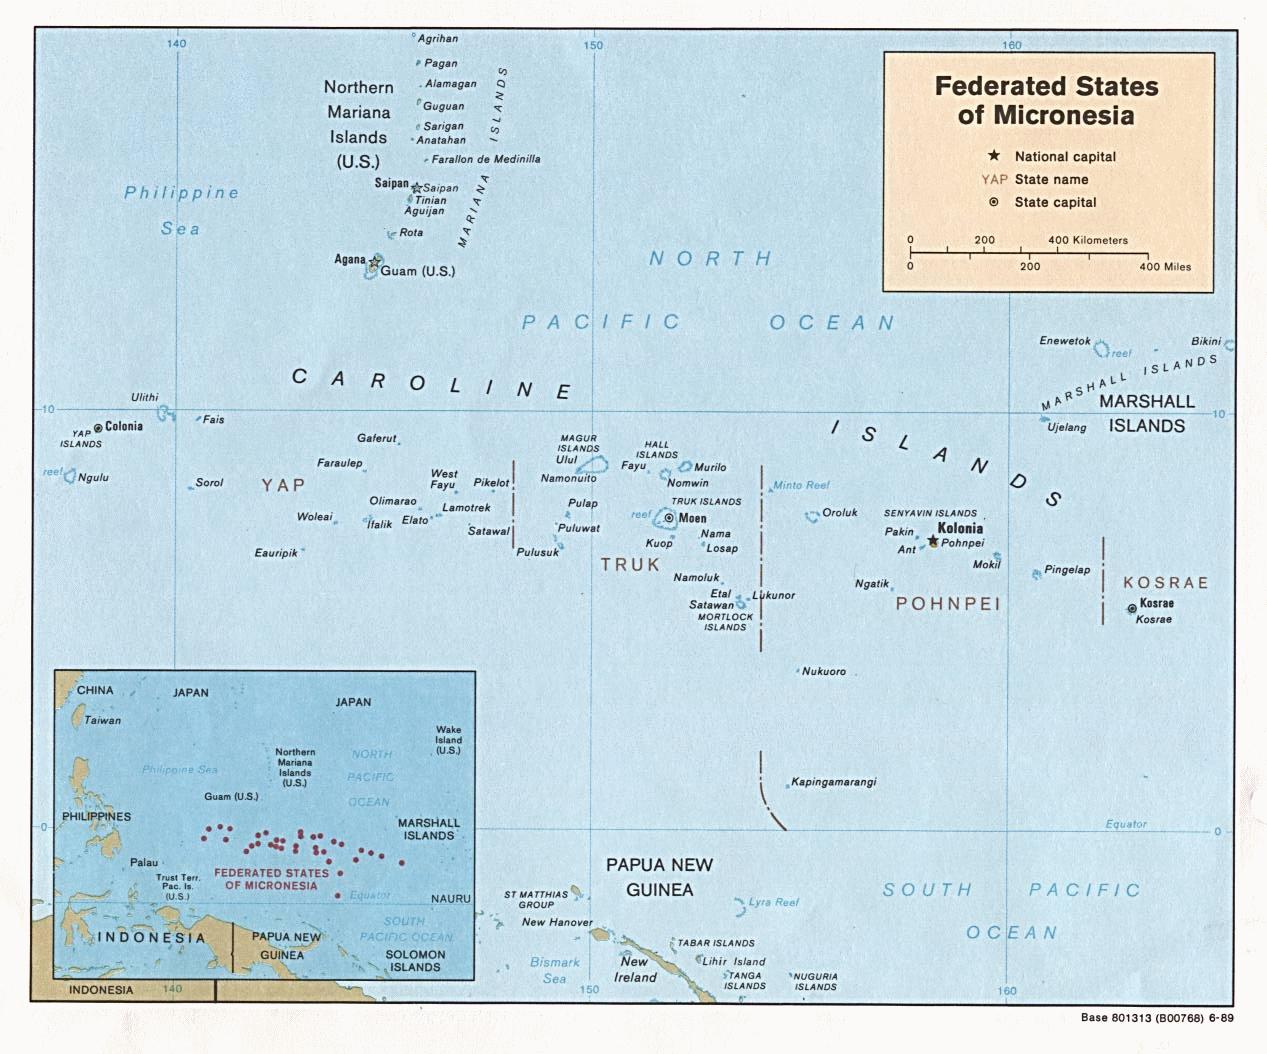
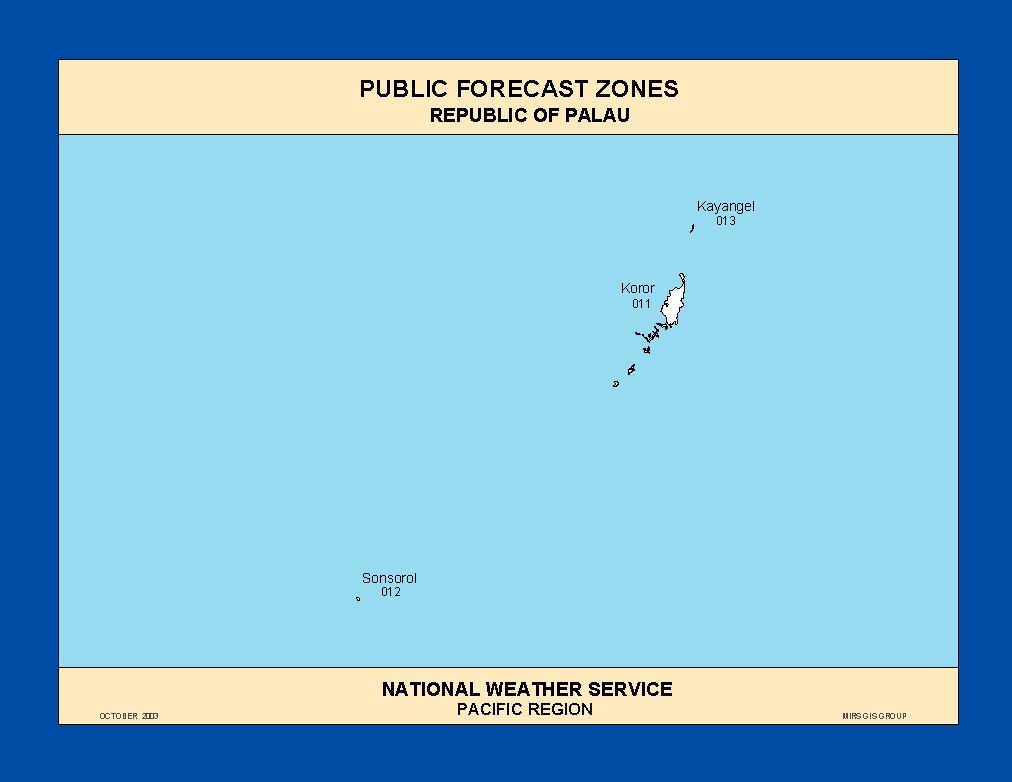
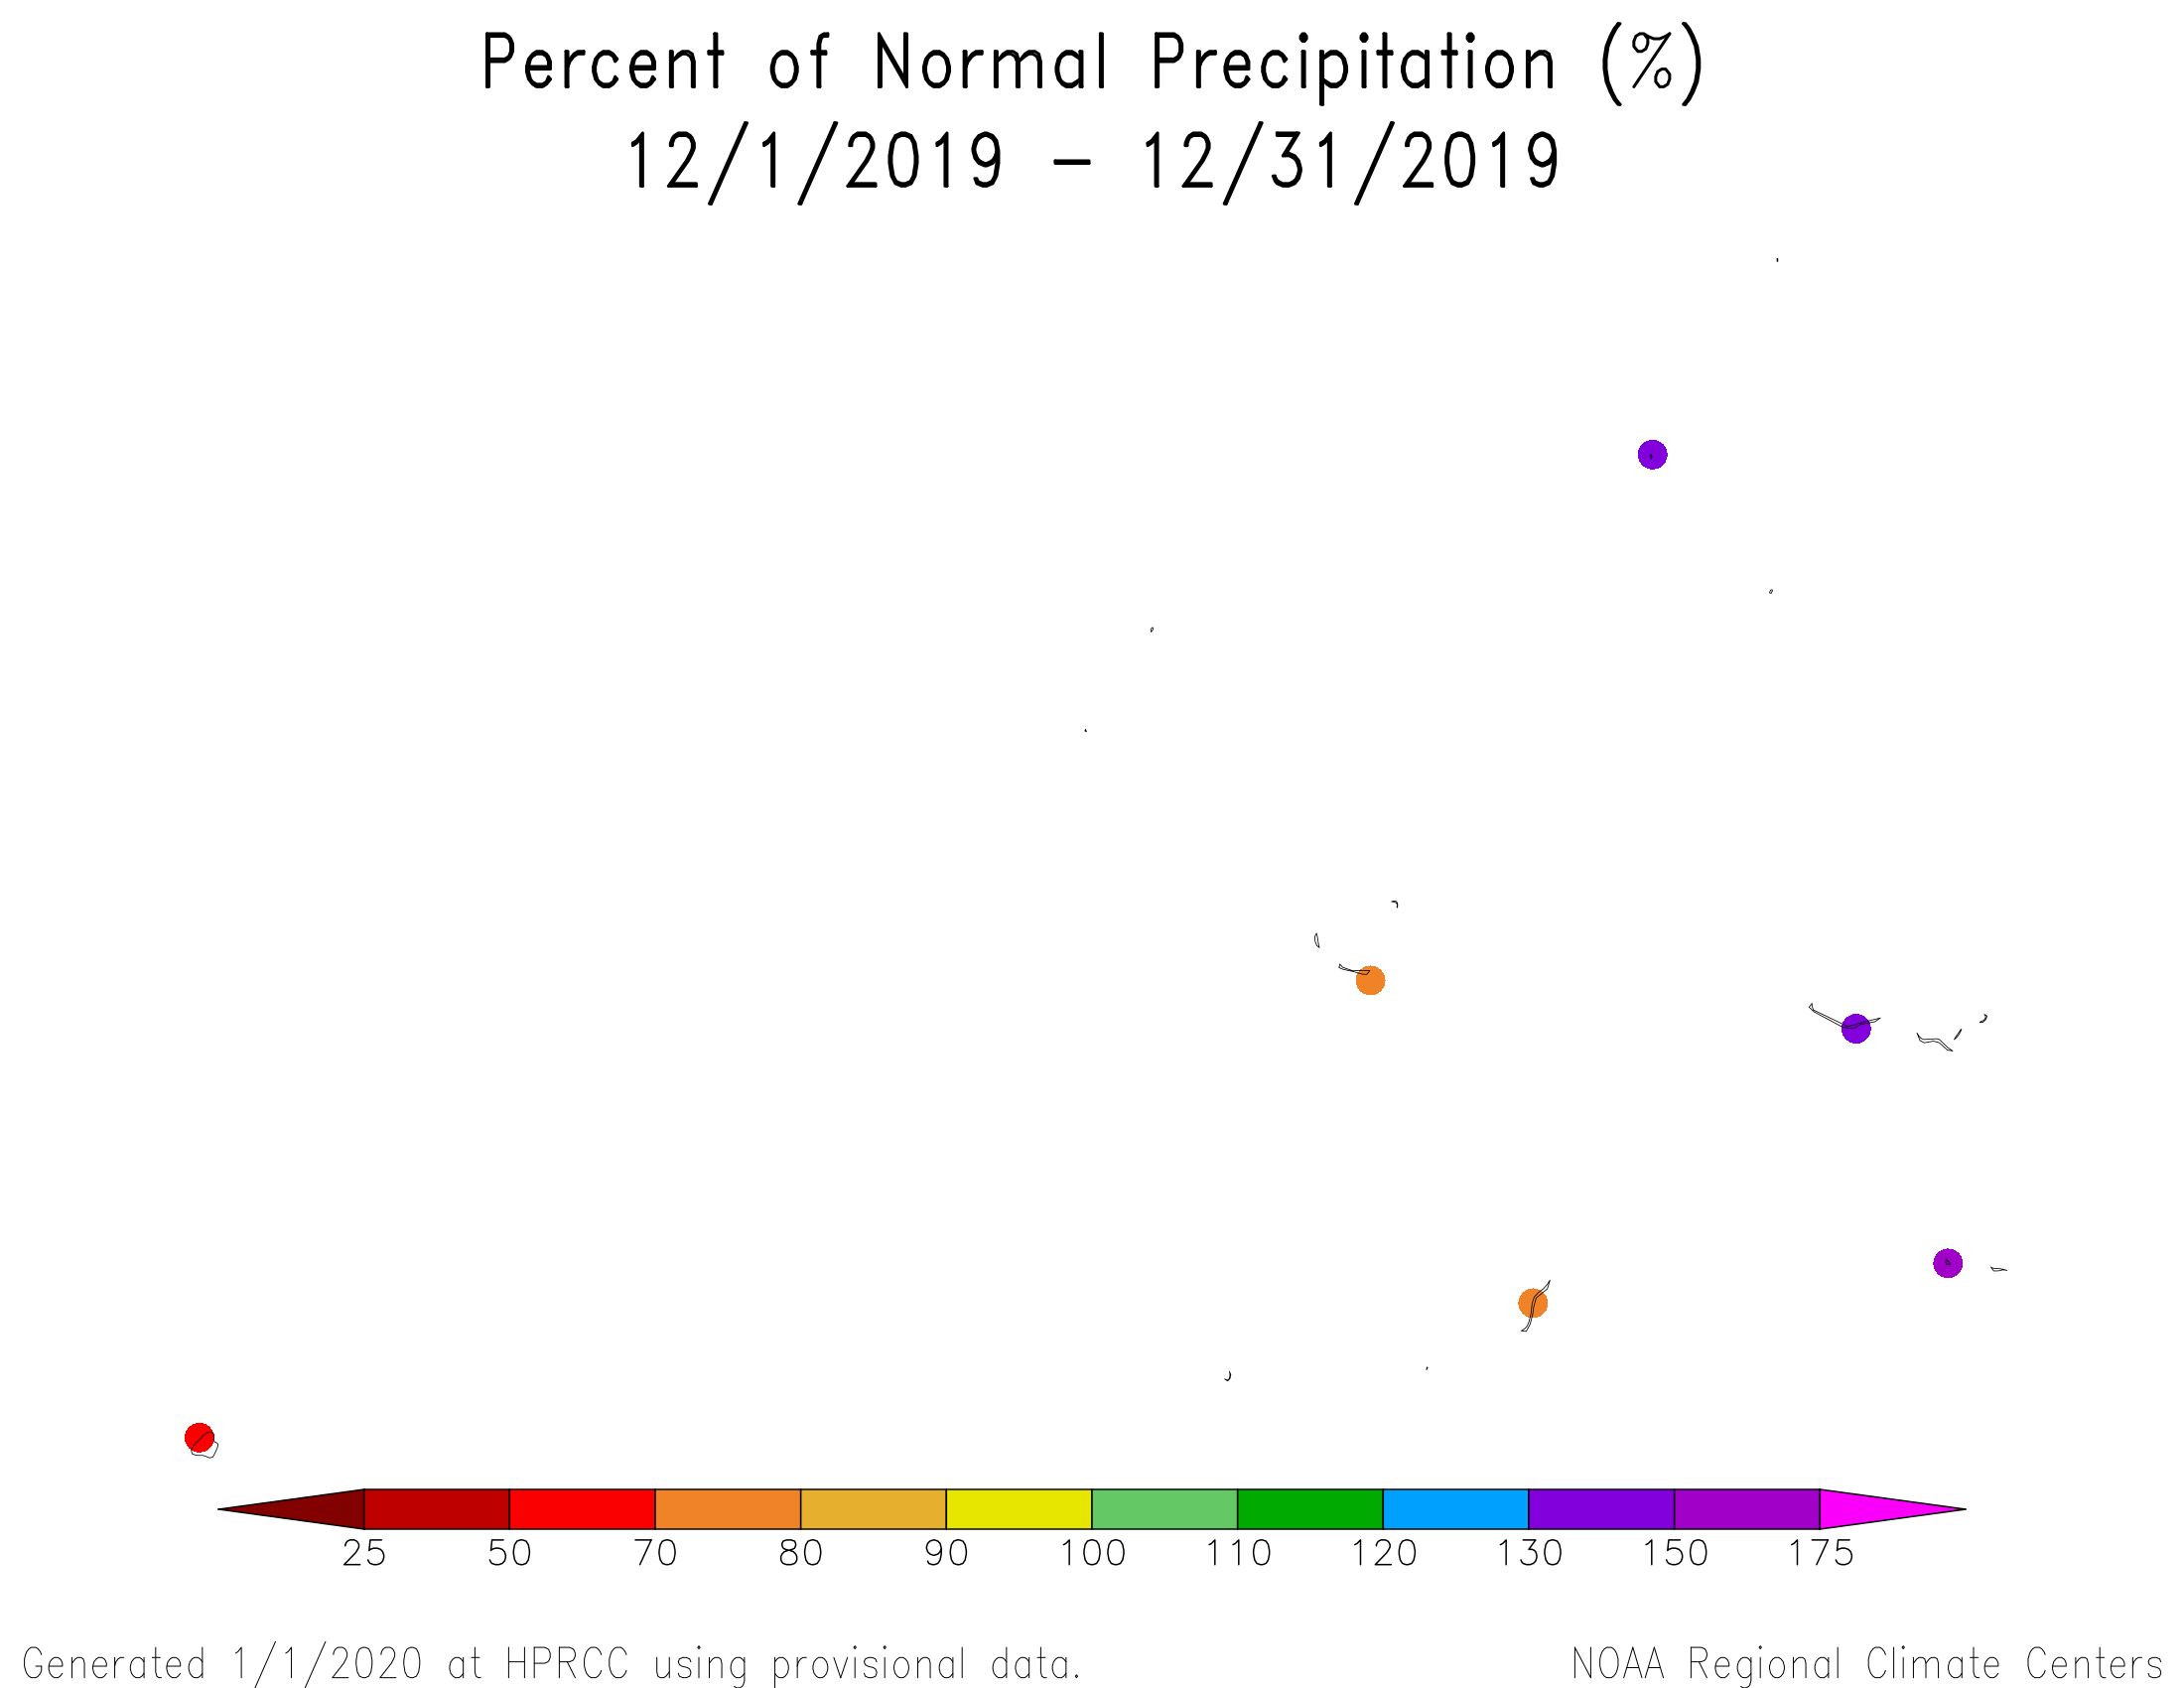
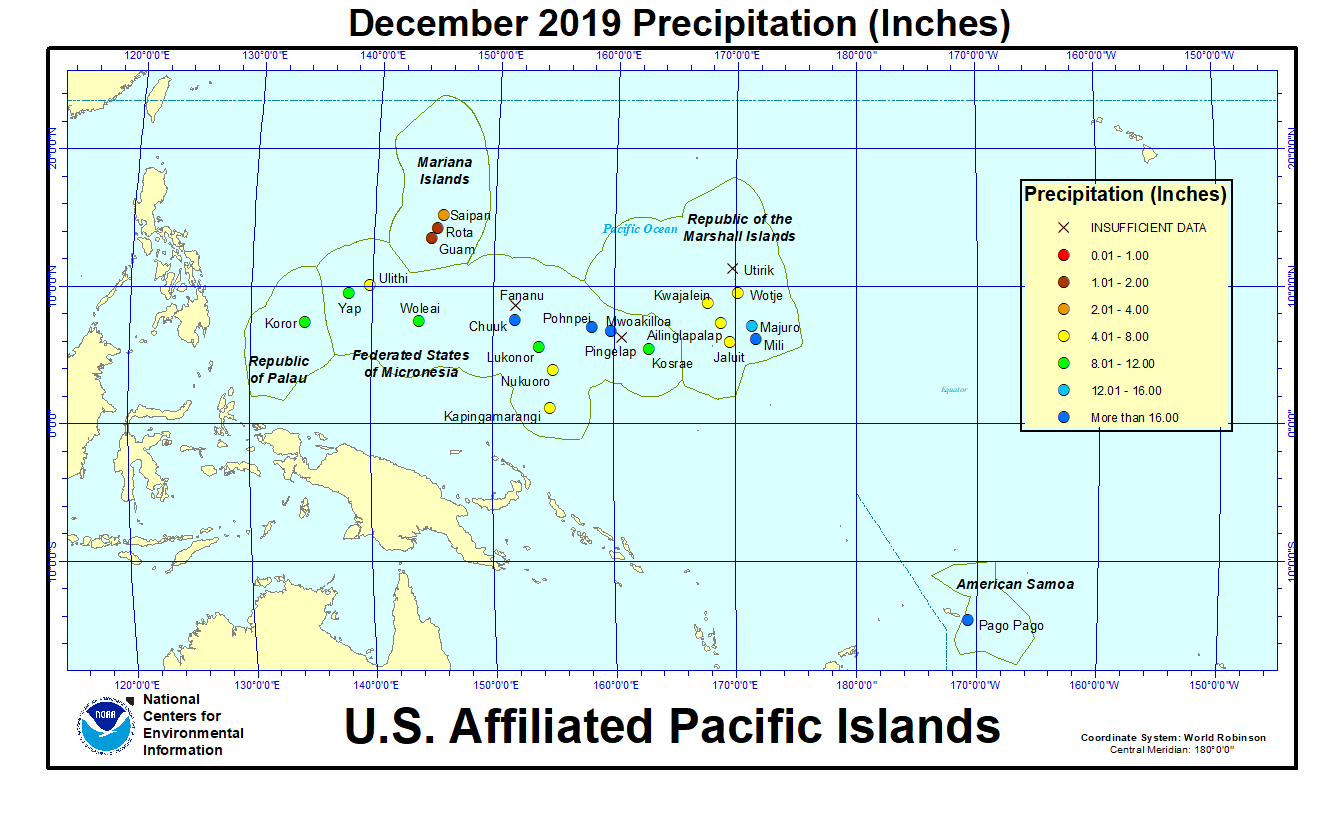
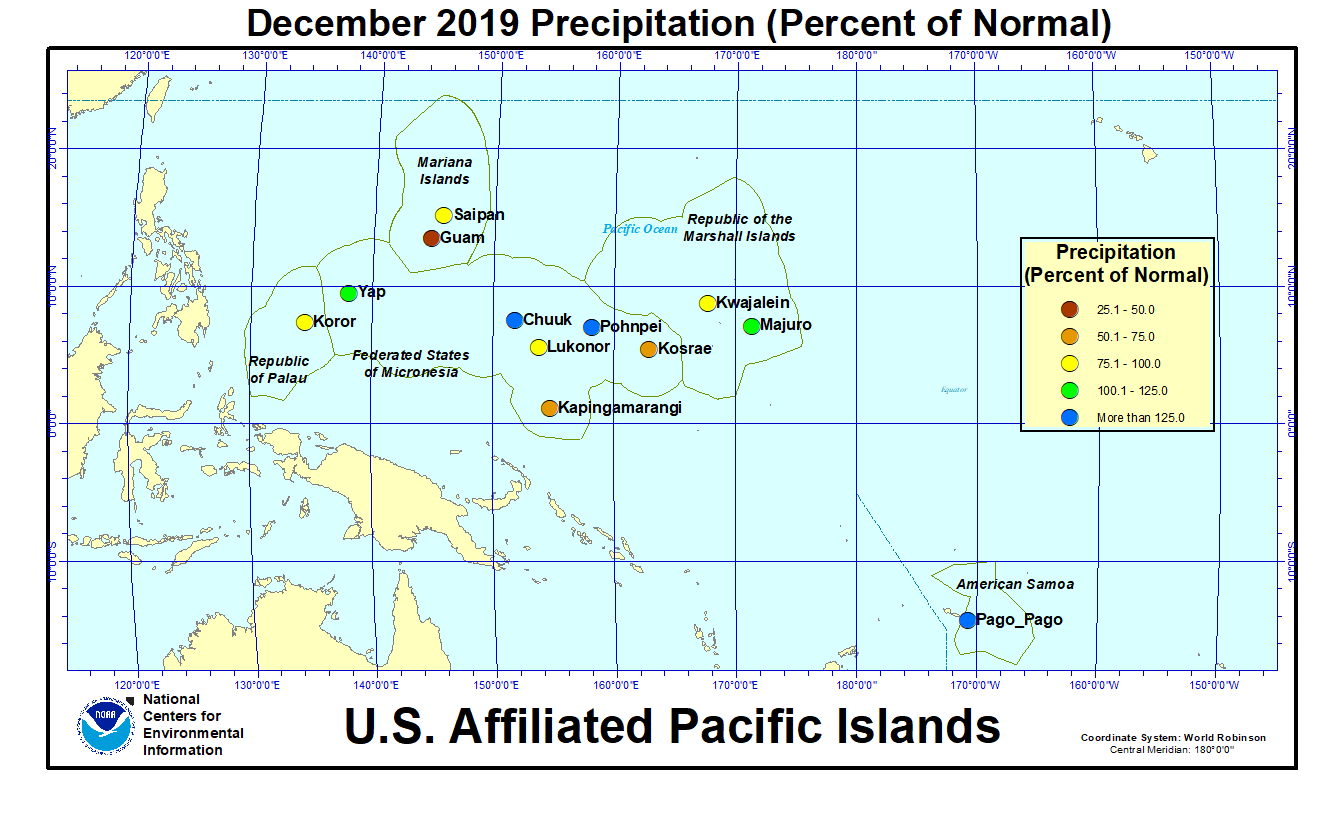
In the U.S. Affiliated Pacific Islands (USAPI) (maps — Federated States of Micronesia [FSM], Northern Mariana Islands, Marshall Islands [RMI], Republic of Palau, American Samoa, basinwide), December 2019 was drier-than-normal at Koror; Guam and Saipan (in the Marianas); Kapingamarangi, Kosrae, and Lukonor (in the FSM); and Kwajalein (in the RMI); December was wetter than normal at the rest of the primary stations.
Monthly precipitation amounts were below the monthly minimum needed to meet most water needs (4 inches in the Marianas and Pago Pago, and 8 inches elsewhere) at Guam, Rota, and Saipan (in the Marianas); Ulithi, Kapingamarangi, and Lukonor (in the FSM); and Ailinglapalap, Jaluit, Kwajalein, and Wotje (in the RMI); and above the monthly minimums at the rest of the USAPI stations. The 4- and 8-inch thresholds are important because, if monthly precipitation falls below the threshold, then water shortages or drought become a concern.
| Station Name | Jan 2019 | Feb 2019 | Mar 2019 | Apr 2019 | May 2019 | Jun 2019 | Jul 2019 | Aug 2019 | Sep 2019 | Oct 2019 | Nov 2019 | Dec 2019 | Jan- Dec |
|---|---|---|---|---|---|---|---|---|---|---|---|---|---|
| Chuuk | 183% | 122% | 175% | 48% | 42% | 125% | 97% | 125% | 135% | 48% | 87% | 177% | 106% |
| Guam NAS | 106% | 228% | 39% | 45% | 77% | 46% | 46% | 135% | 166% | 93% | 214% | 29% | 93% |
| Kapingamarangi | 195% | 44% | 197% | 127% | 169% | 172% | 110% | 124% | 55% | 142% | 229% | 67% | 121% |
| Koror | 96% | 40% | 84% | 94% | 57% | 93% | 81% | 140% | 74% | 118% | 99% | 88% | 83% |
| Kosrae | 93% | 98% | 143% | 137% | 152% | 103% | 62% | 117% | 69% | 98% | 98% | 62% | 87% |
| Kwajalein | 49% | 183% | 52% | 22% | 159% | 69% | 48% | 104% | 92% | 94% | 111% | 99% | 87% |
| Lukonor | 148% | 71% | 103% | 126% | 32% | 127% | 104% | 96% | 63% | 51% | 66% | 91% | 79% |
| Majuro | 93% | 74% | 102% | 35% | 160% | 103% | 64% | 109% | 105% | 117% | 110% | 114% | 99% |
| Pago Pago | 83% | 200% | 107% | 108% | 154% | 117% | 316% | 160% | 81% | 105% | 74% | 140% | 115% |
| Pohnpei | 134% | 79% | 143% | 66% | 45% | 159% | 101% | 110% | 155% | 138% | 168% | 132% | 113% |
| Saipan | 70% | 59% | 28% | 35% | 243% | 58% | 76% | 140% | 218% | 169% | 126% | 95% | 126% |
| Yap | 249% | 30% | 107% | 52% | 91% | 109% | 81% | 78% | 65% | 70% | 105% | 116% | 88% |
| Station Name | Jan 2019 | Feb 2019 | Mar 2019 | Apr 2019 | May 2019 | Jun 2019 | Jul 2019 | Aug 2019 | Sep 2019 | Oct 2019 | Nov 2019 | Dec 2019 | Jan- Dec |
|---|---|---|---|---|---|---|---|---|---|---|---|---|---|
| Chuuk | 18.49" | 8.87" | 14.56" | 6.00" | 4.74" | 14.62" | 11.65" | 16.13" | 15.81" | 5.55" | 9.26" | 19.91" | 145.59" |
| Guam NAS | 4.24" | 6.90" | 0.81" | 1.15" | 2.61" | 2.85" | 4.63" | 19.92" | 21.03" | 10.59" | 15.76" | 1.46" | 91.95" |
| Kapingamarangi | 17.87" | 4.06" | 22.56" | 17.33" | 20.46" | 23.68" | 15.52" | 10.11" | 5.50" | 11.67" | 21.27" | 6.55" | 176.58" |
| Koror | 9.79" | 3.45" | 6.24" | 6.89" | 6.78" | 16.30" | 15.04" | 18.91" | 8.74" | 13.94" | 11.29" | 9.86" | 127.23" |
| Kosrae | 15.58" | 12.62" | 23.02" | 23.96" | 26.91" | 15.08" | 9.19" | 16.61" | 9.78" | 10.69" | 13.55" | 10.06" | 187.05" |
| Kwajalein | 1.54" | 4.82" | 1.22" | 1.14" | 10.71" | 4.76" | 4.77" | 10.10" | 9.89" | 10.53" | 12.52" | 6.62" | 78.62" |
| Lukonor | 12.41" | 6.33" | 9.58" | 14.30" | 3.75" | 14.80" | 16.63" | 13.47" | 6.44" | 5.79" | 6.01" | 10.23" | 119.74" |
| Majuro | 7.23" | 5.09" | 6.74" | 3.34" | 16.14" | 11.31" | 7.12" | 12.69" | 11.73" | 14.95" | 14.83" | 13.03" | 124.2" |
| Pago Pago | 11.10" | 24.04" | 11.47" | 10.17" | 14.91" | 6.24" | 17.54" | 8.60" | 5.28" | 9.71" | 7.48" | 17.93" | 144.47" |
| Pohnpei | 17.68" | 7.57" | 18.84" | 12.23" | 8.94" | 23.56" | 15.64" | 15.74" | 19.47" | 21.01" | 24.91" | 21.17" | 206.76" |
| Saipan | 1.76" | 1.54" | 0.53" | 0.93" | 5.78" | 2.11" | 6.73" | 18.32" | 21.99" | 17.92" | 7.06" | 3.64" | 88.31" |
| Yap | 15.90" | 1.57" | 4.88" | 2.92" | 7.15" | 13.14" | 12.25" | 11.58" | 8.82" | 8.54" | 9.30" | 9.89" | 105.94" |
| Station Name | Jan 2019 | Feb 2019 | Mar 2019 | Apr 2019 | May 2019 | Jun 2019 | Jul 2019 | Aug 2019 | Sep 2019 | Oct 2019 | Nov 2019 | Dec 2019 | Jan- Dec |
|---|---|---|---|---|---|---|---|---|---|---|---|---|---|
| Chuuk | 10.10" | 7.25" | 8.32" | 12.47" | 11.30" | 11.66" | 11.98" | 12.86" | 11.71" | 11.51" | 10.61" | 11.25" | 136.77" |
| Guam NAS | 4.01" | 3.03" | 2.07" | 2.53" | 3.40" | 6.18" | 10.14" | 14.74" | 12.66" | 11.44" | 7.38" | 5.11" | 99.09" |
| Kapingamarangi | 9.15" | 9.27" | 11.43" | 13.64" | 12.08" | 13.78" | 14.15" | 8.13" | 9.93" | 8.19" | 9.27" | 9.84" | 145.85" |
| Koror | 10.18" | 8.56" | 7.44" | 7.32" | 11.83" | 17.48" | 18.53" | 13.50" | 11.77" | 11.84" | 11.39" | 11.16" | 152.90" |
| Kosrae | 16.67" | 12.93" | 16.06" | 17.51" | 17.75" | 14.64" | 14.91" | 14.22" | 14.22" | 10.94" | 13.83" | 16.11" | 213.87" |
| Kwajalein | 3.16" | 2.64" | 2.35" | 5.26" | 6.72" | 6.93" | 9.87" | 9.74" | 10.74" | 11.18" | 11.28" | 6.66" | 90.41" |
| Lukonor | 8.41" | 8.93" | 9.26" | 11.31" | 11.69" | 11.65" | 15.93" | 14.04" | 10.15" | 11.32" | 9.08" | 11.27" | 151.36" |
| Majuro | 7.74" | 6.88" | 6.58" | 9.42" | 10.11" | 11.01" | 11.17" | 11.69" | 11.17" | 12.73" | 13.44" | 11.39" | 125.25" |
| Pago Pago | 13.34" | 12.00" | 10.68" | 9.39" | 9.66" | 5.33" | 5.55" | 5.38" | 6.53" | 9.26" | 10.14" | 12.84" | 125.57" |
| Pohnpei | 13.18" | 9.55" | 13.17" | 18.41" | 19.96" | 14.81" | 15.43" | 14.26" | 12.55" | 15.27" | 14.83" | 16.08" | 182.36" |
| Saipan | 2.53" | 2.59" | 1.89" | 2.63" | 2.38" | 3.62" | 8.91" | 13.13" | 10.09" | 10.62" | 5.61" | 3.85" | 70.25" |
| Yap | 6.39" | 5.19" | 4.56" | 5.63" | 7.85" | 12.04" | 15.08" | 14.82" | 13.50" | 12.18" | 8.83" | 8.51" | 120.31" |
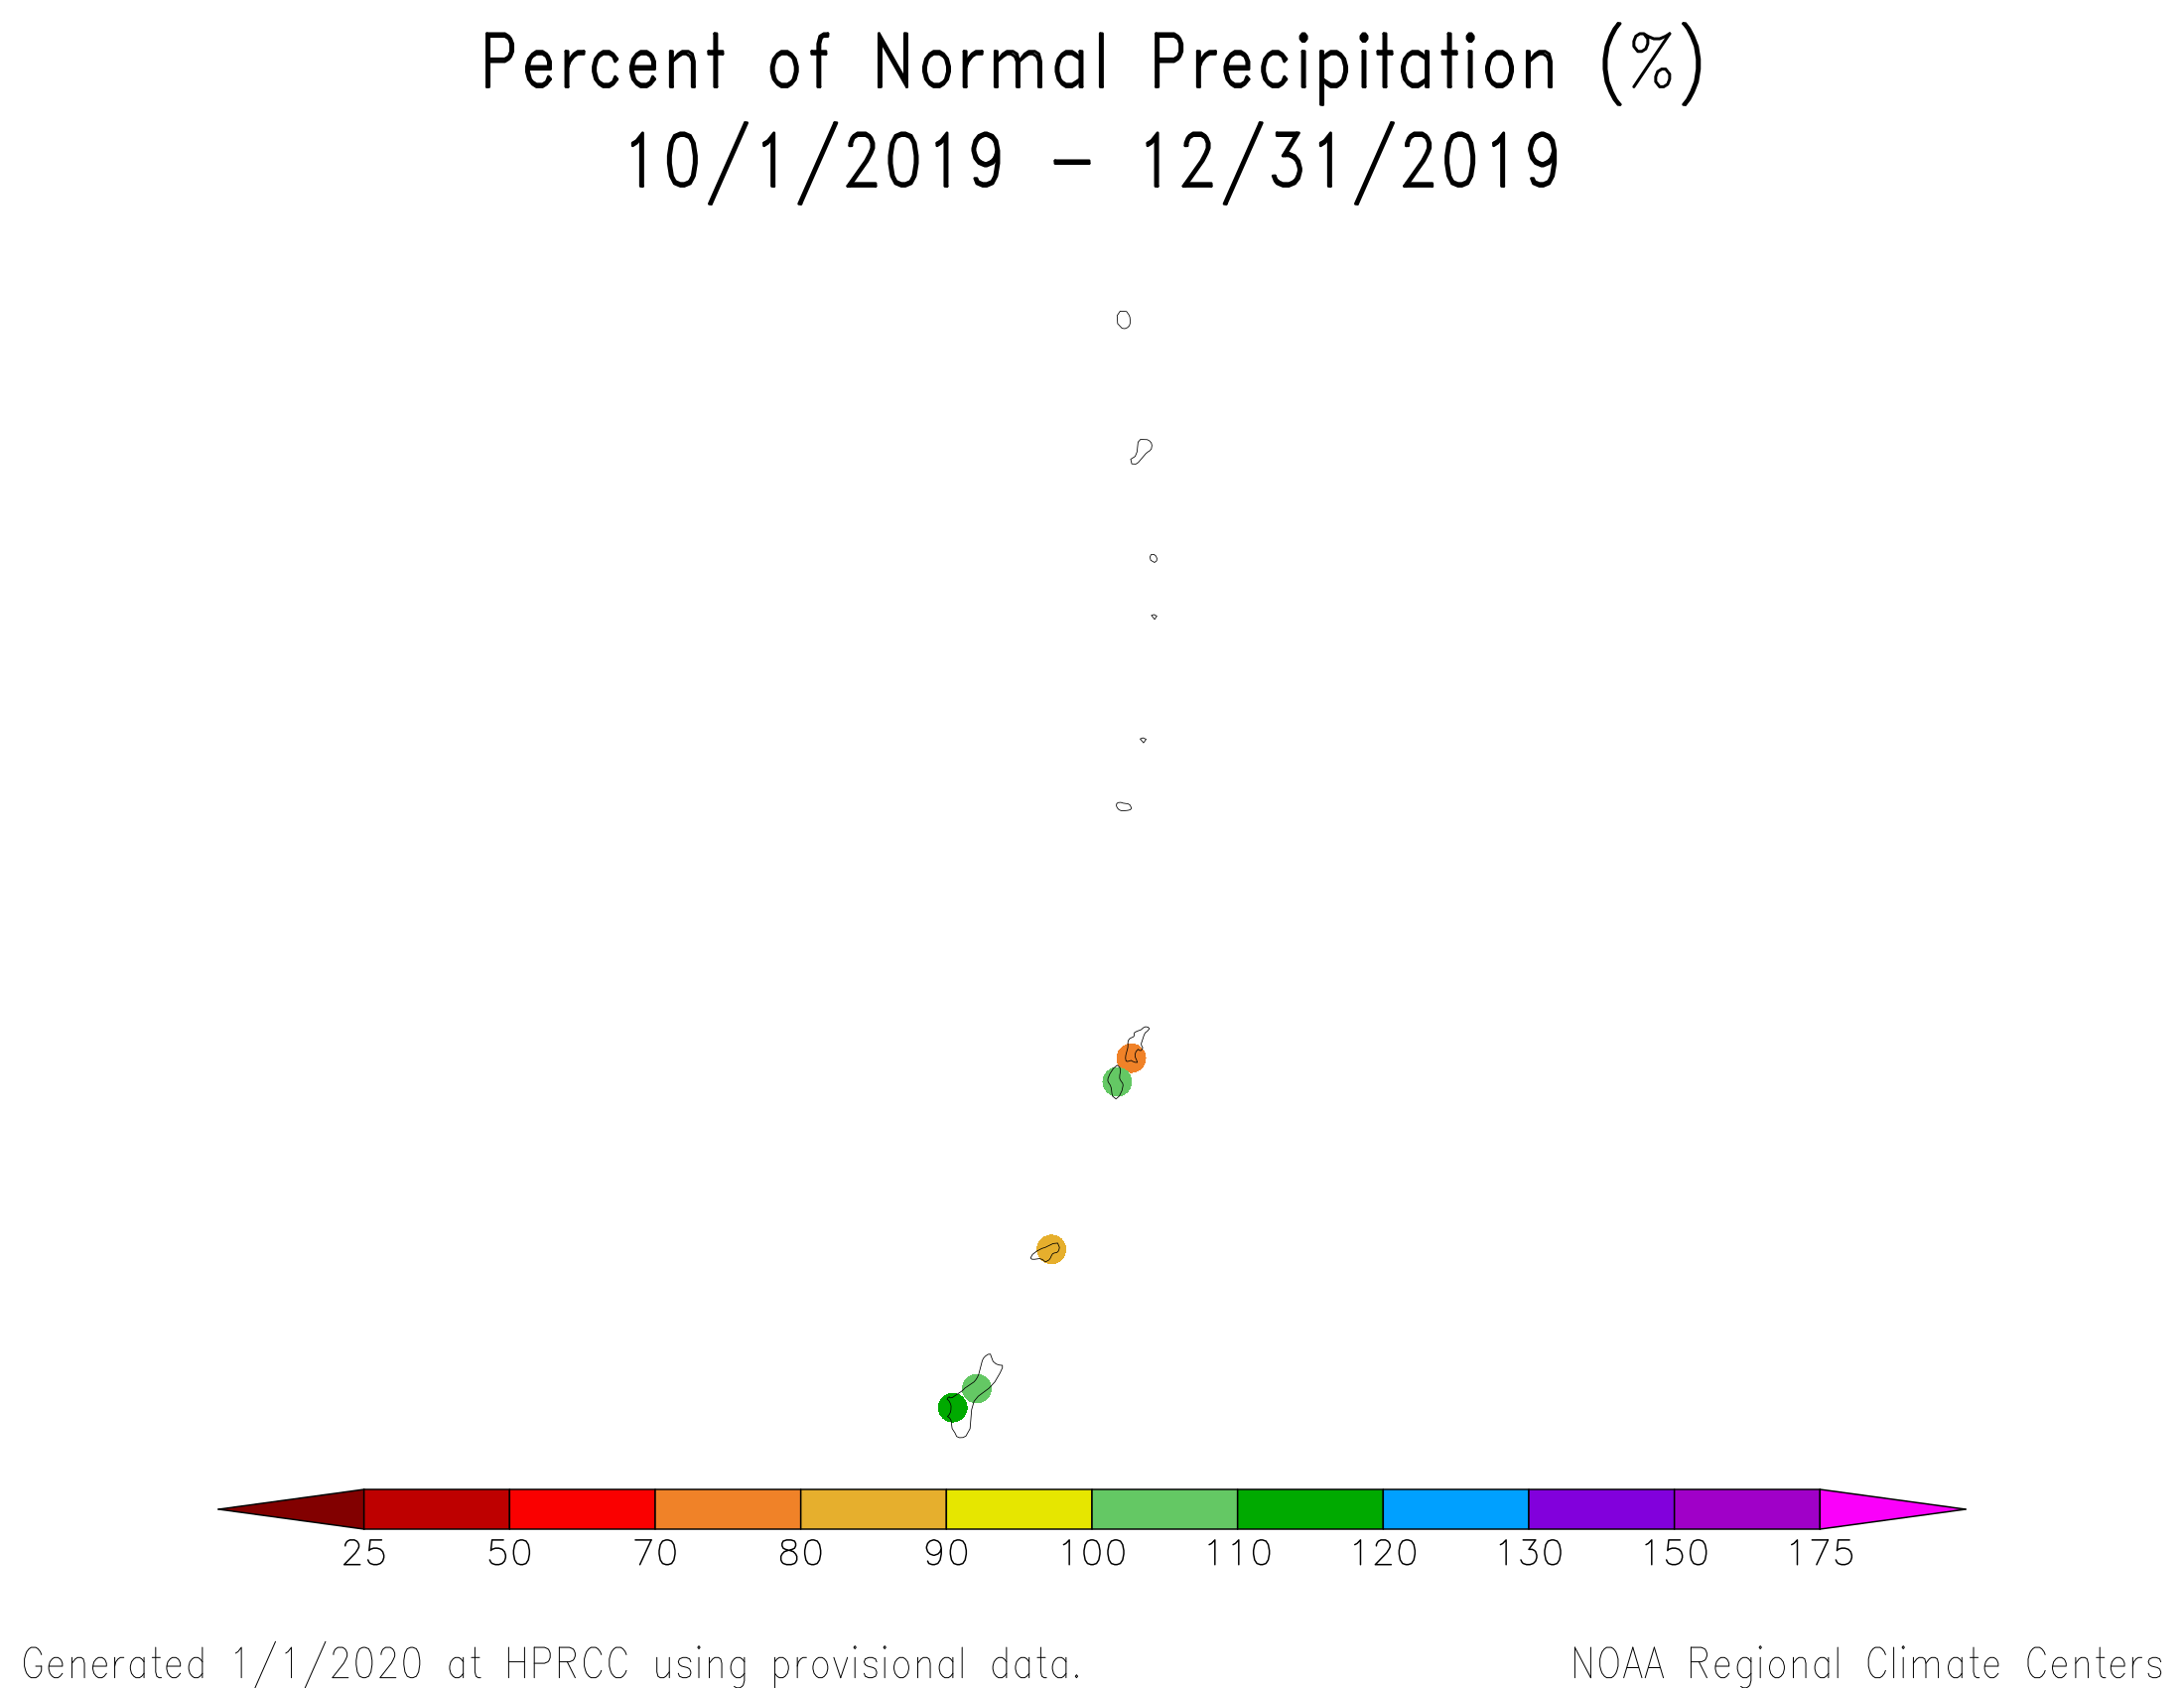
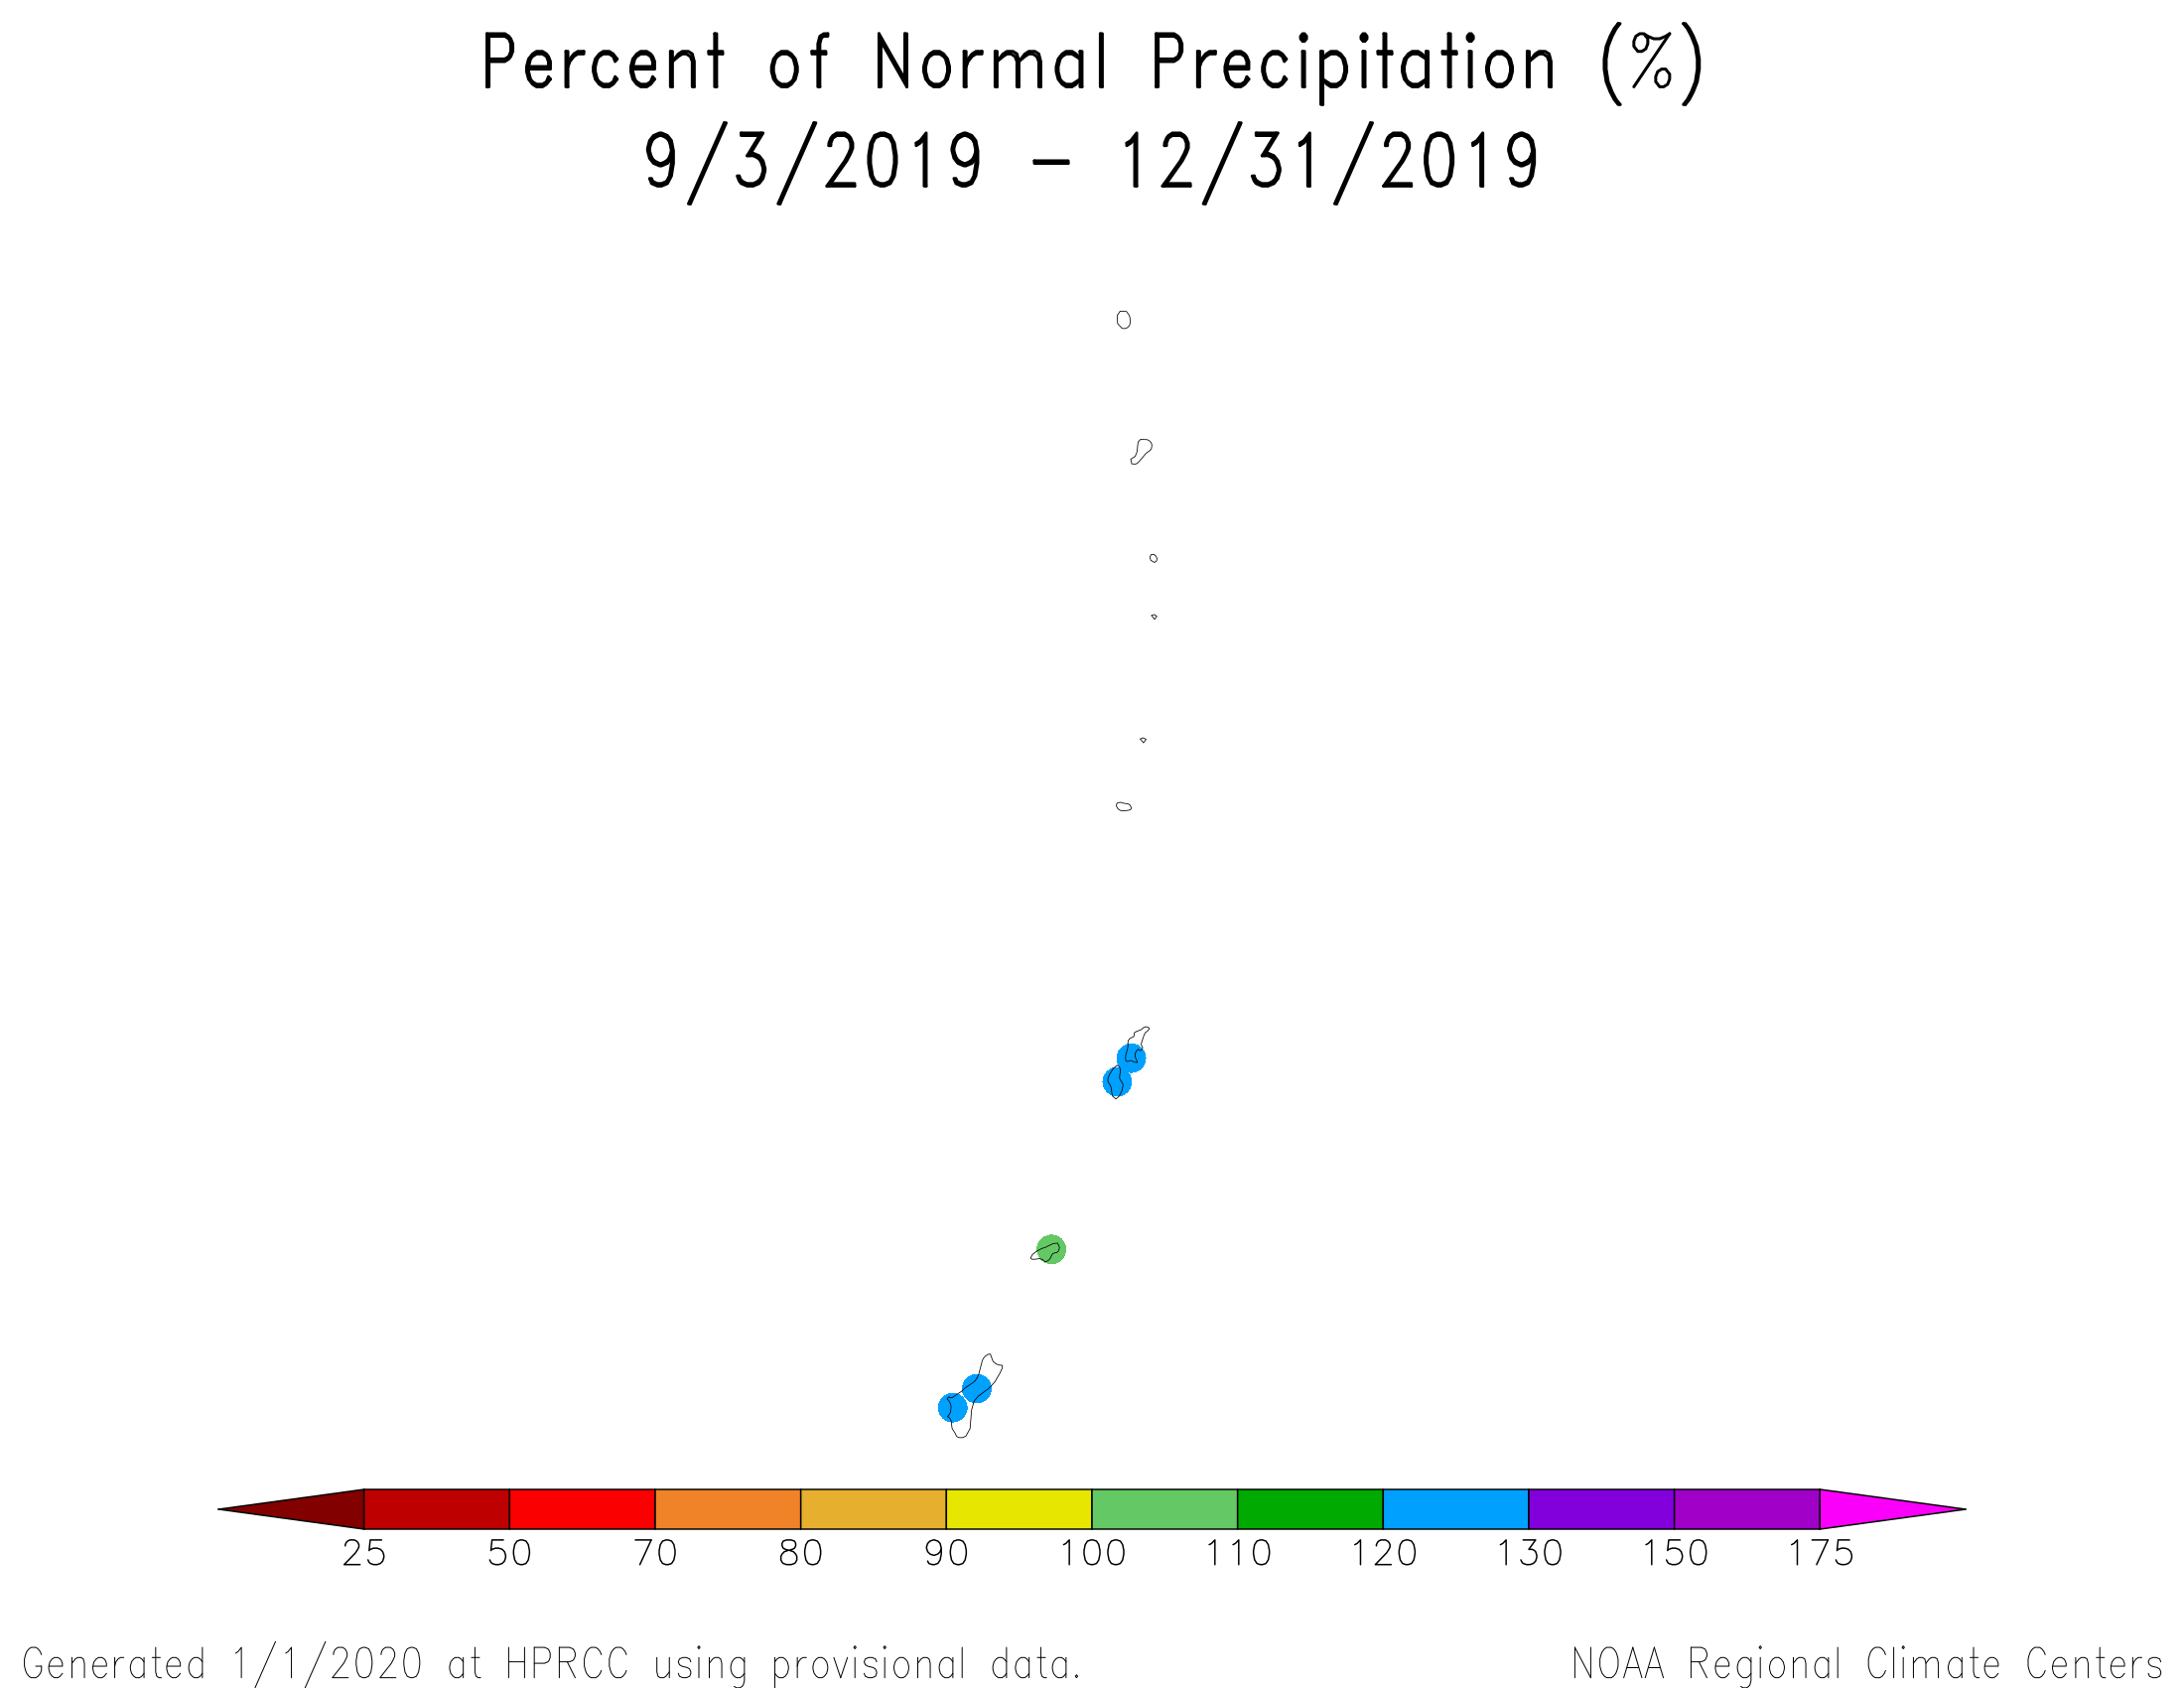
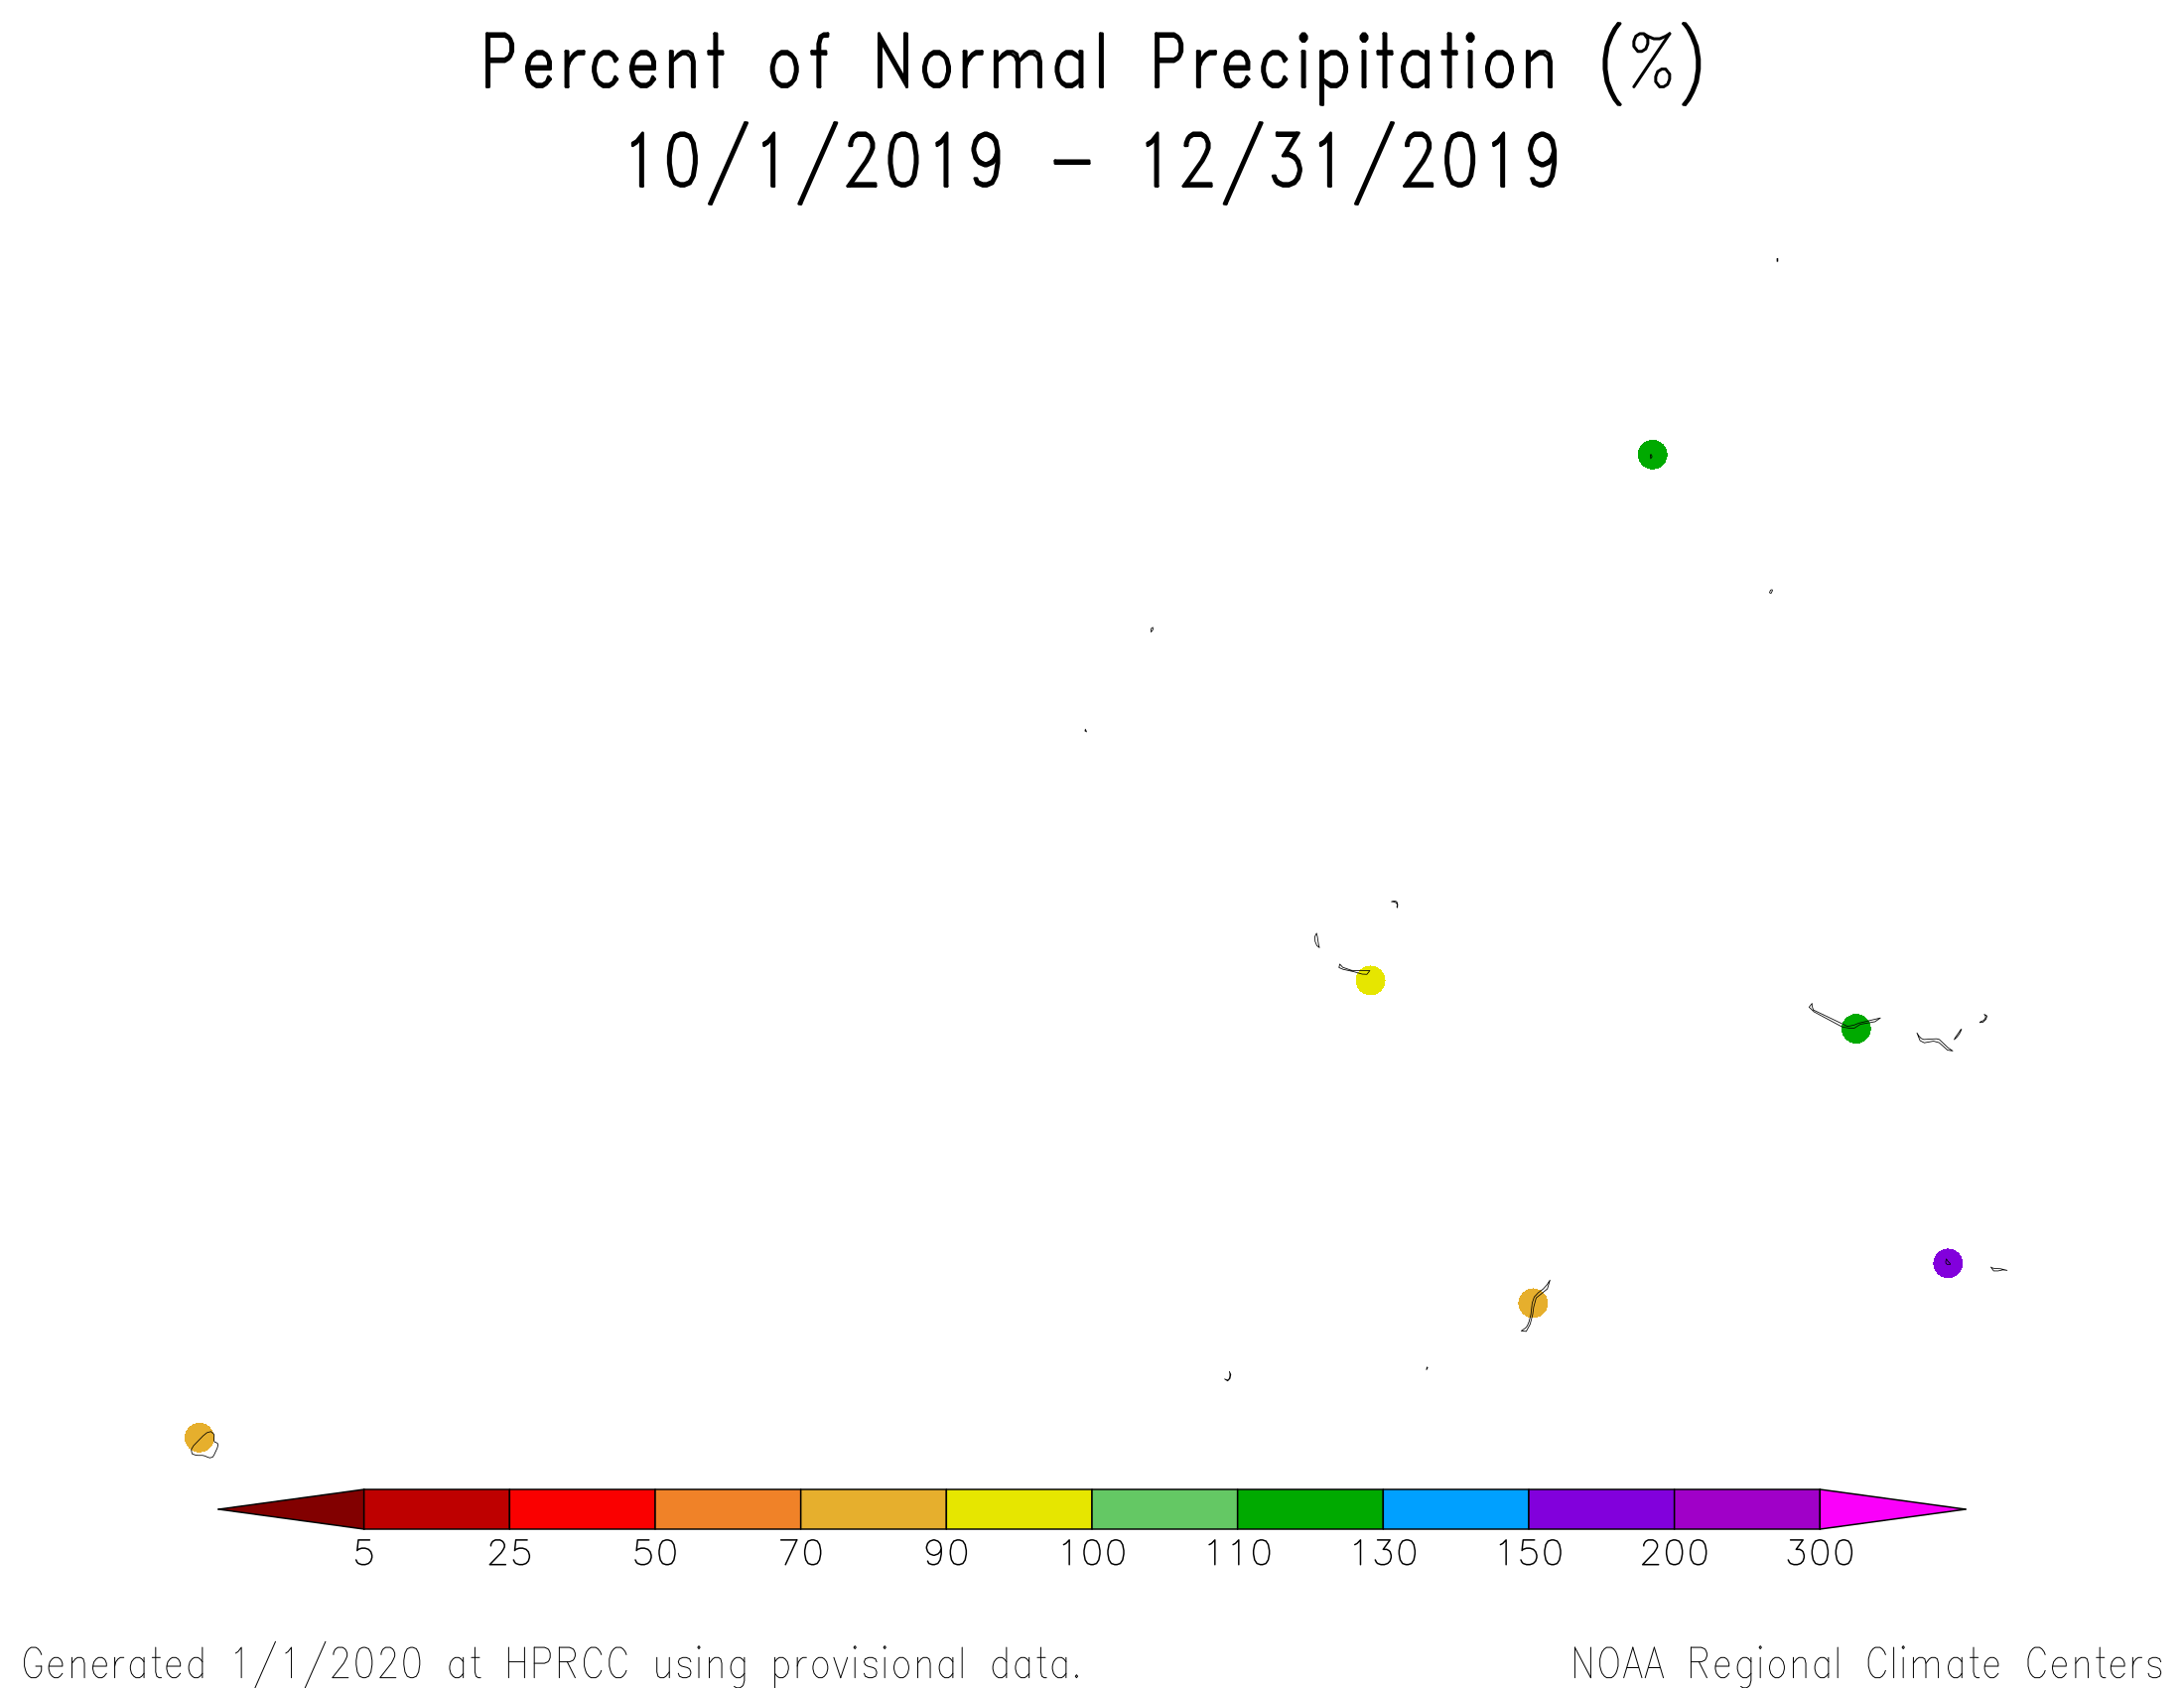
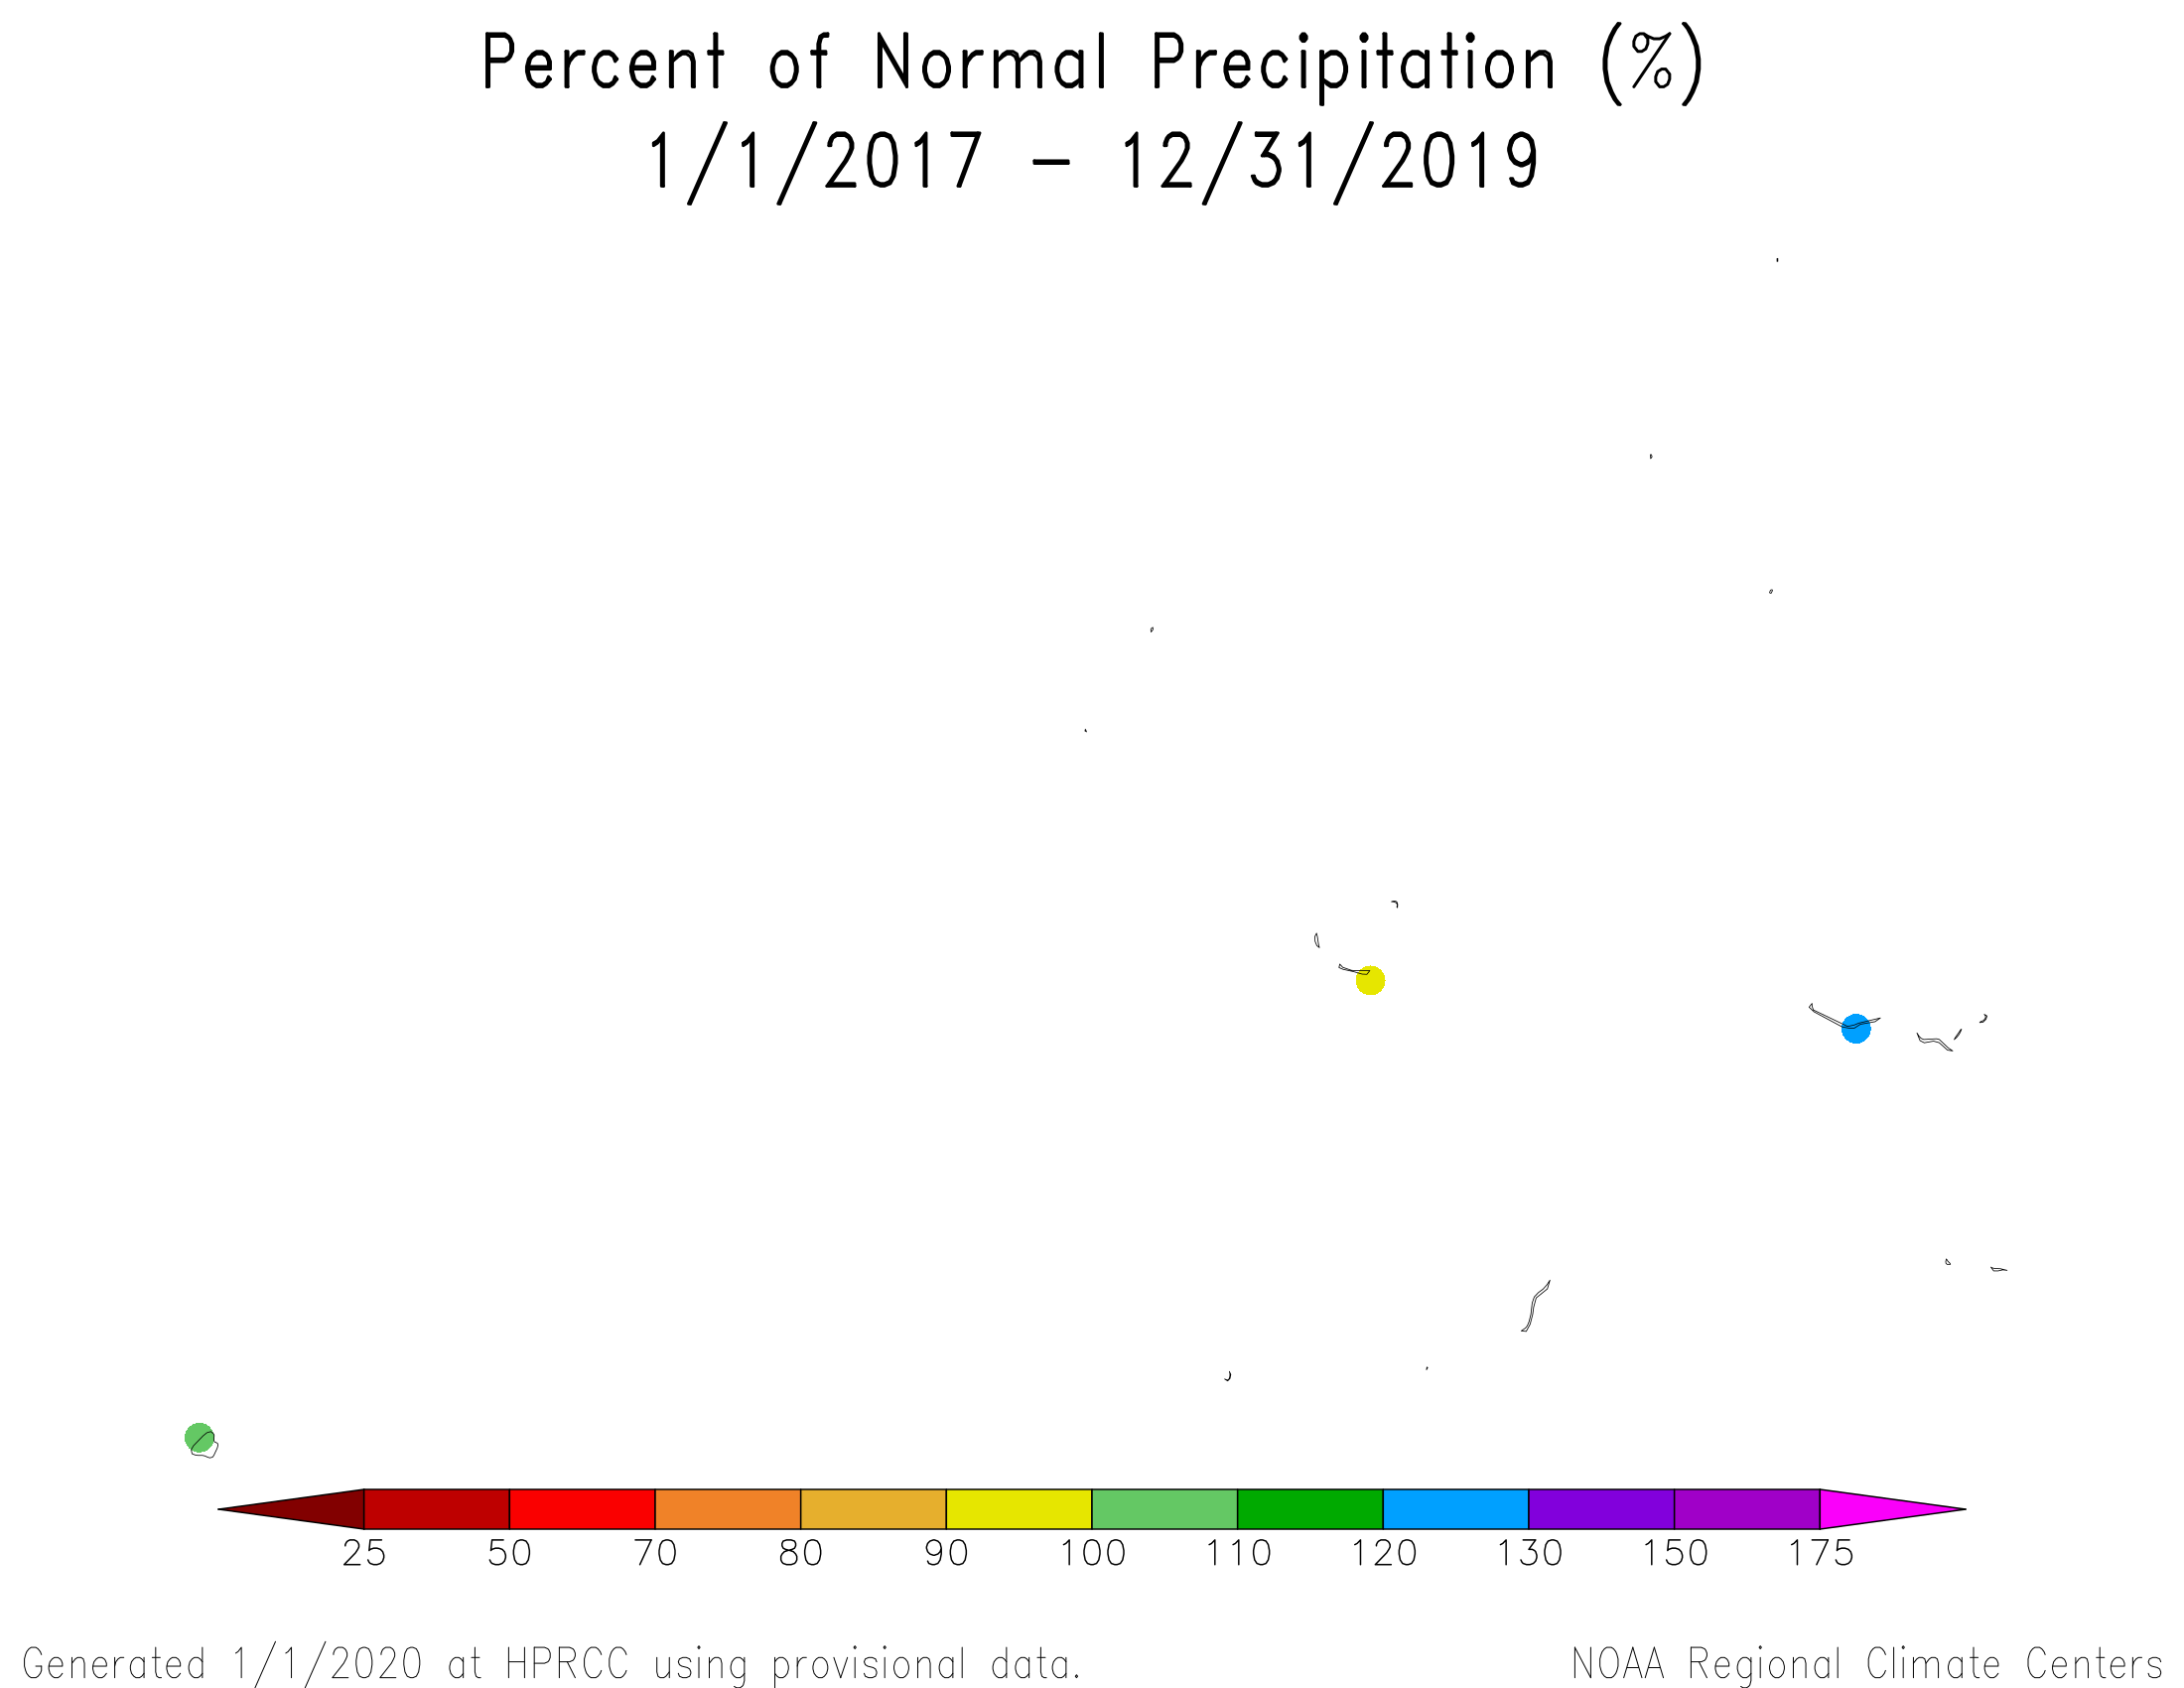
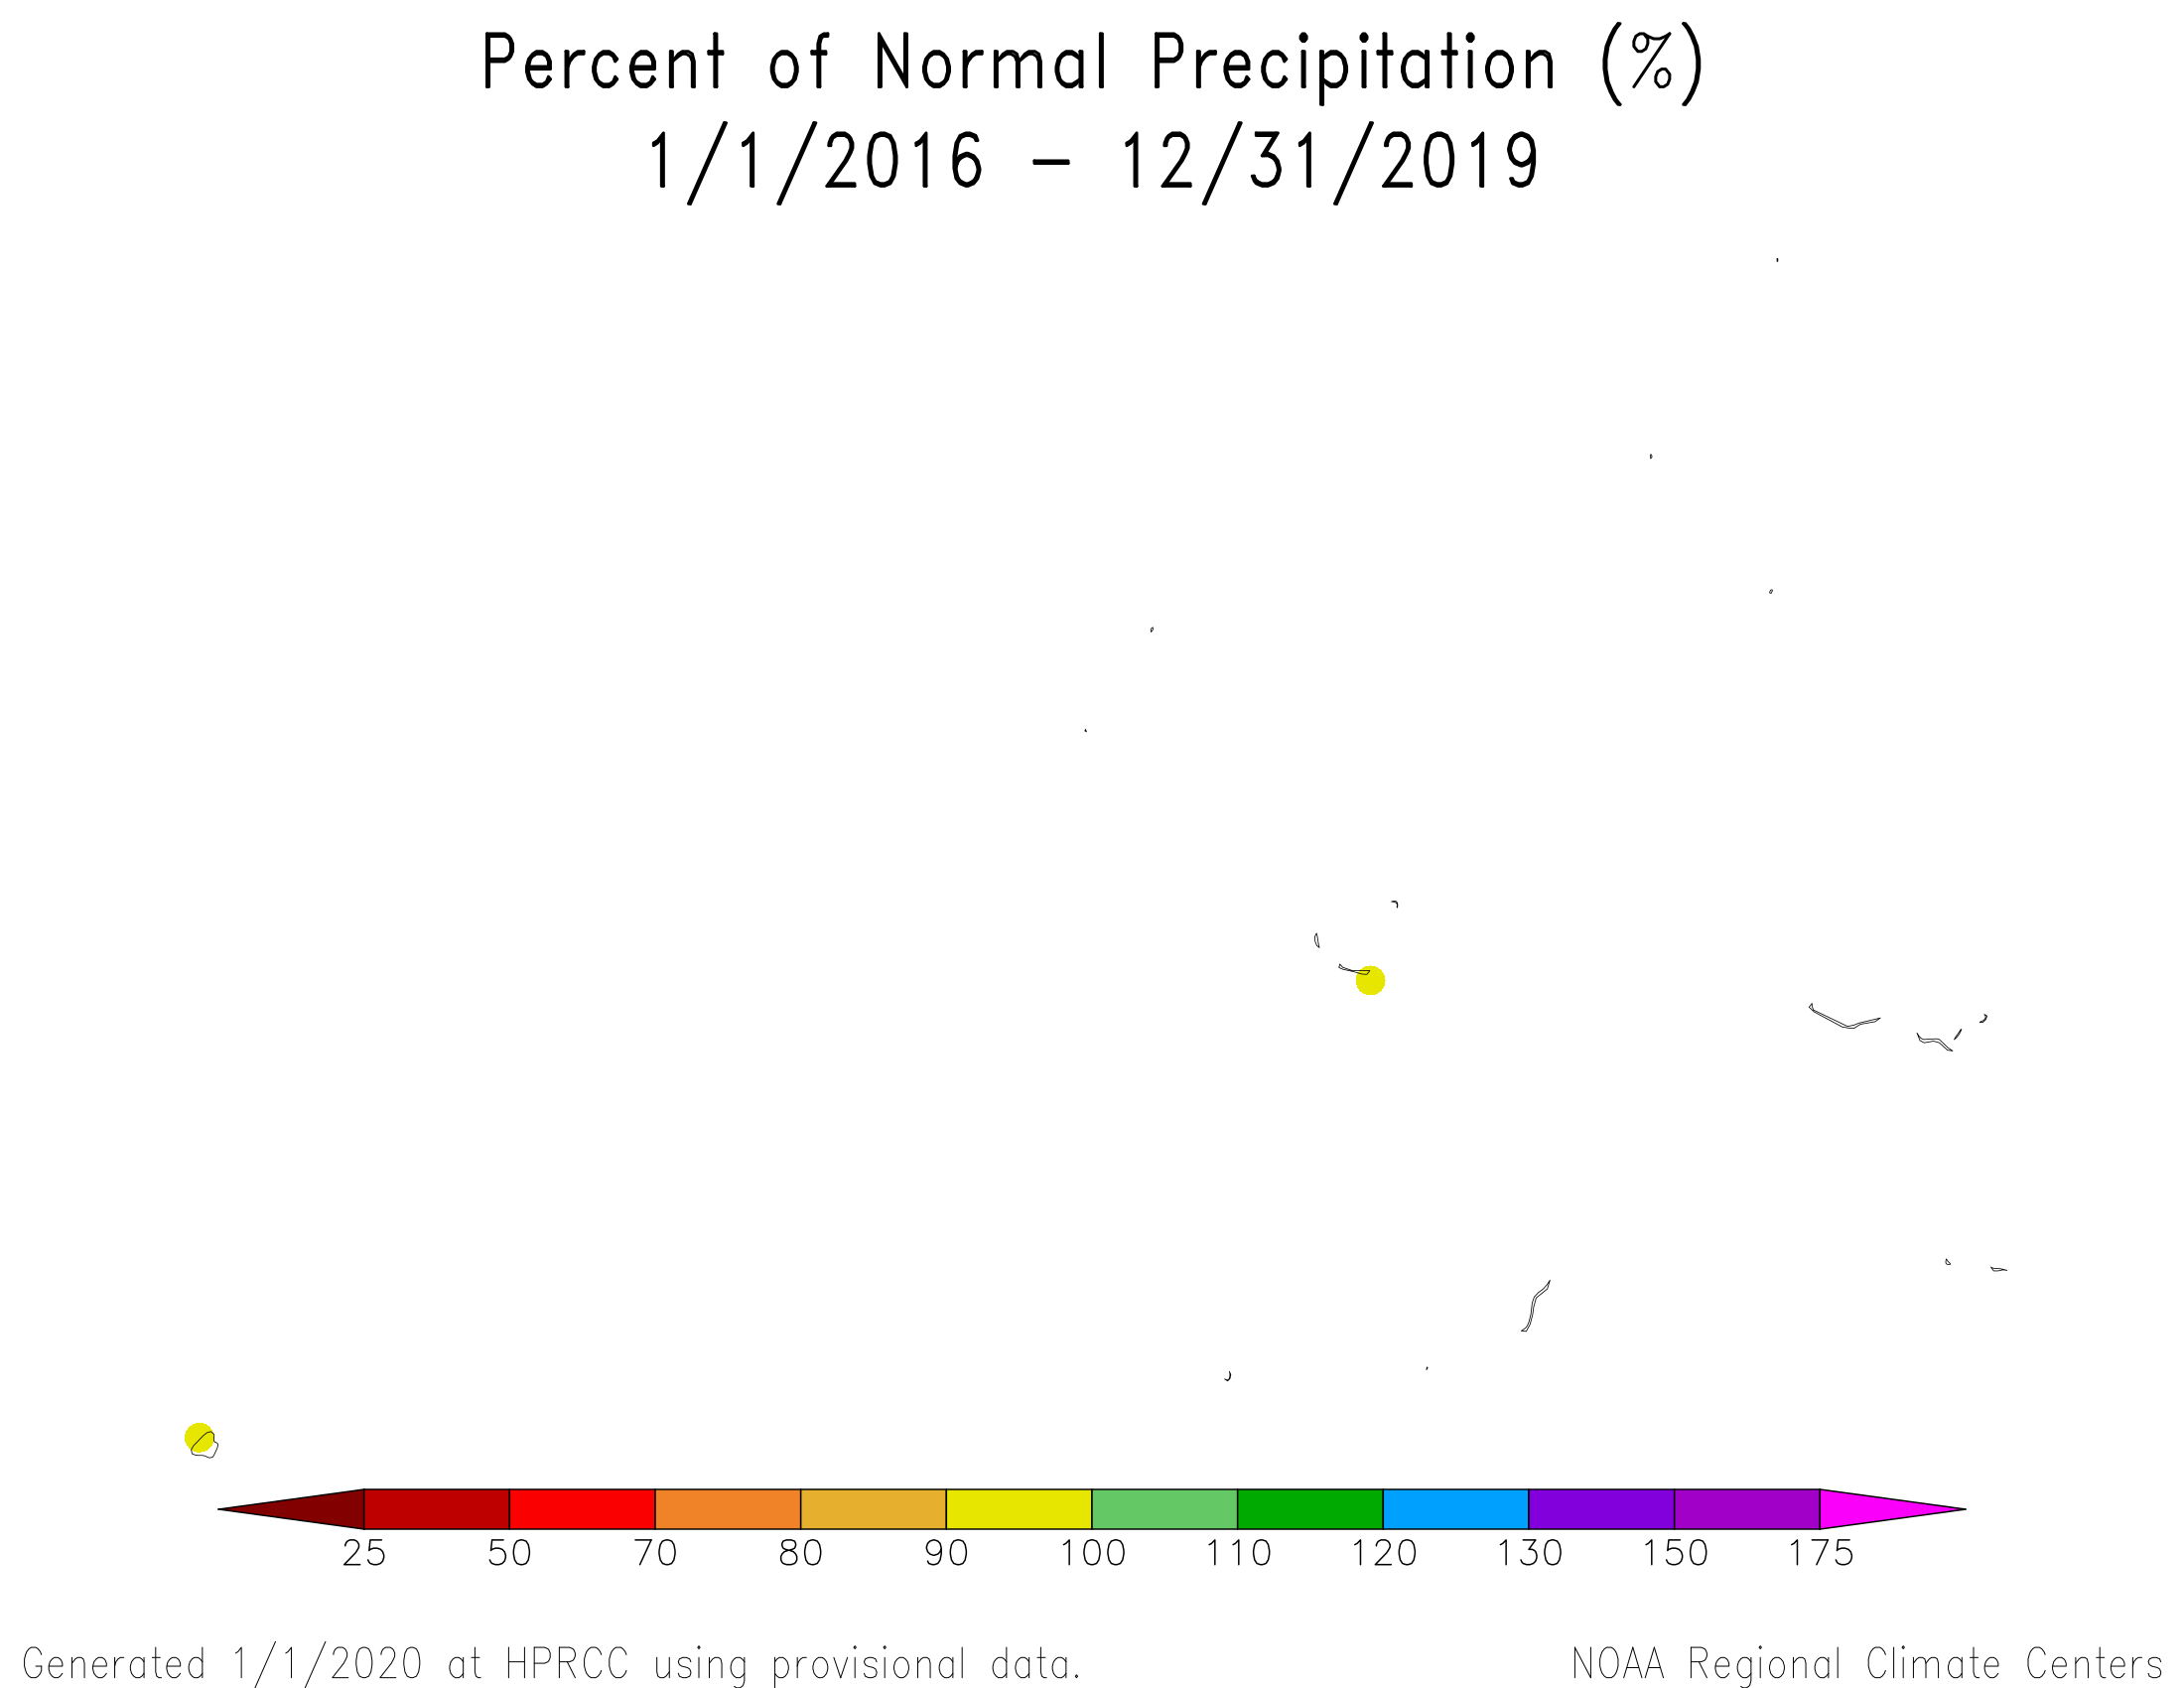
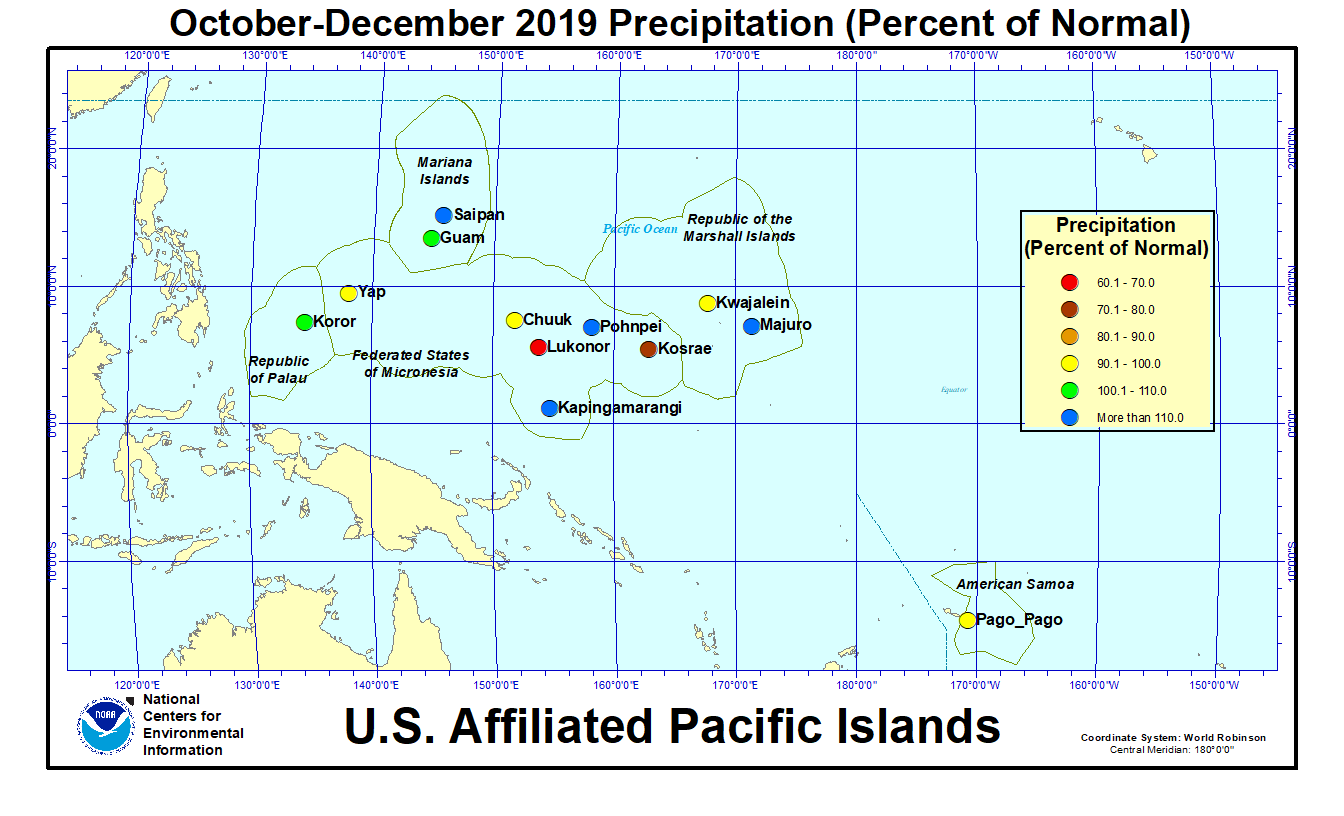
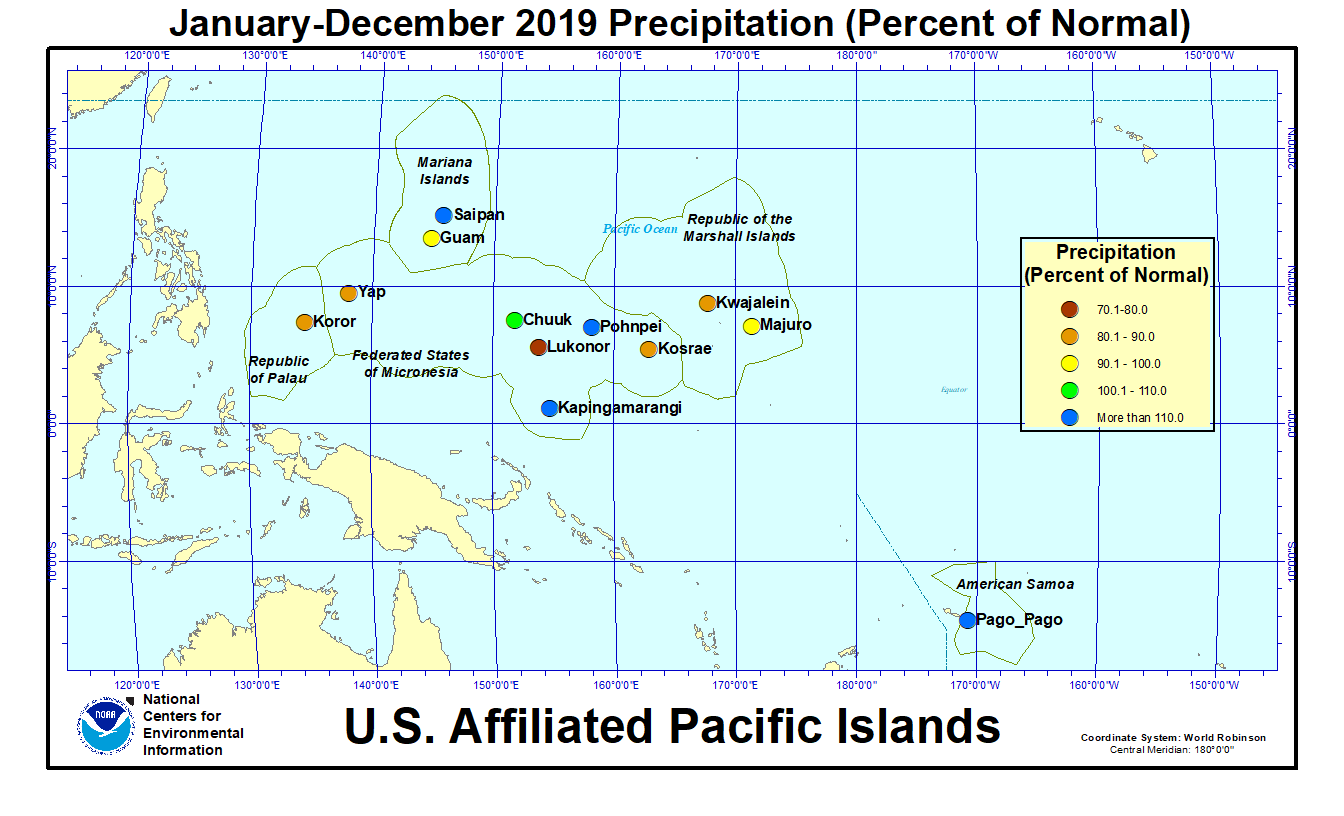
As measured by percent of normal precipitation, Kosrae and Lukonor were drier than normal in the short term (December and the last 3 months [October-December 2019]) and long term (last 12 months [January-December 2019]). Kapingamarangi and Saipan were drier than normal for December but wetter than normal for the other two time periods. Pago Pago was drier than normal at the last 3-month time scale but wetter than normal at the other two time scales. Guam, Koror, Kwajalein, and Yap were drier than normal at two of the time periods but near or wetter than normal at the third. Chuuk, Majuro, and Pohnpei were near to wetter than normal at all 3 time scales. It should be noted that the monthly normal precipitation amount can vary significantly from month to month due to the strong seasonality of equatorial Pacific precipitation resulting from the seasonal migration of the Inter-Tropical Convergence Zone (ITCZ).
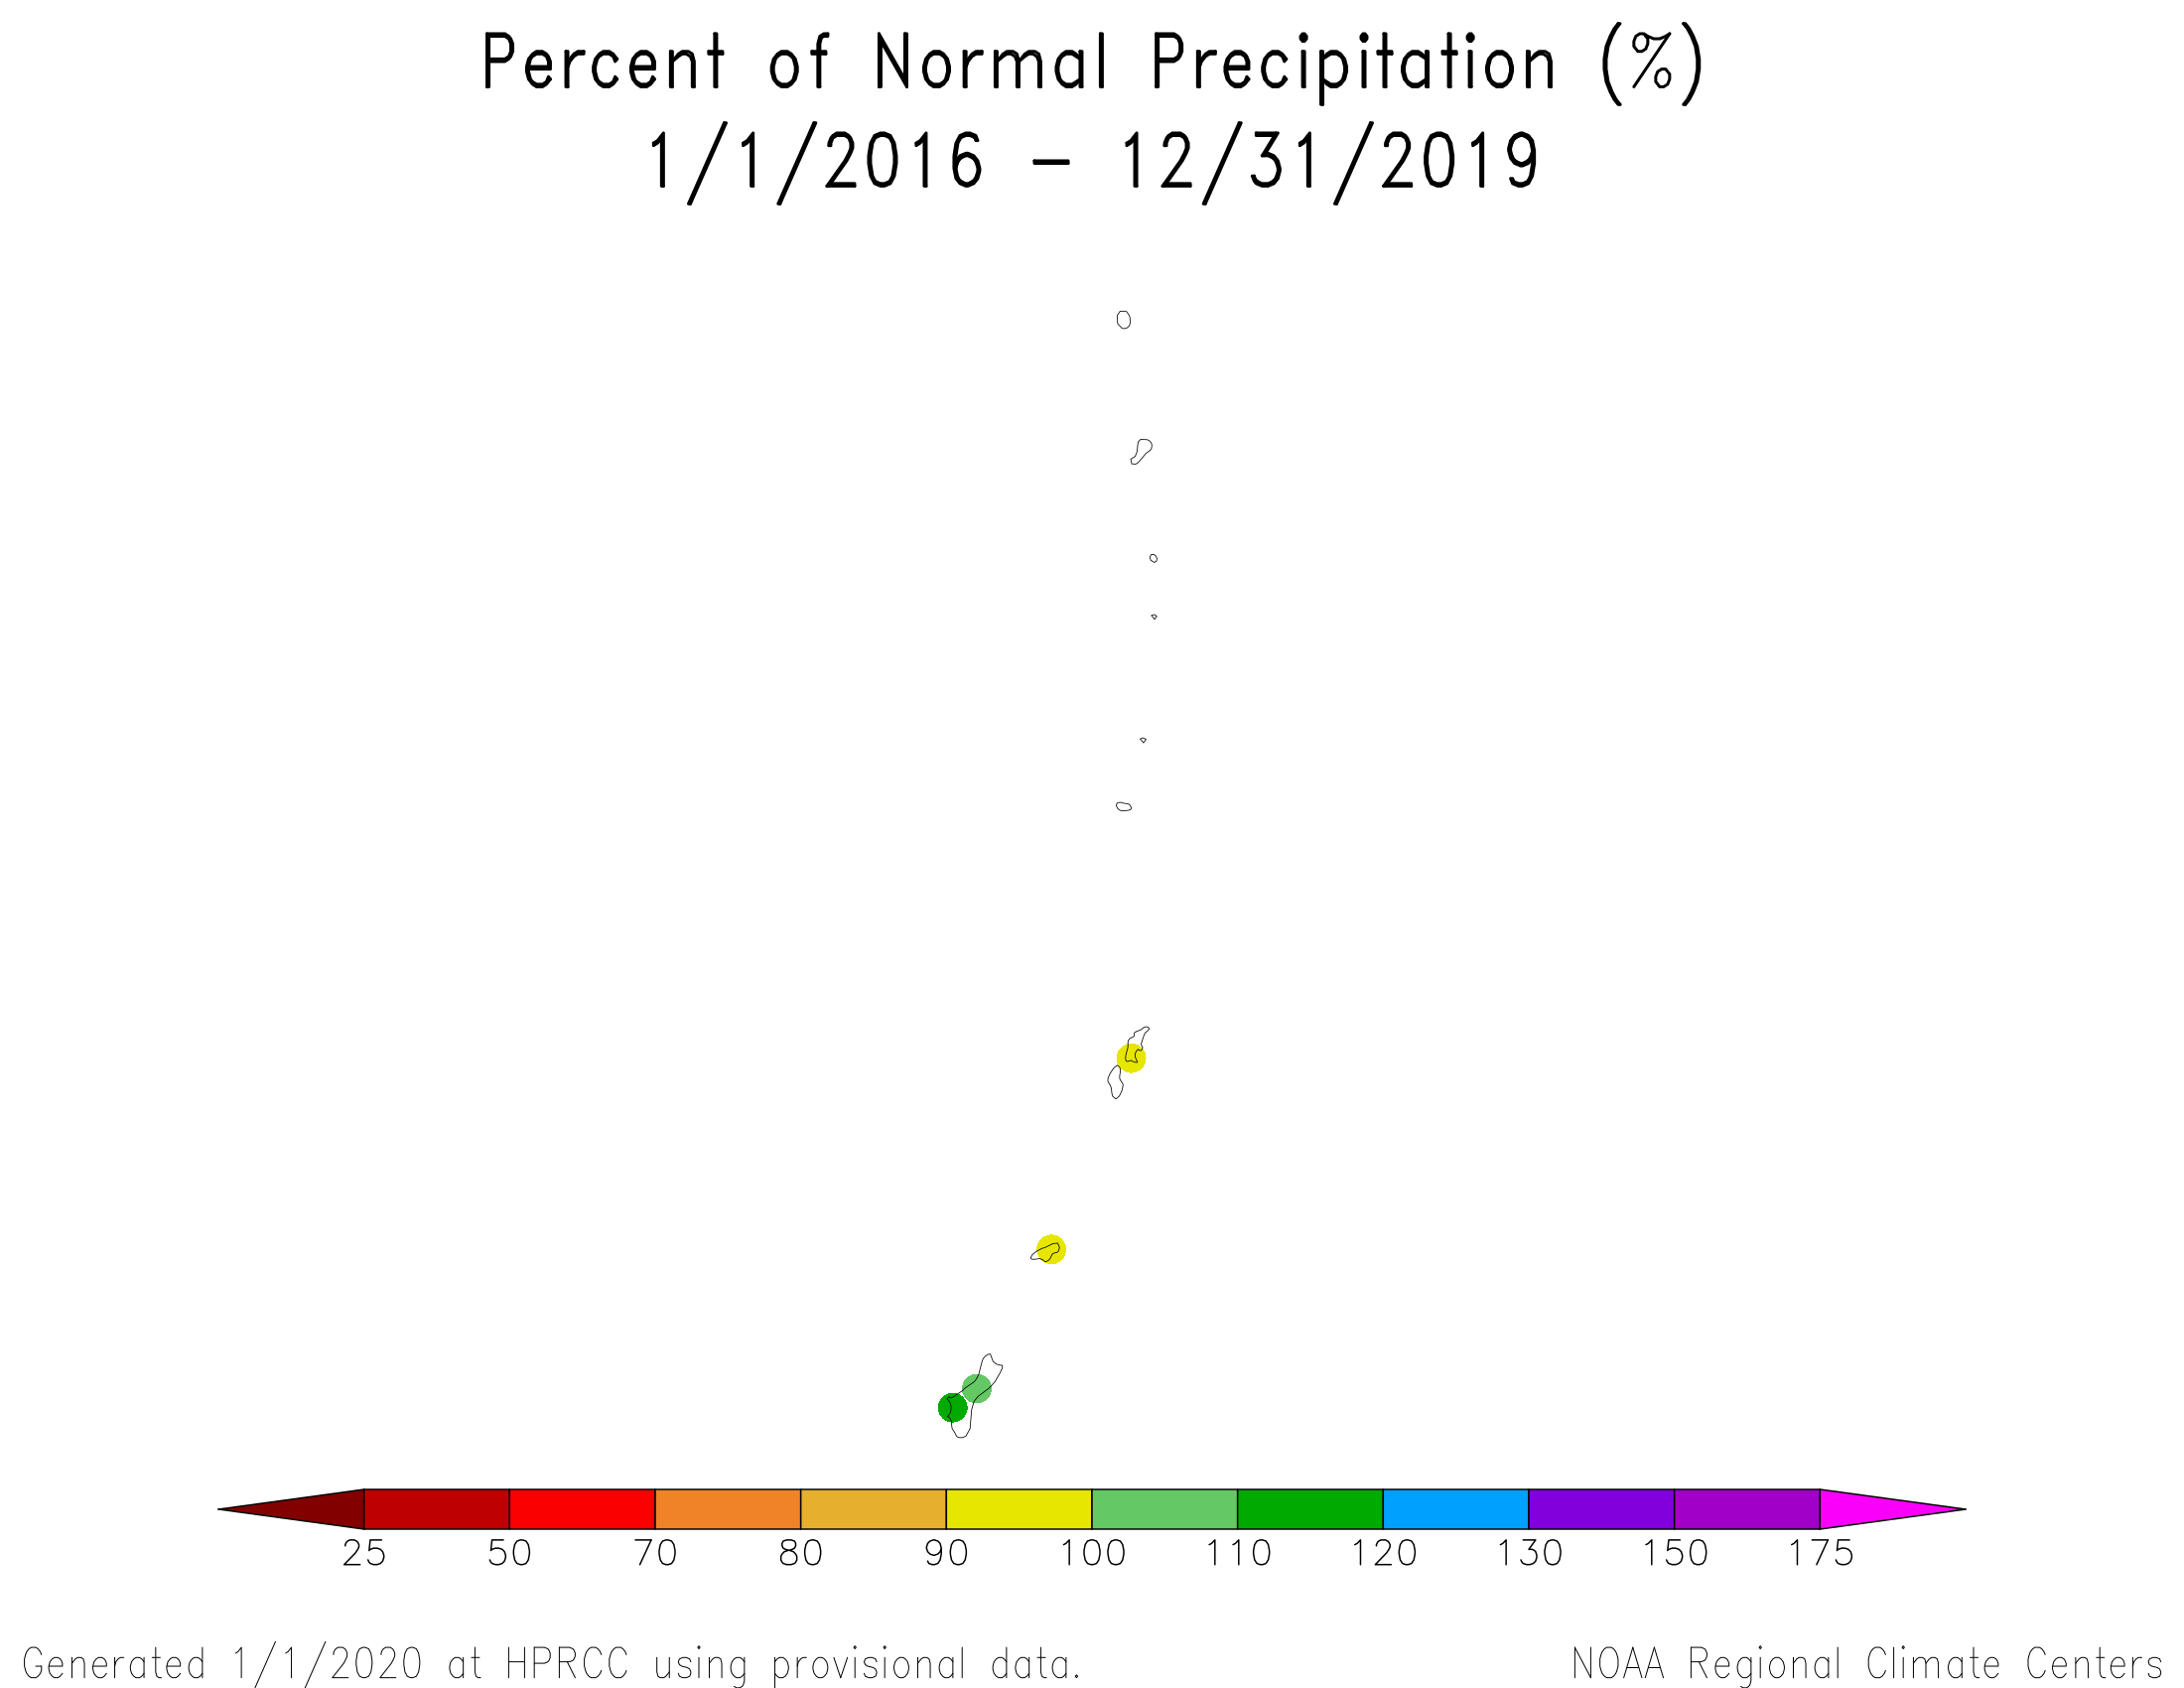
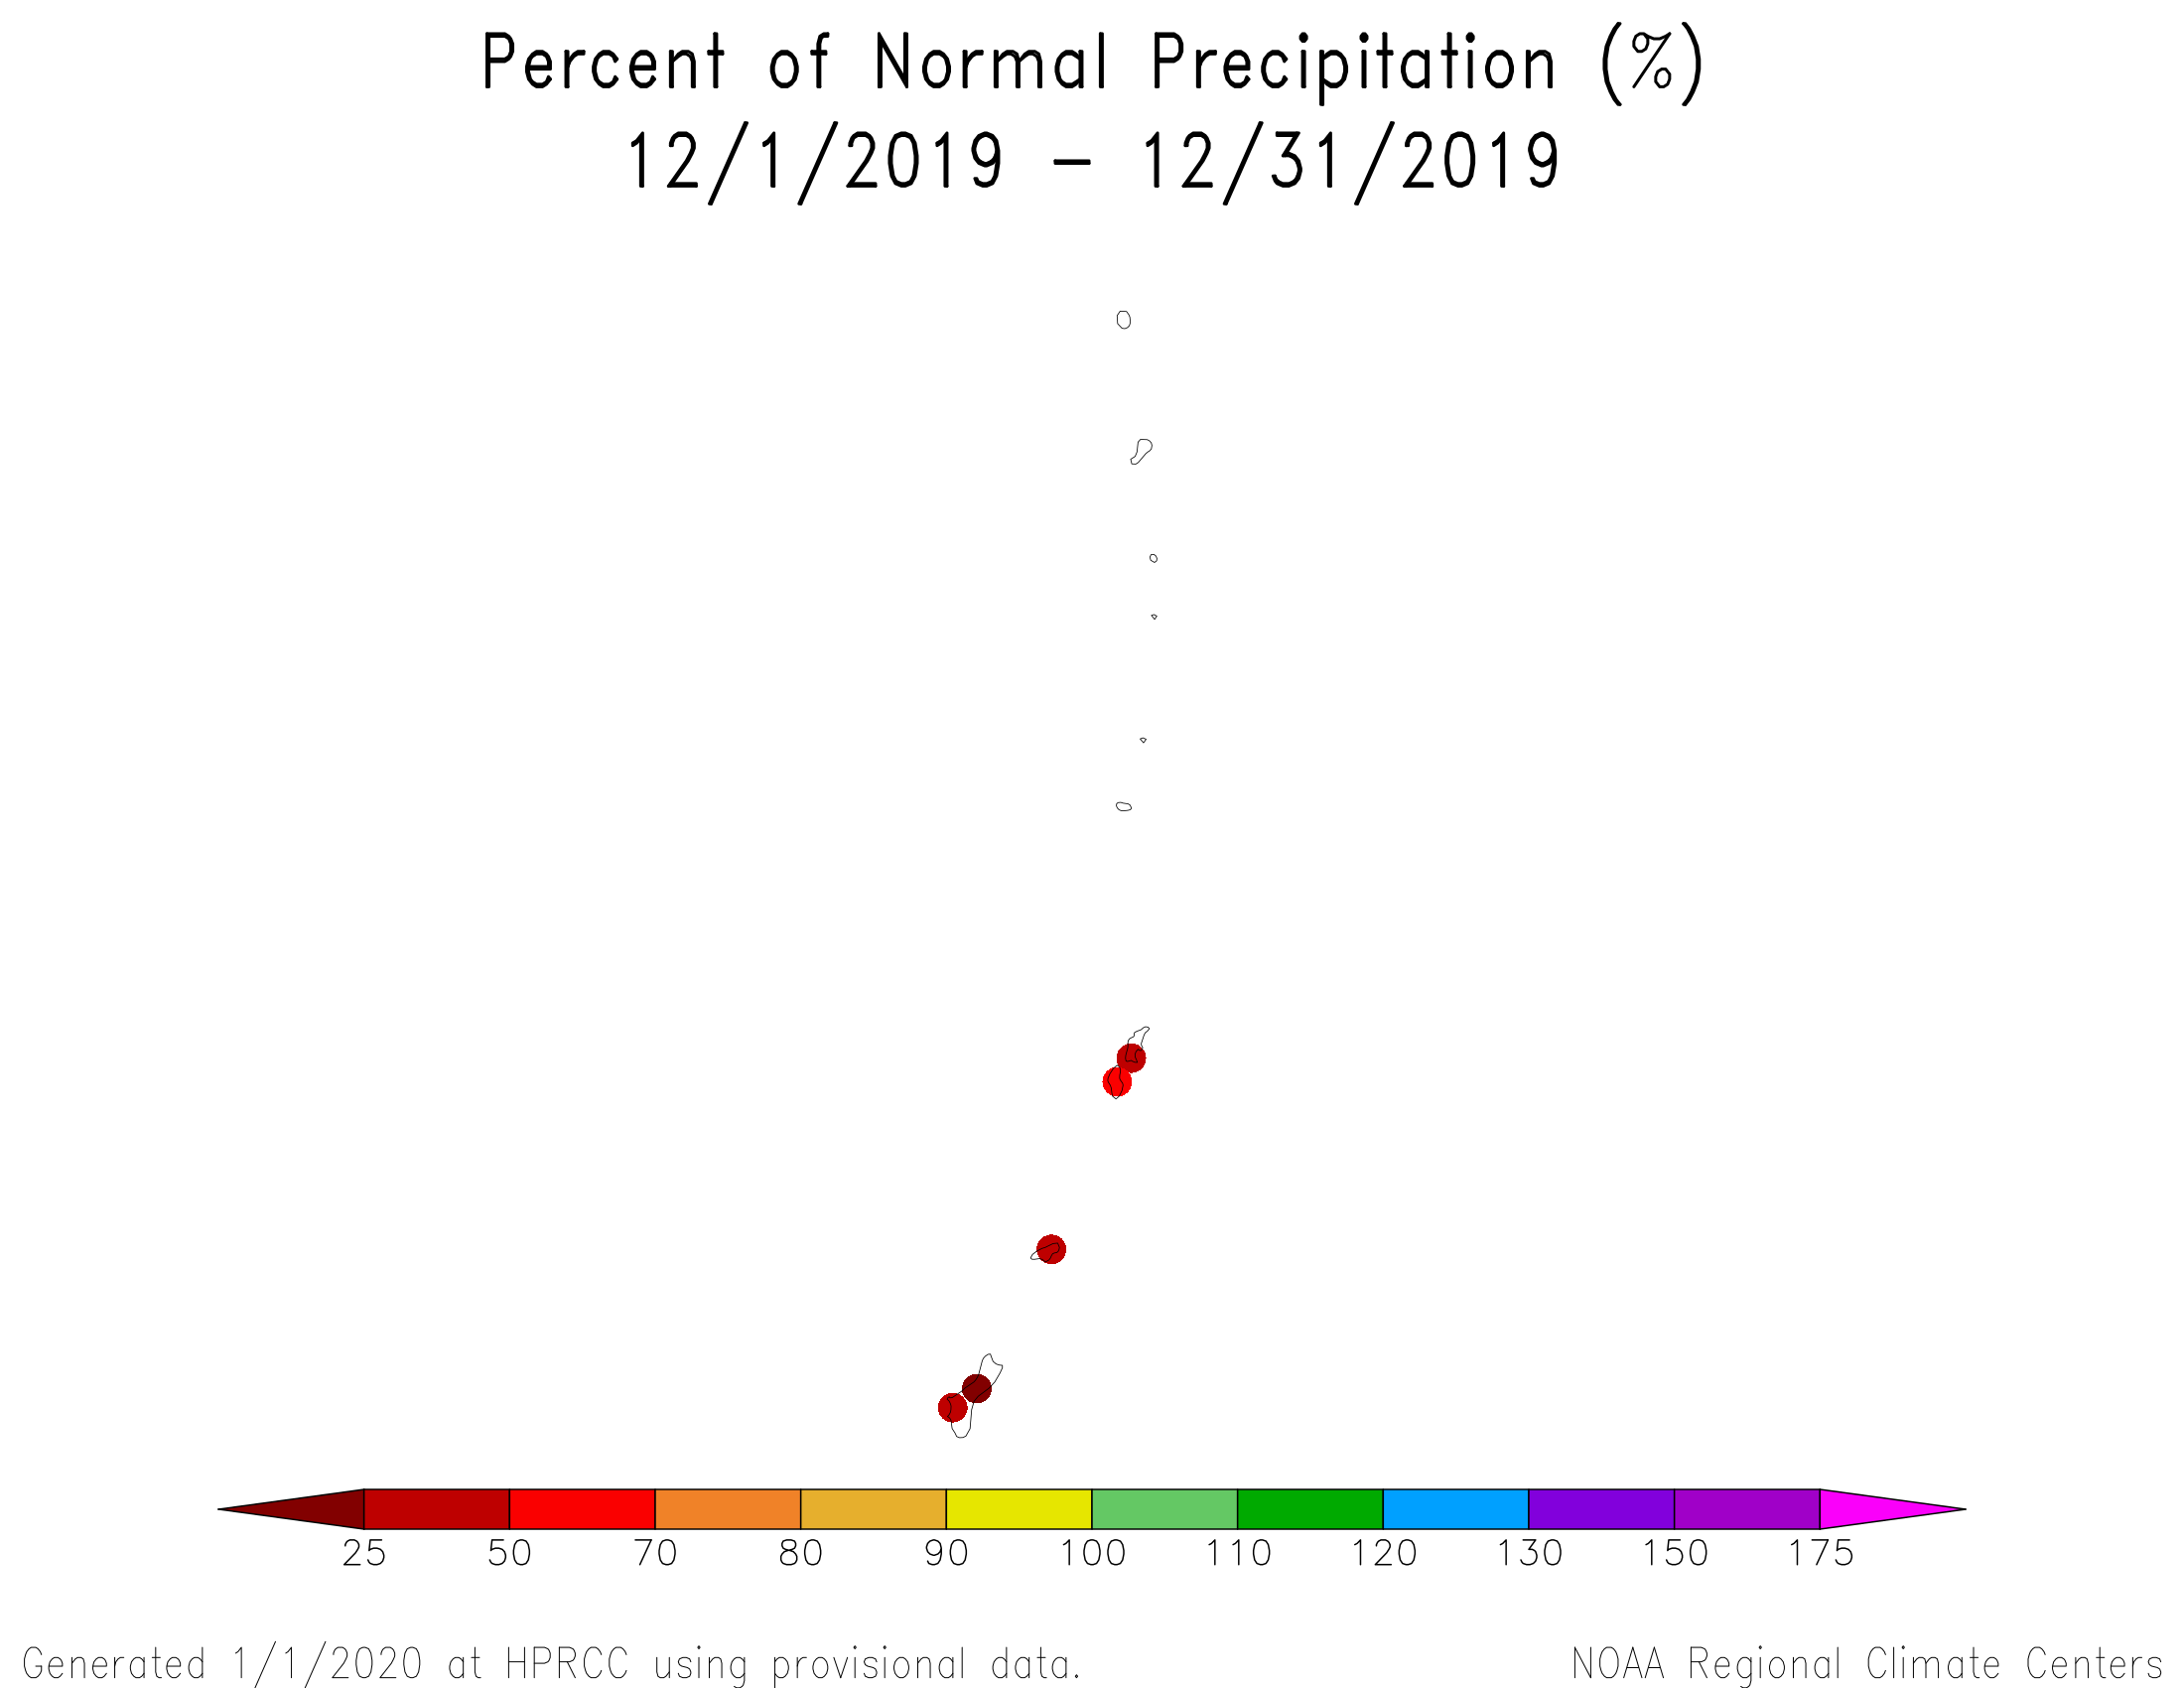 Percent of normal precipitation map for December 2019 for the Marianas Islands.
|
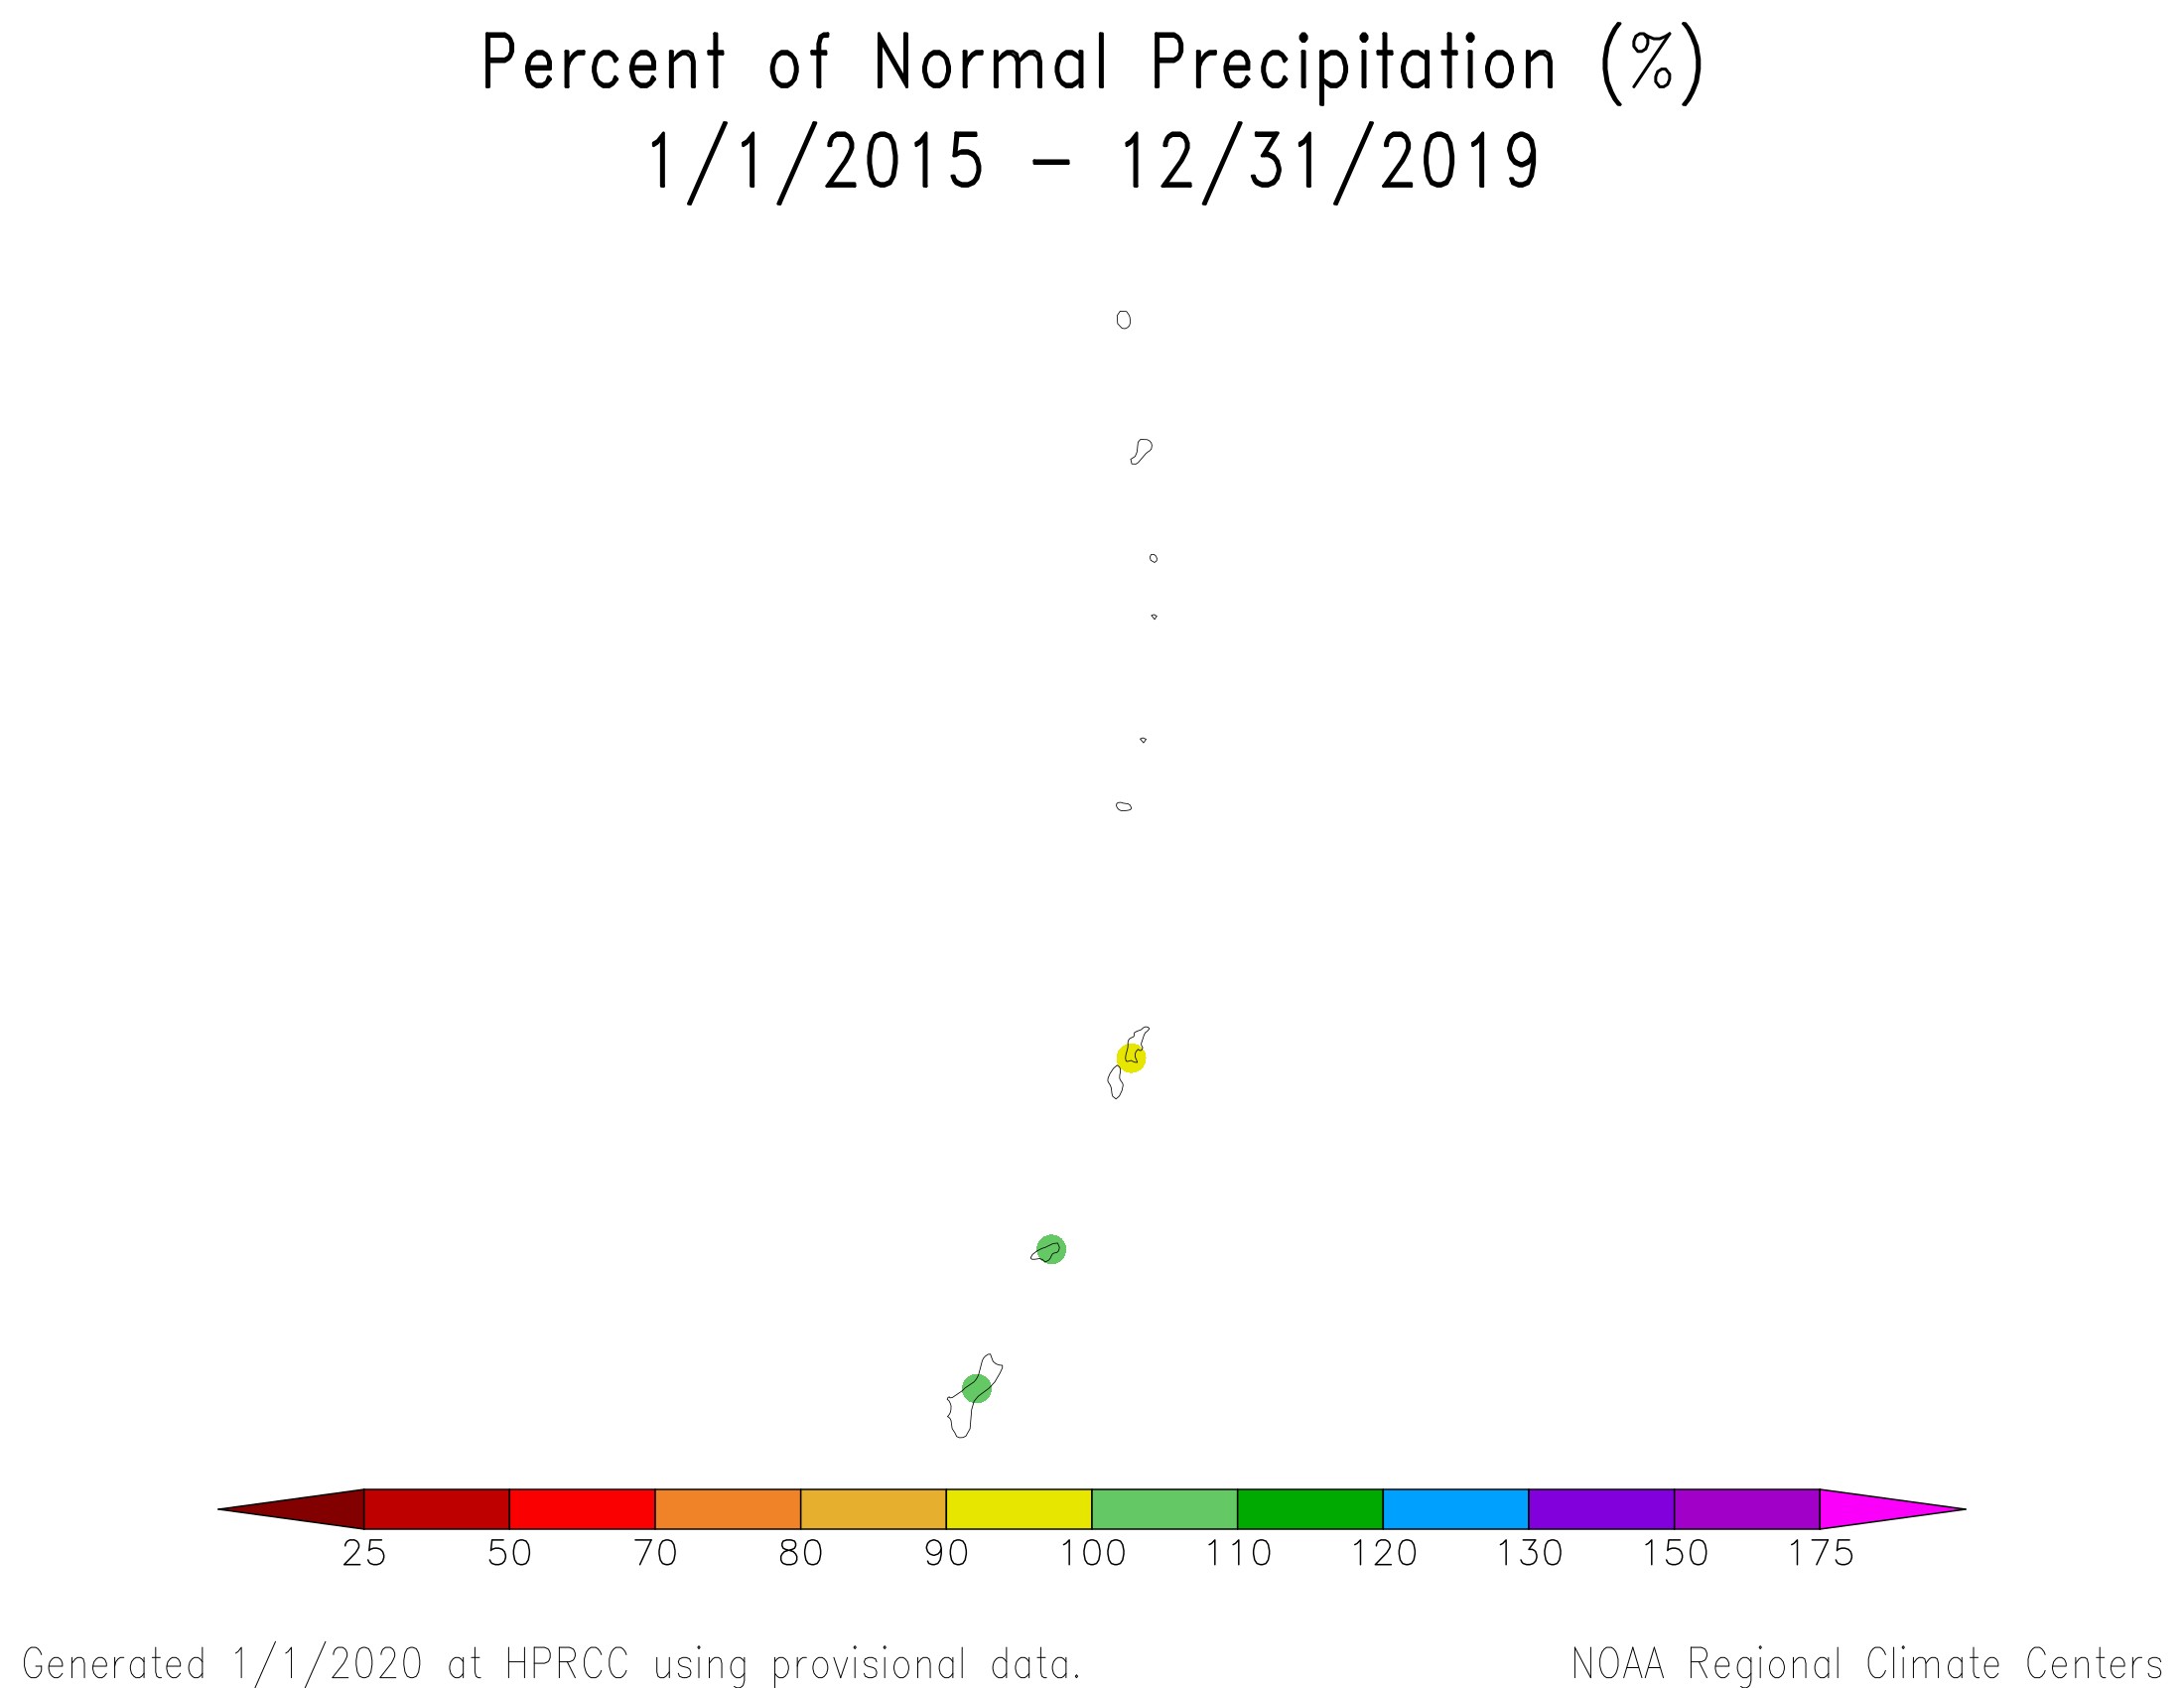
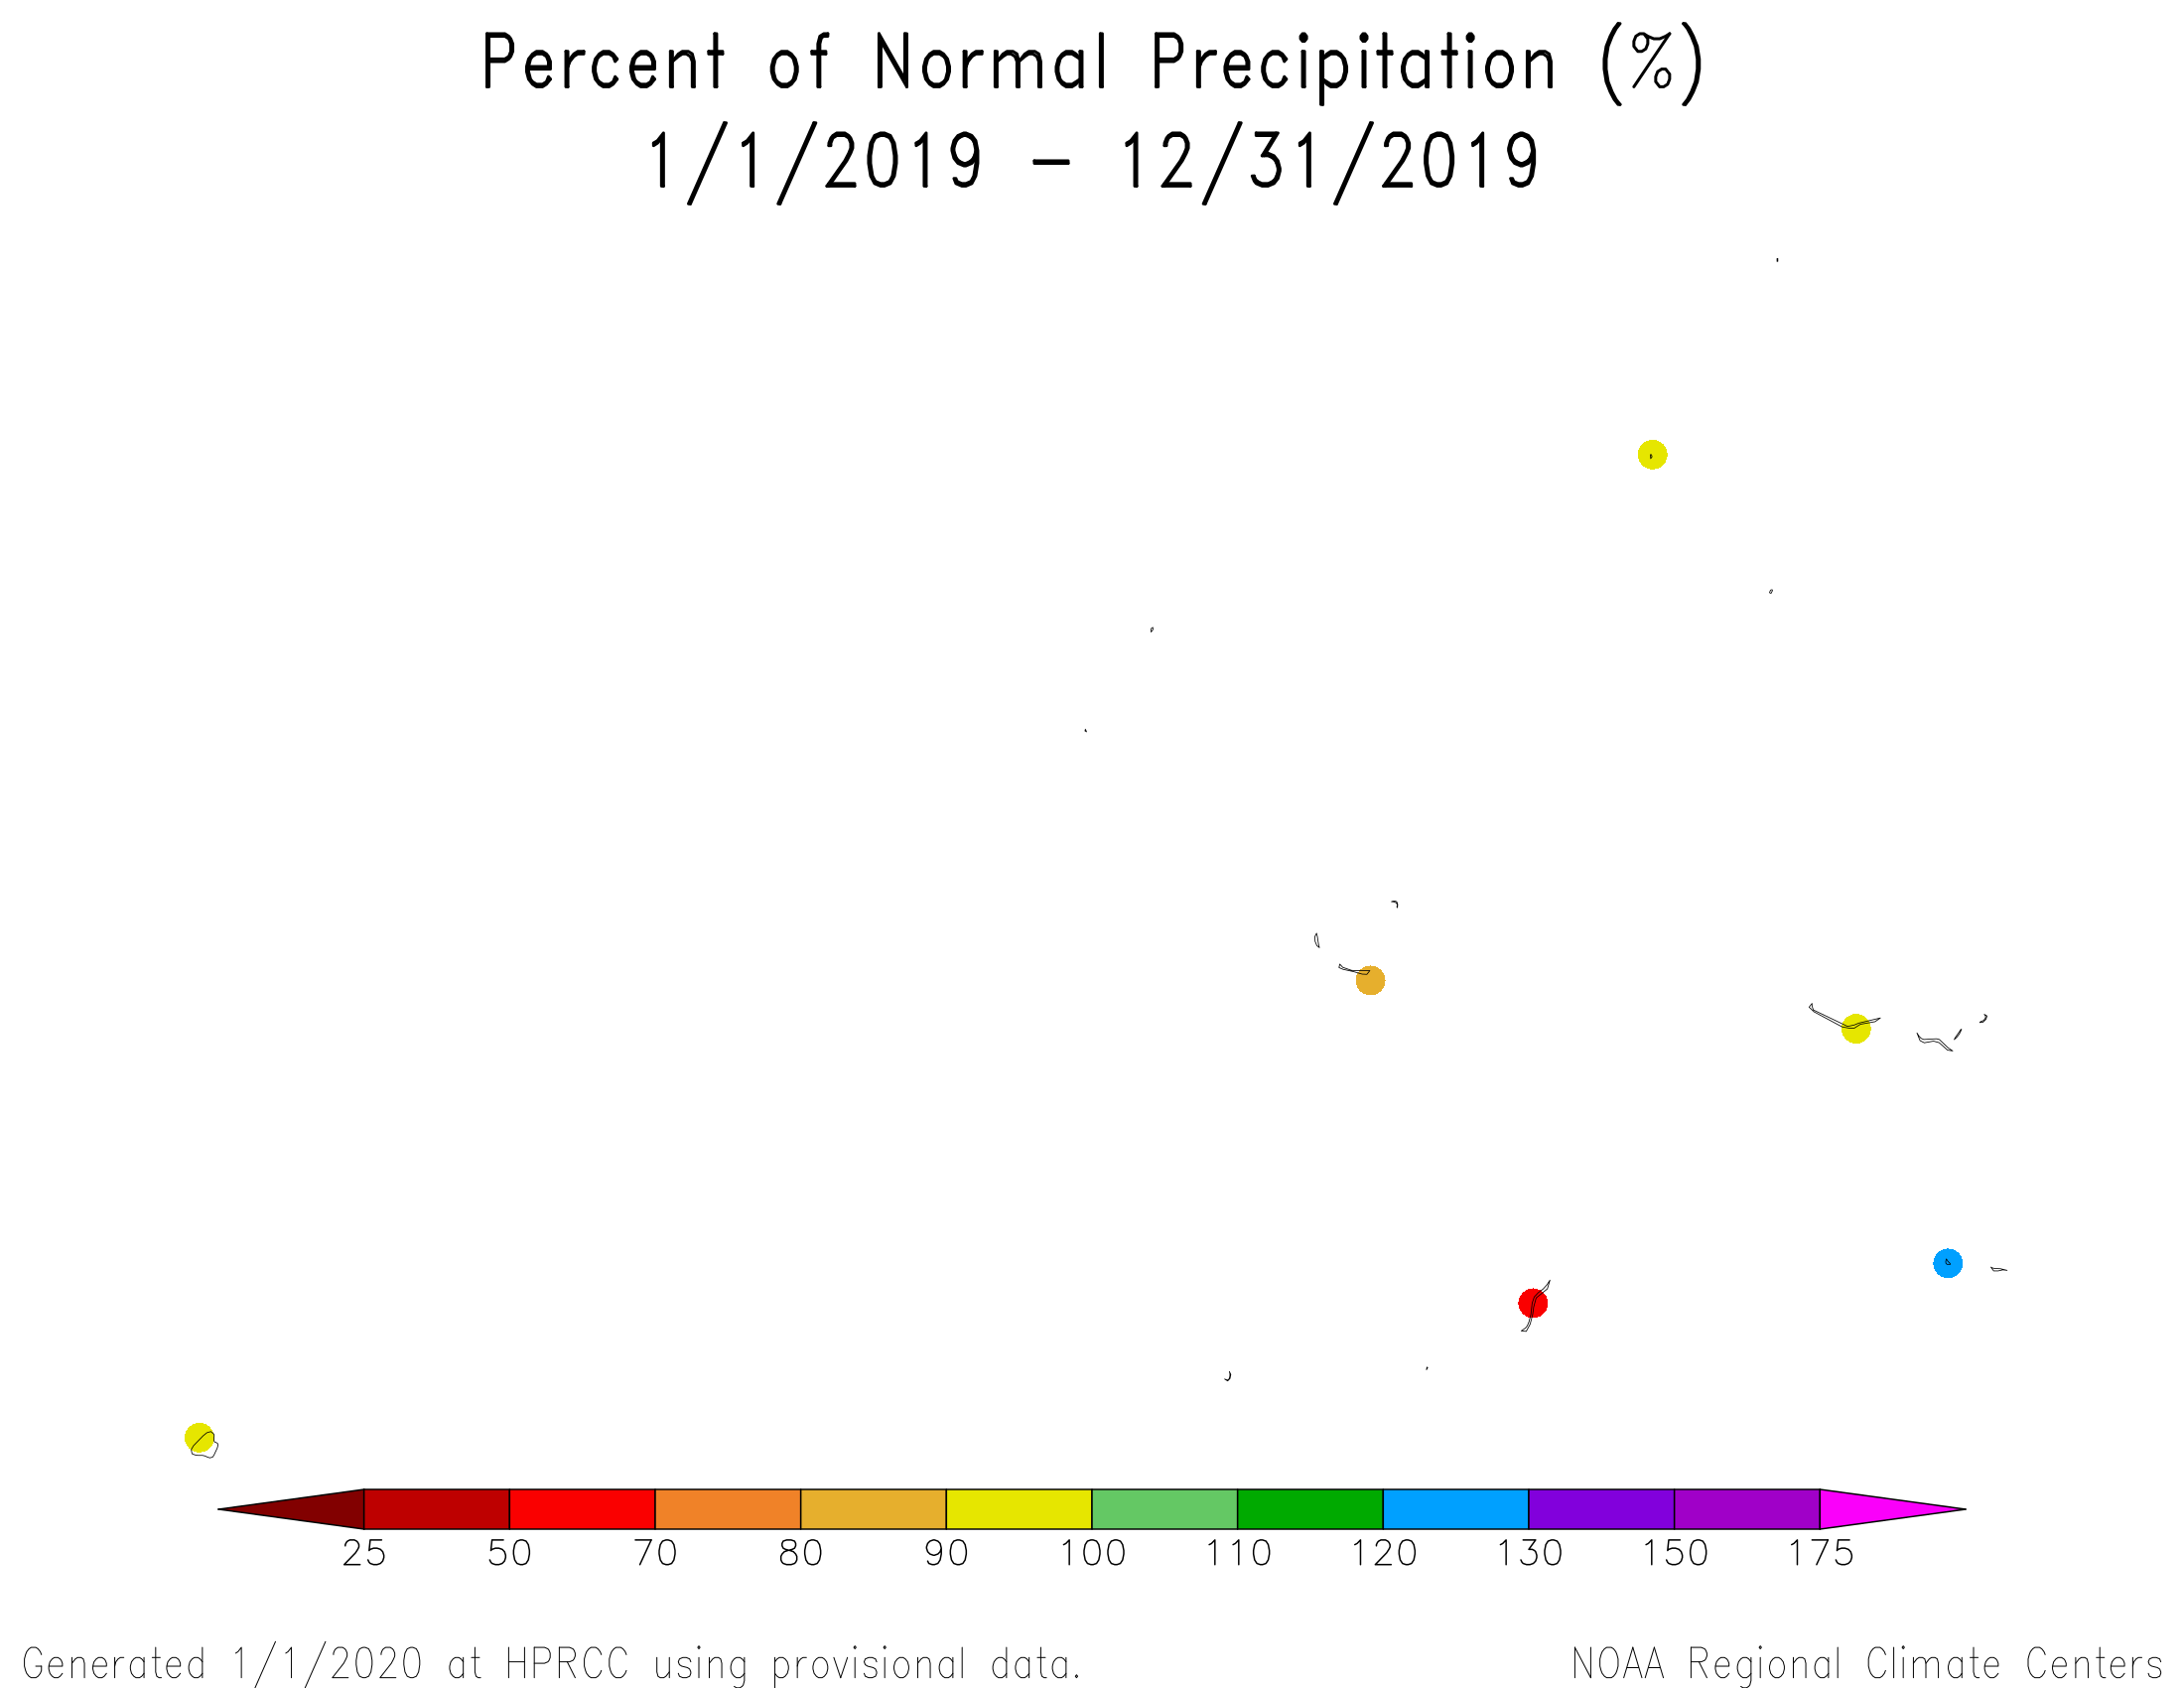 Percent of normal precipitation map for January-December 2019 for the Marshall Islands.
|
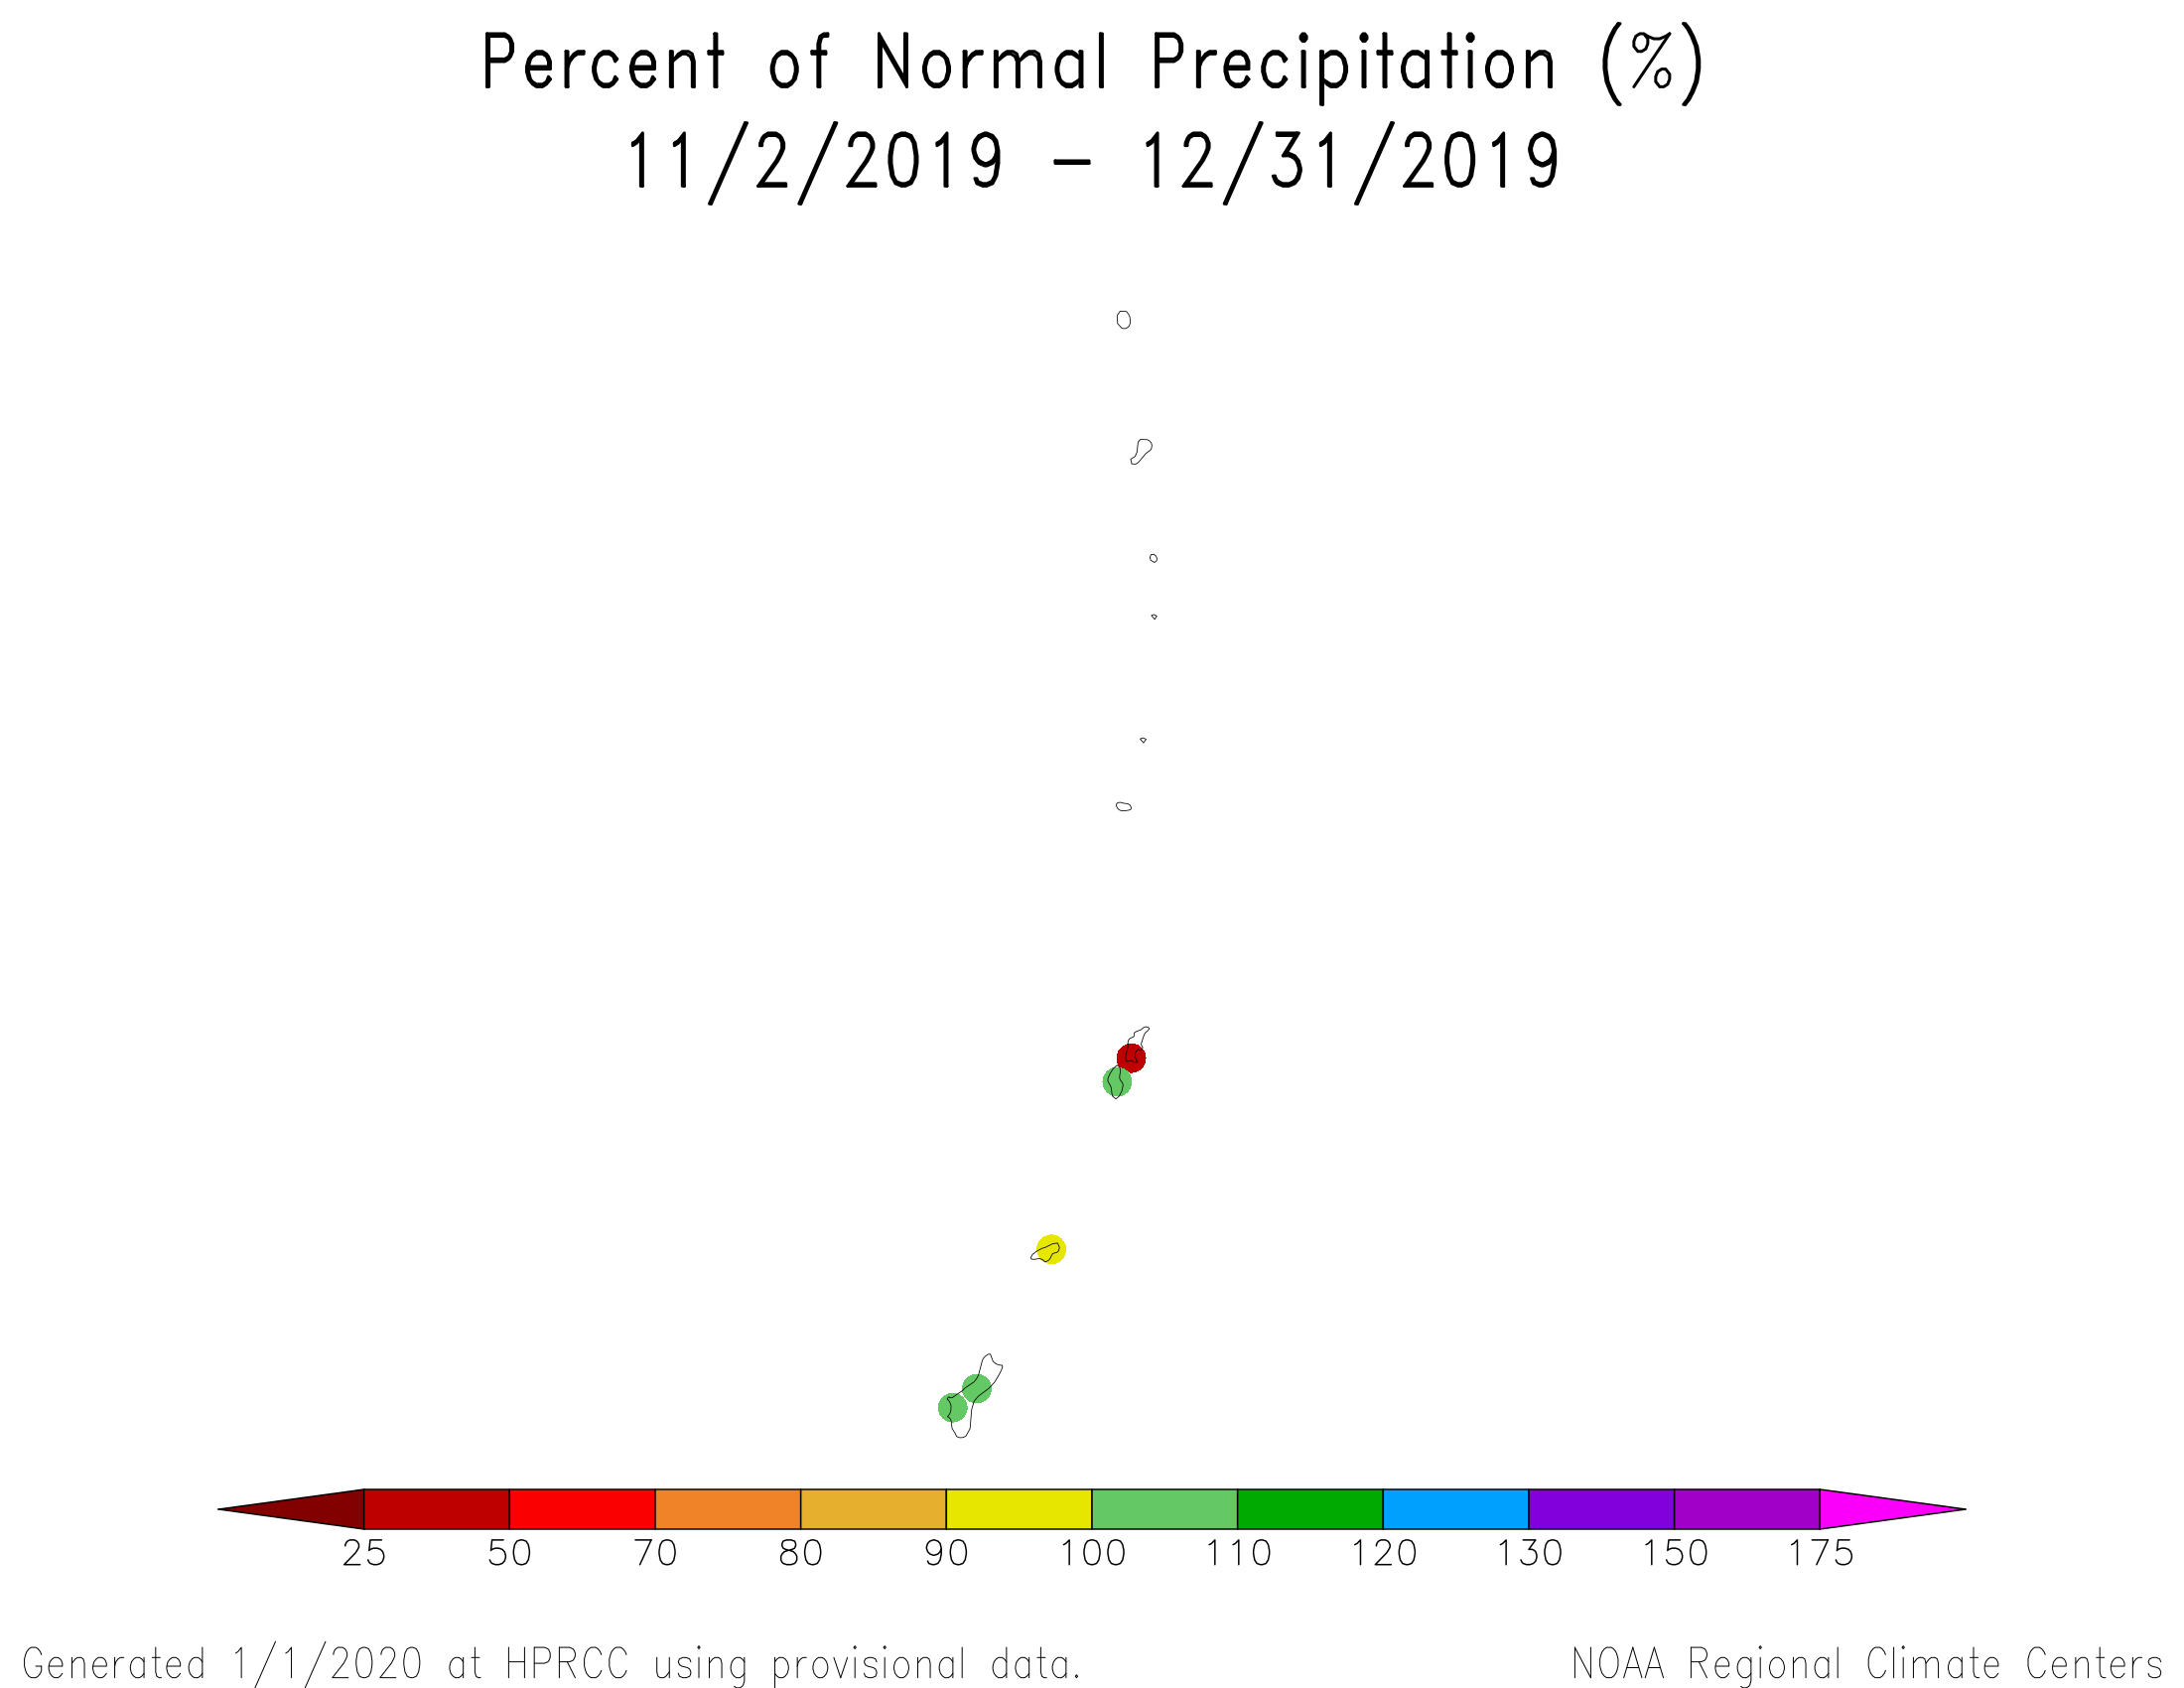
In the Marianas Islands, precipitation was drier than normal regionwide for December. Abundant rainfall during previous months has resulted in a wetter-than-normal precipitation anomaly pattern for the 4- to 6-month time scales. The anomaly pattern was mostly mixed for the other time periods (percent of normal precipitation maps for the last 1, 2, 3, 4, 6, 9, 12, 24, 36, 48, 60 months). In the Marshall Islands, the precipitation anomaly pattern was wetter than normal at the eastern and northern stations and drier than normal at the western stations for the 1- to 9-month time scales, with a mixed pattern at longer time scales (percent of normal precipitation maps for the last 1, 2, 3, 4, 6, 9, 12, 24, 36, 48 months).
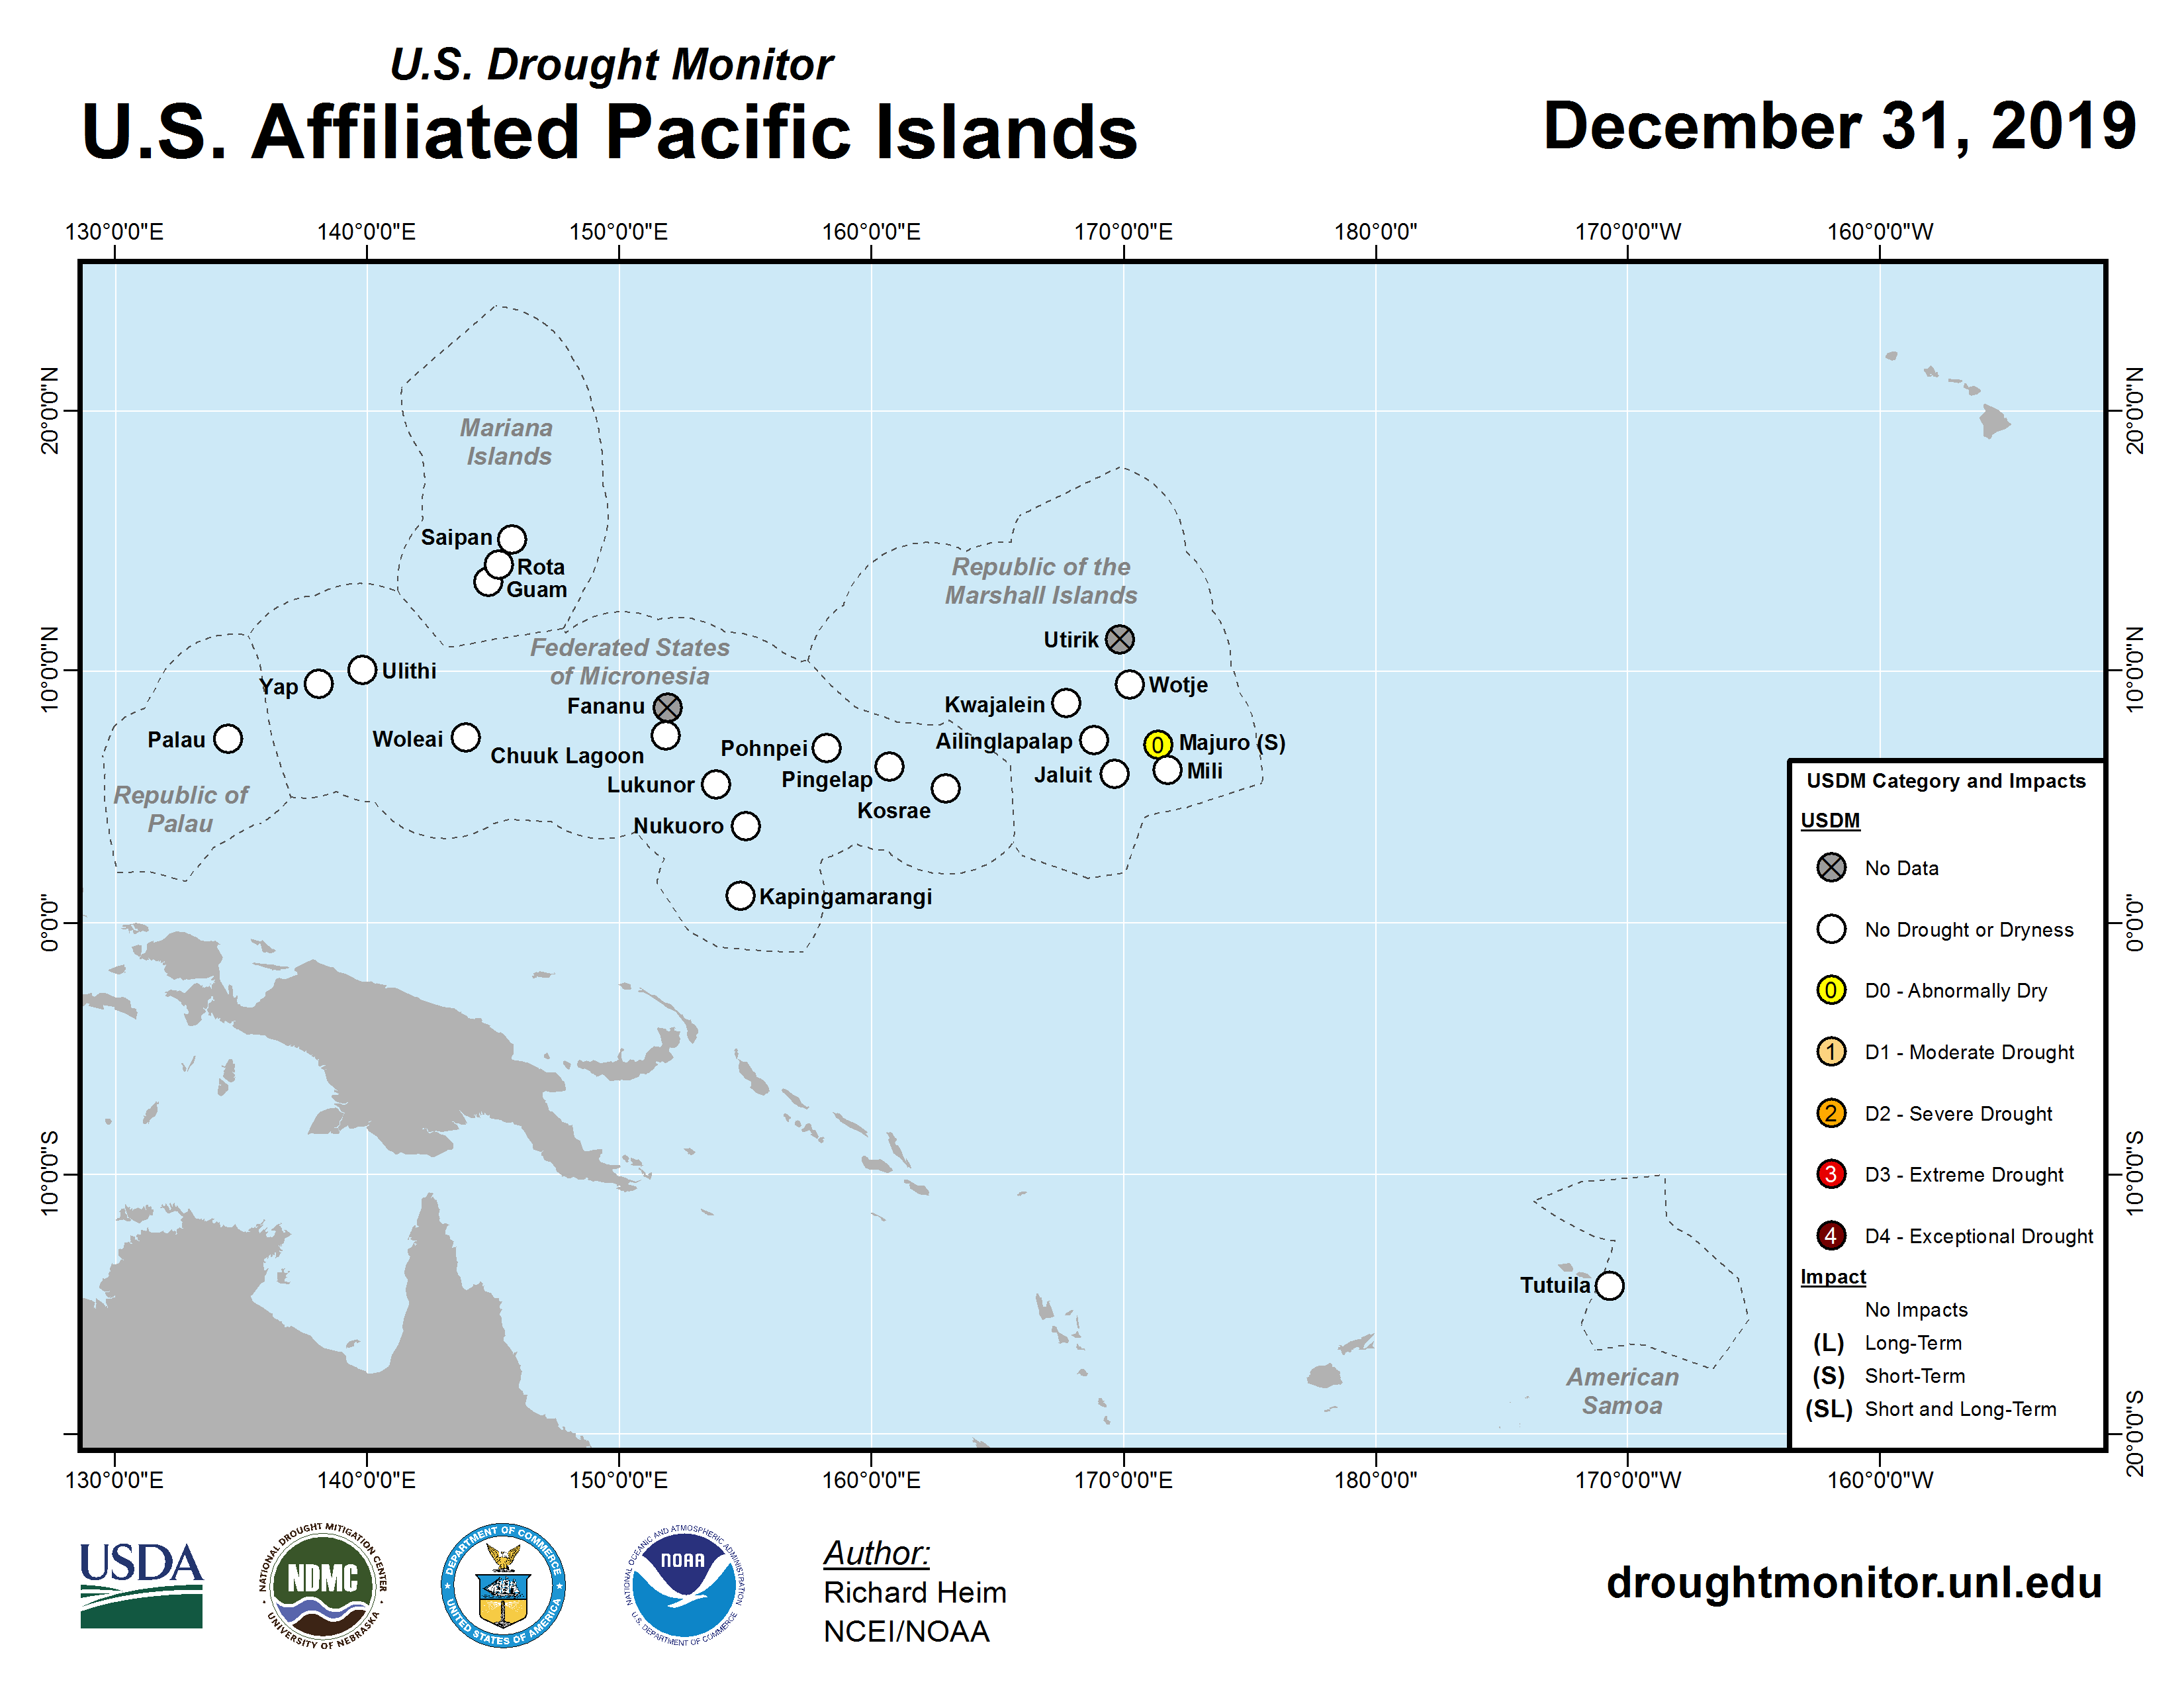
The USAPI U.S. Drought Monitor drought map valid for the end of December 2019.
According to the December 31st USDM produced for the USAPI, abnormal dryness (D0) was present at only Majuro in the RMI. The rest of the stations were free of drought or abnormal dryness. Storage in the Majuro reservoirs showed a steady decline during December, starting at 31.4 million gallons at the beginning of the month, falling to 24.6 million gallons by the end of the month, or about 68 percent of maximum, which is below the 80 percent threshold for concern.
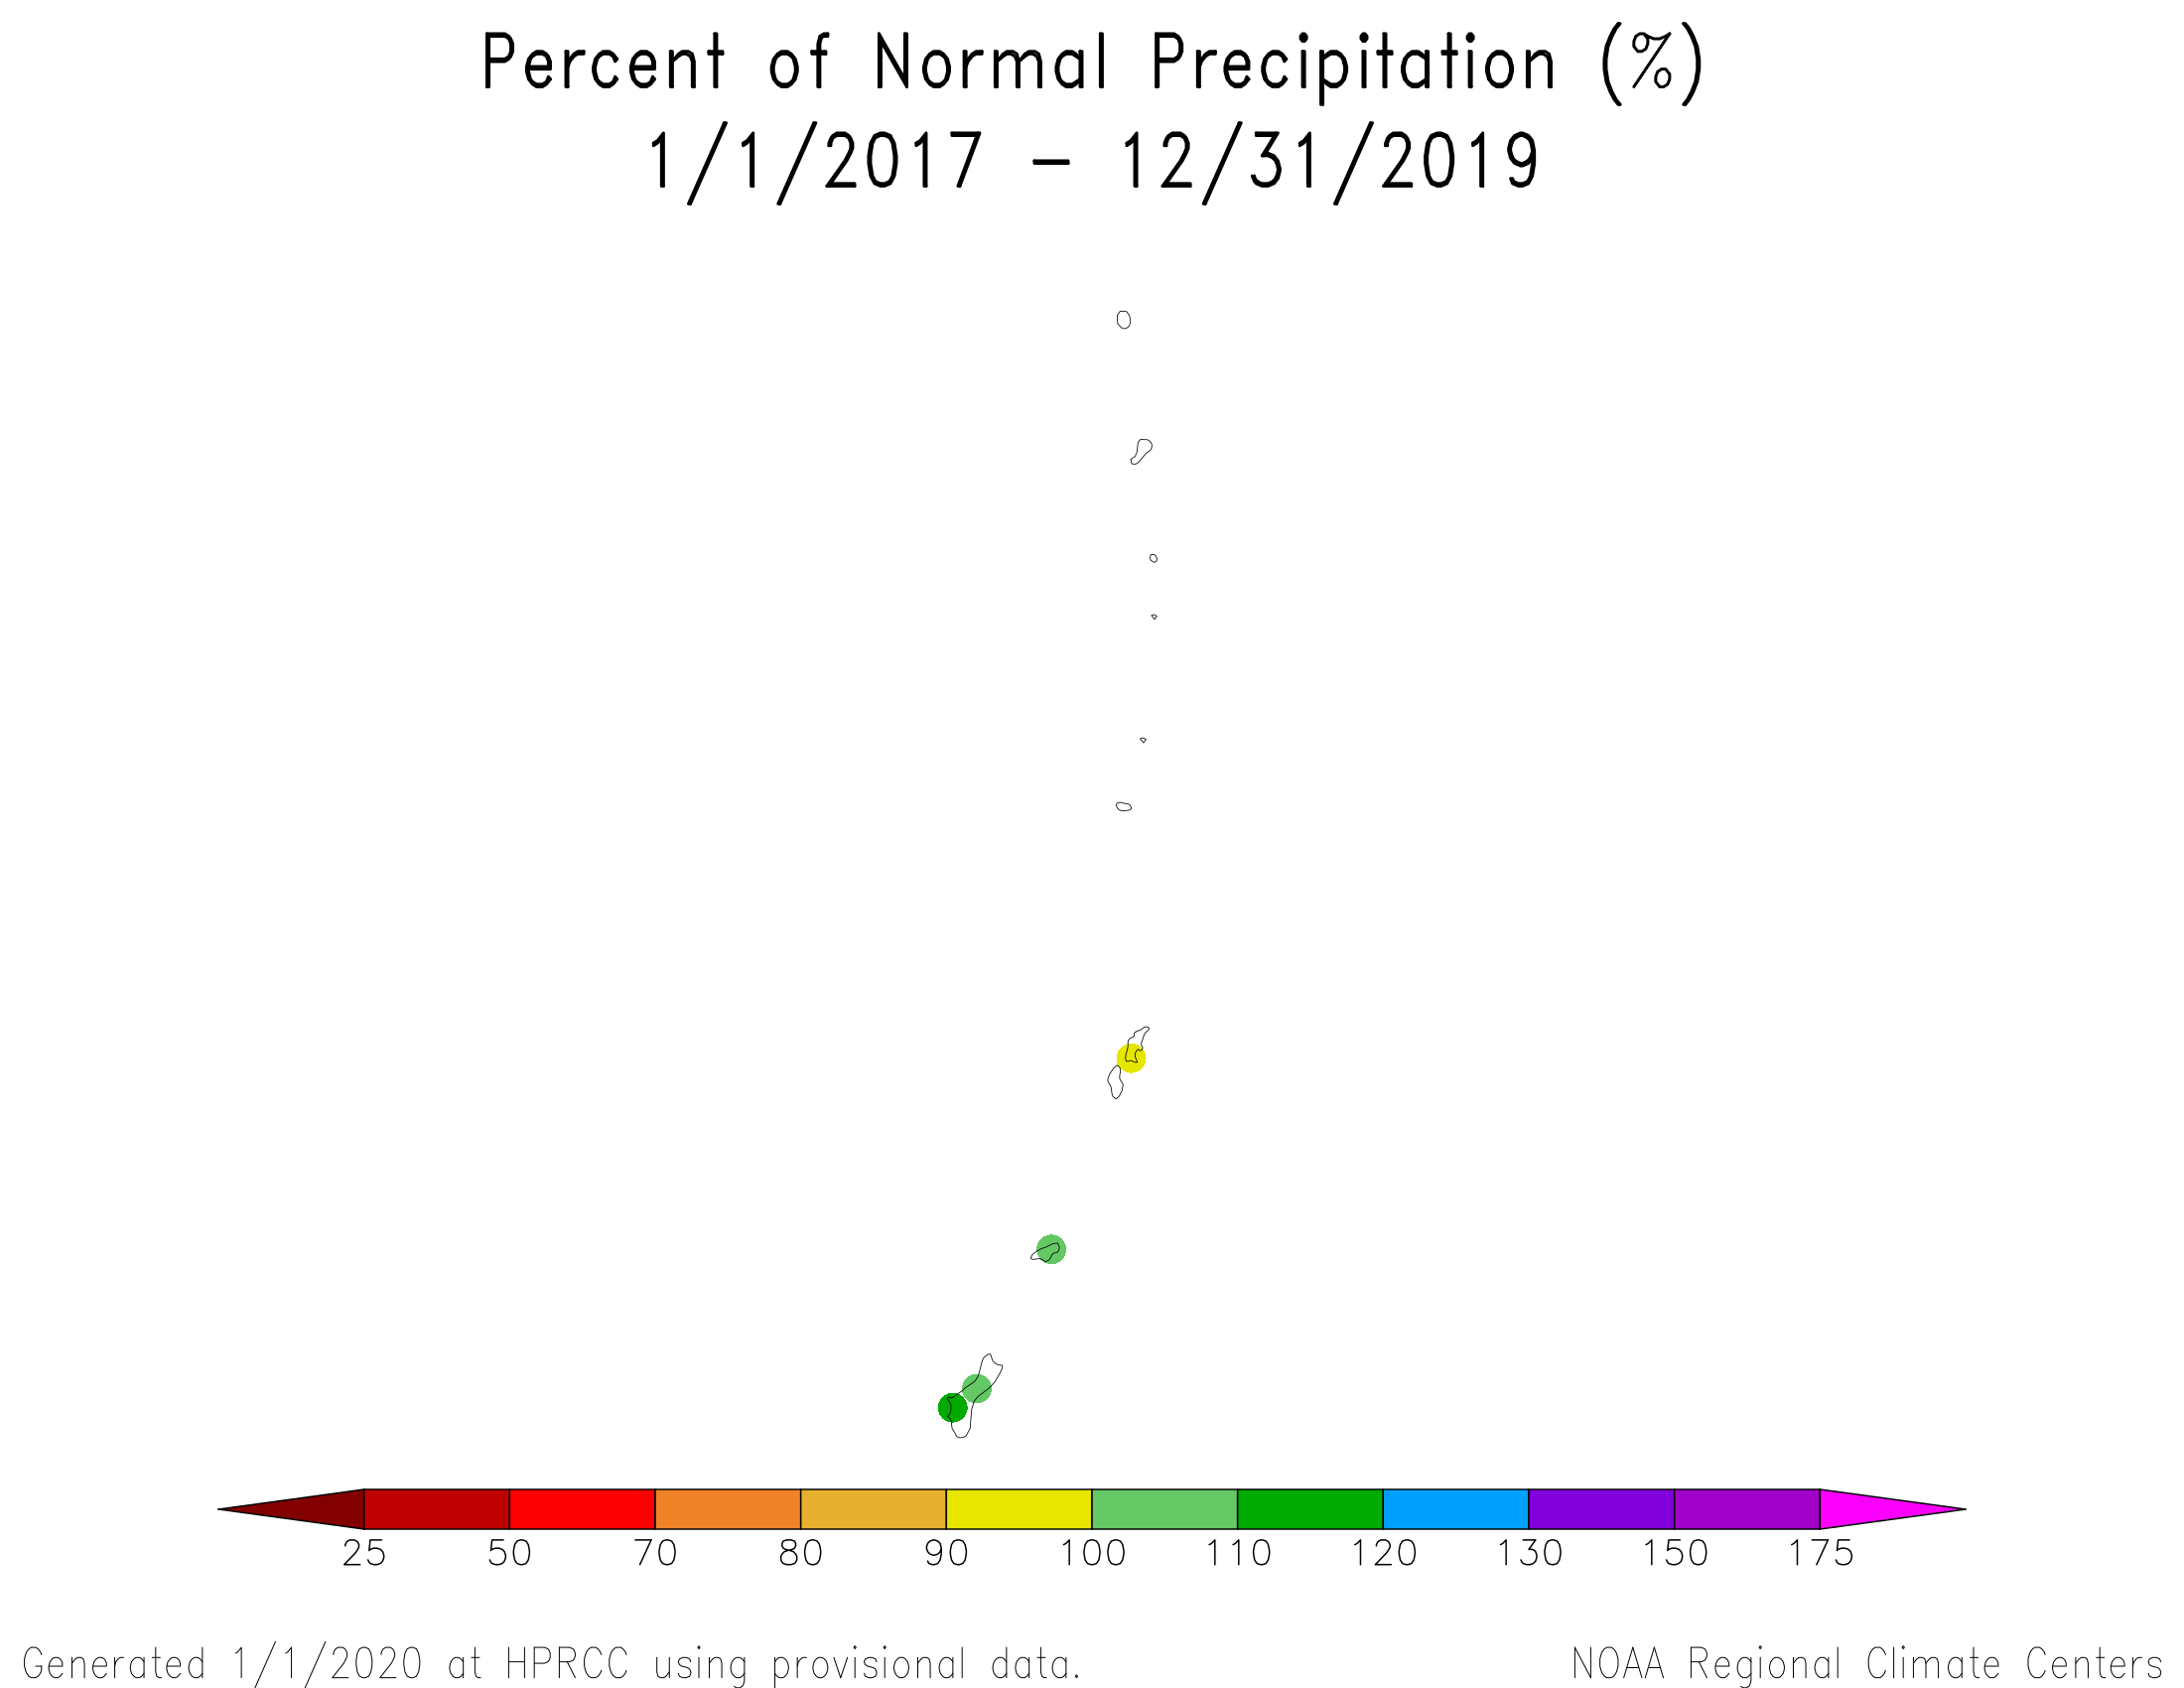
The dry conditions in December 2019 in parts of Micronesia resulted in the driest December in the 63-year record at Guam and driest September-December (in 35 years) and May-December (23 years) at Lukonor. Other low precipitation ranks included the sixth driest December in a 52-year record, and seventh driest July-December (in 39 years), for Kosrae; seventh driest December (37 years) and third driest September-December (36 years) at Nukuoro; second driest July-December (27 years) at Woleai; sixth driest July-December (69 years) at Yap; sixth driest June-December (68 years) at Kwajalein; and sixth driest April-December (35 years) at Ailinglapalap. (It should be noted that there may have been an undercatch issue with Jaluit's rain gauge earlier in 2019.)
The following analysis of historical data for the USAPI stations in the Global Historical Climatology Network-Daily (GHCN-D) dataset, augmented with fill-in data from the 1981-2010 Normals, helps put the current data into historical perspective by computing ranks based on the period of record. The table below lists the precipitation ranks for December 2019, July-December 2019 (last 6 months), and January-December 2019 (the last 12 months). Some stations have a long period of record and their dataset is fairly complete, while other stations have a shorter period of record and the dataset has some missing data.
Rank of 1 = driest.
| Station | Dec 2019 Rank |
Dec No. of Years |
Jul- Dec 2019 Rank |
Jul- Dec No. of Years |
Jan- Dec 2019 Rank |
Jan- Dec No. of Years |
Period of Record |
| Pago Pago | 39 | 54 | 39 | 54 | 43 | 53 | 1966-2019 |
| Saipan | 18 | 31 | 32 | 39 | 29 | 31 | 1981-2019 |
| Kapingamarangi | 9 | 29 | 12 | 19 | 16 | 17 | 1962-2019 |
| Kosrae | 6 | 52 | 7 | 39 | 12 | 33 | 1954-2019 |
| Lukonor | 13 | 36 | 2 | 23 | 5 | 23 | 1981-2019 |
| Nukuoro | 7 | 37 | 7 | 36 | 11 | 35 | 1981-2019 |
| Pingelap | MSG | 35 | MSG | 34 | MSG | 32 | 1981-2019 |
| Ulithi | 27 | 37 | MSG | 35 | MSG | 33 | 1981-2019 |
| Woleai | 23 | 39 | 2 | 27 | 4 | 24 | 1968-2019 |
| Yap | 39 | 69 | 6 | 69 | 14 | 68 | 1951-2019 |
| Pohnpei | 60 | 69 | 67 | 69 | 59 | 68 | 1951-2019 |
| Chuuk | 65 | 69 | 39 | 69 | 42 | 68 | 1951-2019 |
| Guam | 1 | 63 | 38 | 63 | 24 | 62 | 1957-2019 |
| Koror | 21 | 69 | 26 | 68 | 15 | 67 | 1951-2019 |
| Ailinglapalap | 11 | 36 | 8 | 35 | 8 | 35 | 1981-2019 |
| Jaluit | 11 | 36 | 3 | 36 | 2 | 35 | 1981-2019 |
| Mili | 32 | 36 | 33 | 34 | 31 | 34 | 1981-2019 |
| Utirik | MSG | 19 | MSG | 8 | MSG | 4 | 1985-2019 |
| Wotje | 29 | 35 | 31 | 34 | 21 | 34 | 1981-2019 |
| Kwajalein | 37 | 68 | 14 | 68 | 9 | 67 | 1952-2019 |
| Majuro | 44 | 66 | 32 | 66 | 25 | 65 | 1954-2019 |
[top]
State/Regional/National Moisture Status
A detailed review of drought and moisture conditions is available for all contiguous U.S. states, the nine standard regions, and the nation (contiguous U.S.):
| northeast u. s. | east north central u. s. | central u. s. |
| southeast u. s. | west north central u. s. | south u. s. |
| southwest u. s. | northwest u. s. | west u. s. |
| Contiguous United States |
[top]
Contacts & Questions