|
Contents Of This Report: |
|
National Drought Overview
|
|
[top]
Detailed Drought Discussion
July 2010 was wetter (11th wettest) and warmer (17th warmest) than normal when weather conditions are averaged across the country. But considerable variability occurred throughout the month (weeks 1, 2, 3, 4, 5) and on a regional basis. Beneficial rain fell across drought and abnormally dry areas of the western Great Lakes, southern Plains, and Alaska while much of the West and Hawaii, and parts of the East, were drier than normal. The dryness in the South and East was accompanied by unusually warm conditions which enhanced evaporation. Prolonged dryness continued over Hawaii. By the end of July, drought or abnormally dry areas intensified or expanded in parts of the East Coast, Southeast, and Lower to mid-Mississippi Valley, but contracted in the northern Rockies, western Great Lakes, southern Plains, and Alaska.

The U.S. Drought Monitor drought map valid August 3rd, 2010.
Like last month, the  weather pattern for July consisted of an extension of the North Atlantic High pressure system which brought hot and dry weather to much of the eastern United States. An active July jet stream channeled the storm track across the northern tier states. A few cold fronts managed to penetrate into the Southeast, but widespread frontal precipitation was inhibited by the descending air associated with the North Atlantic High (also known as the Bermuda High). The Bermuda High kept tropical systems away from the continental U.S., but remnant tropical moisture was entrained into the circulation, feeding storms in the Southeast and along the storm track in the north.
By the end of July, core drought areas in the U.S. included:
- parts of Hawaii, where moderate (D1) to exceptional (D4) drought persisted;
- the Lower to Mid-Mississippi Valley, where extreme (D3) drought expanded over northern Louisiana and moderate (D1) drought developed over southeast Missouri to western Kentucky;
- the western Great Lakes, where moderate (D1) to severe (D2) drought conditions persisted in spite of additional recovery this month;
- parts of the Southeast to Northeast, where areas of severe drought (D2) had developed and abnormal dryness (D0) to moderate drought (D1) had expanded; and
- parts of the West, where abnormal dryness (D0) to severe drought (D2) expanded in some areas and contracted in others.
 |
 |
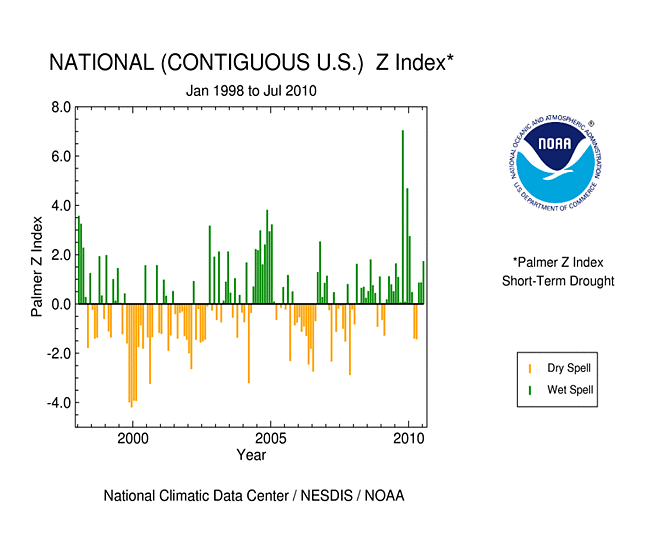
The Palmer drought indices measure the balance between moisture demand (evapotranspiration driven by temperature) and moisture supply (precipitation). The Palmer Z Index depicts moisture conditions for the current month, while the Palmer Hydrological Drought Index (PHDI) and Palmer Drought Severity Index (PDSI) depict the current month's cumulative moisture conditions integrated over the last several months. As seen on the Palmer Z Index map, low precipitation and hot temperatures resulted in unusually dry conditions for July 2010 over the much of the Southeast to coastal Northeast, while unusually wet conditions occurred over the western Great Lakes and northern Plains to the southern Plains. Compared with the June 2010 PHDI map, the July 2010 PHDI map indicates that drought conditions improved over the western Great Lakes, but they deteriorated over parts of the Northeast, Southeast, and Lower to Mid-Mississippi Valley states. The July 2010 PHDI map also reflects the long-term nature of the drought conditions over the western Great Lakes. The Z Index and PHDI maps in combination show that the dryness in the Lower Mississippi Valley is both a short-term and long-term phenomenon and that the short-term dryness in the mid-Atlantic to Southeast states is showing up more strongly in the long-term conditions.
 |
 |
 |
The Standardized Precipitation Index (SPI) measures moisture supply. The six SPI maps here show the spatial extent of anomalously wet and dry areas at time scales ranging from one month to 24 months. Another month of above-normal precipitation over the western Great Lakes continued to bring short-term relief, but it has not been enough to erase deficits that extend out 6 to 24 months. On the flip side, July dryness in the Pacific Northwest had little effect on the longer term (two- to six-month) wetness in the region. For the bulk of the West, the northern portions have been wetter than normal for the last two to six months, while the southern portions were generally drier than normal. At the longer (12 to 24 months) time scales, the West has been generally near normal to drier than normal. The dryness in the Mid-Atlantic to Southeast States has been prolonged enough to show up in the one- to six-month SPI maps, but wetness dominates at longer time scales. The dryness in the Lower and Mid-Mississippi Valley extends back nine months. The variability of precipitation anomalies in the Northeast over the last one to six months (some months wet and some dry) is also evident. The central Plains to adjoining Midwest is depicted as persistently wet at all time scales.
 |
 |
 |
Did You Know?
Groundwater Drought Indicators
Groundwater is an important factor, or indicator, for drought. Like soil moisture, which is the amount of moisture in the top layers of the ground where plants and crops grow, groundwater is the amount of moisture in the ground but at much deeper levels. Groundwater is recharged from the surface, from sources such as rainfall and streamflow. If there is a substantial amount of groundwater, an aquifer is formed which can be tapped for agricultural, municipal, or industrial use via extraction wells. The depth at which the ground is completely saturated with water is called the water table.
Groundwater is measured via a network of wells, which monitor the depth of the water table. For drought-monitoring purposes, this well data needs to be compared to the historical record of the well, usually in the form of a percentile. The following factors affect the usefulness of well data:
- the length of record of each well varies,
- some wells report on a near-real time operational basis, while others report on a delayed basis and only periodically,
- the water table level is affected by water drawn out for irrigation, municipal, industrial, and other non-drought purposes, so well data may not reflect true drought conditions, and
- there is limited spatial coverage of wells across the country.
As a result, other groundwater monitoring methods are being developed. One is satellite observations. Water has a different density than land. Saturated ground has a different weight, or "mass", than dry ground. Mass affects gravity. Gravity affects satellites. By measuring the effect of varying gravity fields on a pair of satellites as they orbit the earth, estimates of groundwater can be calculated from the GRACE (Gravity Recovery and Climate Experiment) satellite project.
While above-normal precipitation fell across a few parts of the Hawaiian Islands during July, it was not enough to dent long-term deficits (maps of precipitation anomalies for the last 3, 6, 12, 24, 36 months). The percent area of the state classified in moderate (D1) to exceptional (D4) drought remained unusually high (68 percent), with virtually the entire state experiencing abnormally dry to exceptional drought conditions. The U.S. Department of Agriculture (USDA) recently declared all Hawaiian counties farm disaster areas, due to the economic losses incurred from the statewide drought. As noted in the narrative discussion for the August 3, 2010, USDM: On Lanai, pasture conditions were very poor and significantly impacted the cattle ranching operations. Ranchers were shipping feed from off-island, and may soon be forced to ship cattle off Lanai. Fortunately, increased windward and interior showers improved conditions and lessened negative impacts on other parts of Hawaii. On the Big Island, seasonal afternoon showers during July helped improve conditions in the prime Kona coffee belt (lower elevations of the west side). (The Kona upslope is the only leeward area in the Hawaiian Islands with a summer rainfall maximum rather than a winter maximum.) On Oahu, recent trade showers improved conditions along the Koolau Range; however, the Waimanalo Reservoir remained low, and a mandatory 30 percent cutback was still active for irrigation water use. July streamflow levels were below normal across most of the islands and much below normal on Maui.
Above-normal precipitation fell across much of Alaska during July, resulting in a contraction of the D0 area and elimination of the D1 moderate drought area. Precipitation surpluses now existed across many stations in the former abnormally dry area at the three month to six month and year-to-date time scales. However, significant precipitation deficits remained at many stations at longer time scales (water year to date, 12 months, 24 months, and 36 months).
Precipitation was above normal across most of Puerto Rico during July 2010, resulting in much-above-normal streamflow. Below-normal precipitation was slightly evident across parts of the interior for the last 180 days and for the water year to date, but the deficits were not sufficient for any drought depiction on the USDM map for the island.

Virginia statewide precipitation, June-July, 1895-2010.
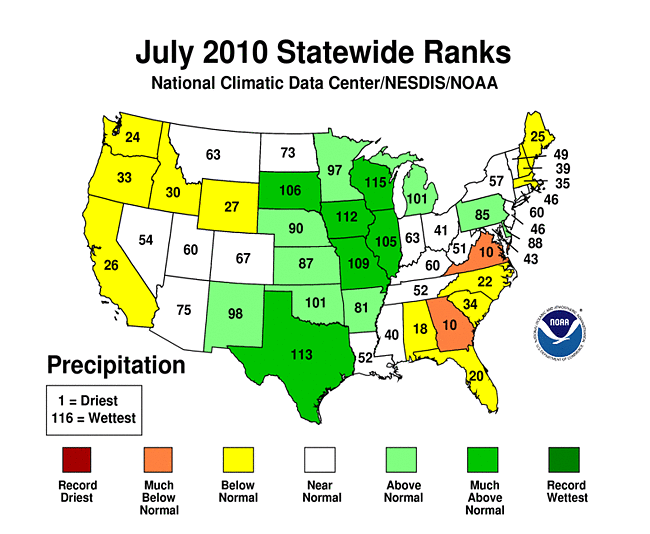
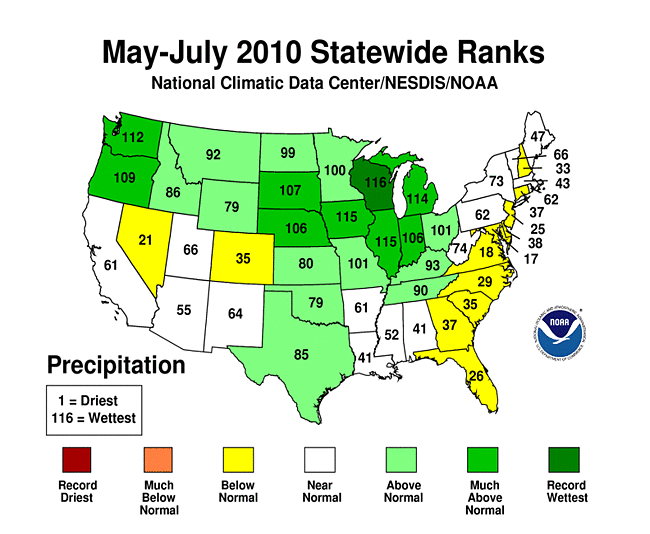
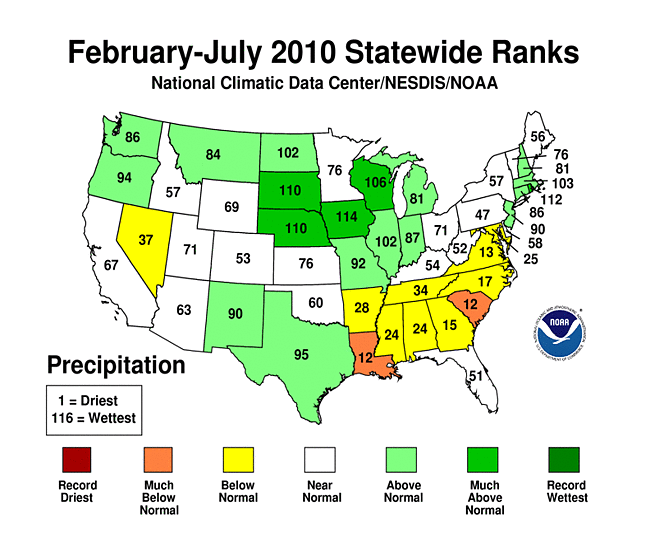
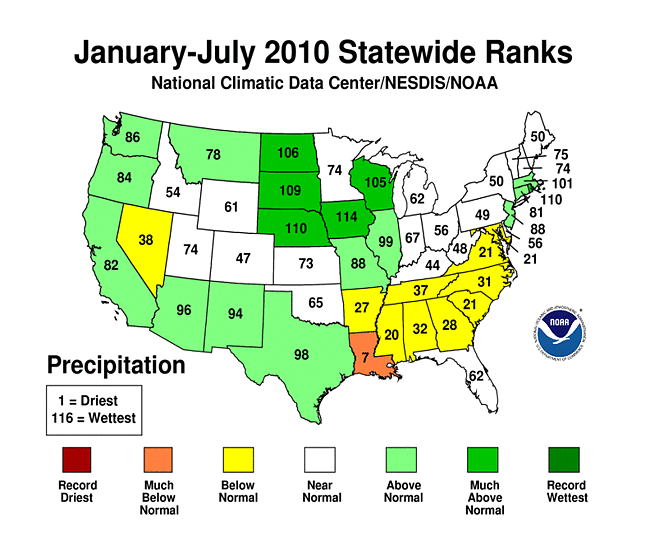
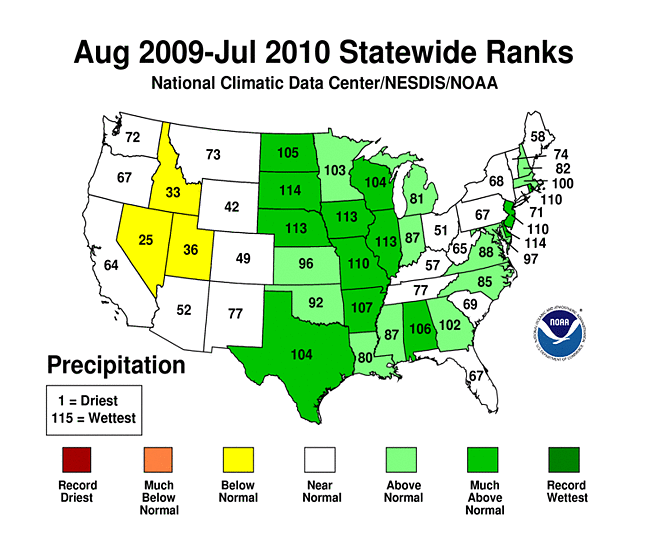
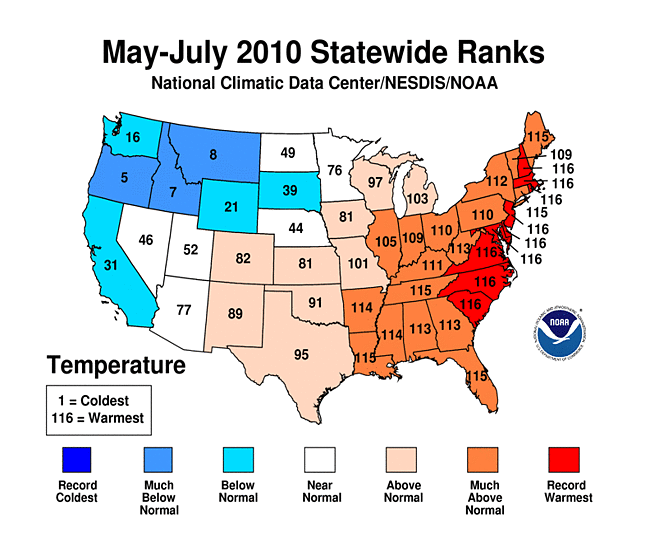
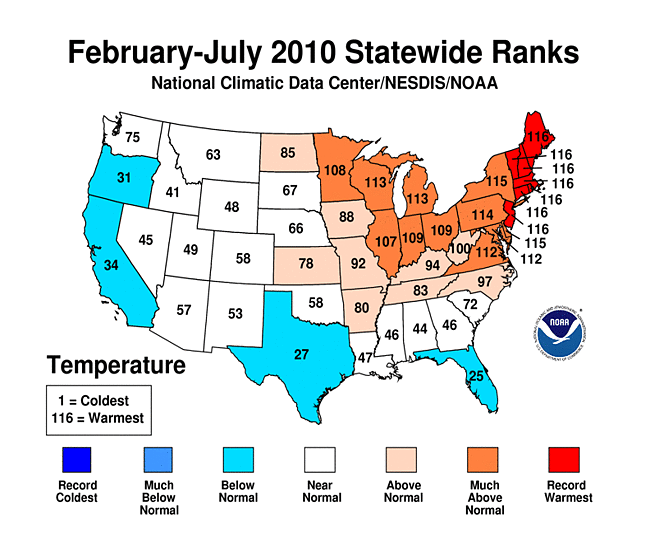
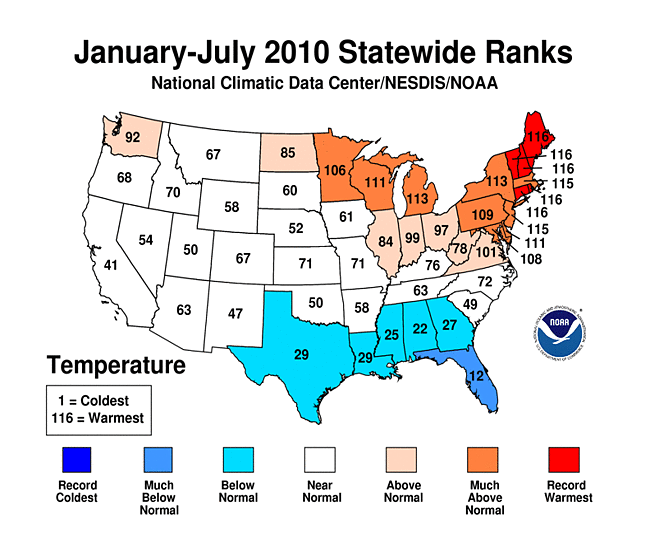
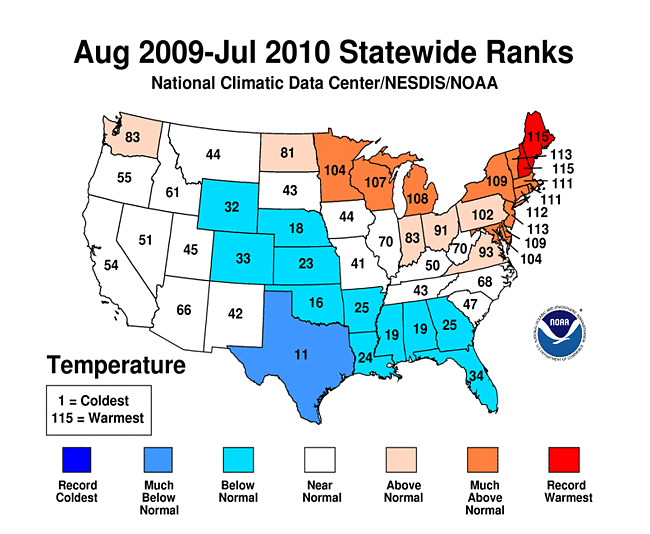
On a statewide basis, July 2010 was drier than normal for states in the Mid-Atlantic to Southeast, New England, and some in the West. Georgia and Virginia had the tenth driest July in the 116-year record. The dryness for the last two months has been especially severe in Virginia, which had the fourth driest June-July on record. The state also had the sixth driest April-July. Louisiana had the seventh driest March-July and year to date. Most of the states along the eastern seaboard were drier than normal for the last three months (May-July), while most states in the Southeast were drier than normal for the last six months (February-July) and year to date, but only three (all in the West) were drier than normal for the last 12 months (August-July).
 |
 |
The dryness was exacerbated by increased evaporation associated with unusually hot temperatures during July in many states east of the Mississippi River and in the Southwest. The abnormal warmth has persisted across much of the East and South for the last four months. Several states had the warmest April-July on record, including Delaware, Rhode Island, New Jersey, and Virginia. Record warmth has occurred during other seasons across the East, including May-July, February-July, January-July, and August-July.
 |
 |
Abnormal dryness and drought were evident in several indicators. Much of the Far West had just a few days with precipitation resulting in long dry spells during July 2010, although this is the dry season for the area. A dry spell lasting two to three weeks was also evident in the southern Plains. Soil moisture, as observed (percent of topsoil dry and very dry, and comparison to 5-year average and 10-year average) and as monitored by several models (NOAA Climate Prediction Center anomalies and percentiles, NLDAS [North American Land Data Assimilation System] top soil layer and total soil layer), was drier than average across much of the country from New England to the Lower Mississippi Valley. According to August 1st USDA reports, half or more of the topsoil moisture was rated dry to very dry (short to very short) in Oregon, Oklahoma, Arkansas, Mississippi, Tennessee, Alabama, Georgia, Virginia, West Virginia, Maryland, Delaware, Connecticut, Massachusetts, and New Hampshire.

Vegetation Drought Response Index (VegDRI), July 26, 2010.
Rainfall was spotty, but persistently hot temperatures led to heat stress in some crops in the Mid-Atlantic to Southeast by the end of the month. These impacts are reflected in the weekly Palmer Crop Moisture Index (CMI), which was developed to assess moisture conditions as they specifically relate to crops, and in other indicators. The end of July CMI showed excessively dry conditions along the southern New England coast to Lower Mississippi Valley, and parts of the West. Satellite monitoring of vegetation health (Vegetation Drought Response Index, Vegetation Health Index), and the U.S. Geological Survey (USGS) agro-hydrologic model (Soil Water Index, Water Requirement Satisfaction Index), indicated stress on vegetation in parts of the East, South, and West. The impacts were showing up on the pastures and rangeland in the mid-Atlantic states and parts of New England and the South. According to August 1st USDA reports, nearly half or more of the pastures and rangeland were in poor or very poor condition in Virginia and Maryland. Much of Virginia, Maryland, and Delaware corn and soybeans were rated poor to very poor (corn: 71, 49, and 34 percent, respectively; soybeans 64, 36, and 25 percent, respectively).
More well monitoring stations (real-time network, climate response network, total active network) in the Northeast to mid-Atlantic states showed low groundwater this month compared to a month ago. Streamflow (observed and modeled [CPC, VIC]) was below average across parts of the Atlantic seaboard to Lower Mississippi Valley, parts of the West, and most of Hawaii.

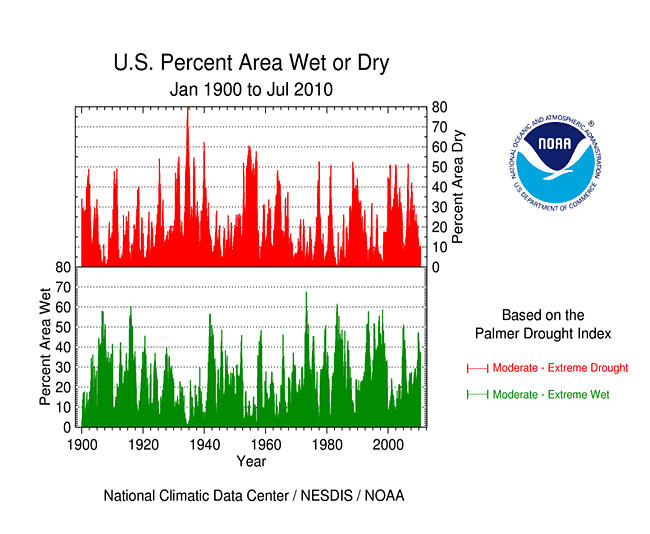
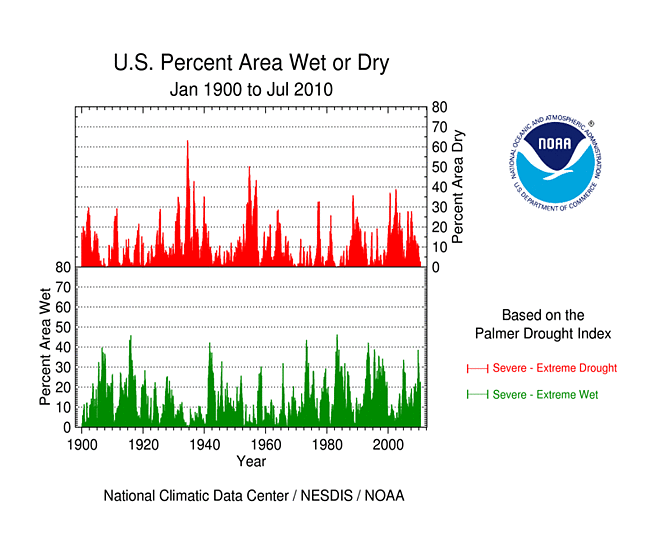
Percent area of the Western U.S. in moderate to extreme drought, January 1900-July 2010, based on the Palmer Drought Index.
July was dry across much of the western United States. But more important for the West is precipitation that falls throughout the water year, defined as October through the following September. The water-year-to-date (October-July) precipitation pattern has been mixed at the low elevation stations. An analysis by the USDA indicated that reservoir levels were generally below average across much of the interior basins. According to the USDM, seven percent of the West was experiencing moderate to severe drought at the end of July, a decrease from June, while the Palmer Drought Index statistic rose to about ten percent.
[top]
State/Regional/National Moisture Status
A detailed review of drought and moisture conditions is available for all contiguous U.S. states, the nine standard regions, and the nation (contiguous U.S.):
| northeast u. s. | east north central u. s. | central u. s. |
| southeast u. s. | west north central u. s. | south u. s. |
| southwest u. s. | northwest u. s. | west u. s. |
| Contiguous United States |
[top]
Pre-Instrumental Perspective
The northern part of Louisiana has experienced the rapid onset of drought conditions in the past several months, with the PDSI for Louisiana Division 3 (northeastern Louisiana) plummeting from 3.03 ("very wet") in January 2010 to -3.40 ("severe drought") in June. In July the PDSI dropped further to -3.56, the lowest value for Division 3 since June 1963. The USDM for late July showed most of northern Louisiana to be in category D3, "extreme drought."

Summer PDSI for Northern Louisiana, 1650-2010.
The graph to the left shows the June-July average PDSI, 1895-2010, for Tennessee Division 3 (annual values in light blue, 5-year weighted average in dark blue). The lowest observed June-July average PDSI (-4.14) was in 1918 (light blue arrow). The most persistent period of summer drought was from 1962-1966, when June-July PDSI was negative for five years in a row (dark blue arrow).
The graph also shows a 329-year tree-ring reconstruction (1650-1978) of summer PDSI for a gridpoint (32.5°N, 92.5°W) in north-central Louisiana (annual values in light red, 5-year weighted average in dark red). This reconstruction is one of over 200 developed by Cook et al. (1999, 2004) across a gridded network covering much of North America, and is based on tree-ring data from 34 sites across the Southeast. The correlation between reconstructed gridpoint PDSI and instrumental Division 3 PDSI over their common period (1895-1978) is 0.628, indicating a high degree of shared variance.
The tree-ring reconstruction can put the droughts of the last century in northeastern Louisiana, including the current one, into a much longer perspective. "Severe" summer drought (PDSI below -3), such as 2010, occurred four times during the instrumental record (1895-2010), but almost twice as often prior to 1895 (17 times from 1650-1894) according to the tree-ring reconstructed record. Six years in the tree-ring record had a reconstructed summer PDSI lower than -4 ("extreme drought"), including a reconstructed value of -5.15 in 1772 (yellow arrow). The tree-ring record suggests that the severity of this summer's drought has been exceeded many times in the past. Also, the most persistent period of tree-ring reconstructed summer drought (1748-1756; red arrow) exceeds the duration of the 1960s drought by four years.
Resources:
- Divisional climate data, including PDSI for Louisiana Division 3, can be obtained from NCDC: https://www1.ncdc.noaa.gov/pub/data/cirs//
- The PDSI reconstructions are available online from the NOAA-NCDC Paleoclimatology Branch: http://www.ncdc.noaa.gov/paleo/pdsi.html
References:
- Cook, E. R., D. M. Meko, D. W. Stahle, and M. K. Cleaveland, 1999. "Drought reconstructions for the continental United States." Journal of Climate, 12:1145-1162.
- Cook, E. R., C. A. Woodhouse, C. M. Eakin, D. M. Meko, and D. W. Stahle, 2004. "Long-Term Aridity Changes in the Western United States." Science, 306(5698):1015-1018.
[top]
Drought Indicators
- Palmer Drought Indices
- Standardized Precipitation Index
- long-term (36 to 60 month) percent of normal precipitation maps
- airport station percent of normal precipitation maps
- statewide precipitation rank maps
- Cooperative station percent of normal precipitation maps
- percent of average maps for the SNOTEL stations in the western mountains provided by the Western Regional Climate Center
- hydrologic year precipitation
- snow water equivalent of snowpack
- satellite-based observations of vegetative health
- National Weather Service model calculations of soil moisture, runoff, and evaporation
- National Weather Service model calculations of soil moisture using the Leaky Bucket Model
- Midwest Regional Climate Center model calculations of soil moisture
- topsoil moisture conditions observed by the USDA and mapped by the Climate Prediction Center
- pasture and range land conditions observed by the USDA and mapped by the Climate Prediction Center
- streamflow maps maintained by the USGS
[top]
Contacts & Questions