Use the form below to select from a collection of monthly summaries recapping climate-related occurrences on both a global and national scale.
Drought ReportApril 2020

|
Contents Of This Report: |


|
Please note that the values presented in this report are based on preliminary data. They will change when the final data are processed, but will not be replaced on these pages.
National Drought Overview
|
|
[top]
Detailed Drought Discussion
Overview

The U.S. Drought Monitor drought map valid April 28, 2020.
The atmospheric circulation over North America during April 2020 was dominated by an upper-level ridge just off the west coast with an upper-level trough over eastern North America. This pattern put a northwesterly flow over the central portion of the continent which funneled cold and dry air masses from Canada into the central and eastern CONUS. The trough and Canadian air masses gave most of the CONUS east of the Rockies a colder-than-normal month. For most of the month, this pattern directed Pacific weather systems away from the western CONUS, and the northwesterly flow kept Gulf of Mexico moisture from reaching much of the Plains and Midwest, so much of the western and central CONUS was drier than normal. Early in the month, a Pacific weather system moving in the jet stream flow developed into a closed low that became cut off from the flow and slowly migrated across the southwestern CONUS. The low gave parts of the southwestern CONUS above-normal precipitation. Fronts and lows that developed along them, in coordination with weather systems in the jet stream flow, tapped Gulf of Mexico and Atlantic moisture to spread above-normal precipitation from southern Texas and the Southeast up the Appalachian Chain to the Northeast. High pressure dominated the Gulf of Mexico and Caribbean, suppressing precipitation and giving Puerto Rico and the U.S. Virgin Islands a drier-than-normal April. The ridge along the west coast of North America directed Pacific weather systems and warm southerly air into Alaska, giving most of the state a warmer- and wetter-than-normal month, especially in the west and north. Convection created by tropical disturbances and the Inter-Tropical Convergence Zone (ITCZ) brought rain to much of eastern and southern sections of the U.S.-Affiliated Pacific Islands (USAPI), while northern and western sections remained under the influence of a dry trade-wind regime. Above-normal precipitation fell over much of the Hawaiian Islands. As a result of these conditions, drought or abnormal dryness expanded or intensified across parts of the West, Great Plains, Puerto Rico, and the USAPI. Drought or abnormal dryness contracted in parts of the southwestern CONUS and Hawaii. Drought expansion and contraction occurred along parts of the Gulf of Mexico coast from Texas to Florida. Drought expansion and contraction nearly balanced each other out this month, with the USDM-based national moderate-to-exceptional drought footprint across the CONUS rising slightly from 14.5 percent at the end of March to 14.8 percent at the end of April (from 12.2 percent to 12.3 percent for the 50 States and Puerto Rico). According to the Palmer Drought Index, which goes back to the beginning of the 20th century, about 13.6 percent of the CONUS was in moderate to extreme drought at the end of April, increasing about 1.7 percent from the 11.9 percent at the end of March.

Drought conditions at the end of April, as depicted on the April 28, 2020 USDM map, included the following core drought and abnormally dry areas:
- Moderate (D1) to severe (D2) drought covered a large part of the Southwest spreading into the central High Plains, and a large part of the Far West extending into the Great Basin, with extreme drought (D3) developing in northwest California and southwest Oregon. The percent area of the West experiencing moderate to extreme drought, according to USDM statistics, increased from 27.8 percent at the end of March to 30.0 percent at the end of April. The percent area of the West (from the Rockies to the West Coast) in moderate to extreme drought (based on the Palmer Drought Index) continued to increase from about 26.0 percent at the end of March to 32.5 percent at the end of April. Beneficial precipitation fell across southern California and adjacent parts of Nevada and Arizona during April with dryness across most of the rest of the West. The last nine months have been persistently dry across most of the region, with the last three months especially dry from northern California to the Pacific Northwest. Oregon had the seventh driest February-April and tenth driest November-April in the 1895-2020 record. Drought was reflected in several indicators in the West, including low streamflow, dry soils (satellite-based SMOS and SPoRT LIS observations, and VIC, CPC, NLDAS, NASA GRACE root zone soil moisture and surface soil moisture, and Leaky Bucket models), depleted groundwater (USGS observations and NASA GRACE estimates), low mountain snowpack, locally high evapotranspiration, and vegetation-based indicators (VegDRI, QuickDRI).
- Abnormal dryness (D0) to severe drought continued in parts of the central High Plains, with abnormal dryness to extreme drought covering much of southern Texas. Drought was reflected in several indicators in the Plains, including dry soils (satellite-based SMOS and SPoRT LIS observations, and VIC, CPC, NLDAS, NASA GRACE root zone soil moisture and surface soil moisture, and Leaky Bucket models), depleted groundwater (USGS observations and NASA GRACE estimates), and vegetation-based indicators (VegDRI, QuickDRI).
- The southern Texas drought extended along the Gulf of Mexico coast as abnormally dry to extreme drought. Drought was reflected in several indicators along the Gulf Coast, including low streamflow, dry soils (satellite-based SMOS and SPoRT LIS observations, and CPC, NLDAS, NASA GRACE root zone soil moisture and surface soil moisture, and Leaky Bucket models), depleted groundwater (USGS observations and NASA GRACE estimates), locally high evapotranspiration, and vegetation-based indicators (VegDRI).
- In Hawaii, drought was reduced with abnormal dryness to moderate drought continuing.
- In the Caribbean, abnormal dryness spread across the U.S. Virgin Islands and returned to Puerto Rico.
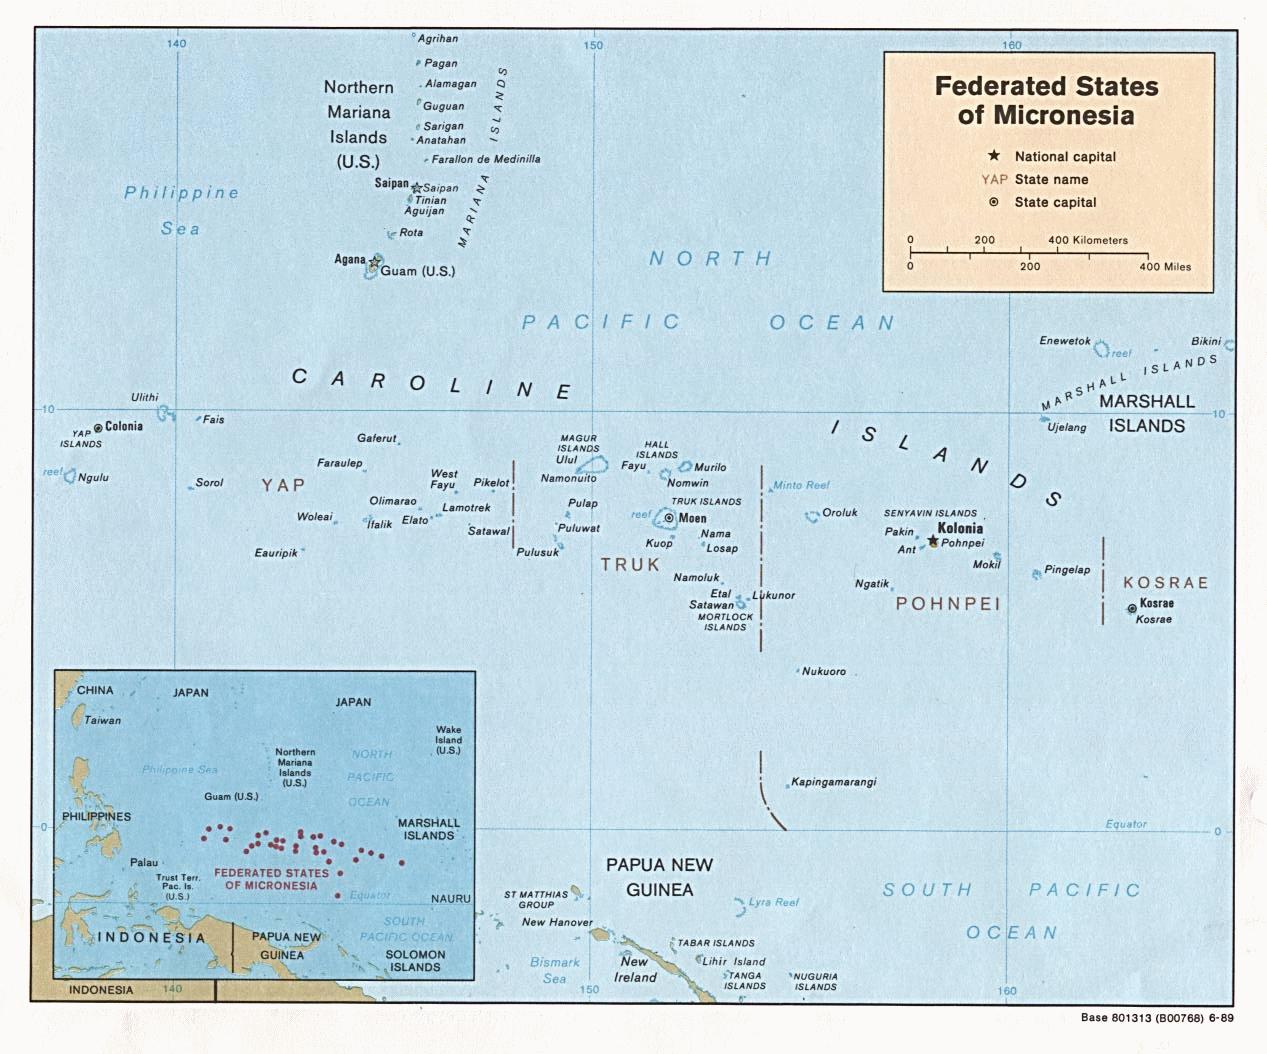
- In the U.S.-Affiliated Pacific Islands (USAPI), severe to extreme drought expanded across the Marianas, western and northern Federated States of Micronesia, and the northern Marshall Islands, with moderate drought and abnormal dryness to the west and south. Only a few islands in the south were free of drought or abnormal dryness.
Palmer Drought Index
The Palmer drought indices measure the balance between moisture demand (evapotranspiration driven by temperature) and moisture supply (precipitation). The Palmer Z Index depicts moisture conditions for the current month, while the Palmer Hydrological Drought Index (PHDI) and Palmer Drought Severity Index (PDSI) depict the current month's cumulative moisture conditions integrated over the last several months. While both the PDSI and PHDI indices show long-term moisture conditions, the PDSI depicts meteorological drought while the PHDI depicts hydrological drought. The PDSI map may show less severe and extensive drought (as well as wet spell conditions) in some parts of the country than the PHDI map because the meteorological conditions that produce drought and wet spell conditions are not as long-lasting as the hydrological impacts.
|
 |
Used together, the Palmer Z Index and PHDI maps show that short-term drought occurred across much of the Pacific Northwest and northern California to the central and southern Rockies, expanding and intensifying long-term dry conditions there (PHDI maps for April compared to March). Short-term drought occurred in the central Plains and parts of Indiana and Ohio, contracting long-term wet conditions in those areas. Short-term wet conditions in the interior Southeast to central Appalachians expanded long-term wet conditions.
Standardized Precipitation Index
The Standardized Precipitation Index (SPI) measures moisture supply. The SPI maps here show the spatial extent of anomalously wet and dry areas at time scales ranging from 1 month to 24 months.
 |
 |
 |

The SPI maps illustrate how moisture conditions have varied considerably through time and space over the last two years. Except for southern California and adjacent parts of Nevada and Arizona, much of the West, Great Plains, and western Great Lakes were dry at the 1-month time scale. Except for southern California to New Mexico, much of the West and central to northern Plains were dry at the 2- to 6-month time scales. At longer time scales, wetness shows up in the Plains, with dry conditions persisting across northern California to the Pacific Northwest, and parts of the Four Corners States, at 9 to 24 months. Dryness is evident on the maps along parts or most of the Gulf of Mexico coast at 2 to 12 months. Wet conditions dominate southern California to southern New Mexico, and most of the Southeast to Mid-Atlantic, at all time scales, and much of the CONUS east of the Rockies at the 9- to 24-month time scale.
 |
 |
 |
Regional Discussion

Hawaii percent of normal precipitation map, May 2019-April 2020.
April 2020 had a mixed precipitation anomaly pattern, except it was wetter than normal over much of the drought area. Wetter-than-normal conditions dominated at the 2- to 10-month time scales, except for Molokai, Lanai, and western Maui. Dry conditions spread to northern portions of the Big Island at 12 months. Wetter-than-normal conditions generally dominated at longer time scales (last 1, 2, 3, 4, 6, 7, 9, 10, 12, 24, 36, 48, 60 months). Streamflow had a mixture of gauges near to below normal. Drought contracted during April with severe drought disappearing. The statewide drought area fell to less than one percent by the end of the month.
 Alaska 36-month percent of normal precipitation map, May 2017-April 2020.
|
 Gridded precipitation percentile map for Alaska, January-April 2020.
|
April 2020 was mostly wetter than normal with drier-than-normal conditions across the southern coastal areas and the Aleutian island chain. The last 2 to 12 months had a similar pattern. At longer time scales, wetter-than-normal conditions dominate except in the panhandle (low elevation station precipitation anomaly maps for the last 1, 2, 3, 4, 6, 7, 9, 10, 12, 24, 36, 48, 60 months) (high elevation SNOTEL station precipitation anomaly maps for last 1 and 7 months, and SNOTEL basin map for last 7 months) (gridded precipitation percentile maps for the last 1, 3, and 4 months) (climate division precipitation rank maps for the last 1, 3, 4, 6, 12 months) (Leaky Bucket model precipitation percentile map). April temperatures were warmer than normal in in the western and northern parts of the state and near to cooler than normal in the interior southeast to panhandle. Colder-than-normal temperatures dominated across most of the state for the last 2 to 4 months. The temperature anomaly pattern transitioned to a mixed pattern at the 6-month time scale, then warmer than normal across the state at the 12-month time period (low elevation station temperature anomaly maps for the last 1, 2, 3, 4, 7, 12 months) (gridded temperature percentile maps for the last 1, 3, and 4 months) (climate division temperature rank maps for the last 1, 3, 4, 6, 12 months) (Leaky Bucket model temperature percentile map). Snow pack was below average in the south central SNOTEL basins and above average elsewhere. Streamflow was near to above normal at most reporting stations. There was no drought or abnormal dryness on the USDM map at the end of April.
 Puerto Rico percent of normal precipitation map for May 2019-April 2020.
|
 Puerto Rico and the U.S. Virgin Islands percent of normal precipitation map for April 2020.
|
Puerto Rico and U.S. Virgin Islands:
April was drier than normal across Puerto Rico and the U.S. Virgin Islands (USVI). Wetter-than-normal conditions dominated in most areas at the 2- to 4-month time periods. Drier-than-normal conditions dominated across eastern and southern Puerto Rico and the southern USVI at 6 to 12 months and across the region at 24 months. Wetter-than-normal conditions dominated at longer time scales (radar-based precipitation anomaly estimates for the last 1, 2, 3, 4, 6, 12 months) (low elevation station precipitation anomaly maps for the last 1, 2, 3, 4, 6, 7, 9, 12, 24, 36, 48, 60 months). Root zone analyses indicated that soil conditions were dry along the southern and some northwestern coastal areas of Puerto Rico. April streamflow was mostly near normal across Puerto Rico with some stream gauges below normal. Abnormal dryness crept back in across southern parts of Puerto Rico on the April 28th USDM map and had spread across the USVI.
CONUS State Precipitation Ranks:

|
|
April 2020 was drier than normal across much of the West and Great Plains and parts of the Midwest. Fifteen states in these regions had a rank in the driest third of the 126-year historical record for April, including Colorado and Nebraska, both ranking sixth driest on record, and Washington which was 13th driest.

|

|
February-April 2020 was drier than normal across much of the West and the central to northern Plains as well as parts of the Gulf of Mexico coast. Thirteen states in the West and Plains had a rank in the driest third of the historical record, including North Dakota (which ranked fifth driest) and Oregon (seventh driest).

|

|
The year to date had a similar pattern to February-April — drier than normal across much of the West and the central to northern Plains as well as parts of the Gulf of Mexico coast, plus parts of southern New England. Thirteen states in the West and Plains, and Florida, New Jersey, and Rhode Island, had a rank in the driest third of the historical record. North Dakota (fourth driest) and South Dakota (10th driest) ranked in the top ten driest category, with Colorado ranking 13th driest.

|

|
The last six months (November 2019-April 2020) had a similar pattern to February-April as well — drier than normal across much of the West and the central to northern Plains as well as parts of the Gulf of Mexico coast. Nine states in the West and Plains ranked in the driest third of the historical record, including Oregon which ranked 10th driest.

|

|
The last twelve months (May 2019-April 2020) were drier than normal across parts of the West, southern Texas, and Gulf of Mexico coast. Five states in the West ranked in the driest third of the historical record, including Oregon which ranked 12th driest.
 Primary Hard Red Winter Wheat Belt precipitation, April, 1895-2020.
|
 Primary Hard Red Winter Wheat Belt precipitation, October-April, 1895-2020.
|
During April 2020, the Primary Hard Red Winter Wheat agricultural belt experienced drier-than-normal and near to cooler-than-normal conditions. The month ranked as the fifth driest and 46th coolest April, regionwide, in the 1895-2020 record.
October marks the beginning of the growing season for the Primary Hard Red Winter Wheat agricultural belt. October 2019-April 2020 had a mixed anomaly pattern for temperature but was mostly drier than normal, ranking as the 58th driest and 32nd warmest October-April, regionwide, in the 1895-2020 record.
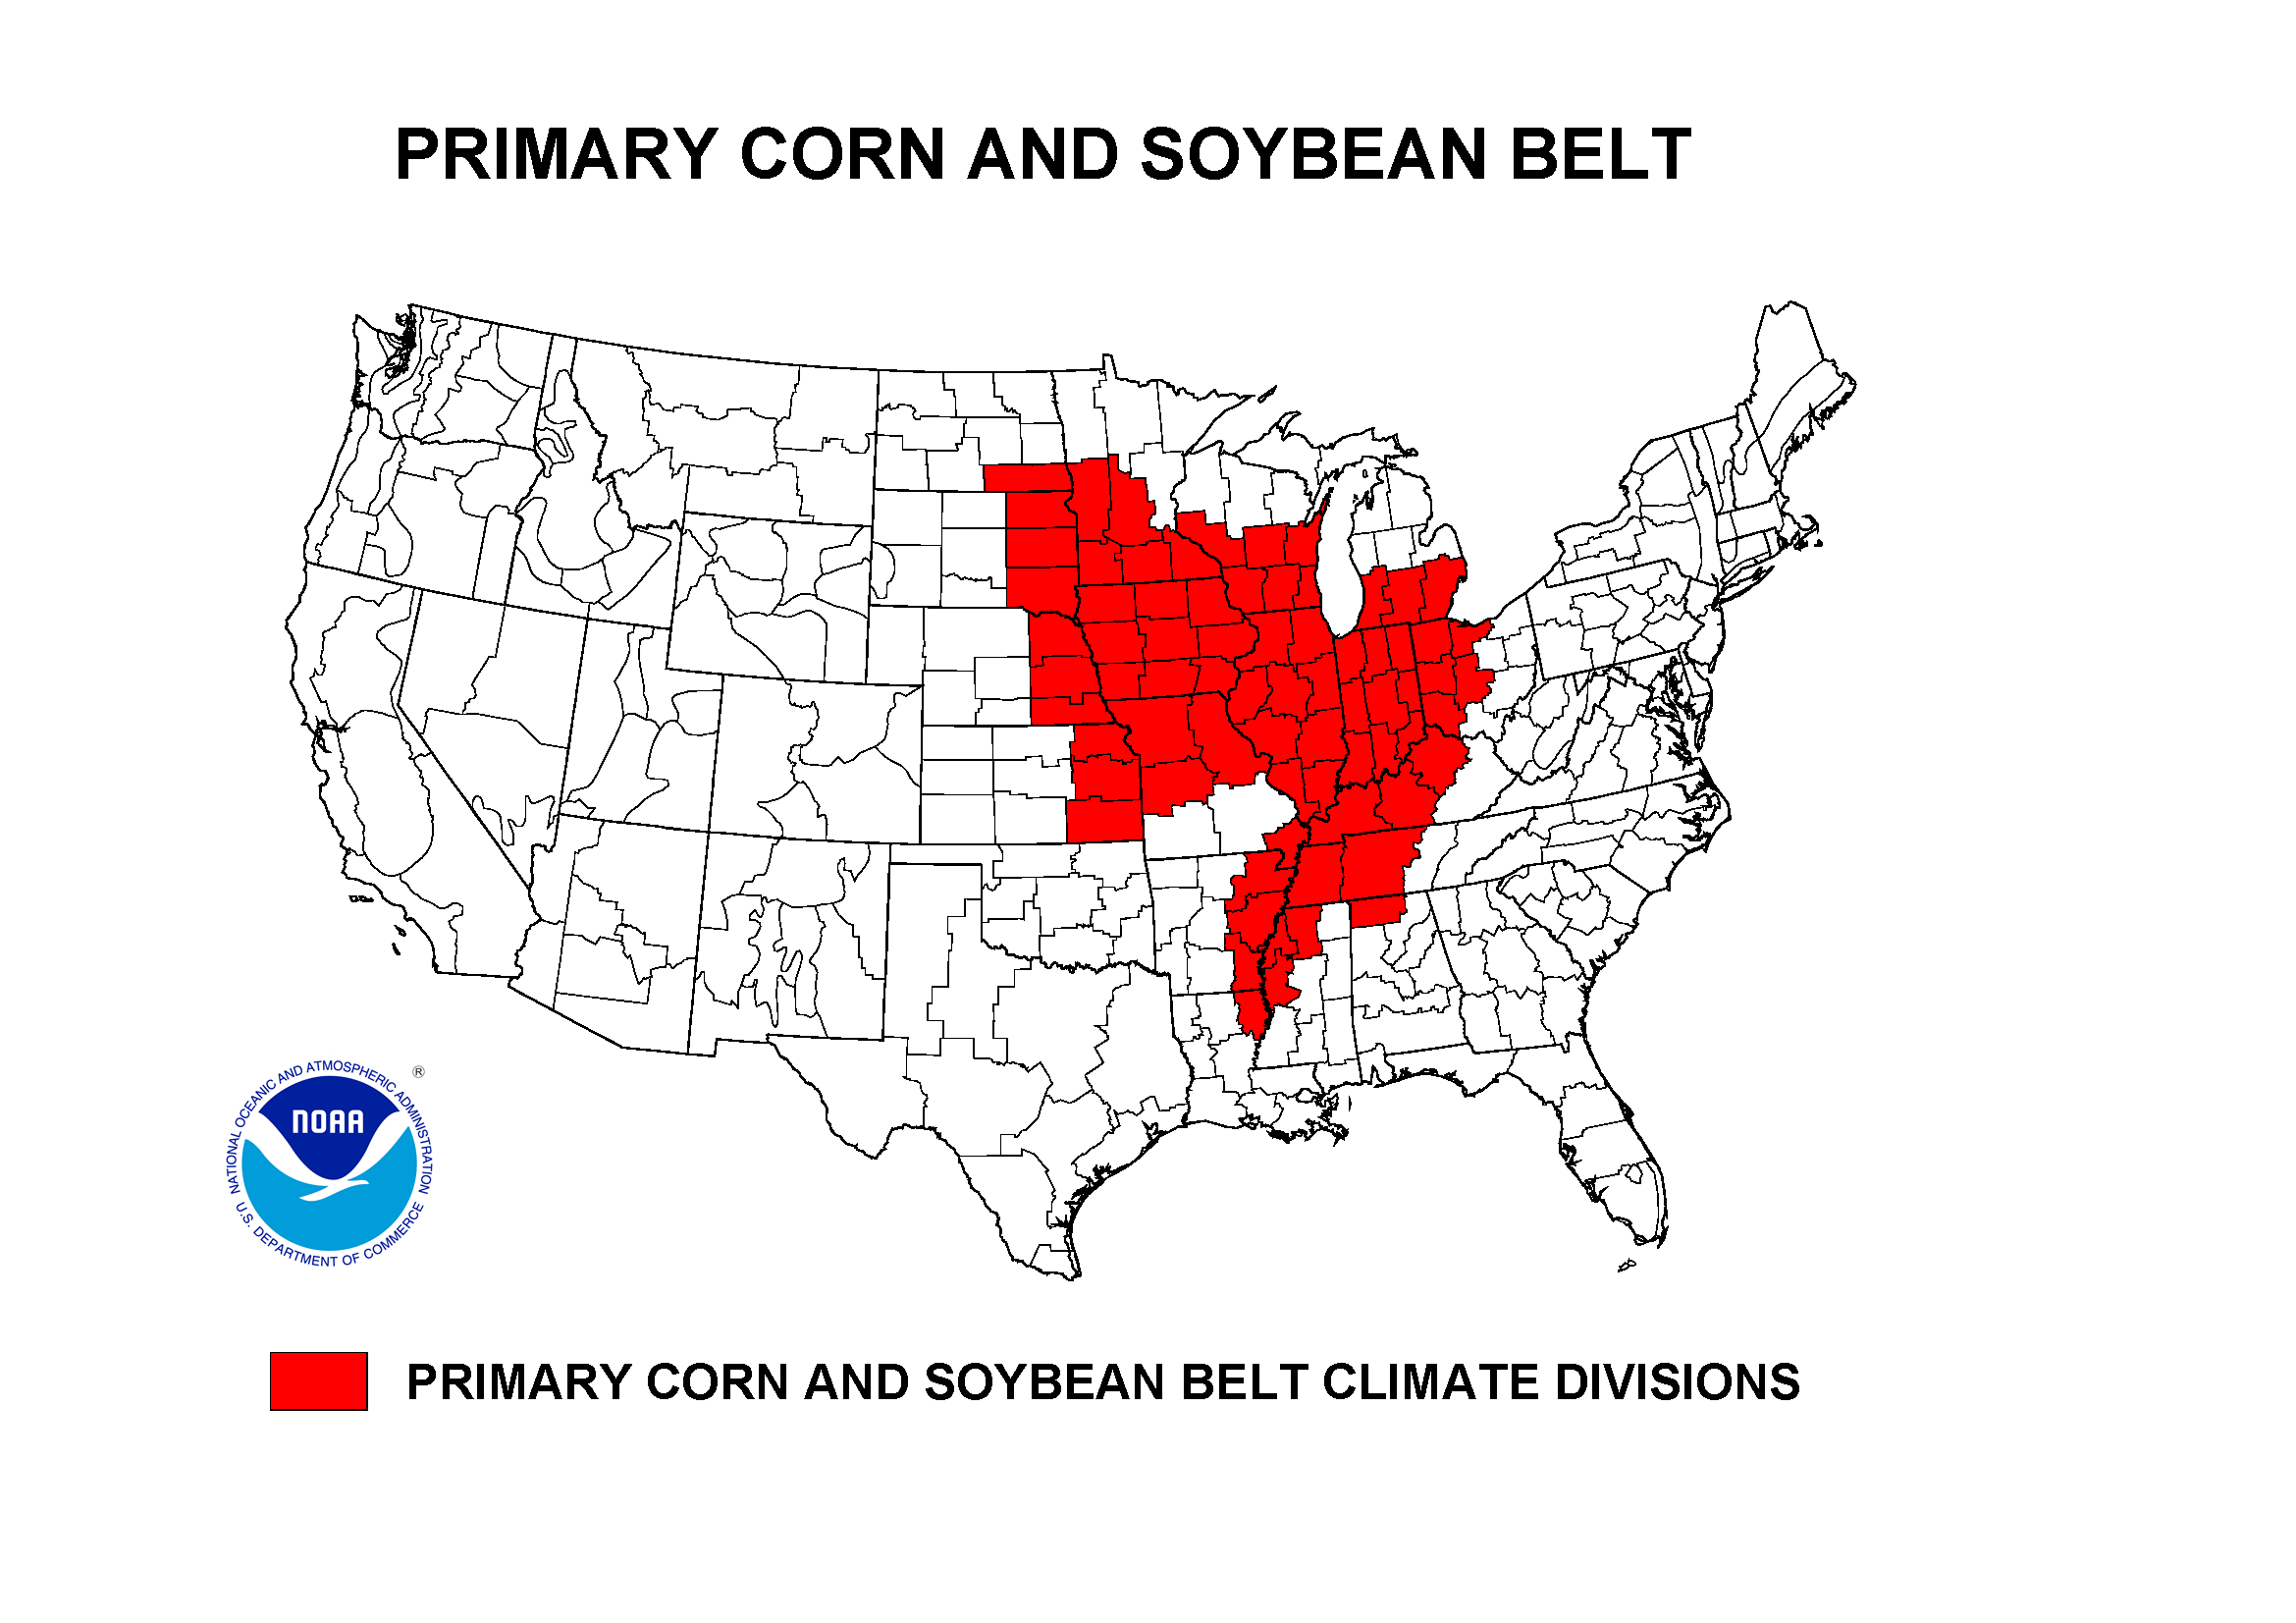
 Primary Corn and Soybean Belt precipitation, April, 1895-2020.
|
 Primary Corn and Soybean Belt precipitation, March-April, 1895-2020.
|
During April 2020, the Primary Corn and Soybean agricultural belt experienced cooler-than-normal conditions with a mixed precipitation anomaly pattern. The month ranked as the 48th driest and 32nd coolest April, regionwide, in the 1895-2020 record.
March marks the beginning of the growing season for the Primary Corn and Soybean agricultural belt. March-April 2020 had a mixed temperature and precipitation anomaly pattern, ranking as the 34th wettest and 34th warmest March-April, regionwide.
As of April 28, drought affected approximately 12 percent of winter wheat production, 11 percent of cattle inventory, eight percent of hay acreage, three percent of spring wheat production, and two percent of corn production. None of the soybean producing areas were in a drought status as of April 28. This was little change from March 31.
As reported by the U.S. Department of Agriculture (USDA), at the end of April (May 3), topsoil moisture was short or very short (dry or very dry) across 64 percent of New Mexico, 60 percent of Texas, 50 percent of Vermont, 49 percent of Colorado, 48 percent of Washington, 44 percent of Oregon, 40 percent of California, 39 percent of Kansas, 33 percent of Florida, and 31 percent of Oklahoma and Utah. Subsoil moisture was short or very short across 67 percent of New Mexico, 55 percent of Oregon, 47 percent of Texas, 45 percent of California, 38 percent of Colorado and Washington, and 33 percent of Vermont. Pasture and rangeland was in poor to very poor condition in California (25 percent), Colorado (26 percent), Connecticut (25 percent), Maine (48 percent), Massachusetts (25 percent), New Mexico (39 percent), Oregon (29 percent), Rhode Island (50 percent), Texas (26 percent), and Vermont (21 percent). Nationwide, 20 percent of the topsoil and 14 percent of the subsoil was short or very short of moisture, 16 percent of the pasture and rangeland was in poor to very poor condition, and 14 percent of the winter wheat was in poor to very poor condition.
U.S.-Affiliated Pacific Islands
The NOAA National Weather Service (NWS) offices, the Pacific ENSO Applications Climate Center (PEAC), and partners provided reports on conditions across the Pacific Islands.
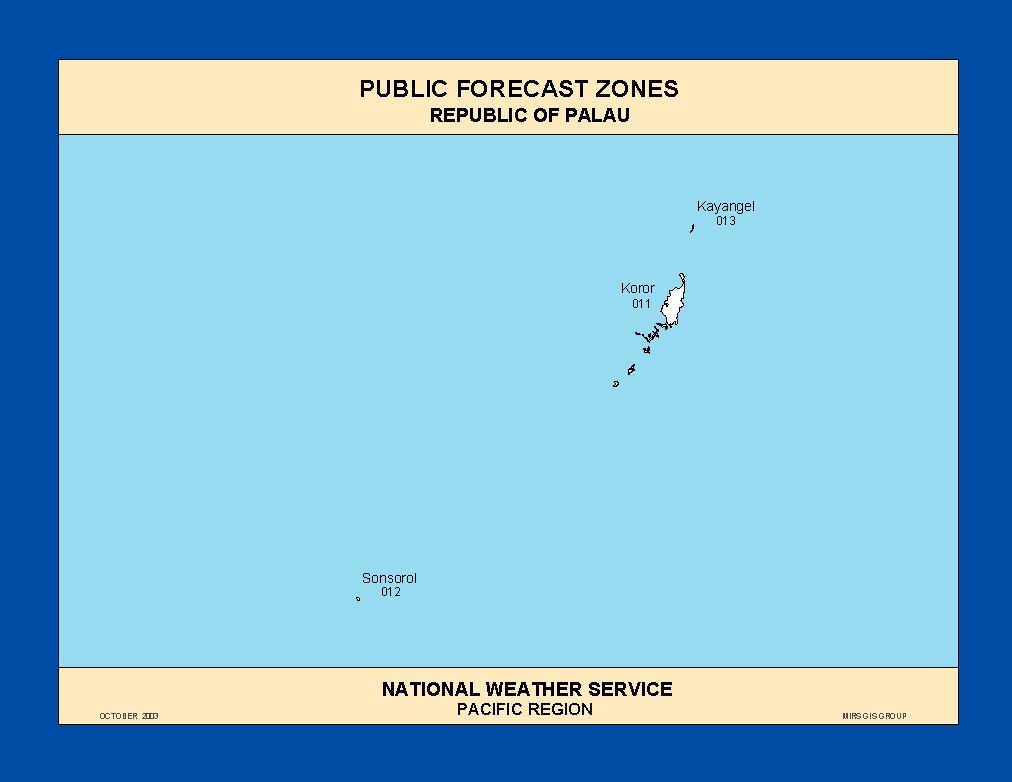
In the U.S. Affiliated Pacific Islands (USAPI) (maps — Federated States of Micronesia [FSM], Northern Mariana Islands, Marshall Islands [RMI], Republic of Palau, American Samoa, basinwide), April 2020 was drier-than-normal in the Marianas (Guam, Saipan) and western and northern FSM (Chuuk, Yap). It was wetter than normal at the rest of the principal stations.
Monthly precipitation amounts were below the monthly minimum needed to meet most water needs (4 inches in the Marianas and Pago Pago, and 8 inches elsewhere) at most of the stations in the north and west — Guam, Rota, and Saipan (in the Marianas); Yap, Ulithi, Woleai (in the FSM); and Kwajalein, Utirik, and Wotje (in the RMI). April precipitation was above the monthly minimums at the rest of the USAPI stations — Koror (Republic of Palau); Chuuk, Lukonor, Nukuoro, Kapingamarangi, Pohnpei, Pingelap, Mwoakilloa, and Kosrae (FSM); Ailinglapalap, Jaluit, Majuro, and Mili (RMI); and Pago Pago (American Samoa). The 4- and 8-inch thresholds are important because, if monthly precipitation falls below the threshold, then water shortages or drought become a concern.
In some of the cases where the rainfall was below the monthly minimum threshold, it was above normal. This is because April is in the dry season and normals are low. This was the case for Kwajalein, whose normal median precipitation is 5.26 inches, April 2020 measured 7.64 inches, and the monthly minimum needed to meet most water needs is 8.00 inches.
The first three to four months of 2020 were drier than normal across most of Micronesia. Of the primary stations, only Majuro (in the RMI) and Pago Pago (in American Samoa) had a wetter-than-normal January-April 2020 and February-April 2020. Kosrae was near to wetter than normal for both time scales.
As measured by percent of normal precipitation, Chuuk and Yap were drier than normal in the short term (April the last 3 months [February-April 2020], and the year-to-date [January-April]) and long term (last 12 months [May 2019-April 2020]). Guam was near normal but on the dry side for April, and thus can qualify as drier than normal for all time scales. Koror and Lukonor were near to wetter than normal for April, but drier than normal for the other three time scales. Saipan was wetter than normal in the long-term but drier than normal at the short-term time scales. Kapingamarangi and Pohnpei were wetter than normal for April and at the 12-month time scale, but drier than normal for the last three to four months. Kwajalein was drier than normal at the 3- and 12-month time scales, but near to wetter than normal for April and the year to date. Kosrae was drier than normal in the long term but near to wetter than normal in the short-term. Majuro and Pago Pago were wetter than normal at both the short-term and long-term time scales. It should be noted that the monthly normal precipitation amount can vary significantly from month to month due to the strong seasonality of equatorial Pacific precipitation resulting from the seasonal migration of the Inter-Tropical Convergence Zone (ITCZ).
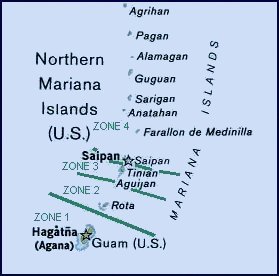
 Percent of normal precipitation map for January-April 2020 for the Marianas Islands.
|
 Percent of normal precipitation map for January-April 2020 for the Marshall Islands.
|
In the Marianas Islands, precipitation was drier than normal regionwide during the last two to four months, and drier than normal for most stations at the 1-, 6-, and 7-month time scales. Wetter-than-normal conditions dominated at the 9- and 24-month time scales, with a mixed precipitation anomaly pattern at the other time scales (percent of normal precipitation maps for the last 1, 2, 3, 4, 6, 7, 9, 10, 12, 24, 36, 48, 60 months). In the Marshall Islands, April was wetter than normal regionwide, March-April was drier than normal at the northern stations, and it was mostly drier than normal at the western stations and wetter than normal at the eastern stations at the longer time scales (percent of normal precipitation maps for the last 1, 2, 3, 4, 6, 7, 9, 10, 12, 24, 36, 48 months).

The USAPI U.S. Drought Monitor drought map valid for the end of April 2020.
According to the April 30th USDM produced for the USAPI, drought had spread across much of Micronesia, with conditions worse than a month ago. Saipan and Rota (in the Marianas); Yap (FSM); and Utirik and Wotje (RMI) were experiencing extreme drought (D3). Guam (Marianas); Ulithi and Woleai (FSM); and Kwajalein (RMI) were at the severe drought (D2) level. Chuuk (FSM) and Ailinglapalap (RMI) had moderate drought (D1), and Majuro (RMI) and Palau were abnormally dry (D0). Six stations in southern and eastern FSM (Lukunor, Nukuoro, Kapingamarangi, Pohnpei, Pingelap, Kosrae), two in the RMI (Jaluit, Mili), and Tutuila (American Samoa) were free of drought and abnormal dryness. Storage in the Majuro reservoir fluctuated up and down during the month, reaching a minimum of 25.7 million gallons on the 17th, which is about 71 percent of maximum. The month ended with the reservoir storage at about 28.2 million gallons, but this was only 78 percent of maximum which is still below the 80 percent threshold for concern. The National Weather Service office in Guam issued two Drought Information Statements for the drought (on April 16 and April 30) discussing the deteriorating conditions in the USAPI, and the other NWS offices in Micronesia reported on local impacts. Drought impacts included stressed vegetation and crops, with crops inedible on the most impacted islands. Local markets on Chuuk Lagoon were concerned that crops such as cucumbers, string beans, and okra were unable to grow properly because of the lack of water. Wildfires occurred on the big island of Palau, Yap proper, and across the Mariana islands. Municipal water was being rationed during the week on Majuro. Water was being distributed to portions of Kwajalein atoll where reverse osmosis units were unavailable. A task force delivered water to the most-impacted islands of northern and southern Chuuk state and vessels reportedly distributed water to east Yap state. The task force also determined that certain islands of Chuuk lagoon needed water and water containers. In Palau, low water levels prompted the Palau Public Utilities Corporation to implement daily water rationing during overnight hours, with the water level at Ngerimel Dam reaching a minimum of 20.75 feet on April 13.
The last five months have been especially dry at many of the islands in Micronesia (based on monthly and seasonal precipitation ranks). April 2020 was the driest April in a 40-year record at Saipan and second driest in 38 years at Ulithi. Going back four or five months, December 2019-April 2020 ranked third driest at Saipan (based on 31 years of data), fourth driest at Lukonor (35 years) and Guam (63 years), and sixth driest at Kapingamarangi (23 years) and Woleai (32 years). January-April 2020 was the eighth driest year to date at Yap (69 years). For some stations, dry conditions extend even further back in time. Lukonor had the driest May-April on record (23 years), Jaluit the second driest May-April (34 years), and Yap fourth driest (68 years). Woleai ranked second driest (25 years) for July-April.
The following analysis of historical data for the USAPI stations in the Global Historical Climatology Network-Daily (GHCN-D) dataset, augmented with fill-in data from the 1981-2010 Normals, helps put the current data into historical perspective by computing ranks based on the period of record. The table below lists the precipitation ranks for April 2020, November 2019-April 2020 (last 6 months), and May 2019-April 2020 (the last 12 months). Some stations have a long period of record and their dataset is fairly complete, while other stations have a shorter period of record and the dataset has some missing data.
Rank of 1 = driest.
| Station | Apr 2020 Rank |
Apr No. of Years |
Nov 2019- Apr 2020 Rank |
Nov- Apr No. of Years |
May 2019- Apr 2020 Rank |
May- Apr No. of Years |
Period of Record |
| Pago Pago | 44 | 55 | 54 | 54 | 53 | 54 | 1966-2020 |
| Saipan | 1 | 40 | 9 | 31 | 30 | 31 | 1981-2020 |
| Kapingamarangi | 21 | 28 | 12 | 23 | 10 | 15 | 1962-2020 |
| Kosrae | 47 | 50 | 11 | 40 | 10 | 33 | 1954-2020 |
| Lukonor | 20 | 36 | 4 | 35 | 1 | 23 | 1981-2020 |
| Nukuoro | 24 | 37 | 14 | 35 | 8 | 34 | 1981-2020 |
| Pingelap | 33 | 36 | MSG | 33 | MSG | 31 | 1981-2020 |
| Ulithi | 2 | 38 | MSG | 34 | MSG | 34 | 1981-2020 |
| Woleai | 13 | 41 | 8 | 31 | 4 | 23 | 1968-2020 |
| Yap | 28 | 69 | 12 | 69 | 4 | 68 | 1951-2020 |
| Pohnpei | 55 | 69 | 46 | 69 | 48 | 68 | 1951-2020 |
| Chuuk | 20 | 69 | 17 | 69 | 12 | 68 | 1951-2020 |
| Guam | 26 | 64 | 24 | 63 | 15 | 63 | 1957-2020 |
| Koror | 49 | 69 | 16 | 69 | 11 | 67 | 1951-2020 |
| Ailinglapalap | 25 | 37 | 15 | 35 | 7 | 34 | 1981-2020 |
| Jaluit | 26 | 37 | 21 | 35 | 2 | 34 | 1981-2020 |
| Mili | 35 | 36 | 33 | 34 | 32 | 32 | 1981-2020 |
| Utirik | 14 | 19 | MSG | 8 | MSG | 4 | 1985-2020 |
| Wotje | 29 | 37 | 28 | 34 | 23 | 33 | 1981-2020 |
| Kwajalein | 44 | 68 | 31 | 68 | 14 | 68 | 1952-2020 |
| Majuro | 48 | 66 | 42 | 66 | 41 | 65 | 1954-2020 |


NOAA Regional Climate Centers:
More information, provided by the NOAA Regional Climate Centers and others, can be found below.
As summarized by the High Plains Regional Climate Center, overall, April was a cool and dry month for the High Plains region, with only a few spotty areas receiving normal or above-normal precipitation. The majority of the region was dry, with large areas of Colorado, Kansas, Nebraska, North Dakota, and South Dakota receiving less than 50 percent of normal precipitation.
This month, drought conditions expanded only slightly across the High Plains region. According to the USDM, the area experiencing drought (D1-D4) in the region increased about 2 percent between March 31st and April 28th. Although the area in drought did not increase much, it should be noted that drought conditions intensified in Colorado, with severe drought (D2) expanding to include nearly 33 percent of the state. Abnormally dry conditions (D0) increased in coverage across much of the region this month. To the south, D0 spread across portions of eastern Colorado, Nebraska, and Kansas, while another area developed across North Dakota and South Dakota as well. The small area of D0 in west-central Wyoming, which was introduced due to a low snowpack, remained. By the end of the month, over 20 percent of the region was in the D0 designation. With precipitation deficits mounting, these areas are being closely monitored for the development of drought conditions. Meanwhile, in Colorado, drought expanded and intensified across the south and east, with over half of the state experiencing drought conditions at the end of the month. In Kansas, drought conditions remained largely unchanged, with only a slight expansion in D1 and D2 coverage. Impacts to rangelands and winter wheat have been reported in these two states. The remainder of the region was free of drought and abnormally dry conditions.
This month's conditions had mixed impacts for agriculture. On a positive note, dry conditions helped producers get out into the fields for spring planting. This was quite the contrast to last year's extreme wetness and delayed planting. But, the dryness, in combination with hard freezes, has begun to take a toll on the Kansas winter wheat crop. According to Kansas State University's Agronomy eUpdates, a preliminary assessment of the winter wheat crop after freezes during the week of April 13th showed damage, especially in the central part of the state. Damage to the crop varied across western and central areas, however, due to the different growth stages of the crop and the wide range of low temperatures that occurred. Other hard freezes that week impacted the Western Slope of Colorado, which is known for its peach production. With temperatures below 28.0 degrees F (-2.2 degrees C) several nights in a row, the peach crop was decimated. A USDA Disaster Declaration has been requested for the impacted counties.
As explained by the Southern Regional Climate Center, temperatures for the month of April were below normal across much of the Southern region and precipitation varied spatially. Parts of central and western Oklahoma as well as northern, north-central, southern, and western Texas received 50 percent or less of normal precipitation. Parts of northern, western, and southern Texas as week as southwestern Oklahoma received 25 percent or less of normal precipitation, while parts of western and southern Texas received 5 percent or less of normal precipitation. In contrast, parts of southern and eastern Texas, southern and western Arkansas, western, northern, and southeastern Louisiana, central and southern Mississippi, and eastern Tennessee received 150 percent or more of normal precipitation, while parts of eastern Texas, northern Louisiana, northeastern Mississippi and eastern Tennessee received precipitation 200 percent or more of normal.
At the end of April, drought conditions both improved and deteriorated across the Southern region. Exceptional drought conditions were no longer present and extreme drought conditions improved across southern and southeastern Texas. Severe drought classifications improved slightly across southern Texas, but extreme western Oklahoma experienced a slight expansion and severe drought conditions developed in southeastern Louisiana. Moderate drought classifications decreased across southern Texas, but moderate drought conditions developed or expanded across western, southeastern, and northern Texas; extreme western Oklahoma; coastal Louisiana; and southern Mississippi. There was an increase in the overall area experiencing abnormally dry conditions, despite the improvement of abnormally dry conditions across southeastern Texas and part of southern Mississippi. This is because the area experiencing abnormally dry conditions increased across southwestern and western Oklahoma, western and southern Texas, and southern Louisiana.
As described by the Midwest Regional Climate Center, temperatures in April averaged below normal across the region while April precipitation varied considerably across the Midwest. Monthly precipitation totals ranged from 25 to 50 percent of normal along the Minnesota-Iowa border to nearly twice normal in central Illinois, northern Michigan, and southeastern Kentucky. Three swaths of above normal precipitation extended, from southwest to northeast, across both northwestern Minnesota and southeastern Kentucky and also from southwestern Missouri, across Illinois, to northern Michigan. Between the swaths of above normal precipitation there were two swaths of below normal precipitation. One covered northern Missouri, all of Iowa, and much of Minnesota and Wisconsin. The other extended from southeastern Missouri and western Kentucky to Lake Erie and the southern half of Lake Huron. Much of the region was quite dry until the last week of April when heavy rain stretched from Missouri to Michigan and also fell in eastern Kentucky and southeastern Ohio.
The complete absence of drought in the Midwest reached 25 weeks, since mid-November of 2019. However, in the latter half of April, areas of abnormal dryness did appear for the first time since early January. The streak of 14 straight weeks without any abnormally dry areas in the region was the longest in the history of the USDM, which began in 2000.
As soils dried out in early to mid-April, planting accelerated across the Corn Belt. Corn planting was at 35 percent complete or higher in Kentucky, Illinois, Iowa and Minnesota according to USDA's National Agricultural Statistics Service. Only Missouri was significantly behind, 21 percent below their five-year average. Soybeans planting quickly ramped up, with Kentucky and Illinois both at 18 percent planted by the end of April.
As noted by the Southeast Regional Climate Center, precipitation was near normal to well above normal across much of the Southeast region during April, and temperatures ranged from below average to average across much of the region, with well-above average temperatures observed across much of the Florida peninsula. This warmth is due in part to record-breaking sea surface temperatures across portions of the Gulf of Mexico and Caribbean for this time of the year. San Juan, PR (1898-2020) reported 1.1 degrees F (0.7 degrees C) above normal for the month.
Monthly precipitation totals ranged from 150 to more than 300 percent of normal in broad portions of every state. In contrast, the driest locations were found across southern Florida and Puerto Rico where monthly precipitation totals were 50 to less than 25 percent of normal. Drought improved across Florida, southern Georgia, and southern Alabama for the month of April. Moderate drought (D1) reduced in coverage across almost the entire Florida peninsula. Although the pocket of severe drought (D2) is gone in the Florida panhandle, it has emerged in the southwestern part of the state. By the end of the month, abnormally dry conditions (D0) were eliminated in southern Georgia and most of southern Alabama, however the pocket of moderate drought (D1) remains along the Gulf Coast of Alabama. Abnormally dry conditions (D0) developed in the southern part of Puerto Rico. In Florida, pasture conditions improved and greened up from the rainfall in April. However, excess rainfall in the northern peninsula caused disease pressures on watermelons, potatoes, corn and peanuts. Citrus grove activities continued as normal for this time of year, as growers were able to spray insecticides, fertilize, mow, and irrigate.
As explained by the Northeast Regional Climate Center, the Northeast received 4.35 inches (110.49 mm) of precipitation in April, which was 119 percent of normal, and the region's average temperature of 43.4 degrees F (6.3 degrees C) was 2.7 degrees F (1.5 degrees C) below normal. This was the first colder-than-normal month since November 2019.
As summarized by the Western Regional Climate Center, across much of the West, precipitation in April was below normal with anomalously dry conditions observed across portions of the Four Corners states (Arizona, Colorado, New Mexico, Utah) as well as in the northern Great Basin, extreme northern California, southwestern Oregon, and central Washington. In contrast, Southern California experienced wetter-than-normal conditions in April with numerous locations breaking daily precipitation records during the early part of the month. Temperatures were near normal to slightly above normal across much of the West with the exception of Montana and Wyoming where temperatures were well below historical averages. With the cool season coming to an end, the April 1 snow water equivalent (SWE) levels (region-level, 2-digit HUC) were below normal in California (74%), the Great Basin (90%), and the Rio Grande (90%). Above-normal SWE was observed in the Arkansas-White-Red (103%), Lower Colorado (108%), Upper Colorado (107%), Missouri (112%), and Pacific Northwest (107%) regions.
In California, storm systems during the early part of April brought a much-needed boost to the mountain snowpack of the central and southern Sierra as well as some record-breaking rainfall accumulations to portions of Southern California. Despite the late-season storms, water year-to-date (since October 1) precipitation was below normal levels in central and northern California with the North Coast Drainage Climate Division (CD) experiencing its 4th driest October through April period on record (126-year period). According to the California Cooperative Snow Survey (April 30), the statewide snowpack was 39% of normal (as compared to 54% of normal on April 1) with the regional breakdown as follows: northern (27%), central (44%), and south (41%). Despite the poor snowpack conditions, California's major reservoirs remained in good condition (near normal to above normal) as a result of carry-over from the previous winter with the state's two largest reservoirs, Lake Oroville and Shasta Lake, at 87% and 94% of historical averages, respectively, by the end of the month.
In northern California and southwestern Oregon, the combination of above-normal temperatures, below-normal snowpack and streamflows, and reports of agricultural drought impacts led to intensification of drought conditions in the Klamath River Basin. Likewise, drought conditions intensified in the eastern plains of Colorado.
In the Pacific Northwest, drier-than-normal conditions were observed across most of the region during April with notably dry conditions (less than 25% of normal precipitation) in east-central Idaho, southwestern Oregon, and central Washington. As of April 1, the majority of the drainage basins in the region were observing near normal to above normal SWE with the exception of the following basins (6-digit HUC) that were below normal: Upper Columbia (87%), Deschutes (83%), Southern Oregon Coast (87%), and Klamath (75%). According to the April 28 USDM map, 11.5% of the region was experiencing drought with areas of severe and extreme drought observed in southwestern Oregon where Governor Brown passed emergency drought declarations for Curry, Jackson, and Klamath counties. Moreover, the Southwestern Valleys CD experienced its driest February through April period on record (126-year period).
In the Intermountain West, drier-than-normal conditions prevailed across much of Arizona, Utah, Colorado, and New Mexico as well as in the northern Great Basin. In the Humboldt River Basin in northeastern Nevada, mountain snowpack conditions saw a sharp decline in SWE by the end of the month dropping from 94% of median (Apr 1) to 30% of median by April 30. In Utah, April was very dry in northern and eastern portions with Salt Lake City International Airport (AP) logging 0.26 in (6 mm; 13% of normal) of precipitation, making it the driest April on record dating back to 1928. In western Colorado, the mountain town of Telluride experienced its 3rd driest April on record dating back to 1900 with 0.45 in (11 mm) while the town of Montrose observed its 10th driest (dating back to 1895) with 0.14 in (4 mm) for the month.
In Alaska, warmer-than-normal temperatures prevailed across North Slope (10th warmest April) and West Coast (14th warmest) CDs during April with significant temperature anomalies observed in the Northwest Arctic where the Kivalina AP observed an average temperature of 30.8 F (-0.7 C) — a +19.2 F (10.6 C) departure from normal. Statewide, Alaska experienced its 12th wettest and 15th warmest April on record and its 14th wettest October through April period on record. At a climate-division level, precipitation was well above normal in April in the Bristol Bay CD (2nd wettest), North Slope CD (3rd wettest), and West Coast CD (4th wettest) while drier-than-normal conditions prevailed in the Aleutians CD (6th driest).
In the Hawaiian Islands, precipitation was above normal on Oahu, Molokai, Lanai, Maui, and southern portions of the Big Island. On Oahu and Molokai, Honolulu International AP logged 2.56 in (65 mm; 406% of normal) during April while Molokai AP observed 3.83 in (97 mm; 205% of normal). Conversely, drier-than-normal conditions prevailed on both the windward and leeward sides of the Big Island with Hilo International AP reporting 7.75 in (197 mm; 67% of normal) and Kona International AP 0.15 in (4 mm; 11% of normal) for the month.
[top]
State/Regional/National Moisture Status
A detailed review of drought and moisture conditions is available for all contiguous U.S. states, the nine standard regions, and the nation (contiguous U.S.):
| northeast u. s. | east north central u. s. | central u. s. |
| southeast u. s. | west north central u. s. | south u. s. |
| southwest u. s. | northwest u. s. | west u. s. |
| Contiguous United States |
[top]
Contacts & Questions