Use the form below to select from a collection of monthly summaries recapping climate-related occurrences on both a global and national scale.
Synoptic DiscussionJanuary 2023
Note: This Synoptic Discussion describes recent weather events and climate anomalies in relation to the phenomena that cause the weather. These phenomena include the jet stream, fronts and low pressure systems that bring precipitation, high pressure systems that bring dry weather, and the mechanisms which control these features — such as El Niño, La Niña, and other oceanic and atmospheric drivers (PNA, NAO, AO, and others). The report may contain more technical language than other components of the State of the Climate series.
Overview
Key Drivers
- Month
-
January 1-7
- Madden-Julian Oscillation (MJO)
- Positive NAO
- Positive WPO
- Positive EPO
- Atmospheric rivers
-
January 8-17
- Negative Arctic Oscillation (AO)
- Positive NAO
- Positive WPO
- Positive EPO
- Atmospheric rivers
-
January 18-31
- La Niña
- MJO
- Positive AO
- Positive NAO
- Positive WPO
- Negative EPO
Monthly Mean
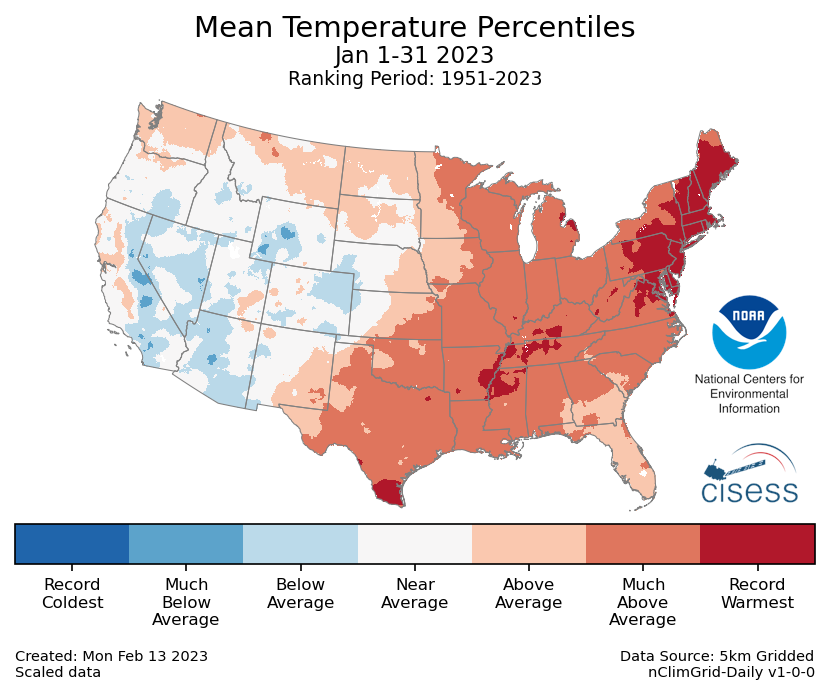
The January mean circulation was dominated by a trough along the West Coast and a ridge near the Northeast. This circulation was associated with teleconnections from the ongoing La Niña, a positive NAO, and a positive WPO. The trough was associated with repeated atmospheric rivers that brought heavy precipitation to California. It also fed unusually active severe weather and tornadoes for January in the Southern Plains and Southeast. Meanwhile, the ridge was associated with warm temperature anomalies for the Northeast, particularly early in the month. These patterns moderated during the second half of January when the trough shifted eastward.


Submonthly Evolution


January 1-7
January began with a trough along the West Coast and ridge along the East Coast. The trough maintained a string of atmospheric rivers that made landfall in California that caused extreme precipitation and landslides. Temperatures were generally near normal over the western half of the country with this trough. Two extratropical cyclones in the subtropical jet brought wet conditions to the Southeast and an unusual January tornado outbreak to the Southern Plains and Southeast. The ridge near the East Coast was associated with record warmth for the Northeast, which would dominate the January mean temperatures for the region.
January 8-17
During the middle of January, the ridge shifted westward towards the Great Plains. This shift spread the warm conditions across most of the country and also suppressed precipitation for the Southern Plains. However, the trough along the West Coast continued directing atmospheric rivers to California.
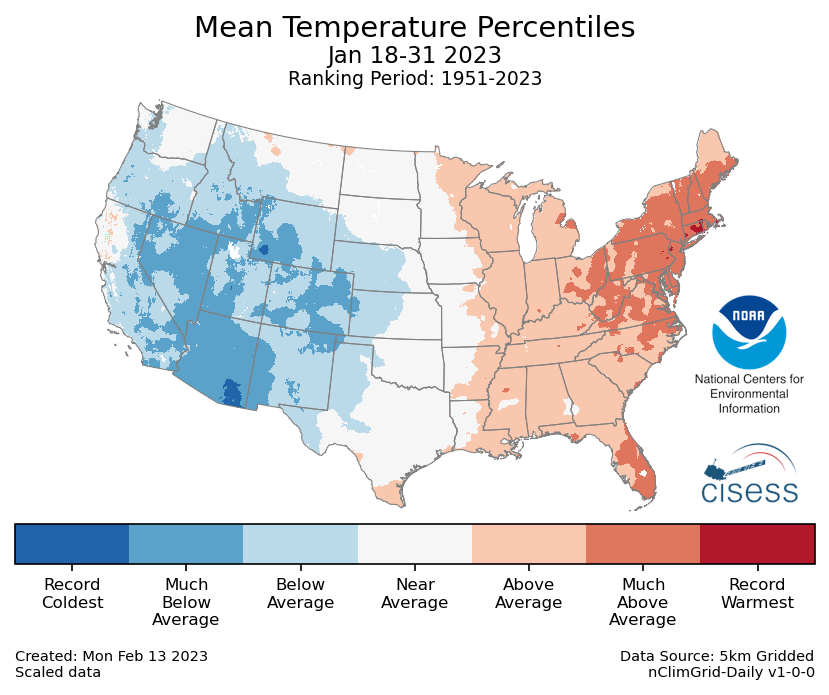
January 18-31
The second half of January featured a very different circulation pattern as the negative AO, positive WPO, and positive EPO all transitioned to their opposite phases. The regime shift brought a ridge to the Gulf of Alaska and an end to the atmospheric rivers for California. The trough shifted eastward to the Rockies and brought widespread cool anomalies to the western U.S. Meanwhile, a ridge along the East Coast maintained warmer-than-normal temperatures for the Northeast. The primary storm track also shifted northward away from the subtropical jet.
Atmospheric Drivers


ENSO: El Niño Southern Oscillation
- Description: Oceanic and atmospheric conditions in the tropical Pacific Ocean can influence weather across the globe. ENSO is characterized by two extreme modes: El Niño (warmer-than-normal sea surface temperature [SST] anomalies in the tropical Pacific) and La Niña (cooler-than-normal SST anomalies), with the absence of either of these modes termed “ENSO-neutral” conditions. These variations in SST change the locations of the Pacific's largest thunderstorms, which can in turn change circulation patterns around the globe.
- Status: La Niña conditions weakened during January. The most common metric for ENSO is the SST anomalies in the equatorial Pacific. The cool anomalies associated with La Niña weakened to around -0.5°C. The Southern Oscillation Index, which measures the atmospheric response, remained positive during January. Overall, the coupled ocean-atmosphere system continued to reflect La Niña.
- Teleconnections (influence on weather): La Niña favors cooler temperatures for the Northern Tier and the West Coast. It also favors drier than normal conditions for the Southeast and wetter than normal for the Northwest. The La Niña likely contributed to the cool temperatures for the Western U.S. during January 18-31 that also dominated the January mean. However, the typical La Niña precipitation patterns were not observed during January.
MJO: Madden-Julian Oscillation
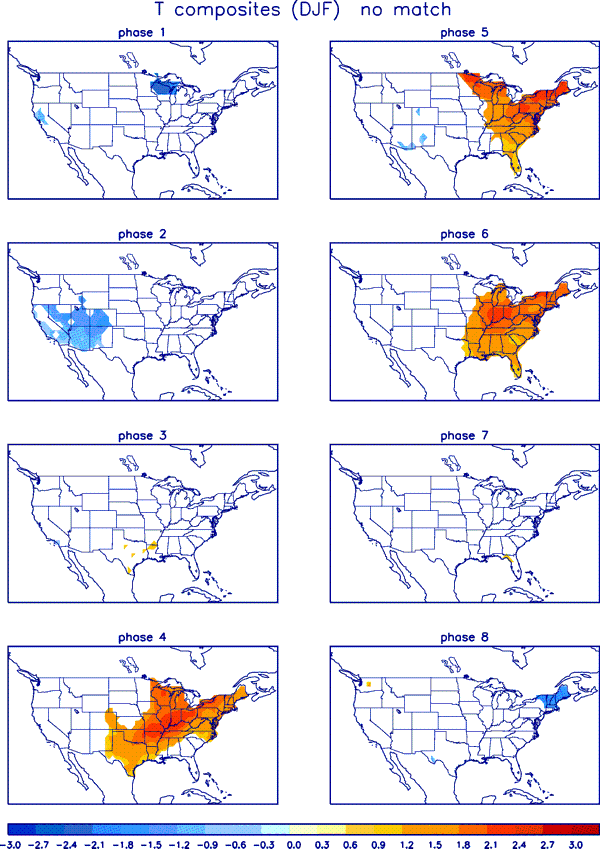
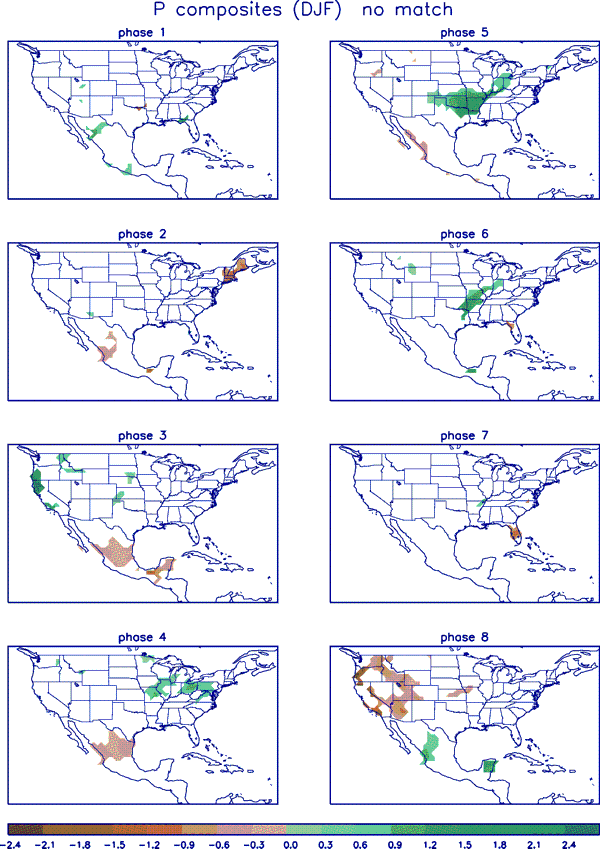
- Description: The MJO is the biggest source of subseasonal (31-50 day) tropical variability. It typically develops as a large envelope of tropical thunderstorms over the Indian Ocean that then moves eastward. Like ENSO, the MJO's effects on tropical rainfall is so strong that it can alter the atmospheric circulation around the globe. The thunderstorms decay when they cross the Pacific, but the associated winds can often continue across the Western Hemisphere to initiate the next MJO in the Indian Ocean. The MJO is episodic, meaning that it is not always active. Most indices for tracking the MJO identify both the MJO's amplitude and the longitude of its strongest rainfall, usually described as one of eight phases.
- Status: The MJO index began January over the Western Pacific (phases 6/7) and moved across the Western Hemisphere to the Indian Ocean (phase 3) by the end of the month.
- Teleconnections (influence on weather): During January, MJO phase 6 is typically associated with warm and wet conditions near the Tennessee Valley. These were observed at the beginning of January (temperature and precipitation) when the MJO was in phase 6.
PNA: Pacific/North American Pattern
- Description: The PNA teleconnection pattern is associated with strong fluctuations in the strength and location of the East Asian jet stream. PNA-related blocking of the jet stream flow in the Pacific can affect weather downstream over North America, especially the West and especially in the winter half of the year.
- Status: The daily PNA index was weak but generally positive during January. The monthly mean was near zero.
- Teleconnections (influence on weather): The positive PNA favors warmer conditions in the Pacific Northwest and cooler in the Southeast. It also favors drier than normal conditions for the Pacific Northwest and the Ohio Valley. During January, the only signal that was observed were the dry conditions for the Pacific Northwest.
AO: Arctic Oscillation
- Description: The AO teleconnection pattern generally measures the pressure difference between the low pressure over the North Pole and the higher pressures in the subtropical ridges. This pressure difference is larger during a positive AO, resulting in a stronger midlatitude jet. When the AO is negative, the jet is weaker and will have larger troughs and ridges.
- Status: The daily AO index was negative for most of January with positive values towards the end of the month. The monthly mean was negative.
- Teleconnections (influence on weather): The negative AO is typically associated with cool anomalies from the Northern Plains to the East Coast with the opposite in the positive phase. The positive AO may have contributed to the temperature pattern near the end of January. The negative AO also favors dry conditions for the Lower Mississippi, which were observed January 8-17.
NAO: North Atlantic Oscillation
- Description: The NAO teleconnection pattern relates the pressure over the sub-polar low near Greenland and Iceland with the subtropical high over the Central Atlantic. It significantly affects the weather on both sides of the Atlantic.
- Status: The daily NAO index was positive throughout January, and the monthly mean was the seventh-most positive January since 1951.
- Teleconnections (influence on weather): During winter, the positive NAO is associated with warm temperatures for the South and the Northeast and drier conditions for the Southwest. The positive NAO temperature pattern was observed throughout January.
WPO: West Pacific Oscillation
- Description: The WPO teleconnection pattern is a primary mode of low-frequency variability over the North Pacific and reflects zonal and meridional variations in the location and intensity of the East Asian jet stream in the western Pacific.
- Status: The daily WPO index was positive during most of January with strongly positive values around the middle of the month. The monthly average was positive.
- Teleconnections (influence on weather): The positive WPO during winter is typically associated with warmer temperatures near the Great Lakes and cooler temperatures over the Southwest with the opposite during the negative phase. This positive WPO temperature was apparent throughout January. The positive WPO is also associated with wet conditions near the Mississippi River, which were also observed in the January mean. Interestingly, the precipitation pattern was not apparent in the middle of January when the WPO was strongest.
EPO: East Pacific Oscillation
- Description: The EPO pattern identifies variations in the strength and location of the eastern Pacific jet stream. During the positive phase, the jet is stronger and shifted southward. The negative phase is associated with an Alaskan ridge that weakens the jet. The EPO is closely related to the East Pacific–North Pacific (EP–NP) teleconnection pattern, although the two are defined with opposite signs.
- Status: The daily EPO index was strongly positive at the beginning of January and again in the middle of the month. Near the end of the month, the EPO was strongly negative. The monthly mean was near zero.
- Teleconnections (influence on weather): The positive phase of the EPO favors warmer than normal temperatures across the Upper Midwest. The related negative phase of the EP-NP is also associated with cooler temperatures along the West Coast. The positive EPO was reflected in the temperature patterns January 1-7 and January 8-17. The negative EPO was reflected in the cooler temperatures along the West Coast during January 18-31.