Use the form below to select from a collection of monthly summaries recapping climate-related occurrences on both a global and national scale.
Synoptic DiscussionJanuary 2022
Note: This Synoptic Discussion describes recent weather events and climate anomalies in relation to the phenomena that cause the weather. These phenomena include the jet stream, fronts and low pressure systems that bring precipitation, high pressure systems that bring dry weather, and the mechanisms which control these features — such as El Niño, La Niña, and other oceanic and atmospheric drivers (PNA, NAO, AO, and others). The report may contain more technical language than other components of the State of the Climate series.
Overview
Key Drivers
- Month
-
January 1-10
- La Niña
- Negative PNA
- Positive AO
- Positive North Atlantic Oscillation (NAO)
-
January 11-19
- Positive PNA
- Negative AO
-
January 20-31
- Positive PNA
Monthly Mean
The January mean anomalies were consistent with the positive phases of the PNA and AO that were both present for most of the month. The PNA was associated with a ridge along the West Coast and a trough in the east. These were associated with persistent warm anomalies for the West Coast and cold for the eastern half of the country. The positive AO also reinforced the warm anomalies for the Northern Plains.
The ridge also suppressed precipitation across most of the country. However, several high impact winter storms tracked along the base of the trough. They brought significant snow to portions of the High Plains, southern Appalachians, Mid-Atlantic, and Northeast.


Submonthly Evolution


January 1-10
January began with a strong ridge near the Bering Strait that was associated with a negative AO pattern. Downstream of this ridge, a broad trough over Canada brought cold temperatures to the Northern Plains. The western lobe of this trough also led to a series of winter storms in the Pacific Northwest while the eastern part brought winter weather to the Southern Appalachians.
January 11-19
During the middle of January, a ridge developed along the West Coast and the trough shifted southeastward. These changes were consistent with the switch from a negative to a positive PNA and from negative to positive AO. The ridge was associated with warm and dry conditions for the High Plains and the West Coast while the cold anomalies occurred along the East Coast under the trough. A pair of of winter storms also followed the jet stream at the base of the trough going from the Northern Plains to the Gulf Coast and then up the East Coast.
January 20-31
The positive PNA continued towards the end of January. The ridge in the West and the trough in the East both strengthened and shifted slightly westward. The result was cold anomalies for the eastern half of the country and warm anomalies for the West Coast and northern High Plains. The cold reached unusually far southward with Florida experiencing one of it coldest spells in the last decade. Precipitation was generally suppressed across the country. However, a strong winter storm on the leading edge of the cold blast brought significant snowfall to the Colorado, Kansas, the Mid-Atlantic, and the Northeast.
Atmospheric Drivers


ENSO: El Niño Southern Oscillation
- Description: Oceanic and atmospheric conditions in the tropical Pacific Ocean can influence weather across the globe. ENSO is characterized by two extreme modes: El Niño (warmer-than-normal sea surface temperature [SST] anomalies in the tropical Pacific) and La Niña (cooler-than-normal SST anomalies), with the absence of either of these modes termed “ENSO-neutral” conditions. These variations in SST change the locations of the Pacific's largest thunderstorms, which can in turn change circulation patterns around the globe.
- Status: La Niña conditions weakened during January. The most common metric for ENSO is the SST anomalies in the Central Pacific, the Niño 3.4 region. These weakened from around -1.0°C to around 0.5°C during January. The positive Southern Oscillation Index, which measures the atmospheric response, also weakened in January. Together, these indices reflected a declining La Niña event.
- Teleconnections (influence on weather): La Niña favors cooler than normal temperatures for the West Coast and the Northern Tier. It also favors wetter conditions for the Pacific Northwest and drier from the Southwest to the Southeast. Both the temperature and precipitation patterns best resembled La Niña during the first third of January.
MJO: Madden-Julian Oscillation
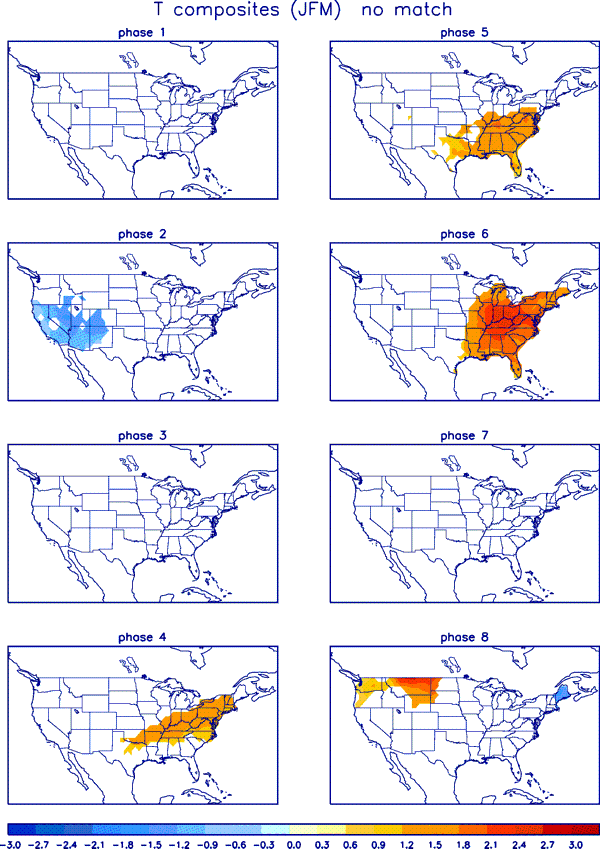
- Description: The MJO is the biggest source of subseasonal (31-50 day) tropical variability. It typically develops as a large envelope of tropical thunderstorms that develops over the Indian Ocean that then moves eastward. Like ENSO, the MJO's effects on tropical rainfall is so strong that it can alter the atmospheric circulation around the globe. The thunderstorms decay when they cross the Pacific, but the associated winds can often continue across the Western Hemisphere to initiate the next MJO in the Indian Ocean. The MJO is episodic, meaning that it is not always active. Most indices for tracking the MJO identify both the MJO's amplitude and the longitude of its strongest rainfall, usually described as one of eight phases.
- Status: The MJO index was generally weak during January. It began the month near phases 6 and 7 (West Pacific) and then crossed towards phase 3 by the end of the month.
- Teleconnections (influence on weather): The MJO phase 7 during January does not have a significant temperature pattern.
PNA: Pacific/North American pattern
- Description: The PNA teleconnection pattern is associated with strong fluctuations in the strength and location of the East Asian jet stream. PNA-related blocking of the jet stream flow in the Pacific can affect weather downstream over North America, especially the West and especially in the winter half of the year.
- Status: The daily PNA index was strongly negative at the beginning of January and then positive for the remainder of the month. The monthly mean was positive.
- Teleconnections (influence on weather): The positive PNA favors warmer conditions in the Pacific Northwest and cooler in the Southeast with the opposite expected during the negative phase. Both phases were apparent in January with the negative PNA early in the month and positive during the middle and end of January.
AO: Arctic Oscillation
- Description: The AO teleconnection pattern generally measures the pressure difference between the low pressure over the North Pole and the higher pressures in the subtropical ridges. This pressure difference is larger during a positive AO, resulting in a stronger midlatitude jet. When the AO is negative, the jet is weaker and will have larger troughs and ridges.
- Status: The daily AO was negative early in the month followed by several episodes of strongly positive values later in January. The monthly mean was positive.
- Teleconnections (influence on weather): The positive AO is typically associated with warmer than normal temperatures from the Northern Plains to the East Coast with the opposite during the negative phase. These patterns were clear during the first two-thirds of January with a cold air outbreak associated with the negative AO at the beginning of the month followed by warm anomalies during the middle of January.
NAO: North Atlantic Oscillation
- Description: The NAO teleconnection pattern relates the pressure over the sub-polar low near Greenland and Iceland with the subtropical high over the Central Atlantic. It significantly affects the weather on both sides of the Atlantic.
- Status: The daily NAO was positive throughout January, and the monthly mean was positive.
- Teleconnections (influence on weather): The NAO favors warmer than normal conditions for the Southeast. These were somewhat apparent early in January.
WPO: West Pacific Oscillation
- Description: The WPO teleconnection pattern is a primary mode of low-frequency variability over the North Pacific and reflects zonal and meridional variations in the location and intensity of the East Asian jet stream in the western Pacific.
- Status: The daily WPO index strongly negative throughout January and the monthly mean was strongly negative.
- Teleconnections (influence on weather): The negative WPO is typically associated with cooler temperatures over the Midwest and warmer for the Southwest. Despite the WPO's strong amplitude, these impacts were not clear during January.
EPO: East Pacific Oscillation
- Description: The EPO pattern identifies variations in the strength and location of the eastern Pacific jet stream. During the positive phase, the jet is stronger and shifted southward. The negative phase is associated with an Alaskan ridge that weakens the jet. The EPO is closely related to the East Pacific–North Pacific (EP–NP) teleconnection pattern, although the two are defined with opposite signs.
- Status: The daily EPO index was positive for the first half of January and negative for the second half. The monthly mean was near zero.
- Teleconnections (influence on weather): The positive phase of the EPO favors warmer than normal temperatures across the Upper Midwest and cooler along the West Coast with the opposite during the negative phase. Neither of these patterns were apparent in January.