Use the form below to select from a collection of monthly summaries recapping climate-related occurrences on both a global and national scale.
Synoptic DiscussionJune 2020
Note: This Synoptic Discussion describes recent weather events and climate anomalies in relation to the phenomena that cause the weather. These phenomena include the jet stream, fronts and low pressure systems that bring precipitation, high pressure systems that bring dry weather, and the mechanisms which control these features — such as El Niño, La Niña, and other oceanic and atmospheric drivers (PNA, NAO, AO, and others). The report may contain more technical language than other components of the State of the Climate series.
Summary
| Time Period | Key Driver | Other Drivers |
|---|---|---|
| Month | EPO+ |
|
| June 1-6 | EPO+ |
|
| June 7-11 | NAO- |
PNA- |
| June 12-18 | EPO+ |
Southeast Cutoff Low |
| June 19-27 | PNA+ |
EPO+ |
| June 28-30 | NAO- |
The driving circulation feature in June 2020 was a persistent ridge over the central U.S. It brought hot and dry conditions to the Great Plains for most of the month. It was sandwiched between troughs near the east and west coasts. The locations and strengths of these troughs waxed and waned throughout the month. Periods when the West Coast trough was stronger and farther inland were associated with cool anomalies over the western third of the country and enhanced rainfall to the Pacific Northwest. The East Coast trough was most impactful during June 12-18 when it became a cutoff low over the Southeast. It brought heavy rain and cool temperatures to the Mid-Atlantic.
The main driver for these patterns was the East Pacific Oscillation (EPO), which was moderately-to-strongly positive throughout the month. The positive EPO was associated with a trough near the Gulf of Alaska and an enhanced subtropical ridge to its south. This pattern is commonly associated with an enhanced ridge over the central U.S. although it was zonally narrower than normal during June 2020.
Monthly Mean


Submonthly Evolution
June 1-6


June began with a broad upper-level ridge extending across the central U.S. Dry conditions associated with this ridge spread across the country. The ridge also brought warm anomalies that peaked in the Central Plains and the Southwest. A cutoff low lay off the California coast, but farther west the circulation exhibited a typical positive EPO pattern with a ridge in the subtropical eastern Pacific and a trough near Alaska.
June 7-11


The circulation during June 7-11 was dominated by a trough–ridge pattern over the U.S. A trough extended from the Gulf of Alaska southeastward to the Rockies and brought cooler than normal temperatures to the western half of the country. Meanwhile, the ridge brought warm temperatures to the East. Tropical Storm Cristobal made landfall in Louisiana on June 7. The southerly flow between the trough and ridge steered Cristobal and its heavy rainfall nearly due north all the way to Wisconsin. It was only the third tropical storm to be tracked by the National Hurricane Center into Wisconsin and the first since 1949.
June 12-18


The ridge over the Great Plains returned June 12-18. This time it was accompanied by a trough on the West Coast and another in the Southeast. These troughs brought cooler temperatures along both coasts. They also contributed to enhanced rainfall for the Pacific Northwest and the Mid-Atlantic. Meanwhile, the ridge allowed the warm anomalies to persist for the Great Plains and the dry conditions over the rest of the country. As with the beginning of the month, this ridge was associated with another positive EPO phase.
June 19-27


The ridge moved northeastward June 19-27 and brought record heat to New England. A trough in the Central U.S. was associated with milder temperatures and pockets of enhanced moisture. Meanwhile, the subtropical ridge from the eastern Pacific extended over the West Coast bringing hot and dry conditions there. This pattern was primarily associated with a positive PNA.
June 28-30


June ended with another trough–ridge pattern. The trough brought cool temperatures and enhanced rains to the Northern Rockies. The ridge was again strongest over the Great Plains and continued the exceptionally warm temperatures there.
Atmospheric Drivers

ENSO: El Niño Southern Oscillation
- Description: Oceanic and atmospheric conditions in the tropical Pacific Ocean can influence weather across the globe. ENSO is characterized by two extreme modes: El Niño (warmer-than-normal sea surface temperature [SST] anomalies in the tropical Pacific) and La Niña (cooler-than-normal SST anomalies), with the absence of either of these modes termed “ENSO-neutral” conditions. These variations in SST change the locations of the Pacific's largest thunderstorms, which can in turn change circulation patterns around the globe.
- Status: The ocean and atmosphere system continued to be in ENSO-neutral during June 2020. The most common metric for ENSO is the SST anomalies in the Central Pacific, the Niño 3.4 region decreased again to -0.3°C in June. The weekly values got as low as -0.6°C in mid-June, but they warmed to +0.1°C in later in the month during a subseasonal westerly wind burst.
- Teleconnections (influence on weather): The teleconnections with ENSO are muted during near-neutral conditions. An active La Niña would have favored cooler conditions in the western U.S. It would also favor drier than normal conditions for much of the country and particularly near Texas.
MJO: Madden-Julian Oscillation
- Description: The MJO is the biggest source of subseasonal (31-60 day) tropical variability. It typically develops as a large envelope of tropical thunderstorms that develops over the Indian Ocean that then moves eastward. Like ENSO, the MJO's effects on tropical rainfall is so strong that it can alter the atmospheric circulation around the globe. The thunderstorms decay when they cross the Pacific, but the associated winds can often continue across the Western Hemisphere to initiate the next MJO in the Indian Ocean. The MJO is episodic, meaning that it is not always active. Most indices for tracking the MJO identify both the MJO's amplitude and the longitude of its strongest rainfall, usually described as one of eight phases.
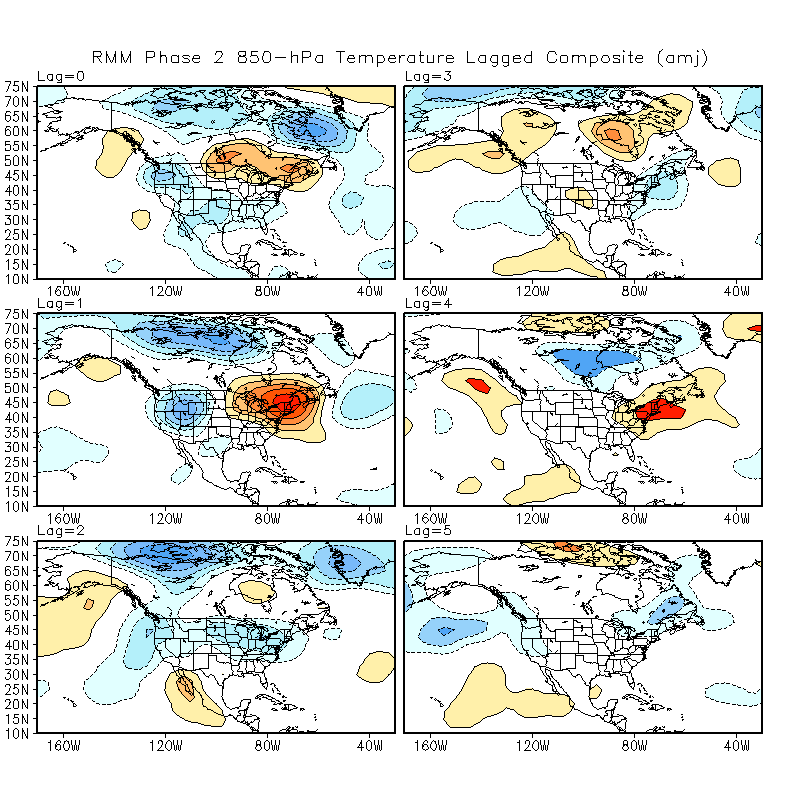
- Status: The MJO index was technically active in the Indian Ocean (Phases 1 and 2) for the entire month. However, the MJO typically moves eastward, so the index was probably responding more to seasonal SST anomalies than an actual MJO.
- Teleconnections (influence on weather): The MJO's projection onto phase 2 (Indian Ocean) favored the warmer temperatures in the Eastern U.S. and cooler temperatures in the West. These would most closely resemble the pattern from June 7-11, but it is difficult to draw a connection without a propagating MJO.
PNA: Pacific/North American pattern
- Description: The PNA teleconnection pattern is associated with strong fluctuations in the strength and location of the East Asian jet stream. PNA-related blocking of the jet stream flow in the Pacific can affect weather downstream over North America, especially the West and especially in the winter half of the year.
- Status: The daily PNA index was weak but generally negative until June 11. It was positive for the remainder of the month and became strongly positive June 16-26. The monthly average was positive for June. The positive PNA was primarily associated with the enhanced subtropical ridge in the eastern Pacific and the trough near Alaska. However, it was generally lacking the ridge along the West Coast and the trough over the Southeast. These features were more apparent during June 19-27 when the amplitude was large.
- Teleconnections (influence on weather): A positive PNA favors warmer temperatures along the West Coast, which was also most apparent when with the strongly positive PNA June 19-27. Conversely, the weakly negative PNA may have contributed to the cool temperatures in the West and warm in the East during June 7-11.
AO: Arctic Oscillation
- Description: The AO teleconnection pattern generally measures the pressure difference between the low pressure over the North Pole and the higher pressures in the subtropical ridges. This pressure difference is larger during a positive AO, resulting in a stronger midlatitude jet. When the AO is negative, the jet is weaker and will have larger troughs and ridges.
- Status: The daily AO was weak during the entire month and the monthly average was near zero. The Northern Hemisphere circulation had a high wavenumber at all latitudes, which means there were a lot of troughs and ridges in close proximity to one another. The AO projects better onto lower wavenumber patterns with fewer troughs and ridges.
- Teleconnections (influence on weather): The strongest AO signal in June was a weak negative signal in early June. That would typically be associated with the cooler than average temperatures in the Northern Plains, but the opposite transpired during June 7-11.
NAO: North Atlantic Oscillation
- Description: The NAO teleconnection pattern relates the pressure over the sub-polar low near Greenland and Iceland with the subtropical high over the Central Atlantic. It significantly affects the weather on both sides of the Atlantic.
- Status: The daily NAO was generally weak until the end of the month when it became strongly negative. It was weakly negative for the monthly average. The negative values at the end of the month were largely associated with an anomalous ridge over Greenland during June 28-30. However, a negative NAO would typically pair that ridge with a trough over the northern Atlantic, which was not as prominent.
- Teleconnections (influence on weather): The negative NAO at the end of June typically favors cooler temperatures in the Northern Rockies and warmer temperatures in the Southeast, which is generally consistent with what was observed June 7-11 and June 28-30.
WPO: West Pacific Oscillation
- Description: The WPO teleconnection pattern is a primary mode of low-frequency variability over the North Pacific and reflects zonal and meridional variations in the location and intensity of the East Asian jet stream in the western Pacific.
- Status: The daily WPO index was generally weak and oscillating around zero during June. The monthly average was weak but positive in association with the weak trough over eastern Russia.
- Teleconnections (influence on weather): The positive WPO is typically associated with warmer than normal temperatures over the Northern Plains. That pattern was present for much of June, but the lack of a strong WPO limits its potential contribution.
EPO: East Pacific Oscillation
- Description: The EPO pattern identifies variations in the strength and location of the eastern Pacific jet stream. During the positive phase, the jet is stronger and shifted southward. The negative phase is associated with an Alaskan ridge that weakens the jet. The EPO is closely related to the East Pacific–North Pacific (EP–NP) teleconnection pattern, although the two are defined with opposite signs.
- Status: The daily EPO index was moderately-to-strongly positive for most of June and strongly positive for its monthly average. The positive EPO was largely associated with the enhanced subtropical ridge over the eastern Pacific and a trough near Alaska. The ridge was a bit farther north than would be typical for the positive EPO.
- Teleconnections (influence on weather): The positive phase of the EPO favors warmer than normal temperatures across the Upper Midwest and Northeast. The warmth was generally concentrated more over the Northern Plains in June, but the EPO+ may have also played a role in the extreme heat in the Northeast June 19-27.