Use the form below to select from a collection of monthly summaries recapping climate-related occurrences on both a global and national scale.
Synoptic DiscussionJuly 2016
Note: This Synoptic Discussion describes recent weather events and climate anomalies in relation to the phenomena that cause the weather. These phenomena include the jet stream, fronts and low pressure systems that bring precipitation, high pressure systems that bring dry weather, and the mechanisms which control these features — such as El Niño, La Niña, and other oceanic and atmospheric drivers (PNA, NAO, AO, and others). The report may contain more technical language than other components of the State of the Climate series.
Summary
The atmosphere was in an ENSO-neutral state during July 2016. Subtropical high pressure dominated the weather over the contiguous United States (CONUS), deflecting the jet stream and storm track to the Canadian border and blanketing much of the CONUS with unusually warm and dry weather. Heavier rains fell along stalled fronts from the Central and Northern Plains to Ohio Valley. The high pressure ridge inhibited the development of severe weather over the southern CONUS, aided the development of large wildfires in the West, and contributed to the expansion or development of drought in many areas. The upper-level circulation, temperature, and precipitation anomaly patterns reflected the chaotic nature of an atmospheric-oceanic system in transition, but also suggested the atmospheric drivers originating in the North Atlantic had the greatest influence on the month's weather. See below for details.
Synoptic Discussion
 Animation of daily upper-level circulation for the month.
|
 Animation of daily surface fronts and pressure systems for the month.
|
In the Northern Hemisphere, July marks the middle of climatological summer which is the time of year when solar heating forces the jet stream and circumpolar vortex to contract northward. Polar air masses can still influence the weather over the CONUS, but they are not as cold as in the winter months. The warm, dry subtropical high pressure belt normally dominates the weather as it shifts northward, with warm southerly air masses moving into the CONUS more frequently.
This was the case during July 2016. The long-wave circulation pattern in the upper atmosphere consisted of a high pressure ridge which dominated the CONUS. The ridge was associated with the North Pacific and North Atlantic subtropical high pressure belt. The Aleutian Low, which is an important center of action for Pacific storm systems and frequently feeds storms to North America, usually weakens during the summer as the subtropical highs strengthen, but this month it was weaker than normal.
The ridge's subsiding air and sunny skies brought unusually hot and dry weather to the southern tier States. The ridge kept the jet stream to the north where it moved fronts and low pressure systems in a storm track along the northern tier States and southern Canada. Upper-level troughs and low pressure systems moving in the jet stream flow occasionally poked into the subtropical high, dipping into the southeast States. Fronts frequently stalled out from the Central Plains to Ohio Valley, providing a trigger for showers and thunderstorms which dropped above-normal precipitation. Clouds, rain, and cool fronts associated with the storm track kept temperatures cooler than normal from the Pacific Northwest to Northern Plains.
Descending air associated with the subtropical high suppressed the occurrence of severe weather in the southern tier States, but the fronts and low pressure systems along the storm track provided ample triggers for the development of tornadoes in the Central to Northern Plains and Midwest. According to preliminary data, 104 tornadoes occurred in July 2016 which is a little less than the July average of 134.
With the Pacific Ocean in an ENSO-neutral state, wind shear over the Atlantic Ocean decreased which normally enhances the development of tropical systems. But in spite of this, only two tropical disturbances formed in the Atlantic Basin in July, neither of which developed into a tropical cyclone. El Niño typically enhances the development of tropical systems in the eastern tropical Pacific. Seven named tropical cyclones formed in the eastern tropical Pacific, which was well above average even though the El Niño has ended. Two became tropical storms (Agatha and Estelle) and five became hurricanes (Blas, Celia, Darby, Frank, & Georgette). The subtropical ridge deflected these systems away from the western CONUS. Four tropical disturbances were analyzed in the western tropical Pacific during July, with two becoming tropical storms (Lupit and Mirinae) and two becoming typhoons (Nepartak and Nida). MJO and Kelvin wave activity helped spawn some of the tropical cyclones in the Pacific early in the month.
With precipitation reduced by the upper-level ridge, and above-normal temperatures enhancing evapotranspiration, drought and abnormal dryness expanded in parts of the West, Great Plains, Southeast, and Northeast. There were areas of drought and abnormal dryness contraction in these same regions, and drought contraction occurred in Hawaii due largely to heavy rains at the beginning of the month and Tropical Storm Darby rains at the end of the month. When precipitation is averaged across the CONUS, July 2016 ranked as the 52nd wettest July in the 1895-2016 record. But drought expansion outweighed drought contraction, so the national moderate-to-exceptional drought footprint increased across the CONUS from 16.2 percent at the end of June to 21.1 percent at the end of July (from 13.6 percent to 17.7 percent for all of the U.S.). The hot and dry weather associated with the upper-level ridge contributed to the development of wildfires across the West, especially during the last half of July (wildfire maps for July 5, 18, 21, 25, 31). Wildfires also developed in Alaska (wildfire maps for July 20, 21, 25, 29).
With the upper-level ridge dominating the weather across much of the CONUS, July ended up with 4,843 record warm daily high (1,462) and low (3,381) temperature records, which is about three and a half times the 1,394 record cold daily high (1,027) and low (367) temperature records. Nationally, July 2016 ranked as the 14th warmest July in the 1895-2016 record. The REDTI (Residential Energy Demand Temperature Index) for July 2016 ranked sixth highest in the 122-year record for July, due to above-normal temperatures which increased cooling demand in the heavily-populated Northeast, Midwest, Southeast, and South.
The Climate Extremes Index (CEI) aggregates temperature and precipitation extremes across space and time. Although temperature and precipitation extremes occurred during the month in many areas, the duration and extent of the extremes were not large enough to significantly affect the CEI components for most regions. For example, the Southwest region had the fourth most extreme warm maximum temperature component for July; the Southeast region had the second most extreme, and South region sixth most extreme, warm minimum temperature component; the East North Central region had the third most extreme 1-day precipitation component and fifth most extreme Palmer wetness component; the Northeast region had the third most extreme 1-day precipitation component; and the Central region had the fifth most extreme days with precipitation component. But the other components were not as extreme, so none of these regions had a top ten most extreme regional CEI. When aggregated across the nation, July 2016 had the eighth most extreme warm minimum temperature component, but the other national components ranked low, with the July 2016 national CEI ranking as only the 57th most extreme CEI in the 107-year record.
 North America monthly upper-level circulation pattern and anomalies. The upper-level circulation pattern, averaged for the month, consisted of a dominant ridge with above-normal height anomalies over the southern CONUS. Troughs moving in the jet stream flow along the Canadian border resulted in below-normal monthly 500-mb heights in the Northwest. Of the circulation indices usually discussed on this page, the teleconnections for a negative NAO most closely match the July 2016 500-mb circulation anomalies. |
 Map of monthly precipitation anomalies. July 2016 was drier than normal across much of the West, Southern Plains, Southeast, and Northeast, as well as northern Alaska. The month was wetter than normal in parts of the Northwest, the Northern and Central Plains to Ohio Valley, much of Alaska and Puerto Rico, and most of Hawaii. |
 Map of monthly temperature anomalies. July 2016 temperatures were warmer than normal along the southern tier States and in the East, and much of Alaska. The month was cooler than normal in the Northwest and Northern Plains as well as part of Alaska. |
 Northern Hemisphere monthly upper-level circulation pattern and anomalies. Global Linkages: The upper-level (500-mb) circulation anomaly pattern over North America was part of a complex long-wave pattern that stretched across the Northern Hemisphere. There were several regional wiggles, or troughs and ridges, in the monthly average pattern. The most notable below-normal height departures (troughs) occurred over Northern Europe and the adjacent Atlantic Ocean, Kazakhstan, and the Arctic Ocean (Beaufort Sea to East Siberian Sea). The most notable above-normal height departures (ridges) occurred over the North Pacific Ocean into eastern Siberia, and across the Arctic Ocean from Greenland to north central Asia. The above-normal 500-mb heights were associated with upper-level ridging at the mid-latitudes; below-normal precipitation over north central Asia; and above-normal surface temperatures over the continents and oceans. The few areas of below-normal 500-mb heights were associated with upper-level troughing; near- to below-normal surface temperatures over Kazakhstan and northeast Siberia; and above-normal precipitation over Great Britain and Kazakhstan. With most of the continents having warmer-than-normal temperatures, and large portions of the Indian Ocean, Atlantic Ocean, and Pacific Ocean having warmer-than-normal sea surface temperatures, the July 2016 global temperature was well above normal. |
Atmospheric Drivers
Subtropical highs, and fronts and low pressure systems moving in the mid-latitude storm track flow, are influenced by the broadscale atmospheric circulation. The circulation of the atmosphere can be analyzed and categorized into specific patterns. The Tropics, especially the equatorial Pacific Ocean, provides abundant heat energy which largely drives the world's atmospheric and oceanic circulation. The following describes several of these modes or patterns of the atmospheric circulation, their drivers, the temperature and precipitation patterns (or teleconnections) associated with them, and their index values this month:
-
El Niño Southern Oscillation (ENSO)
- Description: Oceanic and atmospheric conditions in the tropical Pacific Ocean can influence weather across the globe. ENSO is characterized by two extreme modes: El Niño (warmer-than-normal sea surface temperature [SST] anomalies in the tropical Pacific) and La Niña (cooler-than-normal SST anomalies), with the absence of either of these modes termed "ENSO-neutral" conditions.
- Status: During July 2016, ENSO-neutral conditions continued as equatorial SSTs were near or below average in the east-central and eastern equatorial Pacific.
- Teleconnections (influence on weather): The NWS CPC has no teleconnections for ENSO-neutral conditions.
- Comparison to Observed: While there is some similarity in some areas, overall the July 2016 temperature and precipitation anomaly patterns do not match those associated with La Niña or El Niño.
-
Madden-Julian Oscillation (MJO)
- Description: The MJO is a tropical disturbance or "wave" that propagates eastward around the global tropics with a cycle on the order of 30-60 days. It is characterized by regions of enhanced and suppressed tropical rainfall. One of its indices is a phase diagram which illustrates the phase (1-8) and amplitude of the MJO on a daily basis. The MJO is categorized into eight "phases" depending on the pattern of the location and intensity of the regions of enhanced and suppressed tropical rainfall. The MJO can enter periods of little or no activity, when it becomes neutral or incoherent and has little influence on the weather. Overall, the MJO tends to be most active during ENSO-neutral years, and is often absent during moderate-to-strong El Niño and La Niña episodes.
- Status: The MJO index began the month incoherent, then moved through phases 2 to 3 and ended the month incoherent. Other modes of coherent subseasonal tropical variability, including Kelvin wave activity, influenced the tropical Pacific and global climate, especially the development of tropical cyclones in the equatorial Pacific early in the month (MJO updates for July 4, 11, 18, 25, and August 1).
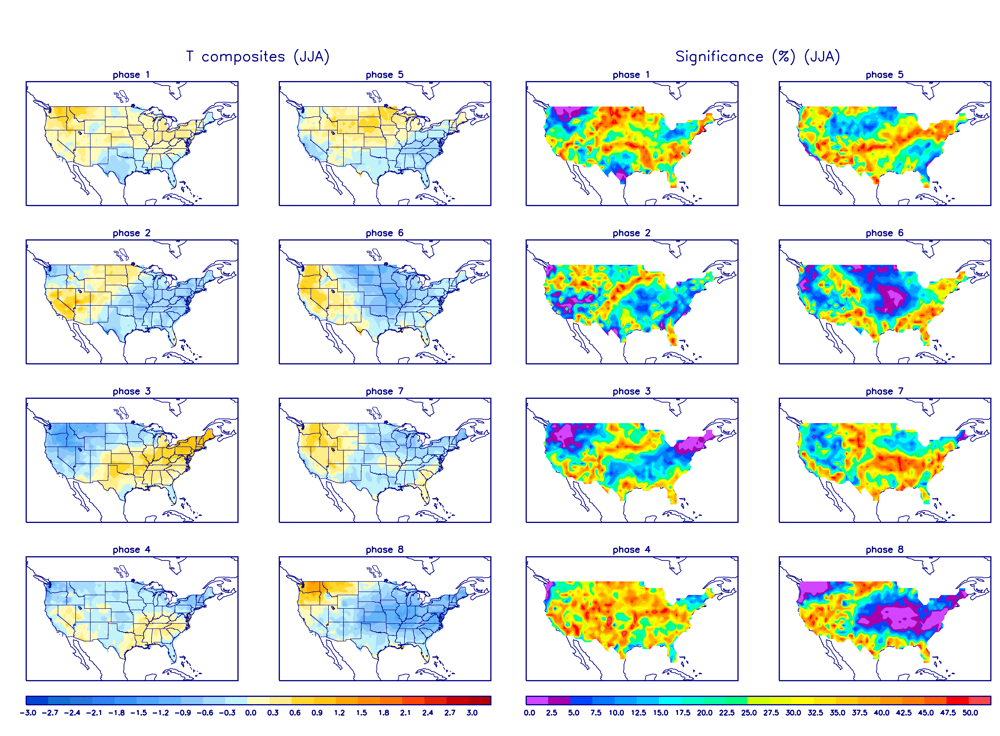
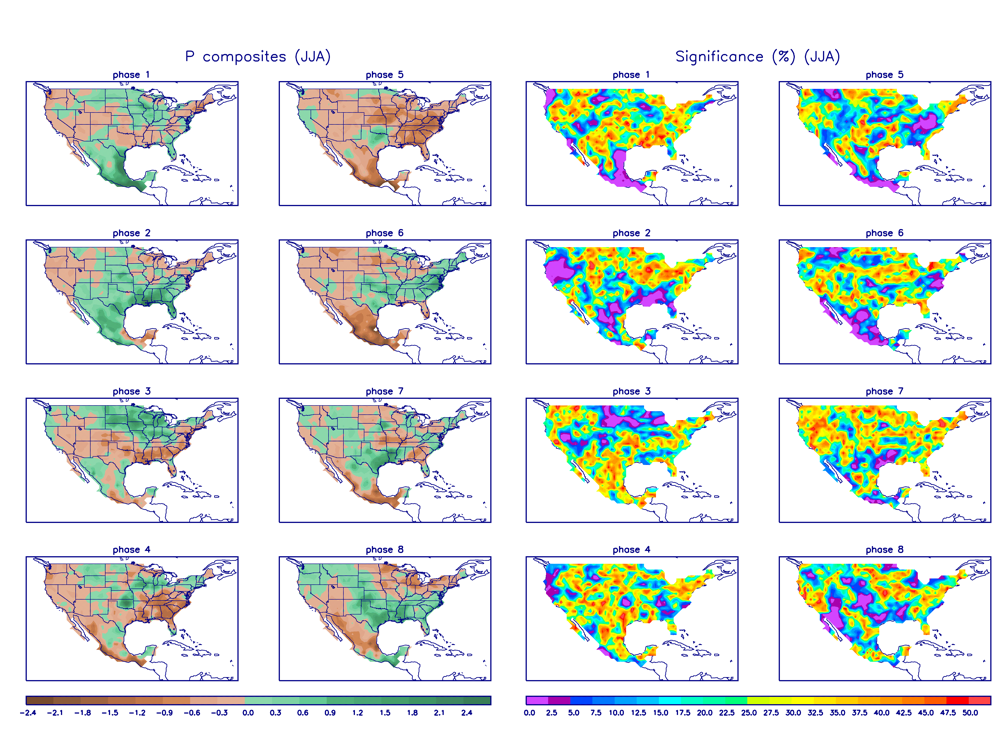
- Teleconnections (influence on weather): The MJO's temperature and precipitation teleconnections to U.S. weather depend on time of year and MJO phase. To the extent teleconnections are known, the July (June-August) teleconnections for temperature are shown here and for precipitation are shown here.
- Comparison to Observed: The MJO is transitory and can change phases (modes) within a month, so it is more closely related to weekly weather patterns than monthly. In the case of July 2016, the weekly temperature and precipitation anomaly patterns generally don't match the teleconnections for the corresponding MJO phases. The monthly temperature and precipitation anomaly patterns match the teleconnections for phase 3, but the MJO was in phase 3 for only three days.
- The Pacific/North American (PNA) pattern
- Description: The PNA teleconnection pattern is associated with strong fluctuations in the strength and location of the East Asian jet stream. PNA-related blocking of the jet stream flow in the Pacific can affect weather downstream over North America, especially the West and especially in the winter half of the year.
- Status: The daily PNA index began the month positive, then turned negative, averaging positive for the month as a whole. The 3-month-averaged index was near zero but slightly negative.
- Teleconnections (influence on weather): To the extent teleconnections are known, a positive PNA for this time of year (July on the quarterly teleconnection maps) is correlated with above-normal precipitation from Montana to Texas; below-normal precipitation in the Great Lakes; and little correlation with precipitation for the rest of the CONUS and Alaska. There is very little correlation with temperatures or upper-level circulation anomalies.
- Comparison to Observed: The July 2016 precipitation anomaly pattern shows little agreement with that expected with a positive PNA where teleconnections exist. The temperature and upper-level circulation anomaly patterns have nothing to compare to (no correlations over the CONUS).
- The Arctic Oscillation (AO) pattern
- Description: The AO teleconnection pattern relates upper-level circulation over the Arctic to circulation features over the Northern Hemisphere mid-latitudes and is most active during the cold season.
- Status: The daily AO index oscillated around zero throughout the month, averaging near zero for the month. The 3-month-averaged index was slightly positive.
- Teleconnections (influence on weather): To the extent teleconnections are known, there are very few precipitation, temperature, or upper-level circulation teleconnections for a neutral AO in July (June-August).
- Comparison to Observed: With few teleconnections, the July 2016 monthly temperature, precipitation, and upper-level circulation anomaly patterns over the CONUS have nothing to compare to. The July upper-level circulation anomaly pattern over the CONUS has slightly above-normal heights over the southern tier States and no major height anomalies. This is somewhat similar to the pattern associated with a neutral AO, but the upper-level circulation anomaly pattern over the rest of the Northern Hemisphere does not match.
- The North Atlantic Oscillation (NAO) pattern
- Description: The NAO teleconnection pattern relates upper-level circulation over the North Atlantic Ocean to circulation features over the Northern Hemisphere mid-latitudes.
- Status: The daily NAO index was negative for most of the month, averaging negative for the month. The 3-month-averaged index was also negative.
- Teleconnections (influence on weather): To the extent teleconnections are known, a negative NAO during July (July on the quarterly teleconnection maps) is associated with below-normal temperatures in the Northern Rockies to Northern Plains; above-normal temperatures from the Southern Plains to Southeast; below-normal upper-level circulation anomalies over much of the West to Great Lakes, and from the North Atlantic to Western Europe; and above-normal upper-level circulation anomalies along the coastal Southeast, in the northeastern North Pacific, and over Greenland. The precipitation teleconnections are very weak, with wetter-than-normal anomalies in the Northern High Plains and Mid-Mississippi Valley, and drier-than-normal conditions in parts of the Southern Plains.
- Comparison to Observed: The July 2016 temperature, precipitation, and upper-level circulation anomaly patterns are a good match with those expected with a negative NAO where teleconnections exist.
- The West Pacific (WP) pattern
- Description: The WP teleconnection pattern is a primary mode of low-frequency variability over the North Pacific and reflects zonal and meridional variations in the location and intensity of the (East Asian) jet stream in the western Pacific.
- Status: The monthly WP index was negative as was the three-month average WP index.
- Teleconnections (influence on weather): To the extent teleconnections are known, a negative WP during July (July on the quarterly teleconnection maps) is typically associated with above-normal temperatures in the Southwest, Mid- and Upper-Mississippi Valley to East Coast, and eastern Canada; below-normal temperatures in northwest Canada; below-normal circulation anomalies over western Canada; and above-normal circulation anomalies over eastern Canada, most of the eastern CONUS, eastern Siberia, and over the North Pacific from Hawaii to California-Nevada. There are no precipitation teleconnections in the CONUS.
- Comparison to Observed: The July 2016 monthly temperature anomaly pattern agrees with that expected with a negative WP over the CONUS, while the upper-level circulation anomaly pattern does not. The precipitation anomaly pattern has no teleconnections over the CONUS to compare to.
- The East Pacific-North Pacific (EP-NP) pattern
- Description: The EP-NP teleconnection pattern relates SST and upper-level circulation patterns (geopotential height anomalies) over the eastern and northern Pacific to temperature, precipitation, and circulation anomalies downstream over North America. Its influence during the winter is not as strong as during the other three seasons.
- Status: The colder-than-normal SST anomaly pattern, which existed in the north central portion of the North Pacific during May 2016 and previous months, continued to warm during July. Much of the northern portion of the North Pacific got warmer, but other parts of the North Pacific experienced a cooling trend. The resulting July SST anomaly pattern consisted of mostly warmer-than-normal SSTs with just a few pockets of cooler-than-normal SSTs in the northwest and central portions of the North Pacific. As the SST pattern changed, so did the atmospheric pressure pattern. A stronger-than-normal North Pacific High and weaker-than-normal Aleutian Low are evident in the sea level pressure (SLP) anomaly pattern. The July 2016 monthly EP-NP index was slightly negative while the 3-month running mean was positive.
- Teleconnections (influence on weather): To the extent teleconnections are known, a negative EP-NP index during July (July on the quarterly teleconnection maps) is typically associated with warmer-than-normal temperatures across central to eastern Canada and across the CONUS from the Central Rockies to Great Lakes; below-normal upper-level circulation anomalies (weaker upper-level ridge) over Alaska and western Canada; and above-normal upper-level circulation anomalies (weaker upper-level trough) from the Central Rockies (in the CONUS) to Hudson Bay in eastern Canada, and over the central North Pacific. The precipitation teleconnections are weak but show below-normal precipitation in Montana and Iowa.
- Comparison to Observed: The July 2016 upper-level circulation, temperature, and precipitation anomaly patterns show little agreement to the teleconnections.
Examination of the available circulation indices and their teleconnection patterns, and comparison to observed July 2016 temperature, precipitation, and circulation anomaly patterns, suggest that the weather over the CONUS in July was traced mostly to atmospheric drivers originating over the North Atlantic. The atmosphere-ocean system was in a state of transition. The tropical Pacific Ocean was in an ENSO-neutral state potentially heading towards a La Niña. The MJO transitioned between phases but was incoherent much of the month, and had its influence affected by Kelvin waves. The daily values for the PNA transitioned from positive to negative during the month and the AO daily index oscillated around zero. The Aleutian Low is not as active during the summer as in the winter, but it was weaker than normal even for summer. The EP-NP index was weak. Only the NAO and WP indices had reasonably strong values. The teleconnection maps for the NAO and WP, taken together, are a good match for the July 2016 temperature anomaly pattern, suggesting the drivers behind both of these indices influenced this month's weather over the CONUS. But it was the good match with the NAO's upper-level circulation teleconnections which indicated that the NAO had the physical mechanism behind the anomalies.
This month illustrates how the weather and climate anomaly patterns can reflect the chaos of transition between atmospheric-oceanic states but still be strongly influenced by one atmospheric driver (or mode of atmospheric variability).