Use the form below to select from a collection of monthly summaries recapping climate-related occurrences on both a global and national scale.
Synoptic DiscussionDecember 2015
Note: This Synoptic Discussion describes recent weather events and climate anomalies in relation to the phenomena that cause the weather. These phenomena include the jet stream, fronts and low pressure systems that bring precipitation, high pressure systems that bring dry weather, and the mechanisms which control these features — such as El Niño, La Niña, and other oceanic and atmospheric drivers (PNA, NAO, AO, and others). The report may contain more technical language than other components of the State of the Climate series.
Summary
Like the previous two months, December 2015 was characterized by a strong El Niño which contributed to an energized upper-level circulation pattern over the contiguous United States (CONUS). Several troughs and ridges migrated through the jet stream flow, with strong low pressure systems developing in the central CONUS. Fronts and weather systems moving in the jet stream flow brought above-normal precipitation to much of the country. Near- to below-normal temperatures and beneficial snow accompanied the Pacific weather systems in the West, while ridging ahead of the systems funneled unusually warm air far northward in the East. Severe weather was triggered by the fronts and lows in the South and Southeast, while below-freezing air behind the fronts transformed the precipitation into snowfall in the Plains to Great Lakes. The widespread heavy precipitation contracted drought in the Pacific Northwest, Great Plains, and northern Great Lakes. The upper-level circulation, temperature, and precipitation anomaly patterns suggest that the weather and climate of December 2015 were the combined result of atmospheric drivers originating over the Pacific, Arctic, and North Atlantic Oceans. See below for details.
Synoptic Discussion
 |
 |
In the Northern Hemisphere, December marks the beginning of climatological winter which is the time of year when solar heating reaches a minimum with the low sun angle, arctic air masses are much colder, and an expanded circumpolar vortex forces the jet stream southward. Polar air masses influence the weather over the contiguous U.S. (CONUS) more, and the warm, dry subtropical high pressure belts influence the weather less.
That wasn't the case during December 2015. The strong El Niño energized the atmosphere and produced a circulation that was very active with several upper-level troughs and low pressure systems moving across the CONUS. The troughs frequently plunged far south to form cutoff lows which developed into powerful storm systems across the central part of the country. Upper-level ridging, with a warm southerly air flow, developed across the eastern CONUS ahead of these storm systems and was reflected in above-normal 500-mb heights with the North Atlantic subtropical high pressure center. The jet stream kept cold Arctic air bottled up over far northern Canada, with Pacific air masses dominating the weather over the CONUS.
The strong jet stream flow directed numerous Pacific weather systems into western North America, slamming the coastal Pacific Northwest with heavy precipitation. As the systems moved across the western U.S., they brought near- to cooler-than-normal temperatures and welcomed mountain snowfall.
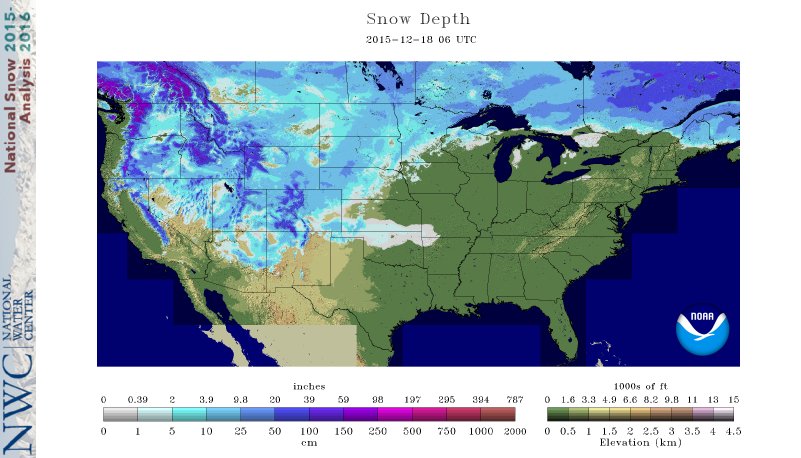
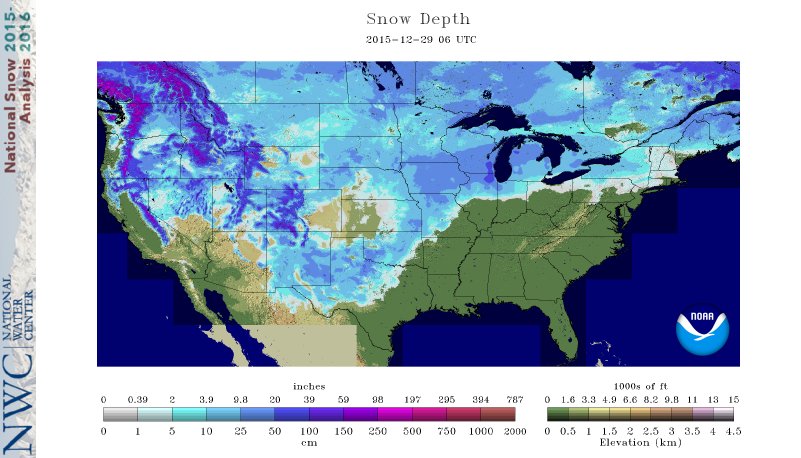
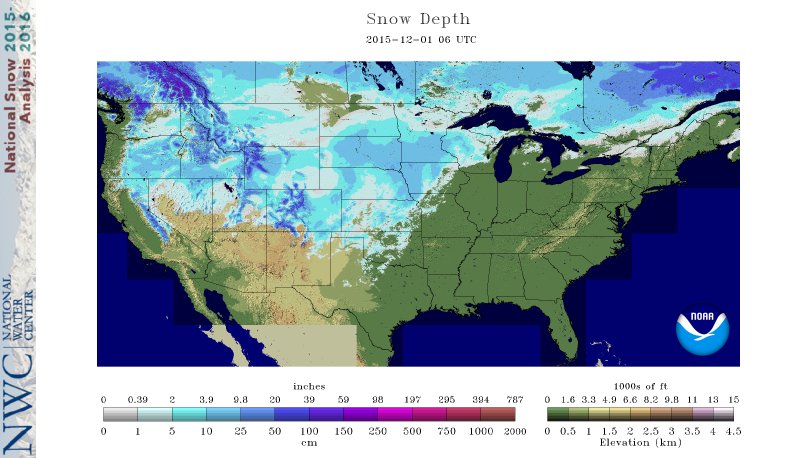
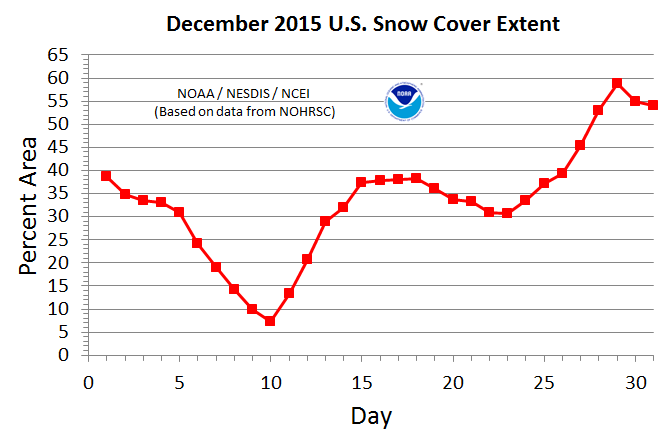
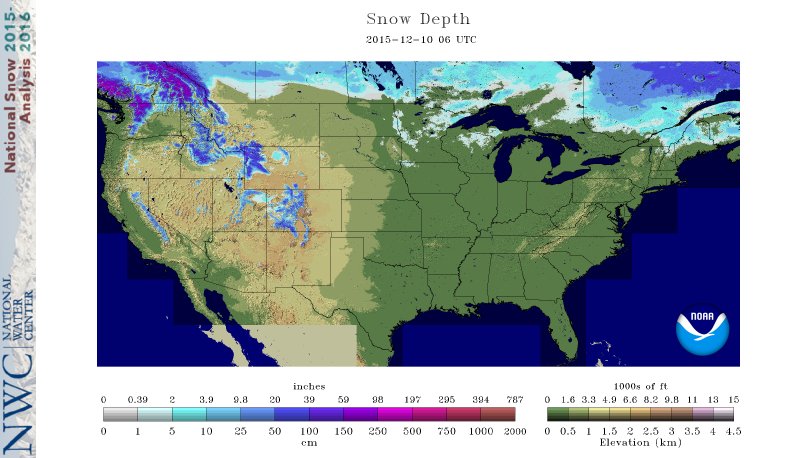
The troughs and low pressure systems intensified as they moved into the Plains states. With a southerly flow ahead of the systems, Gulf of Mexico moisture was drawn northward and wrung out by the lows and fronts as heavy rain. Above-normal precipitation was widespread across the central and eastern CONUS. The greatest percent-of-normal anomalies occurred along the storm tracks in the Plains to Midwest, where Iowa and Wisconsin had their wettest December on record, and in the Southeast. Snow fell in the below-freezing air behind some of the systems. The southerly flow also brought much warmer-than-normal to record warm temperatures to the central and eastern CONUS. This had a significant impact on the snow cover. The month began with 38.7 percent of the CONUS covered in snow. As the circulation shifted to a warm pattern in the Plains and East, much of the snow cover in the Plains melted with only 7.2 percent of the CONUS covered by December 10th. A series of storms since then brought snow to the West and Plains again, increasing the snow coverage to about 38 percent by mid-month and, after a slight contraction for a few days, to 58.9 percent by the 29th. The record warm temperatures kept the monthly snow cover well below normal from the Midwest to Northeast.
By the end of the month, there were 11,981 record warm daily high (5,215) and low (6,766) temperature records, which is nearly 19 times the 635 record cold daily high (371) and low (264) temperature records. Twenty-nine states in the central and eastern CONUS had the warmest December in the 1895-2015 record, with the CONUS ranking warmest nationally. The REDTI (Residential Energy Demand Temperature Index) for December 2015 ranked lowest in the 1895-2015 record for December, illustrating how the unusually warm temperatures reduced heating demands in the heavily-populated Plains to East Coast.
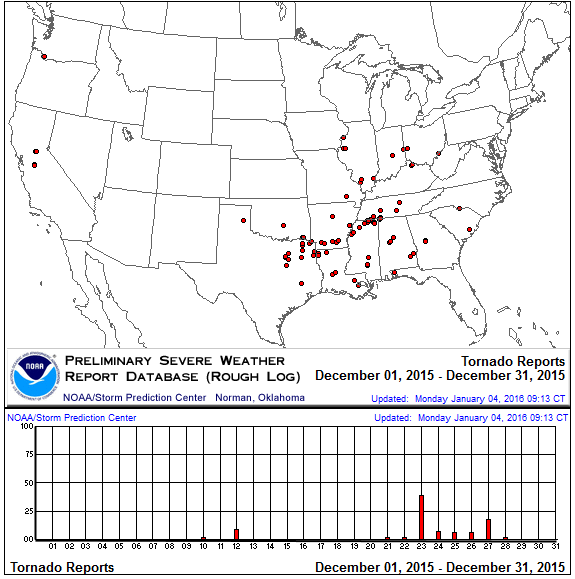
With strong closed lows moving out of the West and into the Plains, a divergent southerly flow is set up over the Plains. This pattern contributes to the development of thunderstorms and severe weather. There were 93 tornadoes nationwide during December (according to preliminary reports), which is above the December average of 24. Most of the tornadoes occurred in the Southern Plains to Midwest and Southeast with closed lows and strong troughs during the last third of the month.
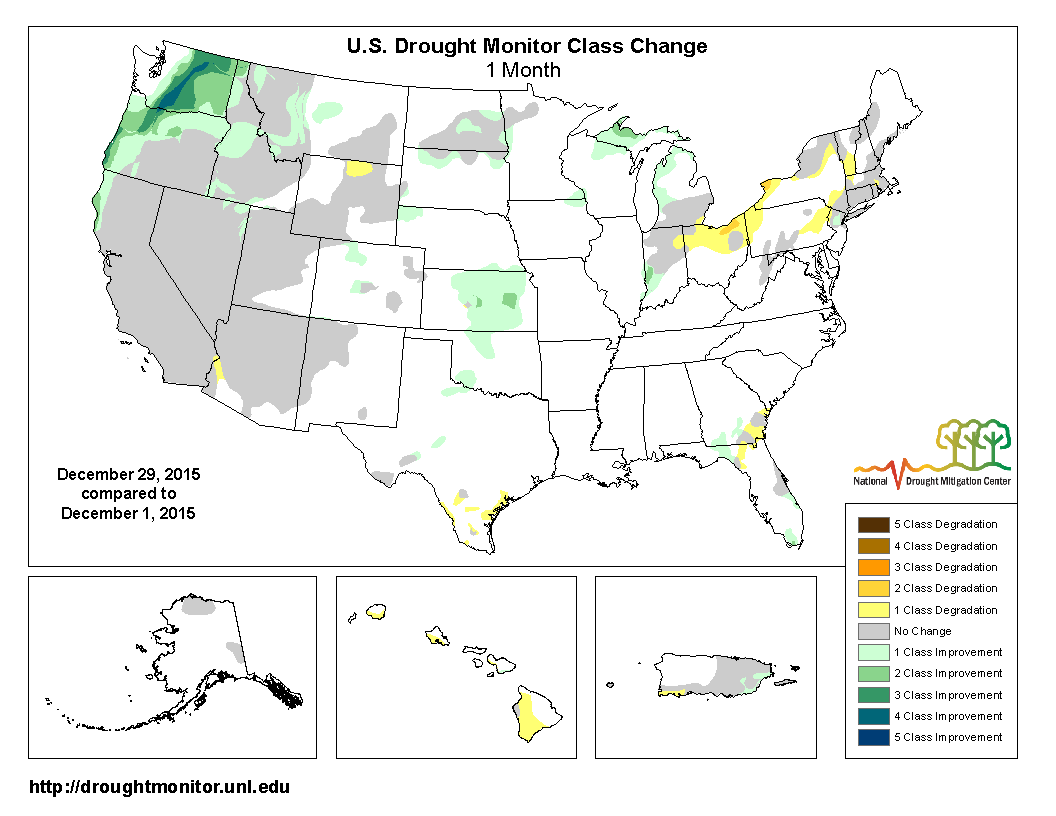
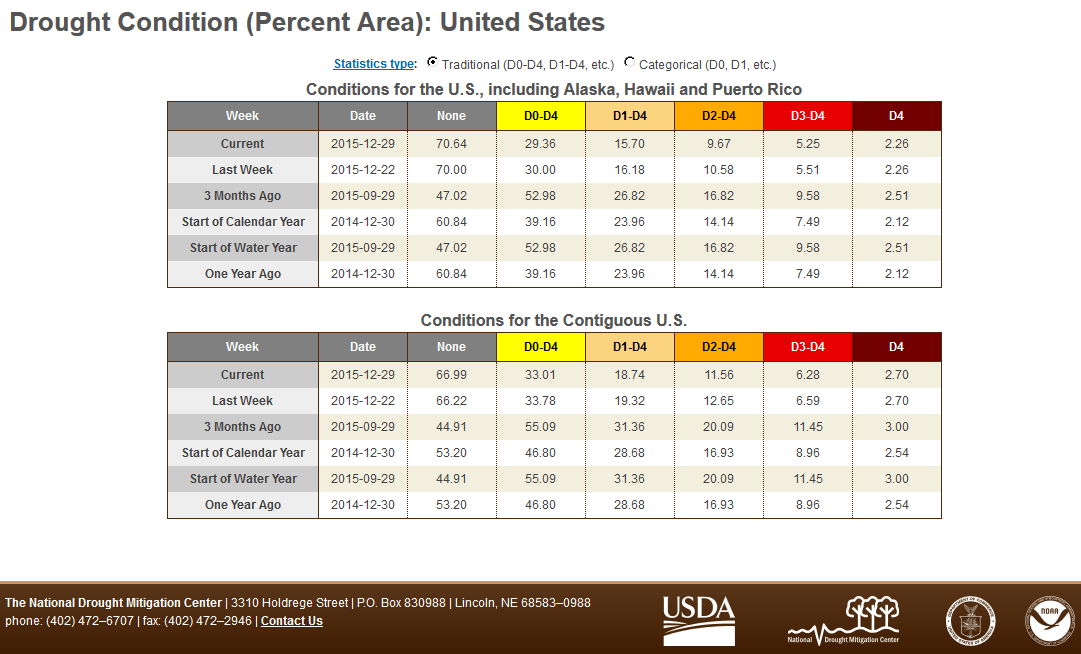
Nationally, December 2015 ranked as the wettest December on record. The widespread above-normal precipitation contracted drought and abnormal dryness in the Pacific Northwest, Great Plains, and northern Great Lakes. Wet conditions in the Northwest are unusual because during typical El Niño years storm systems are deflected away from the Pacific Northwest. Drought and Abnormal Dryness expanded slightly in Lower Great Lakes and Northeast. Overall, the national moderate-to-exceptional drought footprint shrank to 15.7 percent of the U.S. as a whole, and 18.7 percent of the CONUS.
The oceanic and atmospheric conditions associated with El Niño normally enhance tropical cyclone activity in the eastern and central equatorial Pacific Ocean. Even though the East Pacific and Central Pacific hurricane seasons normally go through the end of November, tropical cyclone activity occurred in the Pacific this month. During December, two tropical cyclones (Typhoon Melor and Tropical Depression 29-W) developed in the Western Pacific, one tropical cyclone (Tropical Depression 9-C) developed in the Central Pacific, and two (Tropical Cyclone Ula and Tropical Depression 5-C) developed in the Pacific south of the equator.
The Climate Extremes Index (CEI) aggregates temperature and precipitation extremes across space and time. Several parts of the U.S. experienced December extremes which were manifested in record or top-ten ranks for warm maximum and minimum temperatures, 1-day precipitation extremes, large numbers of days with precipitation, and cumulative wet conditions reflected by the Palmer Drought Severity Index (PDSI) (the PDSI measures wet as well as dry conditions). These included the East North Central, Central, and Southeast regions, which had the most extreme December CEI in the 1910-2015 record; the South region (third most extreme); and the Northeast region (fourth most extreme). The Central region's record December CEI was due to record extreme warm minimum and warm maximum temperature components, record extreme wet spell component, third most extreme 1-day precipitation component, and 15th most extreme days with precipitation component. The Southeast region's record December CEI was due to record extreme warm minimum and warm maximum temperature components, record extreme days with precipitation component, and seventh most extreme wet spell component. The East North Central region's record December CEI was due to the most extreme warm minimum and sixth most extreme warm maximum temperature components, second most extreme 1-day precipitation component, seventh most extreme days with precipitation component, and ninth most extreme wet spell component. The South region's third most extreme December CEI was due to a record extreme 1-day precipitation component, fourth most extreme warm minimum and seventh most extreme warm maximum temperature components, and fifth most extreme wet spell component. The Northeast region's fourth most extreme December CEI was due mainly to record extreme warm minimum and warm maximum temperature components. When aggregated across the nation, December 2015 had the fourth most extreme national December CEI on record, with the most extreme warm minimum and third most extreme warm maximum temperature components, most extreme 1-day precipitation component, fifth most extreme days with precipitation component, and eighth most extreme wet spell component contributing.
 North America monthly upper-level circulation pattern and anomalies. As the troughs and ridges migrated through the jet stream flow across North America, the storm track favored troughing over the West and ridging over the East. This resulted in a below-normal 500-mb height anomaly pattern over the western CONUS, across western Canada, and over Alaska, and an above-normal pattern over the eastern CONUS and Canada. |
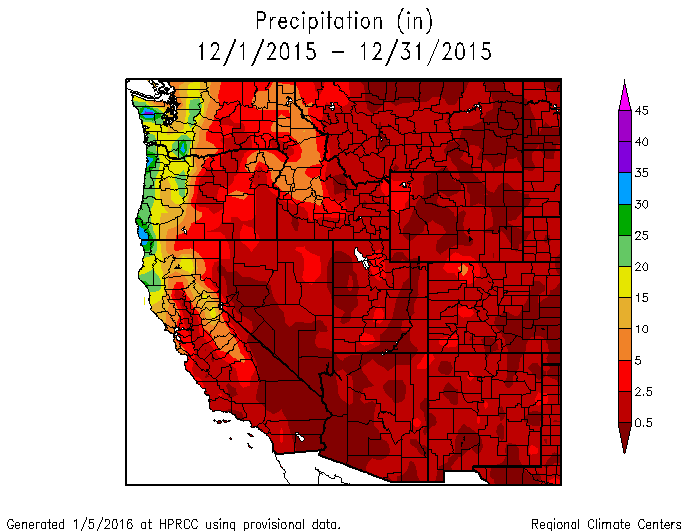
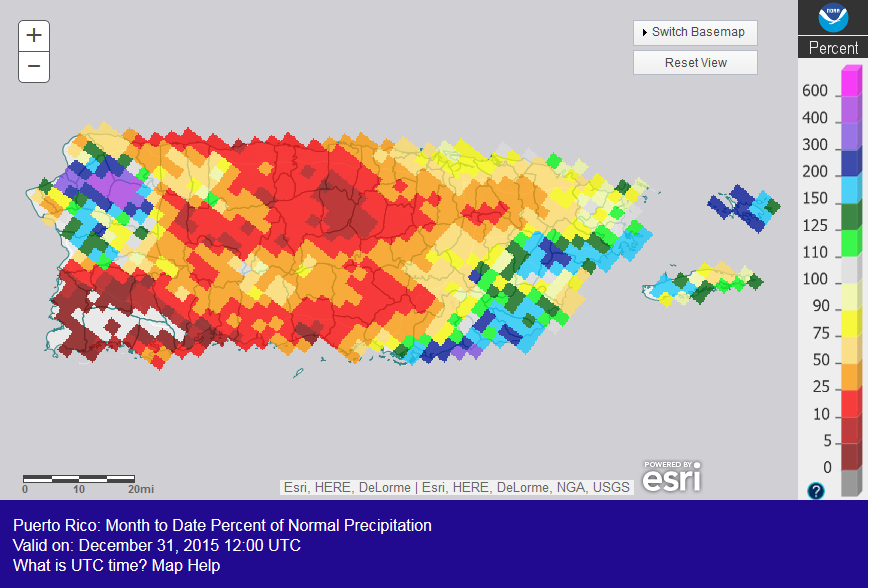
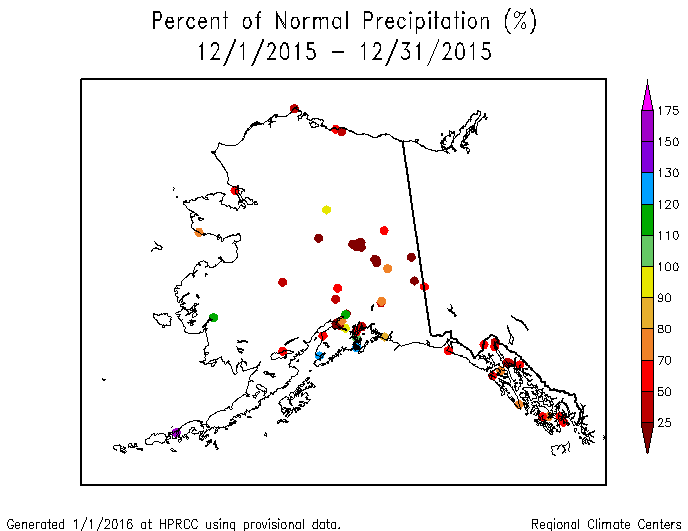
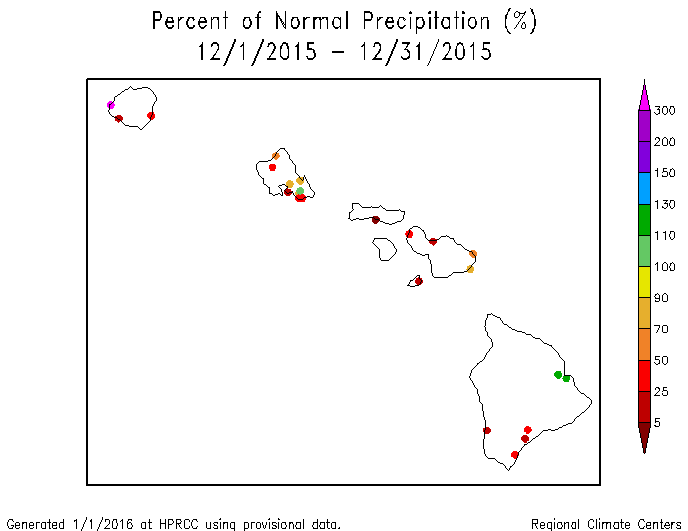
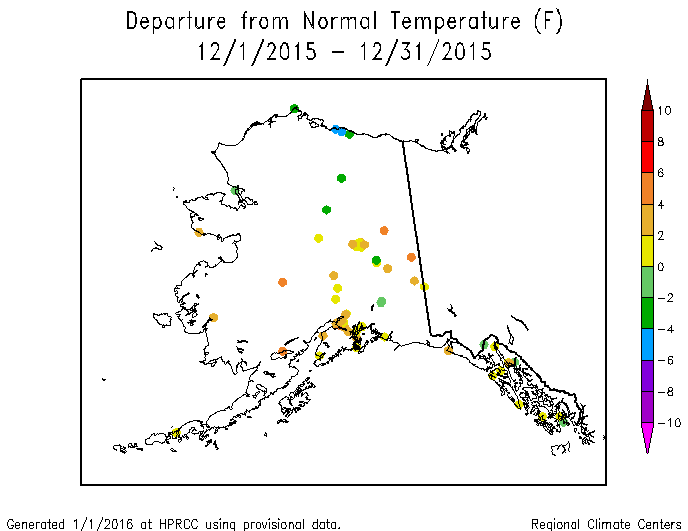
 Map of monthly precipitation anomalies. Drier-than-normal monthly precipitation anomalies occurred across parts of the Southwest, the High Plains, southern Texas, and Florida to coastal South Carolina. But it was wetter than normal across the rest of the country, and much wetter than normal in parts of the Pacific Northwest, Plains to Midwest, and Southeast. The precipitation anomaly pattern was mostly drier than normal in Puerto Rico, Alaska, and Hawaii. |
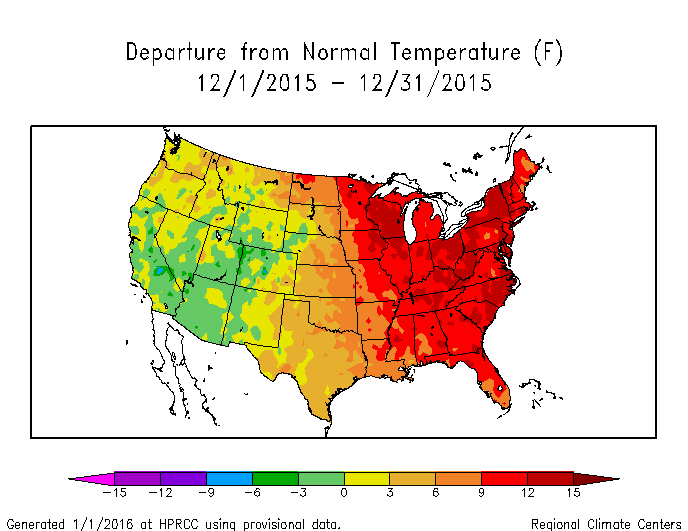 Map of monthly temperature anomalies. December 2015 averaged near to cooler than normal across the western CONUS and warmer to much warmer than normal from the Plains to East Coast, with a mixed temperature anomaly pattern over Alaska. |
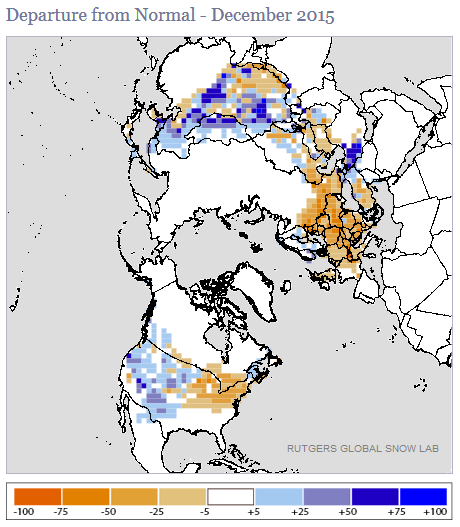
Northern Hemisphere monthly upper-level circulation pattern and anomalies.
Atmospheric Drivers
Subtropical highs, and fronts and low pressure systems moving in the mid-latitude storm track flow, are influenced by the broadscale atmospheric circulation. The circulation of the atmosphere can be analyzed and categorized into specific patterns. The Tropics, especially the equatorial Pacific Ocean, provides abundant heat energy which largely drives the world's atmospheric and oceanic circulation. The following describes several of these modes or patterns of the atmospheric circulation, their drivers, the temperature and precipitation patterns (or teleconnections) associated with them, and their index values this month:
-
El Niño Southern Oscillation (ENSO)
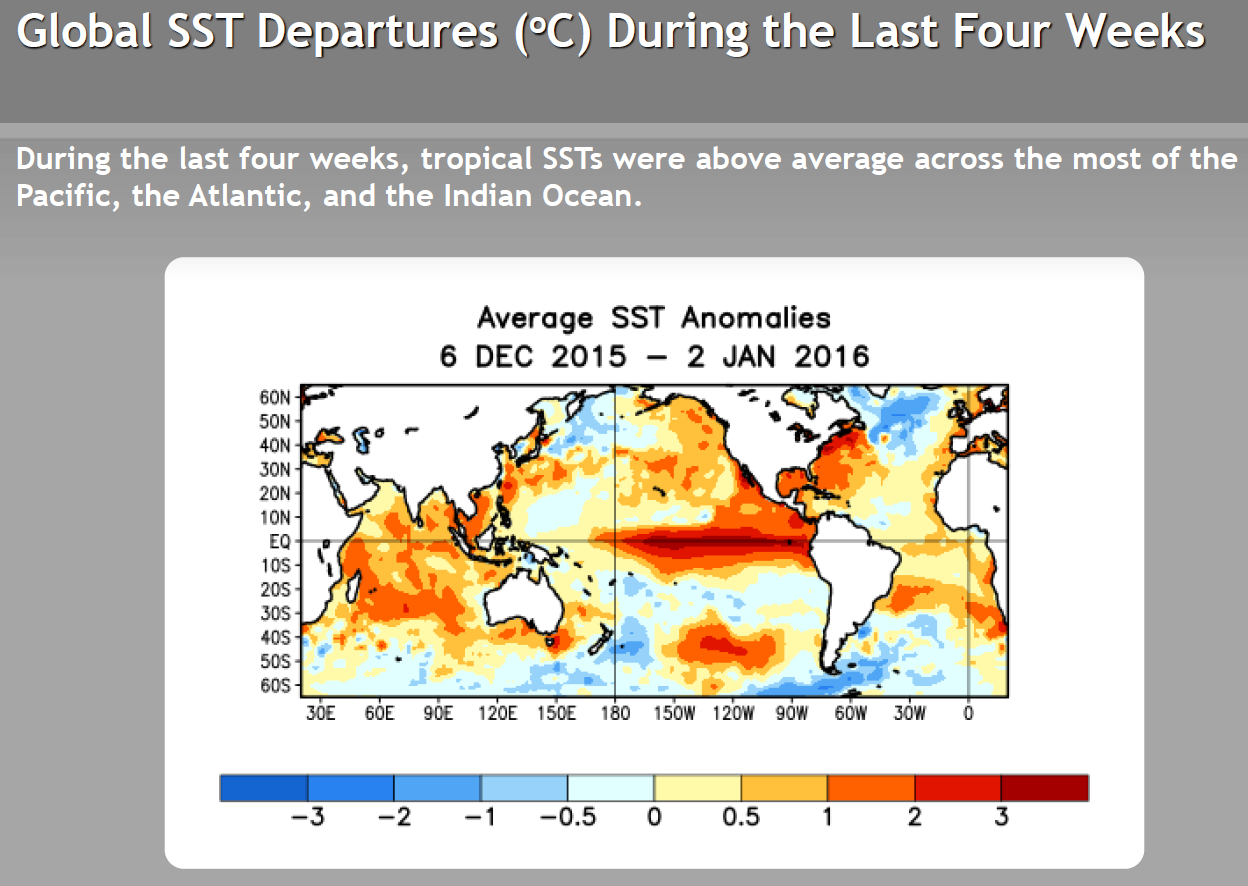
- Description: Oceanic and atmospheric conditions in the tropical Pacific Ocean can influence weather across the globe. ENSO is characterized by two extreme modes: El Niño (warmer-than-normal sea surface temperature [SST] anomalies in the tropical Pacific) and La Niña (cooler-than-normal SST anomalies), with the absence of either of these modes termed "ENSO-neutral" conditions.
- Status: During December 2015, El Niño conditions were observed as above-average SSTs continued across the western and central equatorial Pacific and continued to be coupled to the tropical atmosphere. Collectively, the atmospheric and oceanic features reflected strong El Niño.
- Teleconnections (influence on weather): To the extent teleconnections are known, the typical temperature and precipitation patterns associated with El Niño during December include above-normal precipitation in parts of the Southwest, Southern Plains, Southeast, and East Coast; below-normal precipitation in the Pacific Northwest and Midwest; below-normal temperatures in the southern tier states and above-normal temperatures in the interior Northwest, although there is a trend toward warmer-than-normal temperatures for much of the CONUS.
- Comparison to Observed: The December 2015 precipitation anomaly pattern is a reasonable match with that expected historically with an El Niño in the Southeast and along the East Coast, but is opposite to what happened in the West or Midwest. The temperature anomaly pattern does not match the historical teleconnections for an El Niño.
-
Madden-Julian Oscillation (MJO)
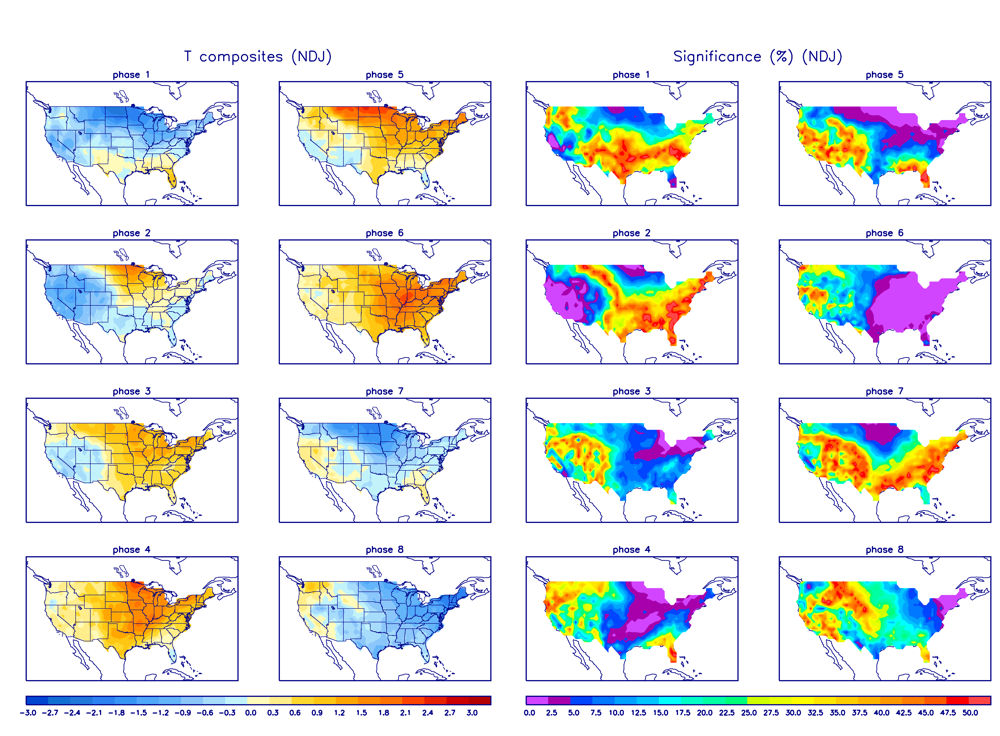
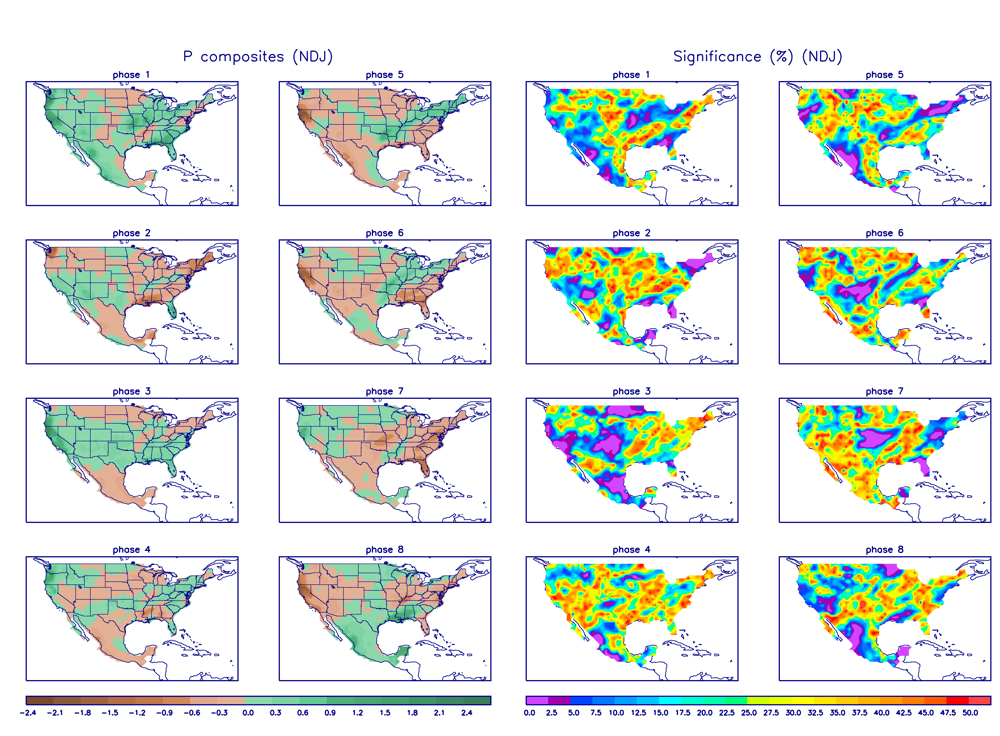
- Description: The MJO is a tropical disturbance or "wave" that propagates eastward around the global tropics with a cycle on the order of 30-60 days. It is characterized by regions of enhanced and suppressed tropical rainfall. One of its indices is a phase diagram which illustrates the phase (1-8) and amplitude of the MJO on a daily basis. The MJO is categorized into eight "phases" depending on the pattern of the location and intensity of the regions of enhanced and suppressed tropical rainfall. The MJO can enter periods of little or no activity, when it becomes neutral or incoherent and has little influence on the weather. Overall, the MJO tends to be most active during ENSO-neutral years, and is often absent during moderate-to-strong El Niño and La Niña episodes.
- Status: The MJO index started the month incoherent then weakly in phase 3, then rapidly progressed through phases 4, 5, and 6 as the month progressed. Late in the month, the MJO constructively interfered with the El Niño, enhancing precipitation over the equatorial central Pacific. Other modes of coherent subseasonal tropical variability, including the background El Niño state and Kelvin and Rossby wave activity, also influenced the tropical Pacific and global climate (MJO updates for December 7, 14, 21, 28, and January 4).
- Teleconnections (influence on weather): The MJO's temperature and precipitation teleconnections to U.S. weather depend on time of year and MJO phase. To the extent teleconnections are known, the October-December teleconnections for temperature are shown here and for precipitation are shown here.
- Comparison to Observed: The MJO is transitory and can change phases (modes) within a month, so it is more closely related to weekly weather patterns than monthly. But in the case of December 2015, the monthly temperature temperature anomaly pattern matches very well that expected with MJO phases 3 to 6, especially east of the Rockies where it was warmer than normal. The temperature anomaly patterns also match very well for weeks 2, 3, and 4. The monthly precipitation anomaly pattern matches that expected with MJO phases 3 and 4 in the Northwest and phases 5 and 6 in the central and eastern CONUS. The weekly (weeks 2, 3, 4) precipitation anomaly patterns are a reasonable match for those expected with MJO phases 4-6 in various areas during each week.
- The Pacific/North American (PNA) pattern
- Description: The PNA teleconnection pattern is associated with strong fluctuations in the strength and location of the East Asian jet stream. PNA-related blocking of the jet stream flow in the Pacific can affect weather downstream over North America, especially the West and especially in the winter half of the year.
- Status: The daily PNA index was positive to neutral, averaging positive for the month as a whole. The 3-month-averaged index was also positive.
- Teleconnections (influence on weather): To the extent teleconnections are known, a positive PNA for this time of year (January on the teleconnection maps) is correlated with below-normal temperatures over the Southern Plains to East Coast; below-normal temperature anomalies along the West Coast and across western Canada and Alaska; below-normal precipitation in the Pacific Northwest and much of the CONUS from the Mississippi River to East Coast; above-normal upper-level circulation anomalies over western North America; and below-normal circulation anomalies over the Southern Plains to East Coast.
- Comparison to Observed: The December 2015 temperature, precipitation, and upper-level circulation anomaly patterns are mostly opposite those expected with a positive PNA.
- The Arctic Oscillation (AO) pattern
- Description: The AO teleconnection pattern relates upper-level circulation over the Arctic to circulation features over the Northern Hemisphere mid-latitudes and is most active during the cold season.
- Status: The daily AO index was mostly positive to neutral, averaging positive for the month. The 3-month-averaged index was positive.
- Teleconnections (influence on weather): To the extent teleconnections are known, a positive AO this time of year (November-January) is typically associated with dry conditions in the Gulf of Mexico coastal regions and Northeast; wet conditions in the coastal Northwest to the northern half of California; above-normal temperatures for most of the country east of the Rockies; and upper-level circulation anomalies which are above normal in the North Central Pacific, central to eastern CONUS, Western Europe, and across the North Atlantic, and below normal over the Arctic Ocean, Greenland, and Alaska.
- Comparison to Observed: The December 2015 monthly temperature anomaly pattern is a good match for those areas where correlations exist. The upper-level circulation anomaly pattern is also a good match, especially globally, but appears more elongated in places over North America — the below-normal height anomalies extend further south over the western CONUS and above-normal height anomalies extend further into eastern Canada. The monthly precipitation anomaly pattern agrees in the coastal Northwest but not elsewhere.
- The North Atlantic Oscillation (NAO) pattern
- Description: The NAO teleconnection pattern relates upper-level circulation over the North Atlantic Ocean to circulation features over the Northern Hemisphere mid-latitudes.
- Status: The daily NAO index was positive to neutral, averaging positive for the month. The 3-month-averaged index was positive.
- Teleconnections (influence on weather): To the extent teleconnections are known, a positive NAO during this time of year (January on the teleconnection maps) is associated with above-normal temperature and upper-level circulation anomalies over the eastern CONUS. The precipitation teleconnections are very weak, with drier-than-normal anomalies from California to southern Idaho.
- Comparison to Observed: The December 2015 temperature and upper-level circulation anomaly patterns agree with those expected for a positive NAO. The precipitation anomaly pattern has few or no teleconnections with a positive NAO, but generally doesn't agree where there are teleconnections.
- The West Pacific (WP) pattern
- Description: The WP teleconnection pattern is a primary mode of low-frequency variability over the North Pacific and reflects zonal and meridional variations in the location and intensity of the (East Asian) jet stream in the western Pacific.
- Status: The monthly WP index and three-month average WP index were both positive.
- Teleconnections (influence on weather): To the extent teleconnections are known, a positive WP during this time of year (January on the maps) is typically associated with above-normal temperatures in the Midwest to Northeast and southeastern Canada; below-normal temperatures in the Southwest; above-normal precipitation from Oklahoma to the Ohio Valley; above-normal circulation anomalies over the eastern CONUS and eastern Canada; and below-normal circulation anomalies over the western CONUS.
- Comparison to Observed: The December 2015 monthly temperature, precipitation, and upper-level circulation anomaly patterns show good agreement with those expected with a positive WP, where correlations exist.
- The Tropical/Northern Hemisphere (TNH) pattern
- Description: The TNH teleconnection pattern reflects large-scale changes in both the location and eastward extent of the Pacific jet stream, and also in the strength and position of the climatological mean Hudson Bay Low, and is dominant in the winter months. The pattern significantly modulates the flow of marine air into North America, as well as the southward transport of cold Canadian air into the north-central United States.
- Status: The TNH index was neutral (zero) during December.
- Teleconnections (influence on weather): Teleconnection patterns have not been computed for a neutral TNH.
- Observed: The December 2015 monthly precipitation, temperature, and upper-level circulation anomaly patterns do not agree with those expected for either a positive or negative TNH.
Examination of the available circulation indices and their teleconnection patterns, and comparison to observed December 2015 temperature, precipitation, and circulation anomaly patterns, suggest that the weather over the CONUS in December reflected influences from Arctic, North Atlantic, and Pacific atmospheric drivers. The TNH index was neutral, indicating that the interaction between the Pacific jet stream and the Hudson Bay Low was not a factor. The lack of agreement with the PNA teleconnections indicates that blocking of the Pacific jet stream was not a factor. To the contrary, the El Niño is pumping energy and moisture from the tropical Pacific into the mid-latitudes, priming the atmosphere for action. But the fact that the December 2015 anomaly patterns do not match the teleconnections for an El Niño suggests that other atmospheric drivers are having a greater influence or at least moderating El Niño's influence. The temperature pattern most closely matches that expected with the WP, but the AO also matches quite well east of the Rockies and the MJO also matches in some regions and weeks. The NAO temperature match could be coincidence, although the AO and NAO drivers are somewhat related. The precipitation pattern suggests that the AO could have contributed to the wet Pacific Northwest, but so could the MJO. The WP is associated with above-normal precipitation in the Midwest, but so is the MJO. The overall shape of the upper-level circulation anomaly pattern is consistent with that expected with the AO, but with some modifications over the CONUS that are consistent with the WP.
This month illustrates how the weather and climate anomaly patterns can reflect the influence of several atmospheric drivers (or modes of atmospheric variability), especially when they appear to be in sync with each other.