Use the form below to select from a collection of monthly summaries recapping climate-related occurrences on both a global and national scale.
Synoptic DiscussionAnnual 2020
Note: This Synoptic Discussion describes recent weather events and climate anomalies in relation to the phenomena that cause the weather. These phenomena include the jet stream, fronts and low pressure systems that bring precipitation, high pressure systems that bring dry weather, and the mechanisms which control these features — such as El Niño, La Niña, and other oceanic and atmospheric drivers (PNA, NAO, AO, and others). The report may contain more technical language than other components of the State of the Climate series.
Summary
The climate patterns for the contiguous U.S. in 2020 were strongly driven by ridges along each coast and a trough in the interior. The West Coast ridge was primarily associated with positive episodes of the Pacific/North American Pattern (PNA) and the East Pacific Oscillation (EPO). During January and February, this ridge inhibited precipitation in the Southwest during their wet season. It played a similar role in December for the subsequent wet season. The lack of precipitation during these months is a primary reason why all six states in the Southwest had one of their five driest years on record in 2020. The anomalous Southwest ridge was also associated with temperatures being much above normal for this region. However, the temperature anomalies primarily occurred during the summer and fall.
The strength and location of the trough was affected by several teleconnections throughout the year, including the PNA, and strongly positive episodes of the Arctic Oscillation (AO) and the North Atlantic Oscillation (NAO). It was associated with several cold air outbreaks. The temperature signal was most apparent in April and particularly October when it drove cold anomalies over the Northern Plains. However, these cold anomalies are counter-balanced in the annual mean by warm anomalies in January, February, November, and December.
While the trough had a limited affect on temperatures, it played a larger role in the precipitation patterns. Throughout the first half of the year, the trough was associated with a number of extratropical precipitation events across the Southeast. Several states in the Southeast were already experiencing much above average precipitation before the Atlantic hurricane season started. During the hurricane season, a record 12 tropical cyclones made landfall in the U.S. The trough steered several of these storms across the Southeast from Louisiana to Virginia, which exacerbated the above-normal precipitation across the region.
The East Coast ridge was most prominent in January-March in association with the strongly positive AO and NAO. However, the pattern returned to some extent in November and December.
Atmospheric Drivers
| Month | Key Driver | Other Drivers |
|---|---|---|
| January | AO+ | EPO+ |
| February | AO+ | EPO+, MJO |
| March | PNA- | AO+, EPO- |
| April | EPO- | |
| May | EPO | Cutoff Low May 15-24 |
| June | EPO+ | |
| July | NOA- | PNA+ |
| August | PNA+ | La Niña, MJO |
| September | PNA+ | EPO |
| October | PNA- | MJO, Hurricanes |
| November | AO+ | NAO+ |
| December | PNA+ | AO- |
The El Niño Southern Oscillation (ENSO) began 2020 with neutral conditions. The most common metric for ENSO, the Niño 3.4 index, was above normal from October 2019 through March 2020, but it stayed near the +0.5°C threshold that NOAA uses as part of its El Niño criteria. In addition, the atmospheric response never materialized. Ocean anomalies cooled significantly during the summer culminating in the onset of La Niña during August. These La Niña conditions continued through the end of 2020.
The AO was strongly positive during January-March 2020. Four of the five highest daily AO values on record since 1950 happened during February 2020, and the monthly mean AO for February 2020 was the second-highest on record behind January 1990.
Beginning in March, upper-level circulation over the Pacific played a larger role in the North American weather patterns. The PNA was strongly negative in March and April. The circulation during the late spring and early summer was particularly influenced by fluctuations in the Pacific jet associated with the EPO. The PNA was positive for most of the Summer, which was unusual given the shift towards La Niña conditions then. The PNA was negative in October, but shifted back to its positive phase in December. Meanwhile, strongly positive phases of the AO and the related NAO developed in November, but both indices rapidly became negative in December.
Seasonal Evolution
January-March


Several of the key patterns in the 2020 mean climate were present beginning in January-March. A ridge in the Northeast Pacific extended over the western U.S. during January and February. That ridge inhibited precipitation during the California's peak wet season. A trough near the northern Rockies was associated with persistent precipitation over much of the Southeast.
The extremely positive AO during January and February is typically associated with warmer temperatures over the eastern U.S., as was observed during January-March 2020. The NAO was also strongly positive, which also favors the anomalous ridge and warm temperatures along the East Coast in particular.
March-May


The circulation pattern began to shift during March. The ridge over the eastern Pacific shifted northward to Alaska, and a trough developed near the California coast. This pattern was associated with the negative PNA during March and April. The trough brought enhanced moisture to the Southwest U.S., but it was not enough to counter the dry anomalies from January and February. Farther south, a ridge near Central America brought warm anomalies to the Southern Rockies and the Gulf Coast.
June-August


The ridge returned to the Southwest during the summer as a trough developed near Alaska. This pattern reflects the positive phase of the EPO and the PNA. The Pacific ridge brought hot and dry anomalies to the Southwest. Another anomalous ridge extended from the Great Lakes towards the North Pole and brought hot temperatures to the Northeast, particularly during July.
August-October

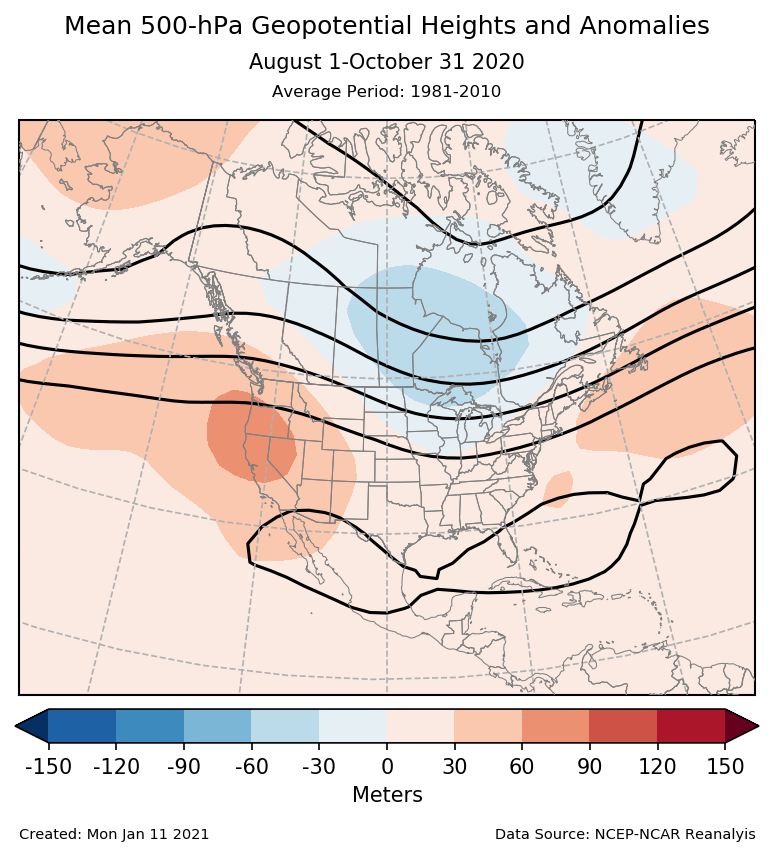

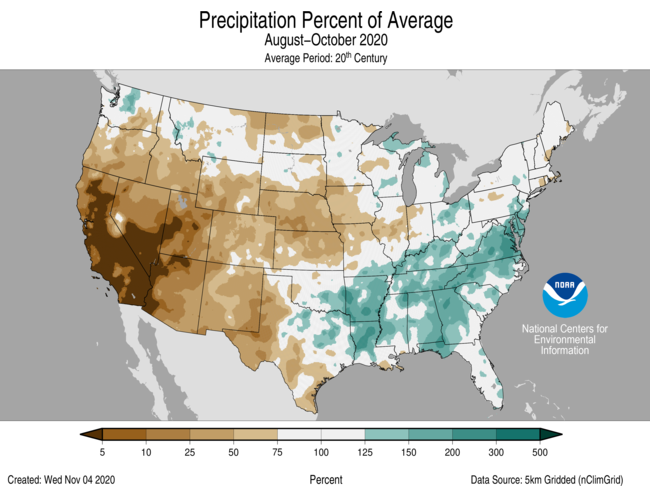
The trough near Alaska weakened during September, as the ridge from the Southwest strengthened and extended farther north along the West Coast. This ridge persisted the exceptionally hot and dry conditions for the Southwest. A trough over the Great Plains brought cooler than normal temperatures there. The trough also steered several tropical cyclones across the Southeast, generally making landfall near Louisiana and moving northeastward towards Virginia. A record 12 tropical cyclones made landfall in the U.S. in 2020, and these contributed to exceptionally wet conditions across the Southeast.
October-December

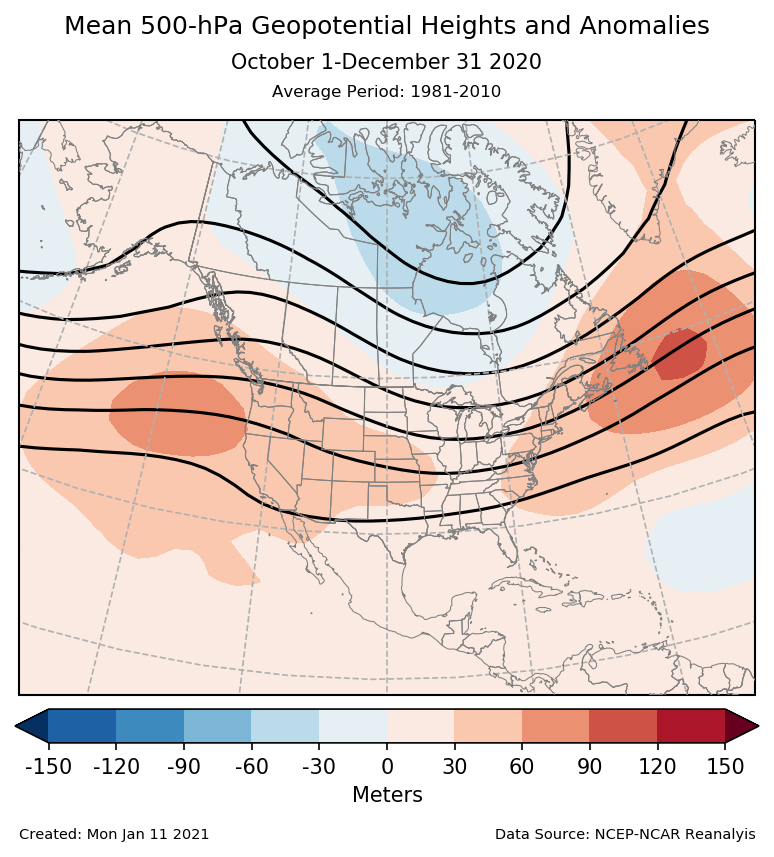


The ridges along the East and West Coasts with a trough over the Great Plains continued to be the dominant pattern through the end of 2020. The West Coast ridge persisted the dry conditions for California into the beginning of its normal wet season. The East Coast ridge brought warm anomalies there and was associated with a strongly positive NAO during November.