Use the form below to select from a collection of monthly summaries recapping climate-related occurrences on both a global and national scale.
Synoptic DiscussionFebruary 2016
Note: This Synoptic Discussion describes recent weather events and climate anomalies in relation to the phenomena that cause the weather. These phenomena include the jet stream, fronts and low pressure systems that bring precipitation, high pressure systems that bring dry weather, and the mechanisms which control these features — such as El Niño, La Niña, and other oceanic and atmospheric drivers (PNA, NAO, AO, and others). The report may contain more technical language than other components of the State of the Climate series.
Summary
The strong El Niño continued during February 2016 and contributed to a stronger-than-normal Aleutian Low which energized the upper-level circulation pattern over the contiguous United States (CONUS). Upper-level ridging dominated in the West, which kept precipitation drier than normal for much of the western and central CONUS and temperatures warmer than normal for most of the country. But troughs migrating through the jet stream flow intensified over the East, bringing above-normal precipitation and outbreaks of severe weather. A southerly flow of warmer-than-normal air helped contract the snow cover, especially during the last half of the month. The precipitation in the Northeast and improving conditions in the West helped to shrink the drought area slightly. The upper-level circulation, temperature, and precipitation anomaly patterns suggest that the weather and climate of February 2016 were largely the result of atmospheric drivers originating over the Pacific Ocean. See below for details.
Synoptic Discussion
 |
 |
In the Northern Hemisphere, February marks the end of climatological winter which is the time of year when solar heating reaches a minimum with the low sun angle, arctic air masses are much colder, and an expanded circumpolar vortex forces the jet stream southward. Polar air masses influence the weather over the contiguous U.S. (CONUS) more, and the warm, dry subtropical high pressure belts influence the weather less.
February 2016 was a little different from the norm. The strong El Niño energized the atmosphere and produced a stronger-than-normal Aleutian Low. The Aleutian Low fed an atmospheric circulation that was very active with several upper-level troughs and low pressure systems which moved across the CONUS. At the surface, this circulation pattern pushed a stream of Pacific weather systems into western North America. However, the North Pacific subtropical high pressure center was also active this month and reinforced an upper-level ridge over the western CONUS which weakened the Pacific weather systems as they migrated through it. The ridge inhibited precipitation over the West and contributed a northwesterly component to the circulation over the central CONUS which generally blocked Gulf of Mexico moisture. As a result, much of the western and central U.S. was drier than normal for the month. The strong Aleutian Low contributed to a warm southerly flow over Alaska which resulted in another warmer-than-normal month, wetter-than-normal conditions for some southern coastal locations, and drier-than-normal conditions for much of the rest of the state.
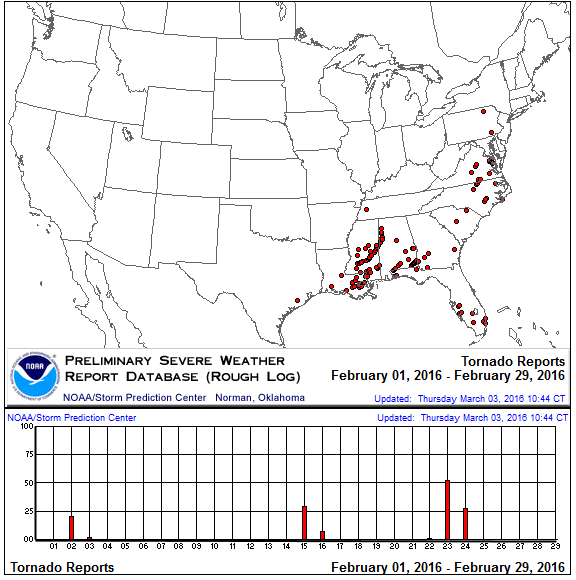
An upper-level trough dominated the eastern CONUS. Weather systems were re-energized when they reached the East, pulling in North Atlantic and some Gulf of Mexico moisture to give much of the East a wetter-than-normal month, which helped to contract drought in the Northeast. Cold Canadian air masses were pulled in behind many of the low pressure systems, giving the Southeast a monthly average temperature that was near to colder than normal. The clash of cold Canadian air and warmer and moist Gulf of Mexico and North Atlantic air, combined with a southerly flow of air aloft and the violent dynamics associated with these weather systems, resulted in outbreaks of severe weather over the Southeast and Mid-Atlantic States. There were 138 tornadoes nationwide during February (according to preliminary reports), which is well above the February average of 29.
A strong trough moved across the West at the beginning of the month, bringing below-normal temperatures across the Southwest and above-normal weekly precipitation to parts of the Southwest. Pacific weather systems plowed into the western ridge at mid-month, contributing to above-normal weekly precipitation in the Northwest and helping to contract drought in the area. But for the most part, the upper-level short-wave troughs and Pacific weather systems were no match for the western ridge, leaving the region drier than normal for the month.
The ridge also allowed warmer-than-normal air to dominate most of the country. The above-normal temperatures helped to contract the snow cover, especially during the last half of the month. About 40 percent of the CONUS was snow-covered for the first half of the month. As warmer air masses dominated during the second half, the snow cover extent contracted to 15-25 percent. By month's end, there were 6,805 record warm daily high (3,882) and low (2,923) temperature records, which is about six times the 1,109 record cold daily high (777) and low (332) temperature records, with the CONUS ranking seventh warmest nationally for February. The REDTI (Residential Energy Demand Temperature Index) for February 2016 ranked ninth lowest in the 1895-2016 record for February, illustrating how the unusually warm temperatures in the major metropolitan areas of the Northeast, Midwest, and West reduced heating demands.
Nationally, February 2016 ranked as the 46th driest February on record. This resulted from the unusually low precipitation in the usually wet west coast and south central regions. But above-normal precipitation in the Northeast, and improving hydrologic conditions in the Northwest, helped to contract drought and abnormal dryness in those regions. Areas in Wyoming, North Dakota, the Southwest, and Southern Plains missed out on the precipitation, so drought and abnormal dryness expanded there. Overall, the national moderate-to-exceptional drought footprint shrank slightly to 12.1 percent of the U.S. as a whole, and 14.3 percent of the CONUS.
 North America monthly upper-level circulation pattern and anomalies. As the troughs and ridges migrated through the jet stream flow across North America, the storm track favored troughing over the eastern CONUS and ridging over the West. A below-normal 500-mb height anomaly pattern prevailed across much of the North Pacific. Below-normal 500-mb height anomalies over the North Pacific and southeastern CONUS and above-normal anomalies over western North America are characteristic of a positive PNA index pattern. |
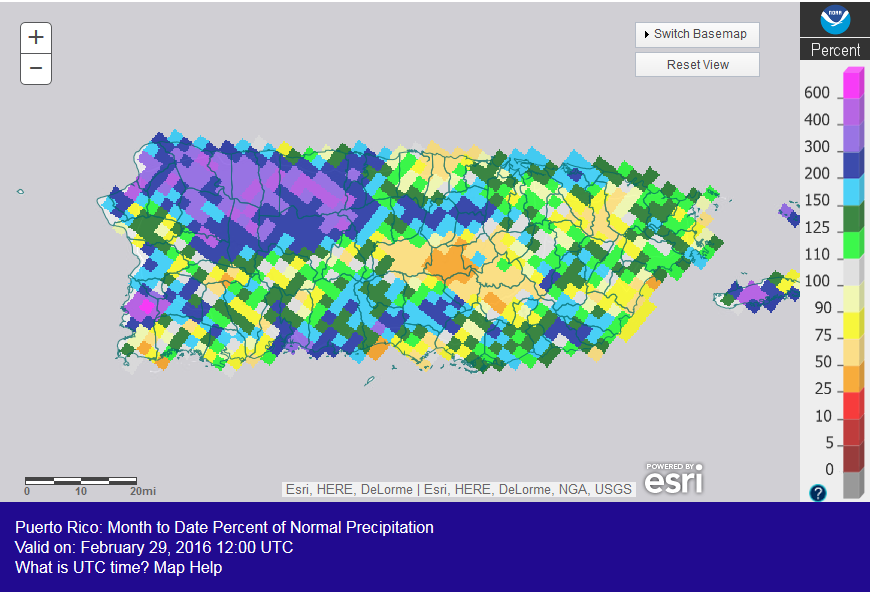
 Map of monthly precipitation anomalies. February 2016 was drier than normal over Hawaii, most of Alaska, and much of the West to Mississippi Valley. It was wetter than normal across most of Puerto Rico, parts of the Ohio Valley and Central to Northern Plains, and much of the eastern CONUS. |
 Map of monthly temperature anomalies. February 2016 was warmer than normal across Alaska and most of the CONUS, and cooler than normal across parts of the intermountain basin and Southeast. |

Northern Hemisphere monthly upper-level circulation pattern and anomalies.
Atmospheric Drivers
Subtropical highs, and fronts and low pressure systems moving in the mid-latitude storm track flow, are influenced by the broadscale atmospheric circulation. The circulation of the atmosphere can be analyzed and categorized into specific patterns. The Tropics, especially the equatorial Pacific Ocean, provides abundant heat energy which largely drives the world's atmospheric and oceanic circulation. The following describes several of these modes or patterns of the atmospheric circulation, their drivers, the temperature and precipitation patterns (or teleconnections) associated with them, and their index values this month:
-
El Niño Southern Oscillation (ENSO)
- Description: Oceanic and atmospheric conditions in the tropical Pacific Ocean can influence weather across the globe. ENSO is characterized by two extreme modes: El Niño (warmer-than-normal sea surface temperature [SST] anomalies in the tropical Pacific) and La Niña (cooler-than-normal SST anomalies), with the absence of either of these modes termed "ENSO-neutral" conditions.
- Status: During February 2016, El Niño conditions were observed as above-average SSTs continued across the western and central equatorial Pacific and continued to be coupled to the tropical atmosphere. Collectively, the atmospheric and oceanic features reflected a strong El Niño, but beginning to weaken.
- Teleconnections (influence on weather): To the extent teleconnections are known, the typical temperature and precipitation patterns associated with El Niño during February include above-normal precipitation along the West Coast, Gulf of Mexico Coast, and East Coast; below-normal precipitation in parts of the interior West and Central Plains to Great Lakes; above-normal temperatures in the interior Northwest, western Great Lakes, and Maine, but below-normal temperatures across most of the rest of the CONUS.
- Comparison to Observed: The February 2016 precipitation anomaly pattern agrees along the East Coast and most (dry) interior locations, but does not match along the West Coast and Gulf Coast where wet anomalies correlate with an El Niño. The temperature anomaly pattern is nearly opposite to that expected historically with an El Niño in most areas.
-
Madden-Julian Oscillation (MJO)
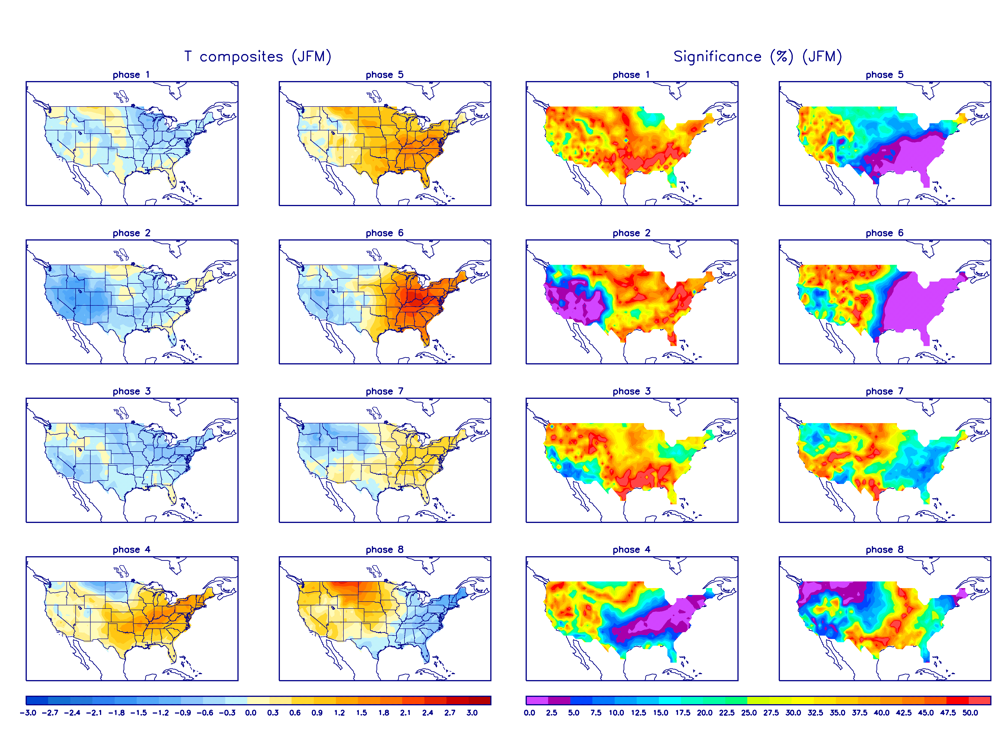
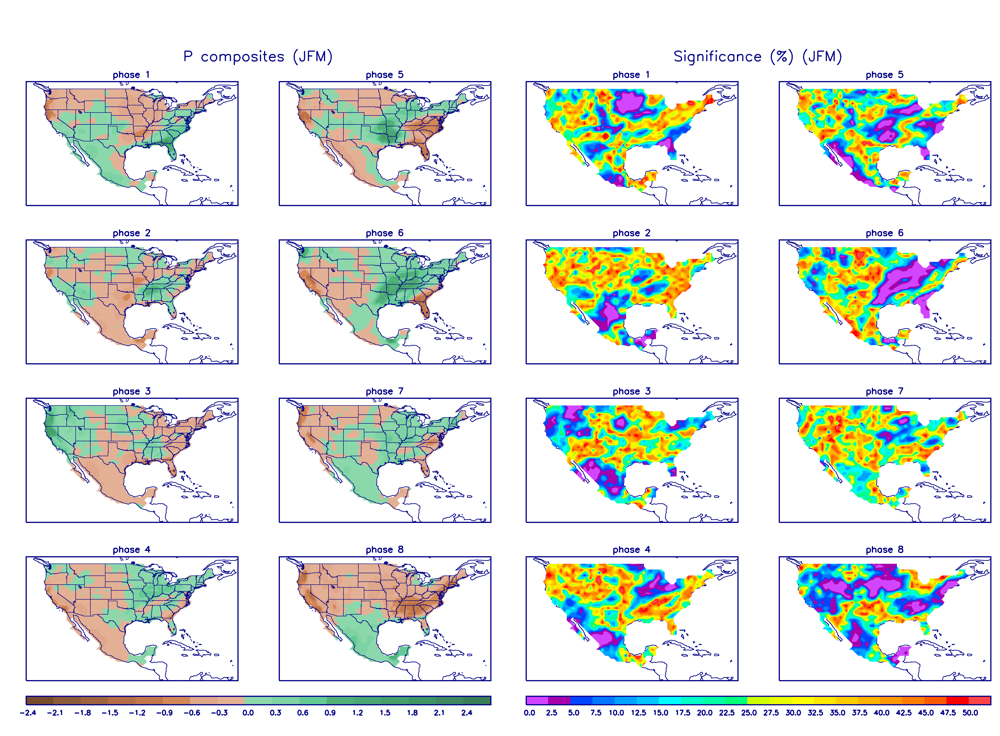
- Description: The MJO is a tropical disturbance or "wave" that propagates eastward around the global tropics with a cycle on the order of 30-60 days. It is characterized by regions of enhanced and suppressed tropical rainfall. One of its indices is a phase diagram which illustrates the phase (1-8) and amplitude of the MJO on a daily basis. The MJO is categorized into eight "phases" depending on the pattern of the location and intensity of the regions of enhanced and suppressed tropical rainfall. The MJO can enter periods of little or no activity, when it becomes neutral or incoherent and has little influence on the weather. Overall, the MJO tends to be most active during ENSO-neutral years, and is often absent during moderate-to-strong El Niño and La Niña episodes.
- Status: The MJO index started the month in phase 4, progressed through phases 5 to 7, ending the month barely in phase 8. Early in the month, the MJO destructively interfered with the El Niño, which reduced its influence. Other modes of coherent subseasonal tropical variability, including the background El Niño state, also influenced the tropical Pacific and global climate (MJO updates for February 8, 15, 22, and 29).
- Teleconnections (influence on weather): The MJO's temperature and precipitation teleconnections to U.S. weather depend on time of year and MJO phase. To the extent teleconnections are known, the January-March teleconnections for temperature are shown here and for precipitation are shown here.
- Comparison to Observed: The MJO is transitory and can change phases (modes) within a month, so it is more closely related to weekly weather patterns than monthly. In the case of February 2016, both the monthly temperature temperature anomaly pattern and weekly temperature anomaly patterns (weeks 1, 2, 3, 4), and monthly precipitation anomaly pattern and weekly precipitation anomaly patterns (weeks 1, 2, 3, 4), show little agreement with those expected with the MJO.
- The Pacific/North American (PNA) pattern
- Description: The PNA teleconnection pattern is associated with strong fluctuations in the strength and location of the East Asian jet stream. PNA-related blocking of the jet stream flow in the Pacific can affect weather downstream over North America, especially the West and especially in the winter half of the year.
- Status: The daily PNA index was positive, averaging positive for the month as a whole. The 3-month-averaged index was also positive.
- Teleconnections (influence on weather): To the extent teleconnections are known, a positive PNA for this time of year (January on the teleconnection maps) is correlated with below-normal temperatures over the Southern Plains to East Coast; above-normal temperature anomalies along the West Coast and across western Canada and Alaska; below-normal precipitation in the Pacific Northwest and much of the CONUS from the Mississippi River to East Coast; above-normal upper-level circulation anomalies over western North America; and below-normal circulation anomalies over the Southern Plains to East Coast and over the North Pacific.
- Comparison to Observed: The February 2016 temperature anomaly pattern agrees with that expected with a positive PNA across Alaska and most of the CONUS, except the Southern Plains and Northeast. The upper-level circulation anomaly pattern is a very good match over the North Pacific and CONUS. The precipitation anomaly pattern agrees over the western and central CONUS, but not in the East.
- The Arctic Oscillation (AO) pattern
- Description: The AO teleconnection pattern relates upper-level circulation over the Arctic to circulation features over the Northern Hemisphere mid-latitudes and is most active during the cold season.
- Status: The daily AO index oscillated between positive and negative, ending the month averaging near zero or neutral. The 3-month-averaged index was slightly positive but approaching zero.
- Teleconnections (influence on weather): To the extent teleconnections are known, a neutral AO this time of year (January-March) is typically associated with dry conditions in the Central Plains and Central Gulf of Mexico coast; wet conditions along the Pacific Northwest coast to northern California and in the Ohio and Tennessee Valleys; above-normal temperatures in the Southeast to Ohio Valley; below-normal temperatures in northern Montana; and upper-level circulation anomalies which are above normal in the North Central Pacific and below normal over western Canada.
- Comparison to Observed: The February 2016 monthly temperature and upper-level circulation anomaly patterns are a poor match to those expected with a neutral AO. The monthly precipitation anomaly pattern is a reasonable match except in the West.
- The North Atlantic Oscillation (NAO) pattern
- Description: The NAO teleconnection pattern relates upper-level circulation over the North Atlantic Ocean to circulation features over the Northern Hemisphere mid-latitudes.
- Status: The daily NAO index was positive throughout the month.
- Teleconnections (influence on weather): To the extent teleconnections are known, a positive NAO during this time of year (January on the teleconnection maps) is associated with above-normal temperature and upper-level circulation anomalies over the eastern CONUS. The precipitation teleconnections are very weak, with drier-than-normal anomalies from California to southern Idaho.
- Comparison to Observed: The February 2016 temperature anomaly pattern does not match that expected with a positive NAO in the Southeast, but it does elsewhere that there are teleconnections. The precipitation anomaly pattern has few teleconnections, but they do match in the West. The upper-level circulation anomaly pattern shows little agreement.
- The West Pacific (WP) pattern
- Description: The WP teleconnection pattern is a primary mode of low-frequency variability over the North Pacific and reflects zonal and meridional variations in the location and intensity of the (East Asian) jet stream in the western Pacific.
- Status: The monthly WP index and three-month average WP index were both positive.
- Teleconnections (influence on weather): To the extent teleconnections are known, a positive WP during this time of year (January on the maps) is typically associated with above-normal temperatures in the Midwest to Northeast and southeastern Canada; below-normal temperatures in the Southwest; above-normal precipitation from Oklahoma to the Ohio Valley; above-normal circulation anomalies over the eastern CONUS and eastern Canada; and below-normal circulation anomalies over the western CONUS and eastern Siberia.
- Comparison to Observed: The February 2016 monthly temperature anomaly pattern shows some hint of agreement with that expected with a positive WP in the West, but not elsewhere. The upper-level circulation anomaly pattern agrees over eastern Siberia but not over the CONUS. The precipitation anomaly pattern shows little agreement.
- The Tropical/Northern Hemisphere (TNH) pattern
- Description: The TNH teleconnection pattern reflects large-scale changes in both the location and eastward extent of the Pacific jet stream, and also in the strength and position of the climatological mean Hudson Bay Low, and is dominant in the winter months. The pattern significantly modulates the flow of marine air into North America, as well as the southward transport of cold Canadian air into the north-central United States.
- Status: The TNH index was slightly positive (essentially neutral) during February.
- Teleconnections (influence on weather): To the extent teleconnections are known, a positive TNH is typically associated with cooler-than-normal temperatures for much of the country, drier-than-normal conditions in the West, and slightly wetter-than-normal conditions in the Tennessee Valley. The upper-level circulation anomalies for a positive TNH are below-normal 500-mb geopotential heights over the eastern two-thirds of Canada and the north central U.S., and above-normal heights over the northeastern Pacific and Gulf of Mexico into the western North Atlantic.
- Observed: The February 2016 monthly upper-level circulation and temperature anomaly patterns do not agree with those expected with a positive TNH, but the precipitation anomaly pattern shows some agreement.
- The East Pacific-North Pacific (EP-NP) pattern
- Description: The EP-NP teleconnection pattern relates SST and upper-level circulation patterns (geopotential height anomalies) over the eastern and northern Pacific to temperature, precipitation, and circulation anomalies downstream over North America. Its influence during the winter is not as strong as during the other three seasons.
- Status: The colder-than-normal SST anomaly pattern in the north central portion of the North Pacific, with the warmer-than-normal ring along its southern, eastern, and northeastern edges, continued during February 2016. But the warm anomalies along the North American coast continued to get slightly warmer. The cooler-than-normal SST anomalies were roughly located beneath the stronger-than-normal Aleutian Low, and the warmer-than-normal SST anomalies along the North American coast roughly coincided with the upper-level ridging across the western CONUS and adjacent North Pacific. The February monthly EP-NP index was slightly positive and 3-month running mean was near zero.
- Teleconnections (influence on weather): To the extent teleconnections are known, a positive EP-NP index during this time of year (April on the maps) is typically associated with cooler-than-normal temperatures across central to eastern Canada and across the CONUS east of the Rockies, and warmer-than-normal temperatures across Alaska and the extreme West Coast of the CONUS; above-normal upper-level circulation anomalies (stronger upper-level ridge) over Alaska to the western CONUS, and below-normal upper-level circulation anomalies (stronger upper-level trough) over eastern Canada and the adjacent CONUS. The precipitation teleconnections are weak but show evidence of wetter-than-normal conditions over Wyoming and the Ohio Valley.
- Comparison to Observed: The February 2016 temperature anomaly pattern agrees with that expected for a positive EP-NP over Alaska, but not most of the CONUS. The upper-level circulation anomaly pattern agrees over the western CONUS, but not elsewhere. The precipitation anomaly pattern shows little agreement to the few teleconnections to compare to.
Examination of the available circulation indices and their teleconnection patterns, and comparison to observed February 2016 temperature, precipitation, and circulation anomaly patterns, suggest that the weather over the CONUS in February reflected influences from Pacific atmospheric drivers with some possible influence from the Arctic drivers. The El Niño was pumping energy and moisture from the tropical Pacific into the mid-latitudes, priming the atmosphere for action. This energy was reflected in an intense Aleutian Low over the north central North Pacific, as well as in positive values for the PNA and WP indices. The February 2016 temperature anomaly pattern from western Canada to much of the CONUS matched the temperature teleconnections associated with the PNA, modified by the WP, and agreed with the EP-NP teleconnections over Alaska. The upper-level circulation anomaly pattern is in good agreement with the PNA teleconnections. The February precipitation anomaly pattern seems to show some agreement with the teleconnections of several of the atmospheric drivers in various parts of the country. El Niño, PNA, AO, NAO, and even TNH seem to be partial players, although precipitation patterns are highly variable and some of the agreement may be due to random chance, especially since the temperature and upper-level circulation indicators suggested some of these drivers had little influence.
This month illustrates how the weather and climate anomaly patterns can reflect the influence of atmospheric drivers (or modes of atmospheric variability) from one general region (the Pacific).