Use the form below to select from a collection of monthly summaries recapping climate-related occurrences on both a global and national scale.
Tropical Cyclones ReportFebruary 2024

Summary
Eleven named storms occurred across the globe in February, which was above the 1991-2020 average of seven. One of those reached tropical cyclone strength (≥74 mph), and one reached major tropical cyclone strength (≥111 mph). The global accumulated cyclone energy (ACE: an integrated metric of the strength, frequency, and duration of tropical storms) was about 55% of the 1991-2020 average for February.
The only major tropical cyclone was Very Intense Tropical Cyclone Djoungou in the South Indian Ocean. On average, a major tropical cyclone occurs in the South Indian Ocean once every February. Djoungou peaked with maximum sustained winds of 135 mph and a minimum central pressure of 942 mb. Djoungou remained in the central part of the South Indian Ocean and did not approach any major land masses.
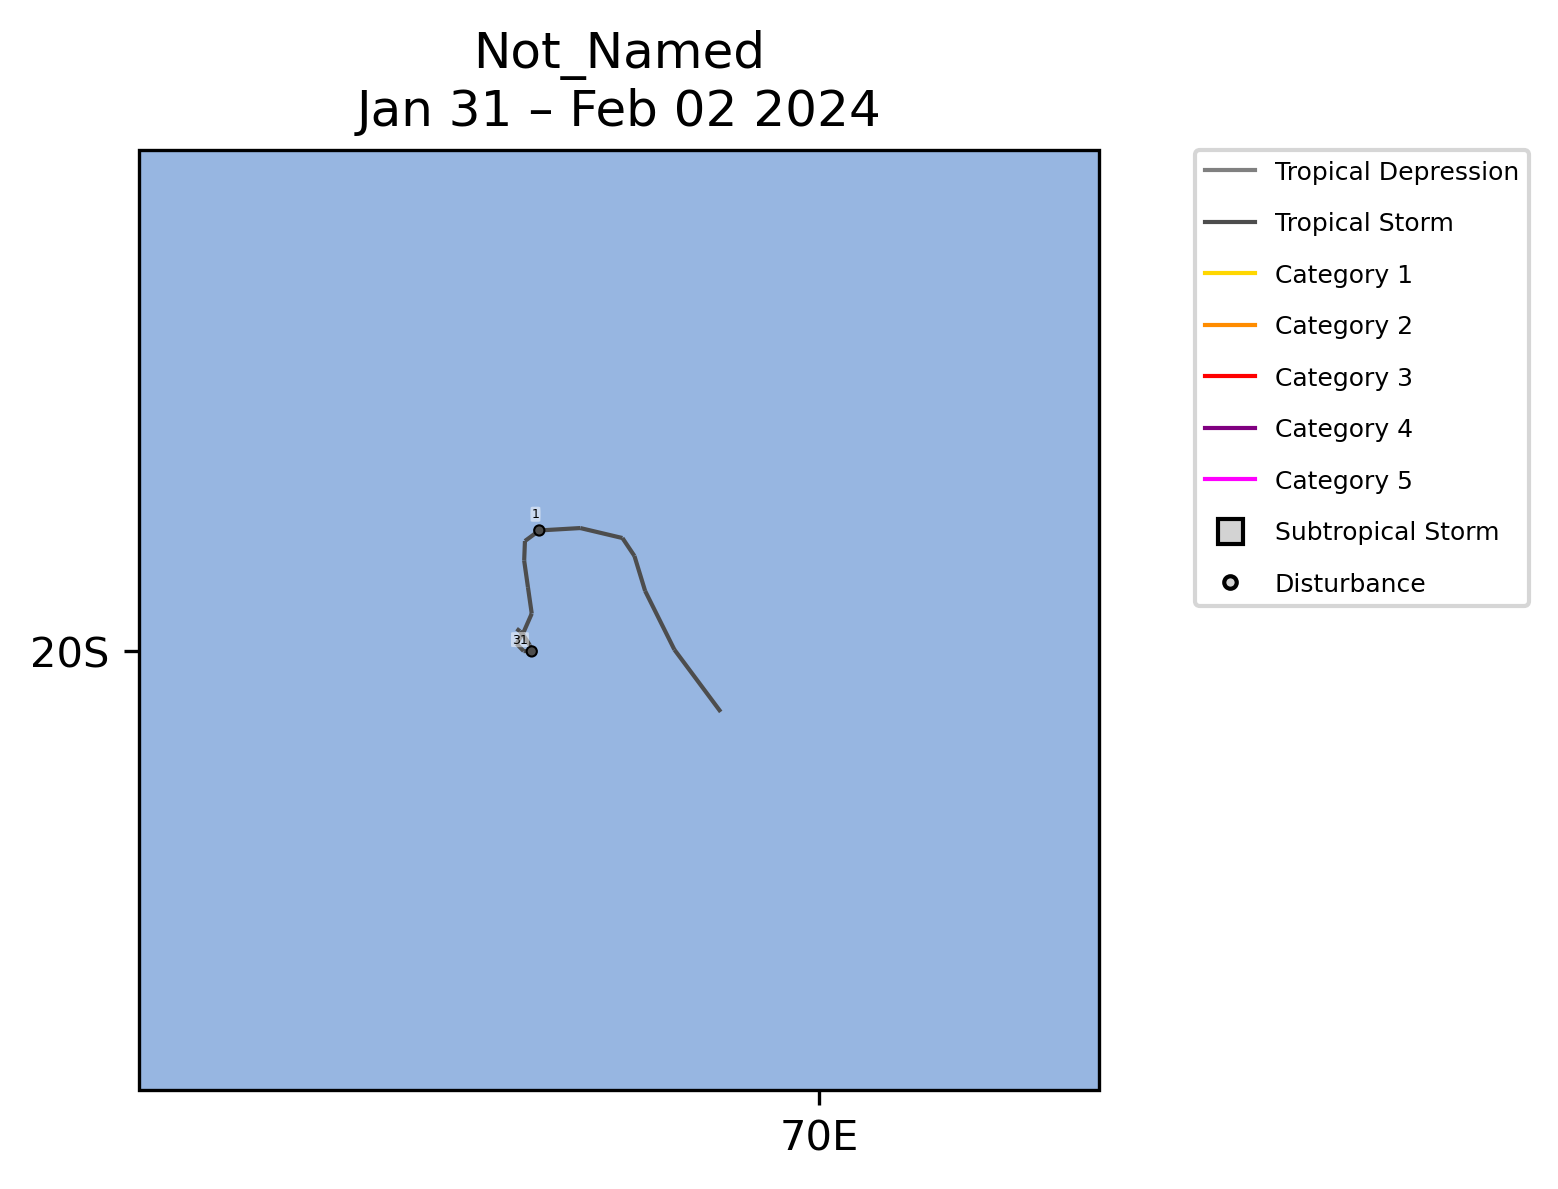
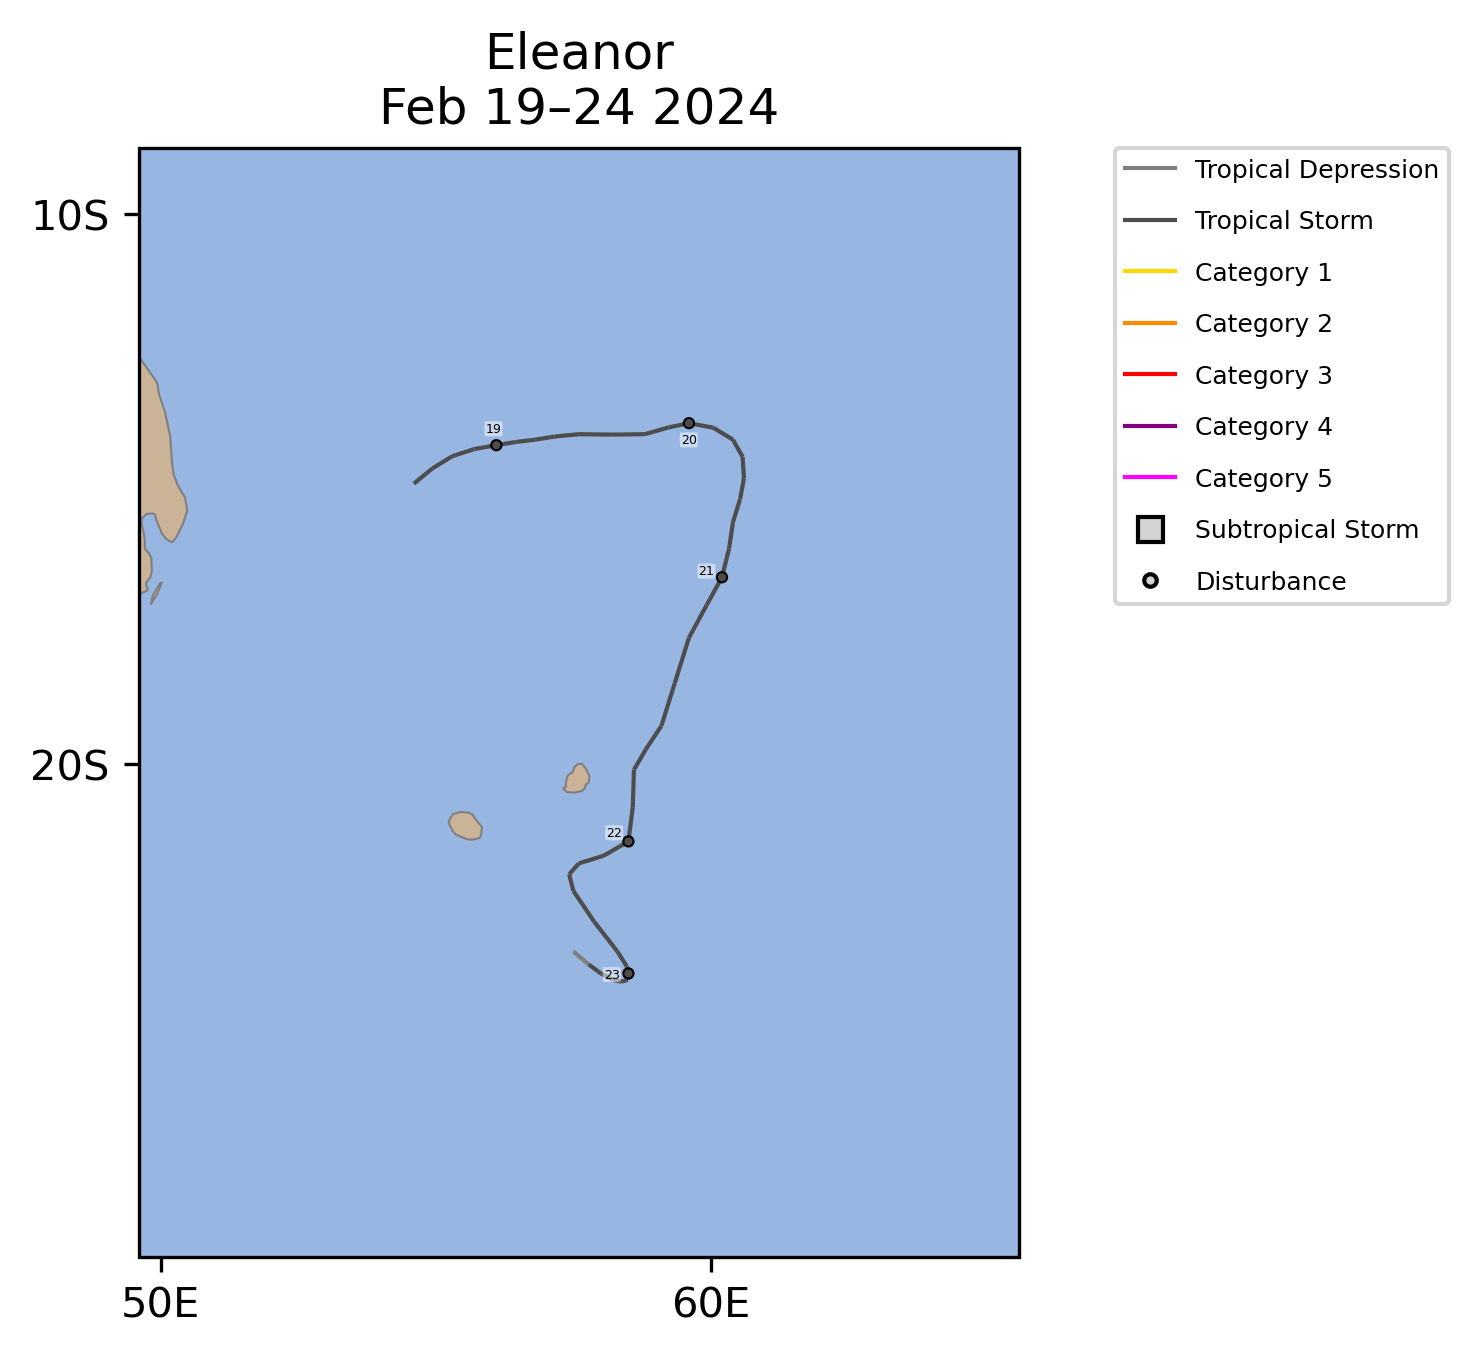
Two other storms occurred in the South Indian during February, an unnamed tropical storm in early February and Tropical Storm Eleanor, which peaked as a moderate strength tropical storm. Both of these systems remained away from major land areas and had minimal impacts.
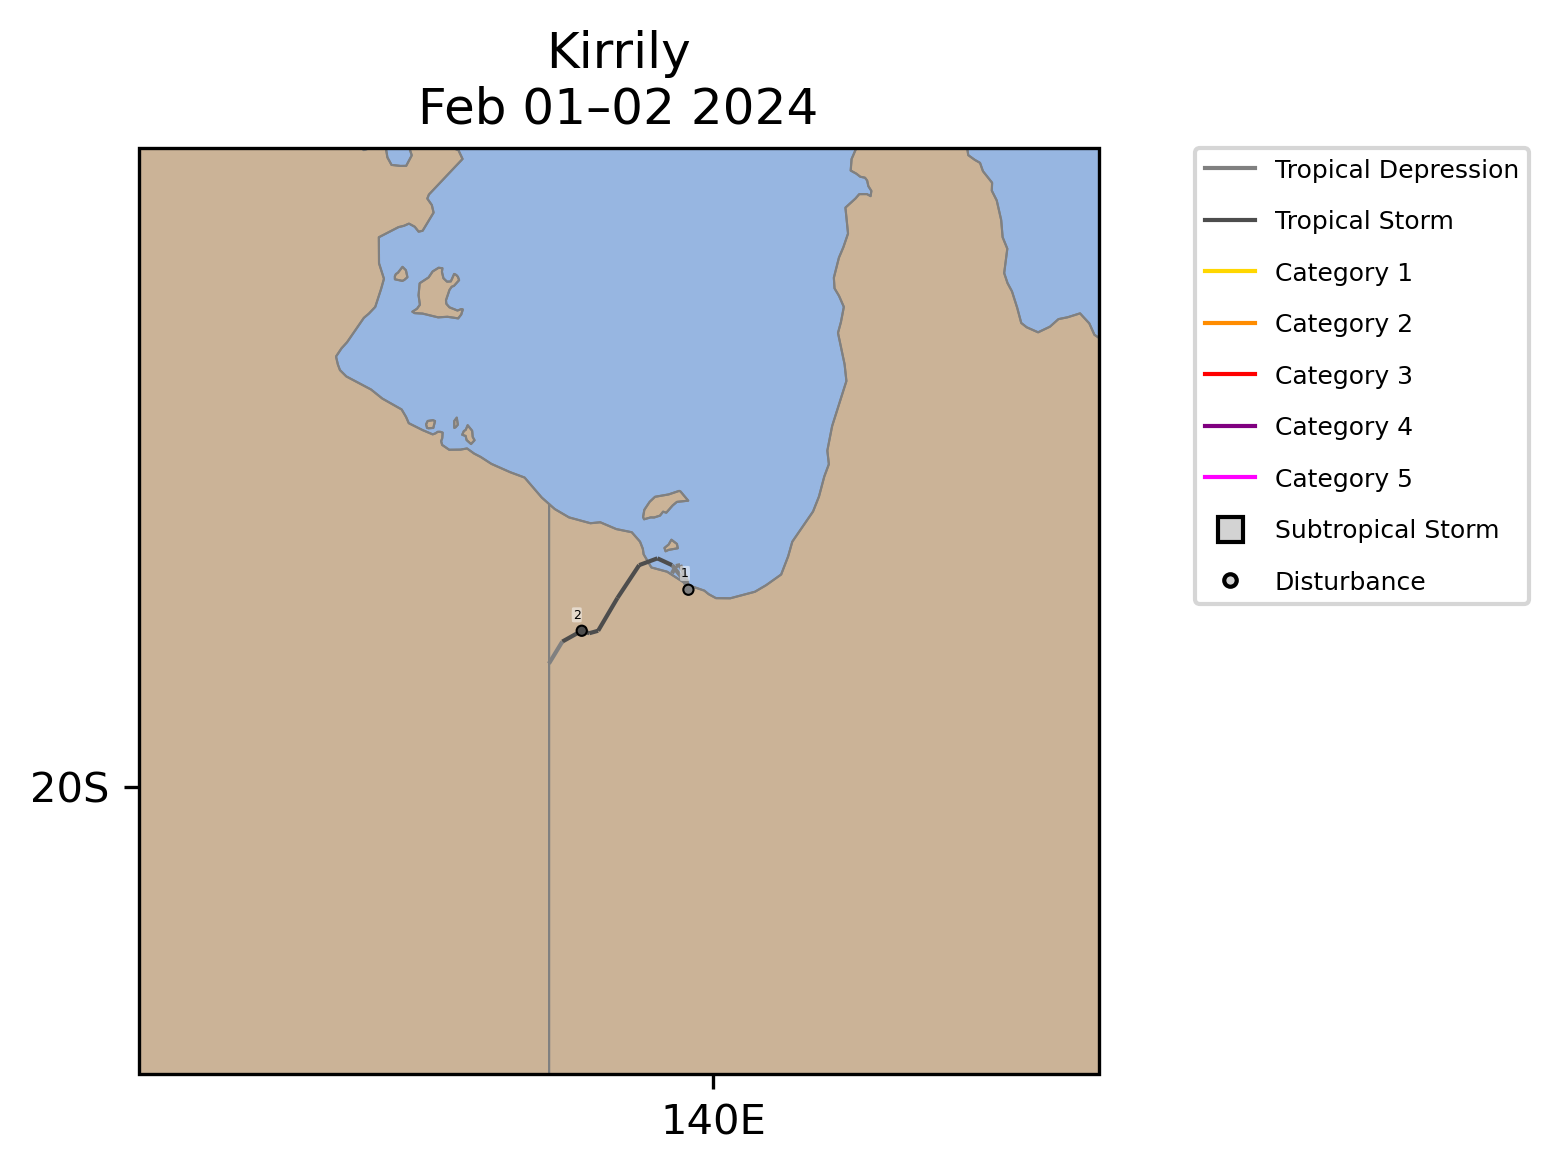
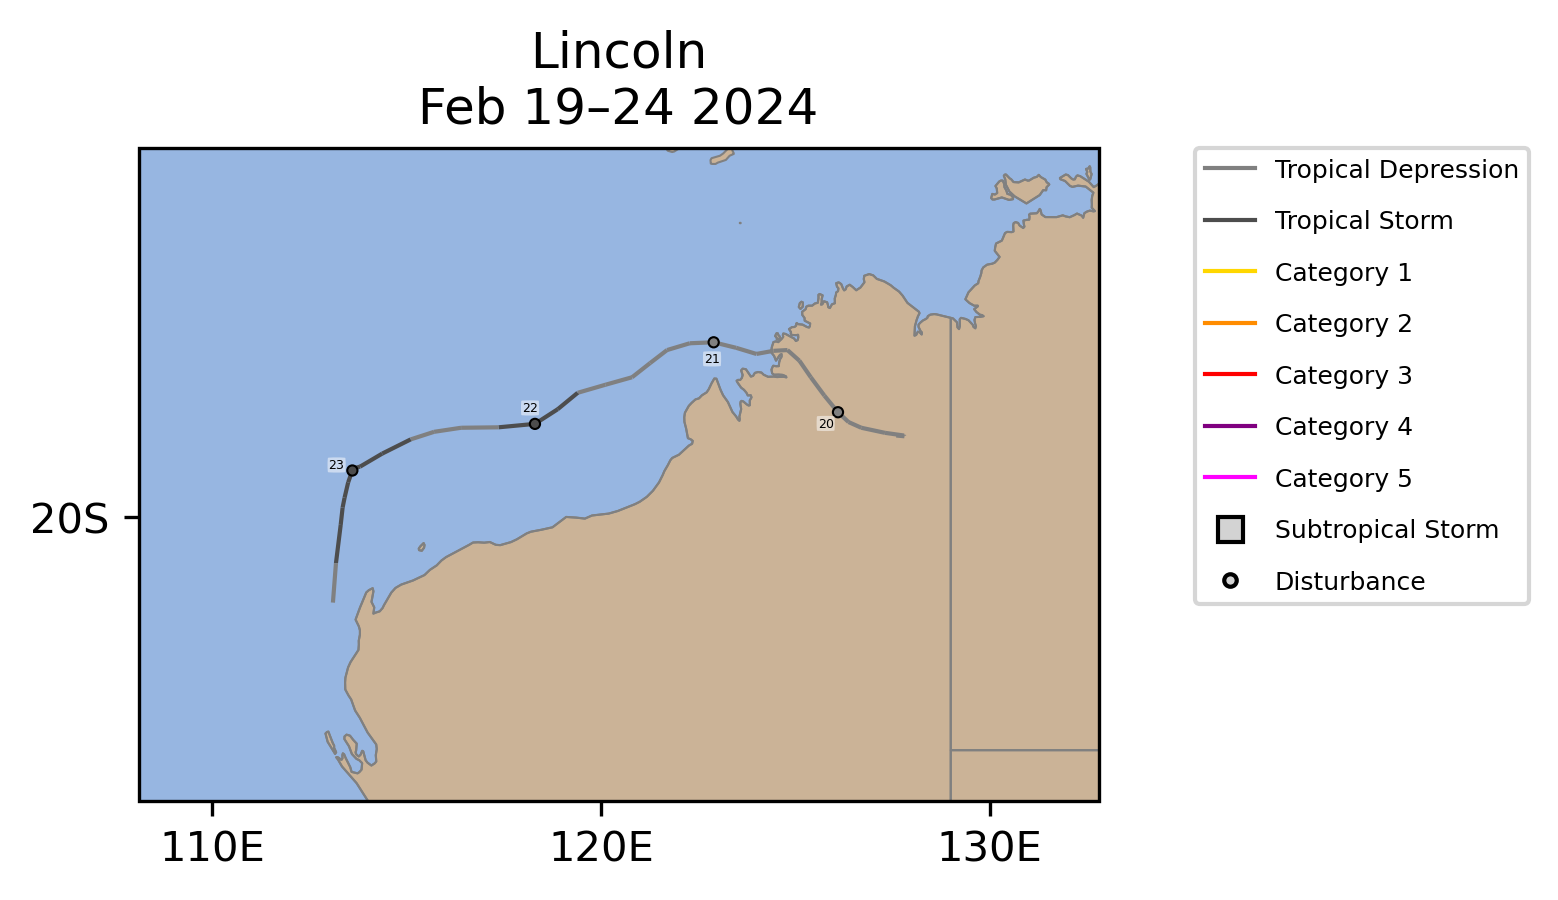
In the Australian region, two tropical storms (Tropical Storm Kirrily and Tropical Storm Lincoln) brought gusty winds and rains to parts of northern Australia. Tropical Cyclone Kirrily peaked with winds of 50 mph and a minimum central pressure of 991 mb over the Gulf of Carpentaria before making landfall. Tropical Storm Lincoln was a weak tropical storm which peaked with winds of 40 mph and a minimum central pressure of 991 mb. Lincoln produced rainfall and winds across northern and northwestern Australia.
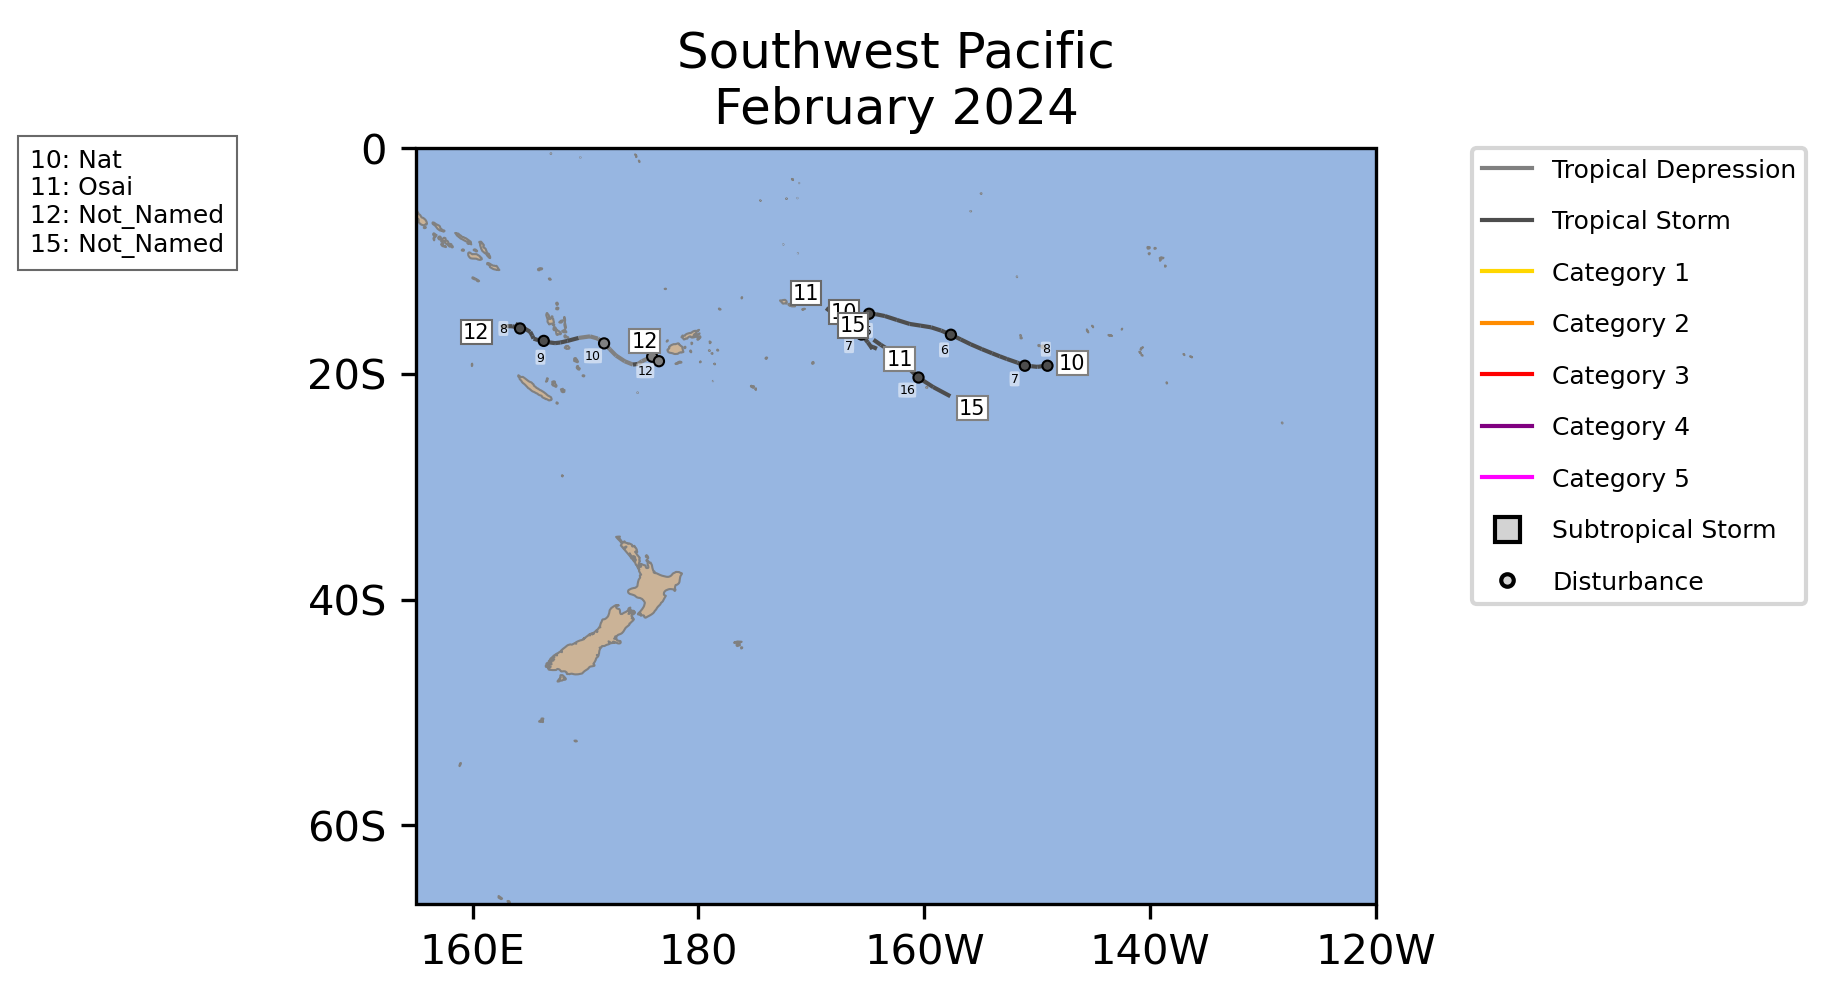
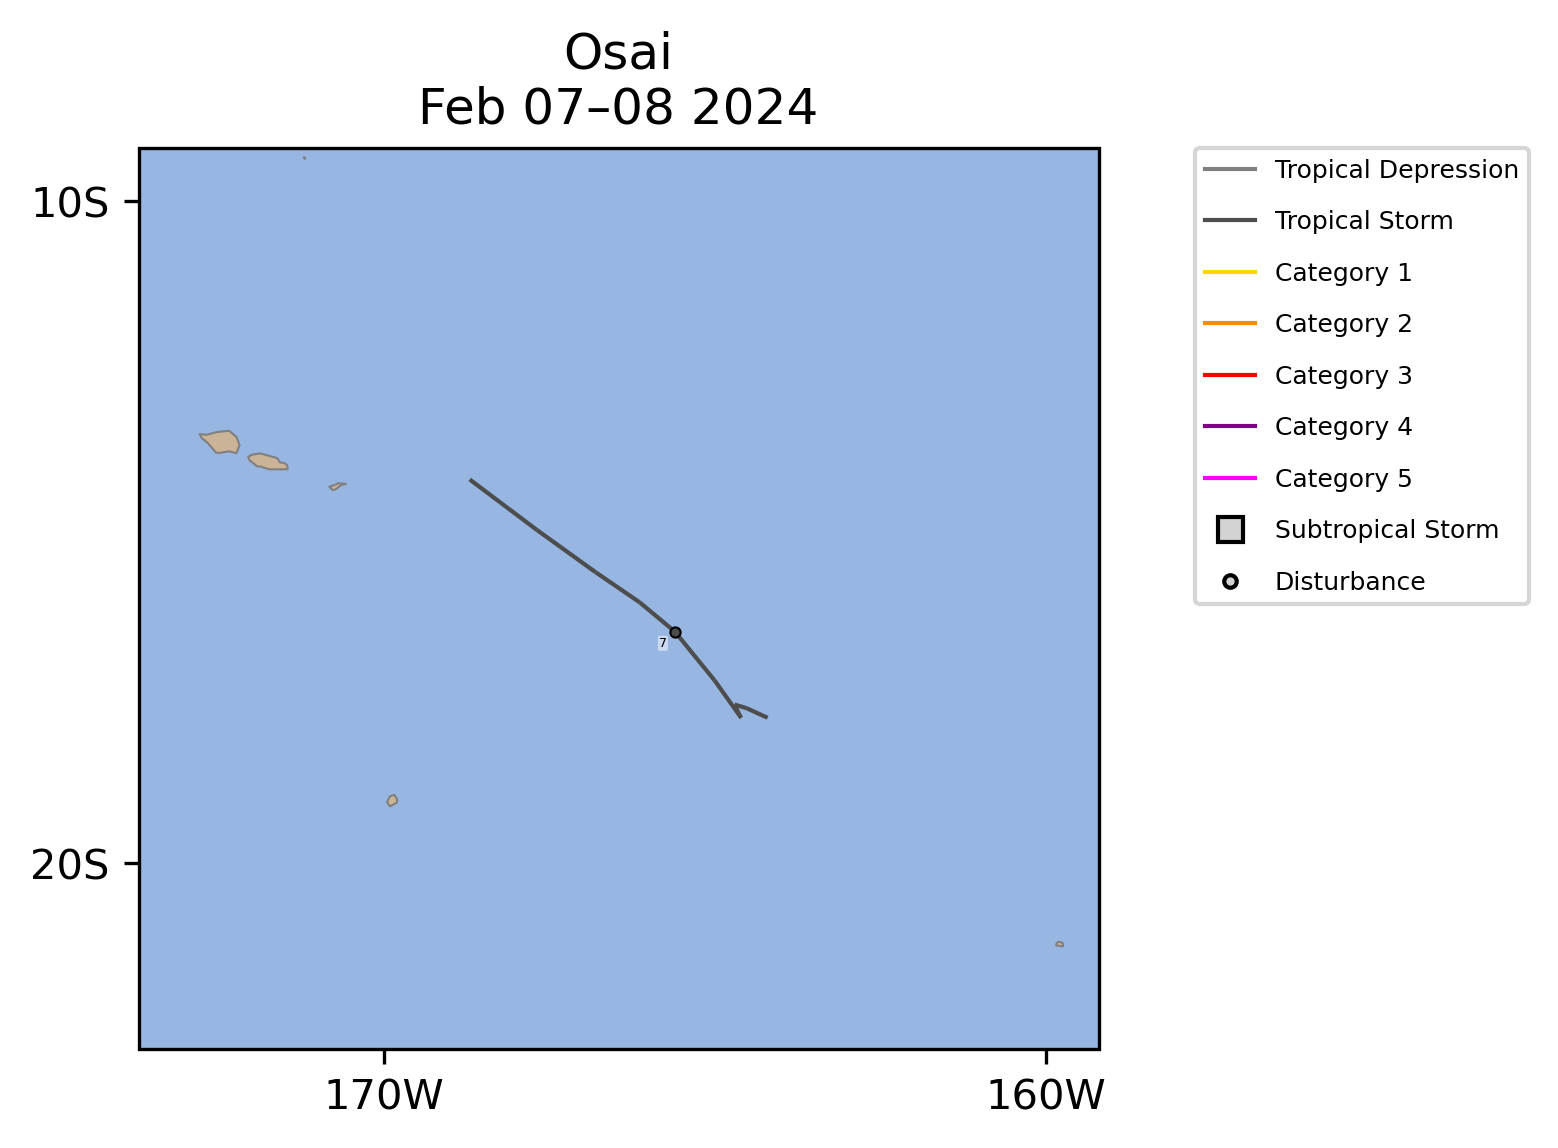
Elsewhere, in the southwest Pacific four tropical storms formed which is above the long term mean of two. These storms remained away from land and had minimal impacts. The strongest storm in the region was Tropical Storm Osai, which peaked as a moderate strength tropical storm with winds of 60 mph and a minimum central pressure of 993 mb.
One rare event occurred during February in the South Atlantic Ocean, where Tropical Storm Akará formed. Tropical cyclones are extremely rare in the South Atlantic Ocean due to unfavorable atmospheric conditions that typically prevent development. Akará peaked as a weak tropical storm with winds of 40 mph and a minimum central pressure of 1000 mb. Akará was the first tropical storm to occur in the South Atlantic since Iba in 2019.
No storms were active in the North Atlantic, East Pacific, North Indian, or West Pacific. The lack of activity is more typical for these basins during the month of February.
Data Description
The data in this report are derived from NCEI's IBTrACS dataset (Knapp et al. 2010; Schreck et al. 2014). IBTrACS tropical cyclone track and intensity data from agencies and sources around the globe. In this report, data from NOAA's National Hurricane Center (NHC) are used for the North Atlantic and East Pacific. The other basins use data from the U.S. Military's Joint Typhoon Warning Center (JTWC).
Historical values use the "best track" data that have been analyzed by forecasters after the season using all available data. Operational procedures and observing systems have changed with time and between regions, which makes these data heterogeneous. Intensity data are generally the most reliable since the early 1970s in the Atlantic (Landsea and Franklin 2013) and since the mid-1980s in other regions (Chu et al. 2002). The number of short-lived storms (≤2 days) has also increased since around 2000 due to improvements in observations and analysis techniques (Landsea et al. 2010).
Values for the current year are provisional values from the operational forecast advisories. IBTrACS obtains these from NCEP's TC Vitals, the NCAR Tropical Cyclone Guidance Project, and NHC provisional data. These values are subject to change during the post-season best track analysis. They also only include 6-hourly storm fixes, which means they may miss special advisories at landfall, peak intensity, etc.
The tropical cyclone seasons in the Southern Hemisphere begin in July and end in June, while the Northern Hemisphere seasons are counted from January to December. Storms are counted in all basins, months, and years in which they occur, which means some storms may appear more than once. However, the global totals only include each storm one time.
References
- Chu, J.-H., C. R. Sampson, A. S. Levine, and E. Fukada, 2002: The joint typhoon warning center tropical cyclone best-tracks, 1945–2000. Naval Research Laboratory, Reference Number NRL/MR/7540-02-16, 22 pp., https://www.metoc.navy.mil/jtwc/products/best-tracks/tc-bt-report.html.
- Knapp, K. R., M. C. Kruk, D. H. Levinson, H. J. Diamond, and C. J. Neumann, 2010: The International Best Track Archive for Climate Stewardship (IBTrACS). Bull. Amer. Meteor. Soc., 91, 363–376, https://doi.org/10.1175/2009BAMS2755.1.
- Landsea, C. W., and J. L. Franklin, 2013: Atlantic Hurricane database uncertainty and presentation of a new database format. Mon. Wea. Rev., 141, 3576–3592, https://doi.org/10.1175/MWR-D-12-00254.1.
- ——, G. A. Vecchi, L. Bengtsson, and T. R. Knutson, 2010: Impact of duration thresholds on Atlantic tropical cyclone counts. J. Climate, 23, 2508–2519, https://doi.org/10.1175/2009JCLI3034.1.
- Schreck, C. J., K. R. Knapp, and J. P. Kossin, 2014: The Impact of Best Track Discrepancies on Global Tropical Cyclone Climatologies using IBTrACS. Mon. Wea. Rev., 142, 3881–3899, https://doi.org/10.1175/MWR-D-14-00021.1.