Note: This report catalogs recent tropical cyclones across the North Atlantic and East Pacific and places each basin’s tropical cyclone activity in a climate-scale context. It is not updated in real time. Users seeking the real time status and forecasts of tropical cyclones should visit The National Hurricane Center.
East North Pacific Basin
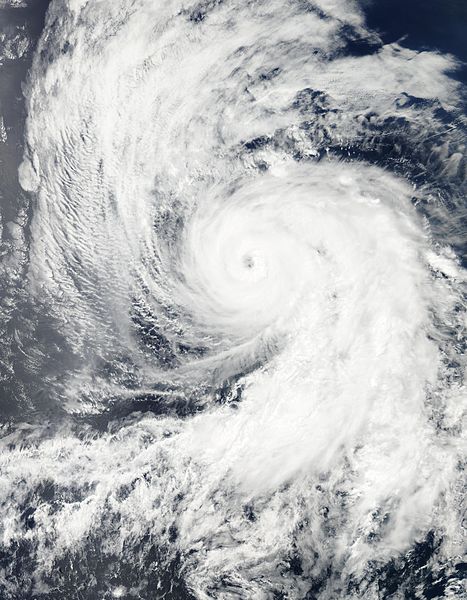 Tropical Storm Daniel Satellite Image |
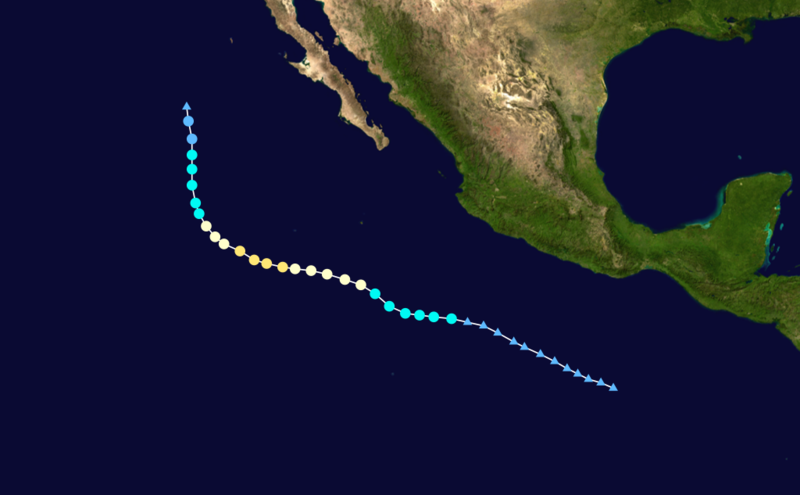
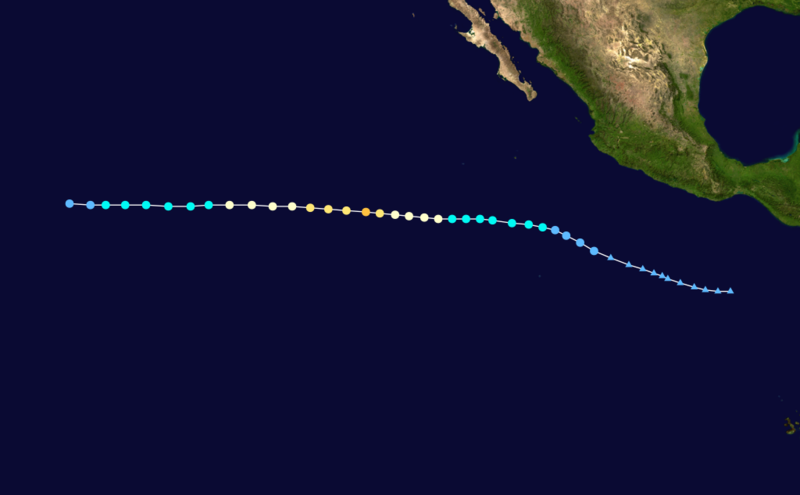 Tropical Storm Daniel Forecast Track  Saffir-Simpson Scale Color Legend |
| Tropical Cyclone | Daniel | ||||||||
| Cyclogenesis Date | 07/05 | ||||||||
| Cyclolysis Date | 07/11 | ||||||||
| Highest Saffir-Simpson Category | Cat 2 | ||||||||
| Maximum 6-hr Sustained Wind | 109 mph (95 kt or 176 km/h) | ||||||||
| Min Pressure | 961 mbar | ||||||||
| Accumulated Cyclone Energy (ACE*) Index (kt2) | 11.1050 x 10⁴ | ||||||||
| Landfall Information (date, location and sustained winds) | |||||||||
| Deaths | |||||||||
| *The (ACE) Index calculations are based on preliminary data. | |||||||||
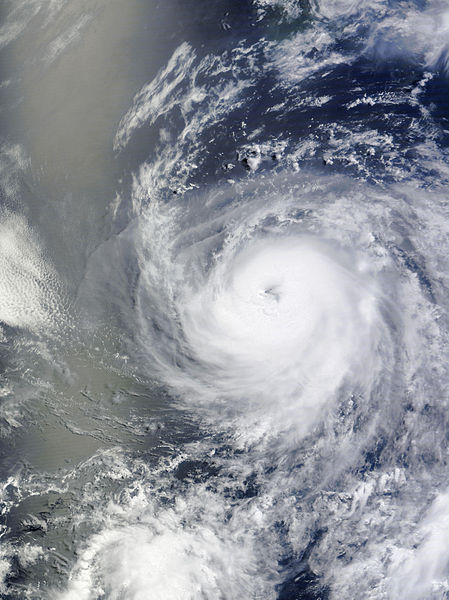
 Tropical Storm Emilia Satellite Image |
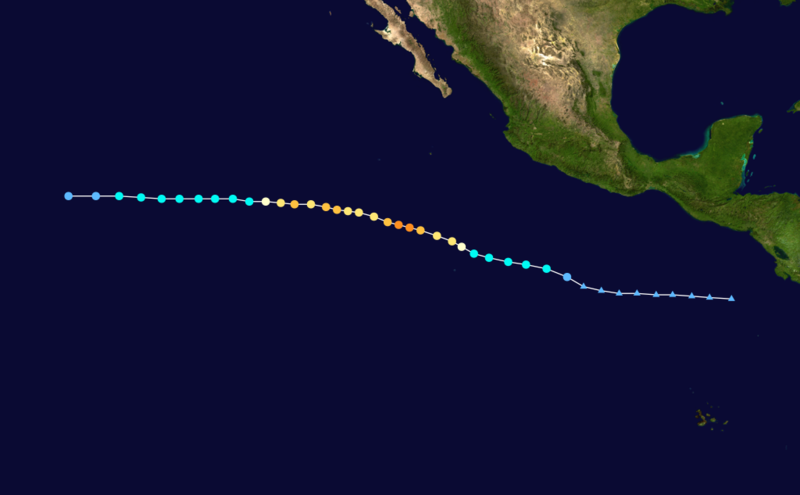 Tropical Storm Emilia Forecast Track Saffir-Simpson Scale Color Legend |
| Tropical Cyclone | Emilia | ||||||||
| Cyclogenesis Date | 07/08 | ||||||||
| Cyclolysis Date | 07/15 | ||||||||
| Highest Saffir-Simpson Category | Cat 4 | ||||||||
| Maximum 6-hr Sustained Wind | 132 mph (115 kt or 213 km/h) | ||||||||
| Min Pressure | 945 mbar | ||||||||
| Accumulated Cyclone Energy (ACE*) Index (kt2) | 17.9850 x 10⁴ | ||||||||
| Landfall Information (date, location and sustained winds) | |||||||||
| Deaths | |||||||||
| *The (ACE) Index calculations are based on preliminary data. | |||||||||
 Tropical Storm Fabio Satellite Image |
 Tropical Storm Fabio Forecast Track Saffir-Simpson Scale Color Legend |
| Tropical Cyclone | Fabio | ||||||||
| Cyclogenesis Date | 07/12 | ||||||||
| Cyclolysis Date | 07/17 | ||||||||
| Highest Saffir-Simpson Category | Cat 2 | ||||||||
| Maximum 6-hr Sustained Wind | 104 mph (90 kt or 167 km/h) | ||||||||
| Min Pressure | 972 mbar | ||||||||
| Accumulated Cyclone Energy (ACE*) Index (kt2) | 10.0050 x 10⁴ | ||||||||
| Landfall Information (date, location and sustained winds) | |||||||||
| Deaths | |||||||||
| *The (ACE) Index calculations are based on preliminary data. | |||||||||
West North Pacific Basin
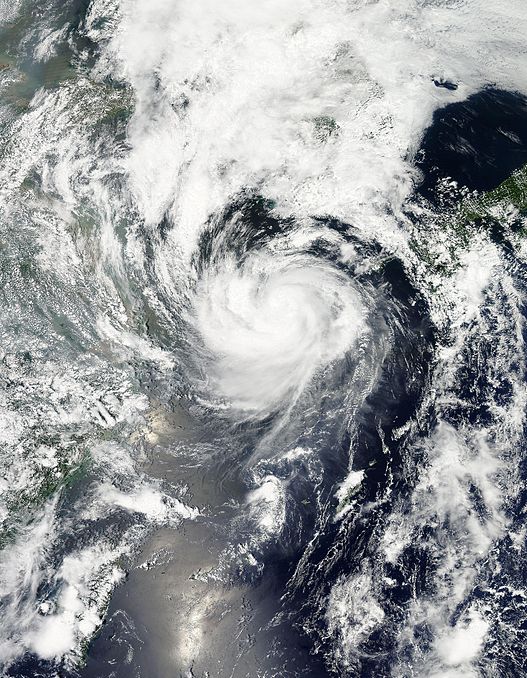 Tropical Storm Khanun Satellite Image |
 Tropical Storm Khanun Forecast Track Saffir-Simpson Scale Color Legend |
| Tropical Cyclone | Khanun(Enteng) | ||||||||
| Cyclogenesis Date | 07/16 | ||||||||
| Cyclolysis Date | 07/18 | ||||||||
| Highest Saffir-Simpson Category | TS | ||||||||
| Maximum 6-hr Sustained Wind | 58 mph (50 kt or 93 km/h) | ||||||||
| Min Pressure | 985 mbar | ||||||||
| Accumulated Cyclone Energy (ACE*) Index (kt2) | 1.9700 x 10⁴ | ||||||||
| Landfall Information (date, location and sustained winds) | |||||||||
| Deaths | 89 | ||||||||
| *The (ACE) Index calculations are based on preliminary data. | |||||||||
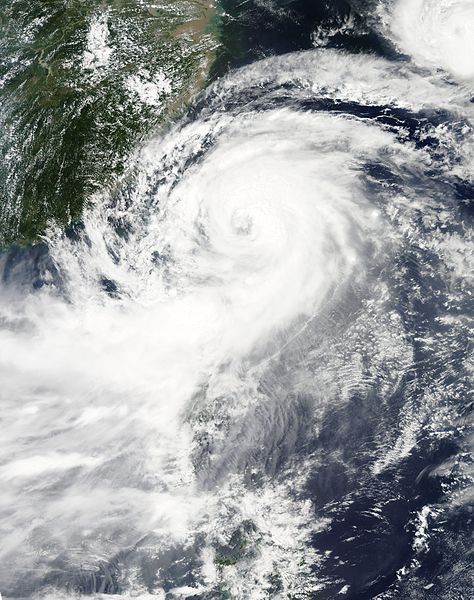
 Tropical Storm Vicente Satellite Image |
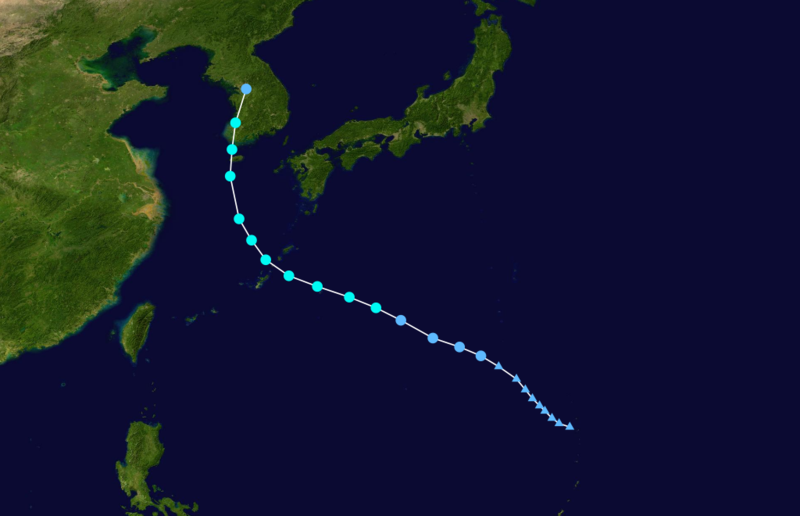
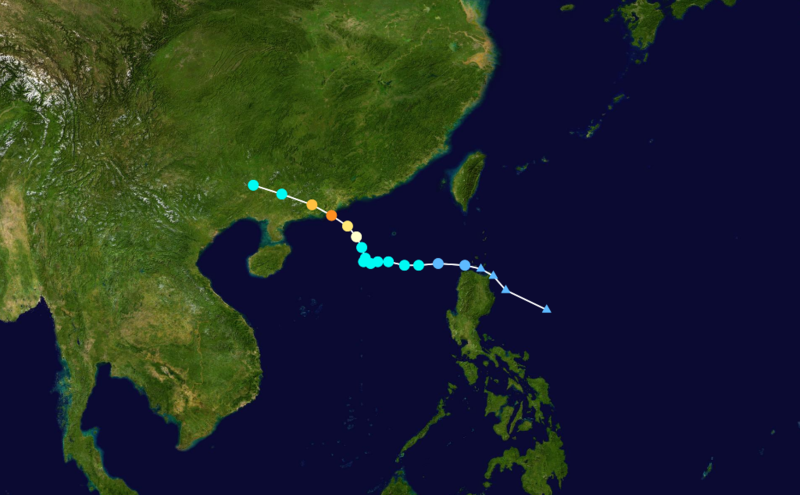 Tropical Storm Vicente Forecast Track Saffir-Simpson Scale Color Legend |
| Tropical Cyclone | Vicente(Ferdie) | ||||||||
| Cyclogenesis Date | 07/21 | ||||||||
| Cyclolysis Date | 07/25 | ||||||||
| Highest Saffir-Simpson Category | Cat 4 | ||||||||
| Maximum 6-hr Sustained Wind | 138 mph (120 kt or 222 km/h) | ||||||||
| Min Pressure | 950 mbar | ||||||||
| Accumulated Cyclone Energy (ACE*) Index (kt2) | 6.4775 x 10⁴ | ||||||||
| Landfall Information (date, location and sustained winds) | 07/23 - Guangdong, China (120 kt or 222 km/h) | ||||||||
| Deaths | 22 | ||||||||
| *The (ACE) Index calculations are based on preliminary data. | |||||||||
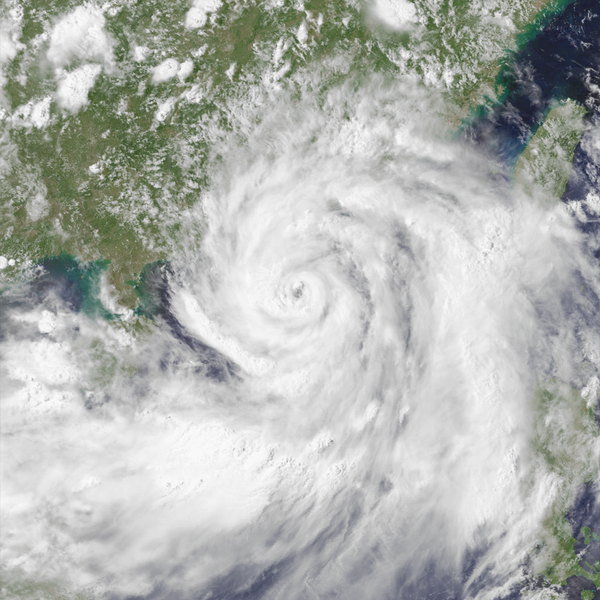
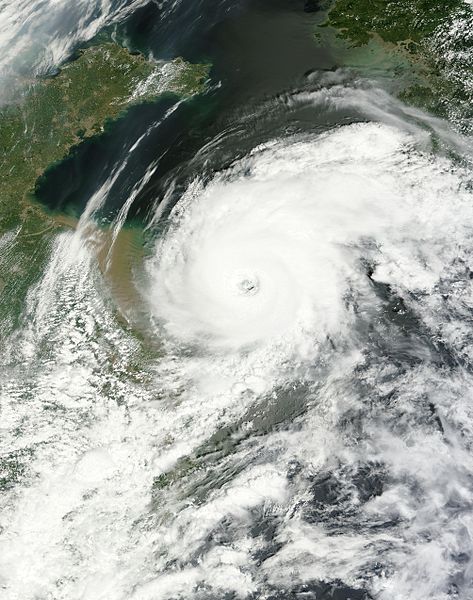
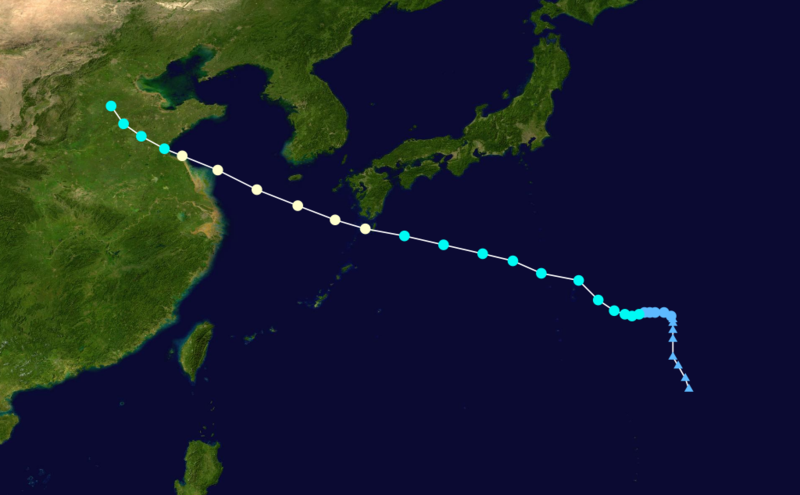
 Tropical Storm Saola Satellite Image |
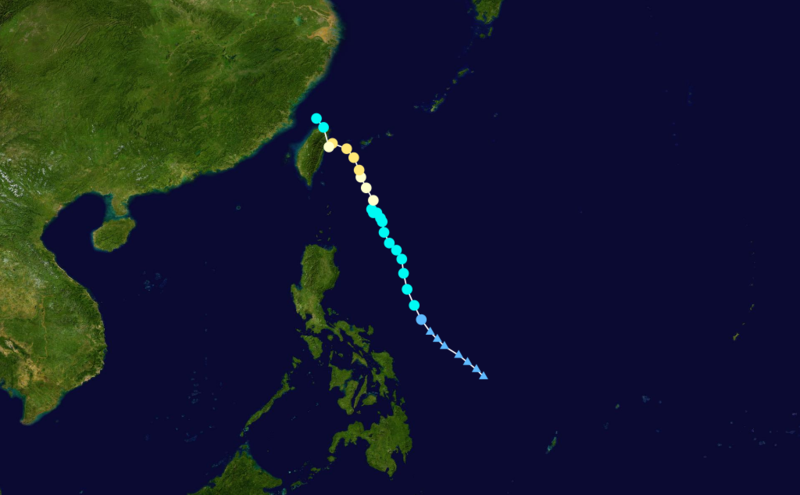 Tropical Storm Saola Forecast Track Saffir-Simpson Scale Color Legend |
| Tropical Cyclone | Saola(Gener) | ||||||||
| Cyclogenesis Date | 07/28 | ||||||||
| Cyclolysis Date | 08/03 | ||||||||
| Highest Saffir-Simpson Category | Cat 2 | ||||||||
| Maximum 6-hr Sustained Wind | 104 mph (90 kt or 167 km/h) | ||||||||
| Min Pressure | 960 mbar | ||||||||
| Accumulated Cyclone Energy (ACE*) Index (kt2) | 8.9600 x 10⁴ | ||||||||
| Landfall Information (date, location and sustained winds) | 08/01 - Taiwan (85 kt or 157 km/h) | ||||||||
| Deaths | 45 | ||||||||
| *The (ACE) Index calculations are based on preliminary data. | |||||||||
 Tropical Storm Damrey Satellite Image |
 Tropical Storm Damrey Forecast Track Saffir-Simpson Scale Color Legend |
| Tropical Cyclone | Damrey | ||||||||
| Cyclogenesis Date | 07/29 | ||||||||
| Cyclolysis Date | 08/03 | ||||||||
| Highest Saffir-Simpson Category | Cat 1 | ||||||||
| Maximum 6-hr Sustained Wind | 86 mph (75 kt or 139 km/h) | ||||||||
| Min Pressure | 970 mbar | ||||||||
| Accumulated Cyclone Energy (ACE*) Index (kt2) | 5.8100 x 10⁴> | ||||||||
| Landfall Information (date, location and sustained winds) | 08/02 - Xiangshui County, China (65 kt or 120 km/h) | ||||||||
| Deaths | 4 | ||||||||
| *The (ACE) Index calculations are based on preliminary data. | |||||||||