Use the form below to select from a collection of monthly summaries recapping climate-related occurrences on both a global and national scale.
Tropical Cyclones ReportAnnual 2022

Summary
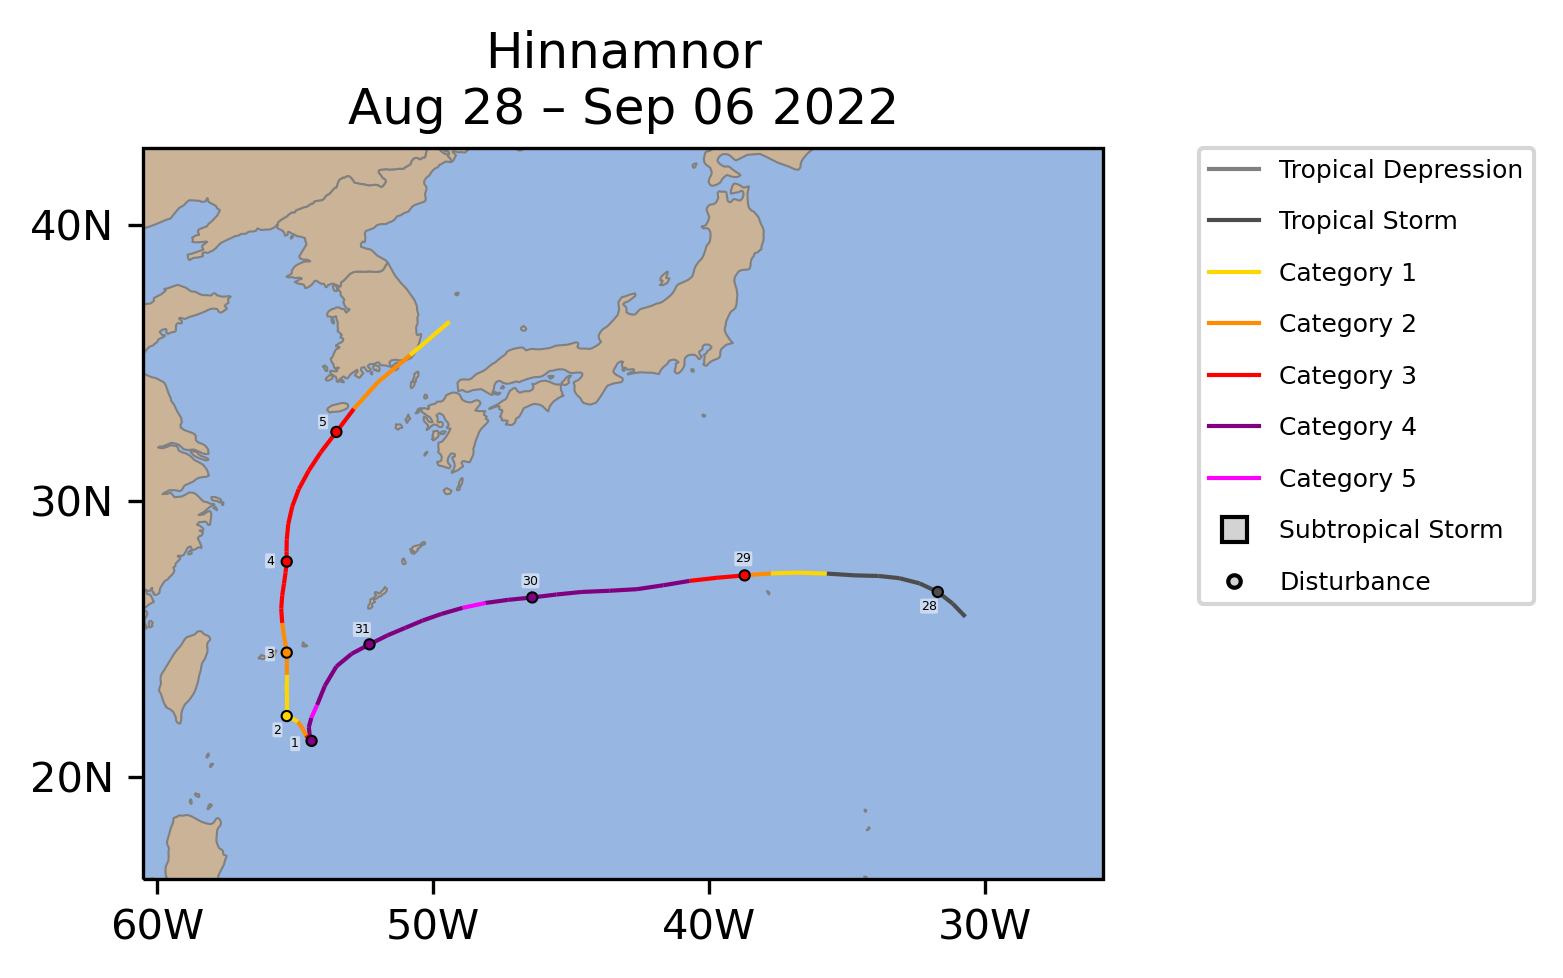
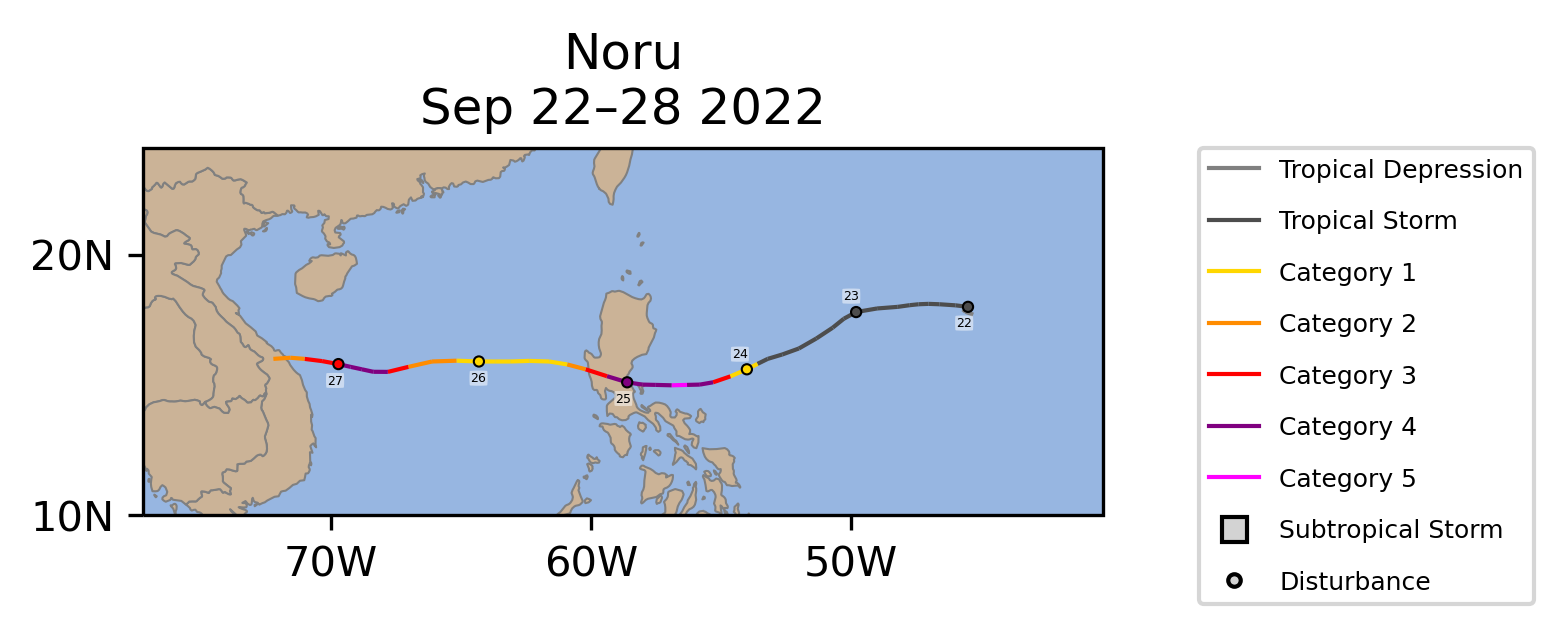
A total of 88 named storms occurred across the globe in 2022, which was near the 1991-2020 average. Of those, 40 reached tropical cyclone strength (≥74 mph), and 17 reached major tropical cyclone strength (≥111 mph). Both of these counts were below their 1991-2020 averages. The global accumulated cyclone energy (ACE: an integrated metric of the strength, frequency, and duration of tropical storms) was the lowest since 2010 and the fourth lowest since 1981. No basin was more active than normal in terms of ACE. The North Atlantic, East Pacific, and South Indian basins had near normal activity. The other basins were all less active than normal, including the West Pacific, which had its third season in a row with below normal activity. The only two storms to reach Saffir-Simpson hurricane wind scale category 5 (≥157 mph) during 2022 were both from the West Pacific: Super Typhoons Hinnamnor and Noru. This was the fewest number of category 5 storms globally since 2008.
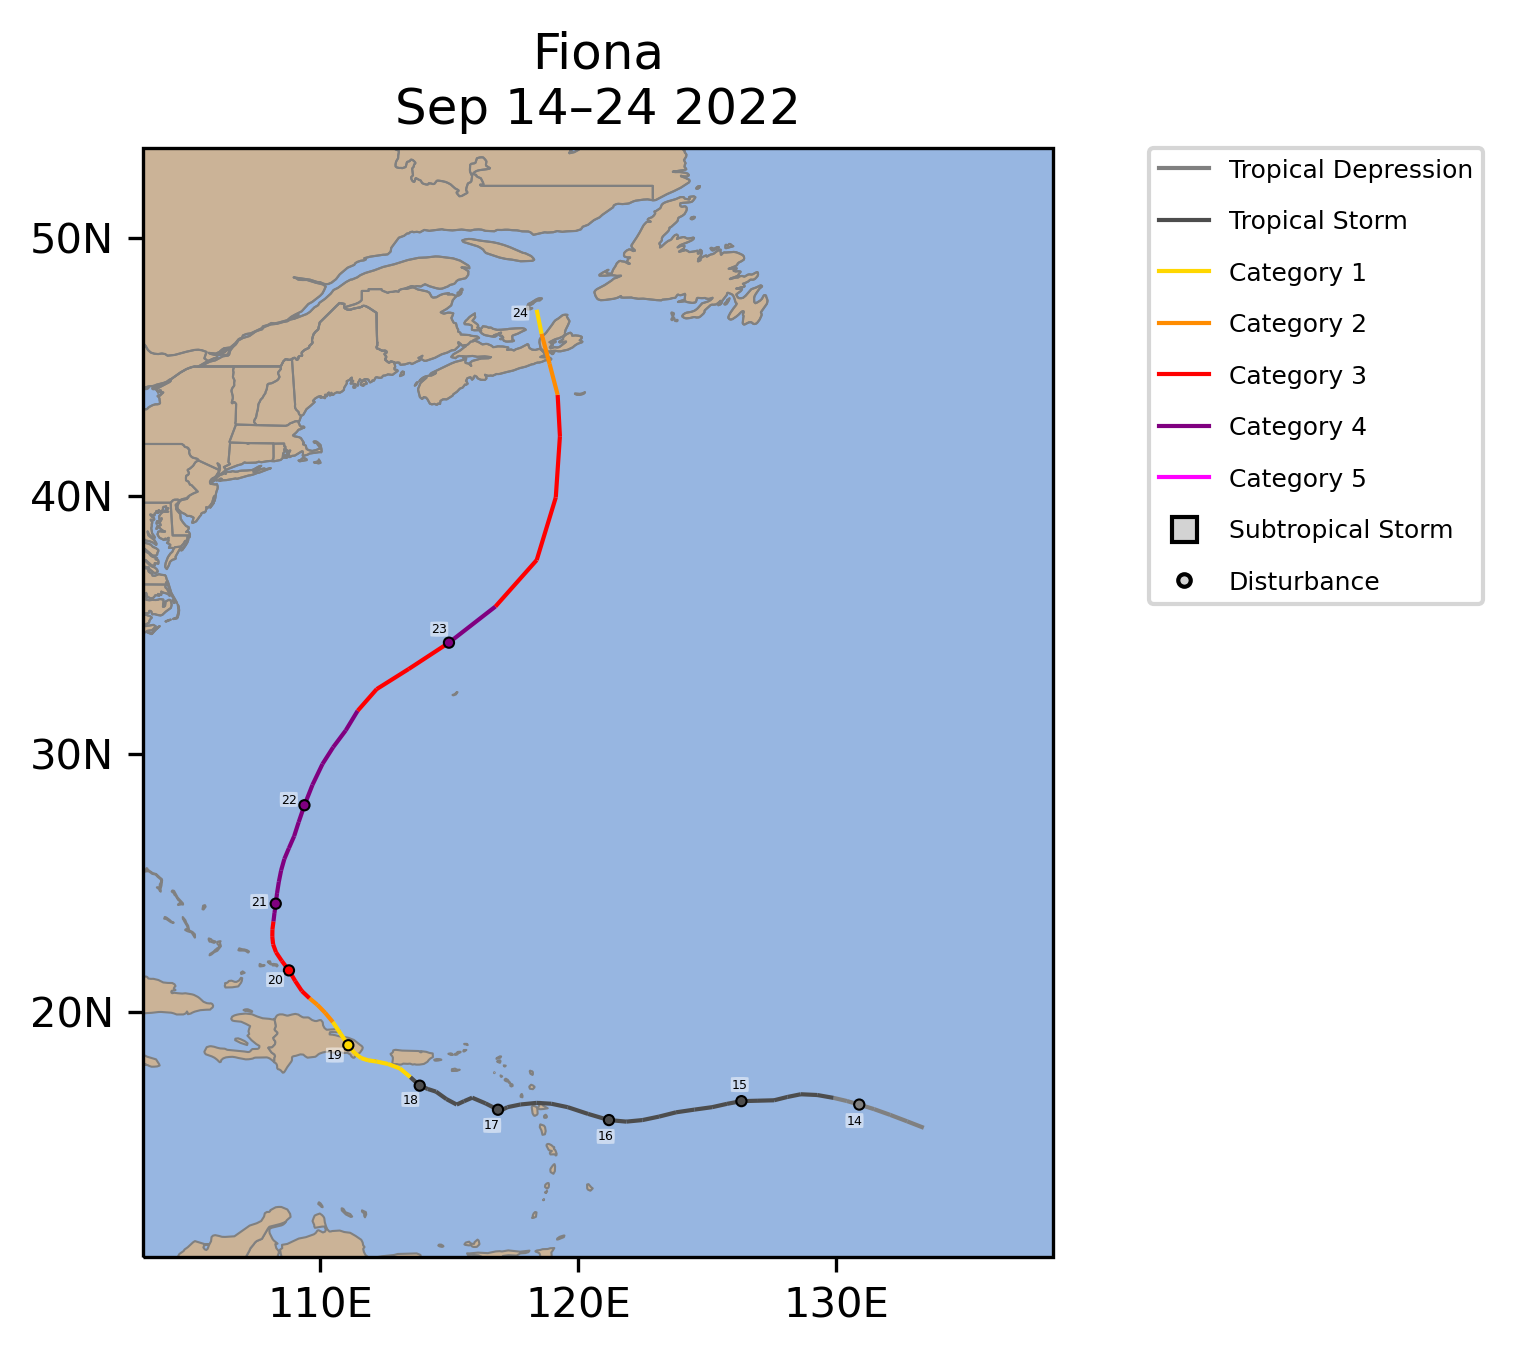
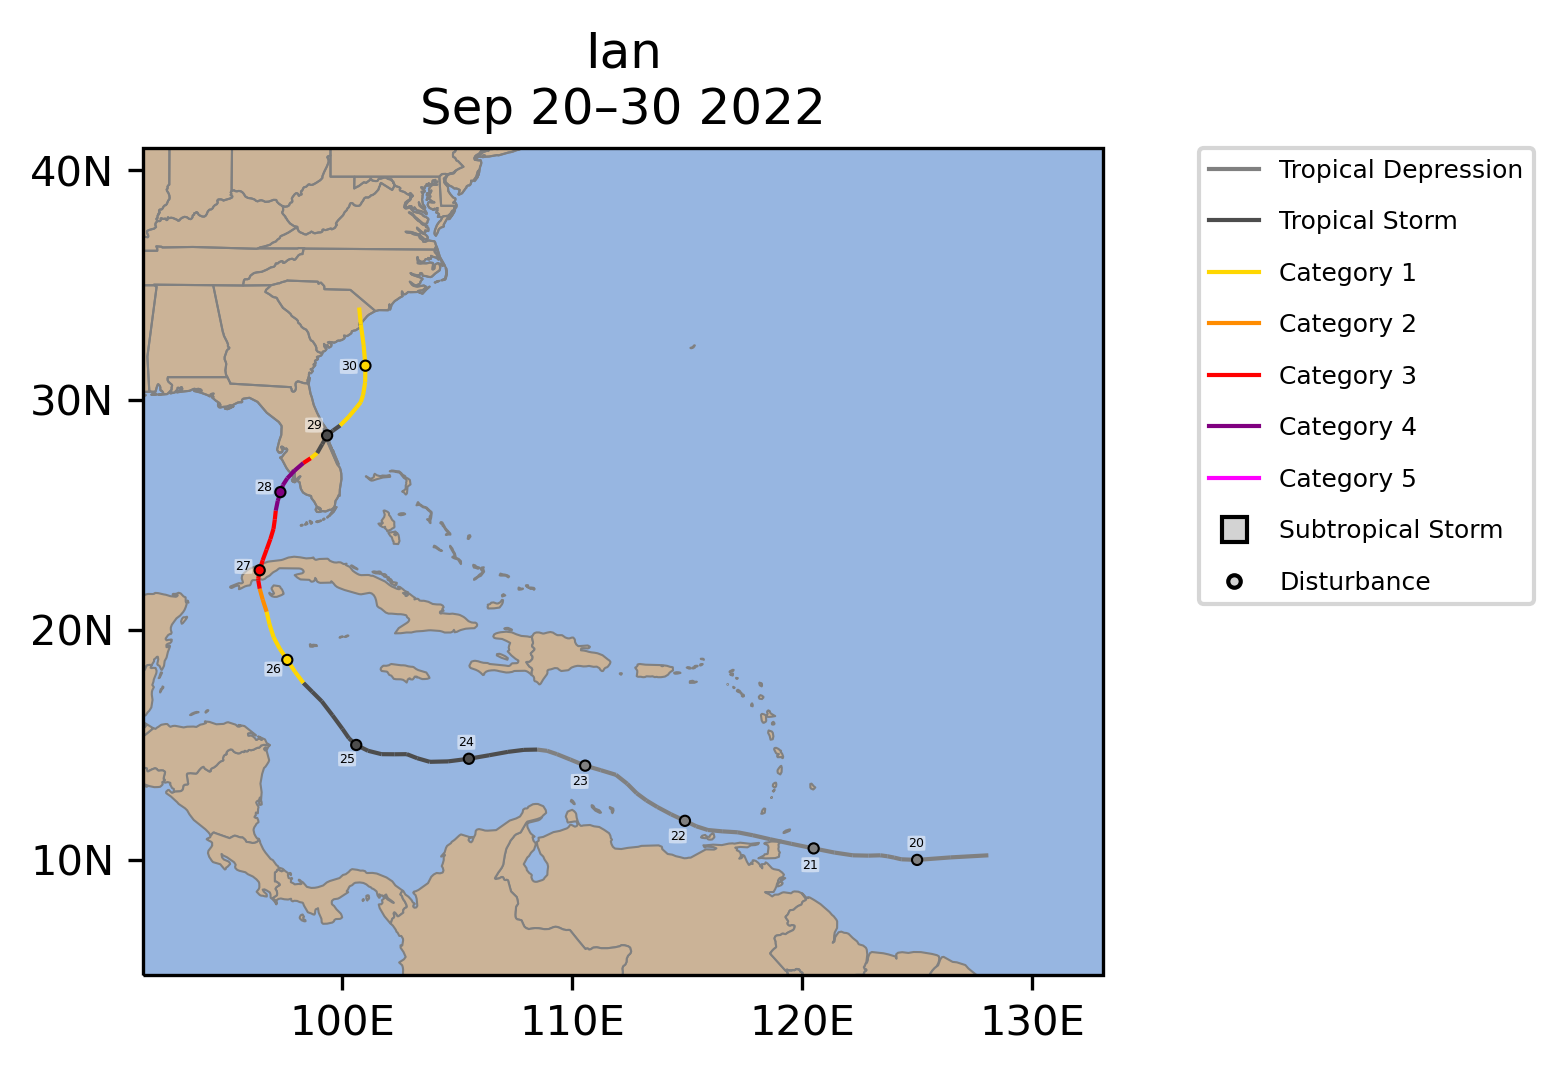
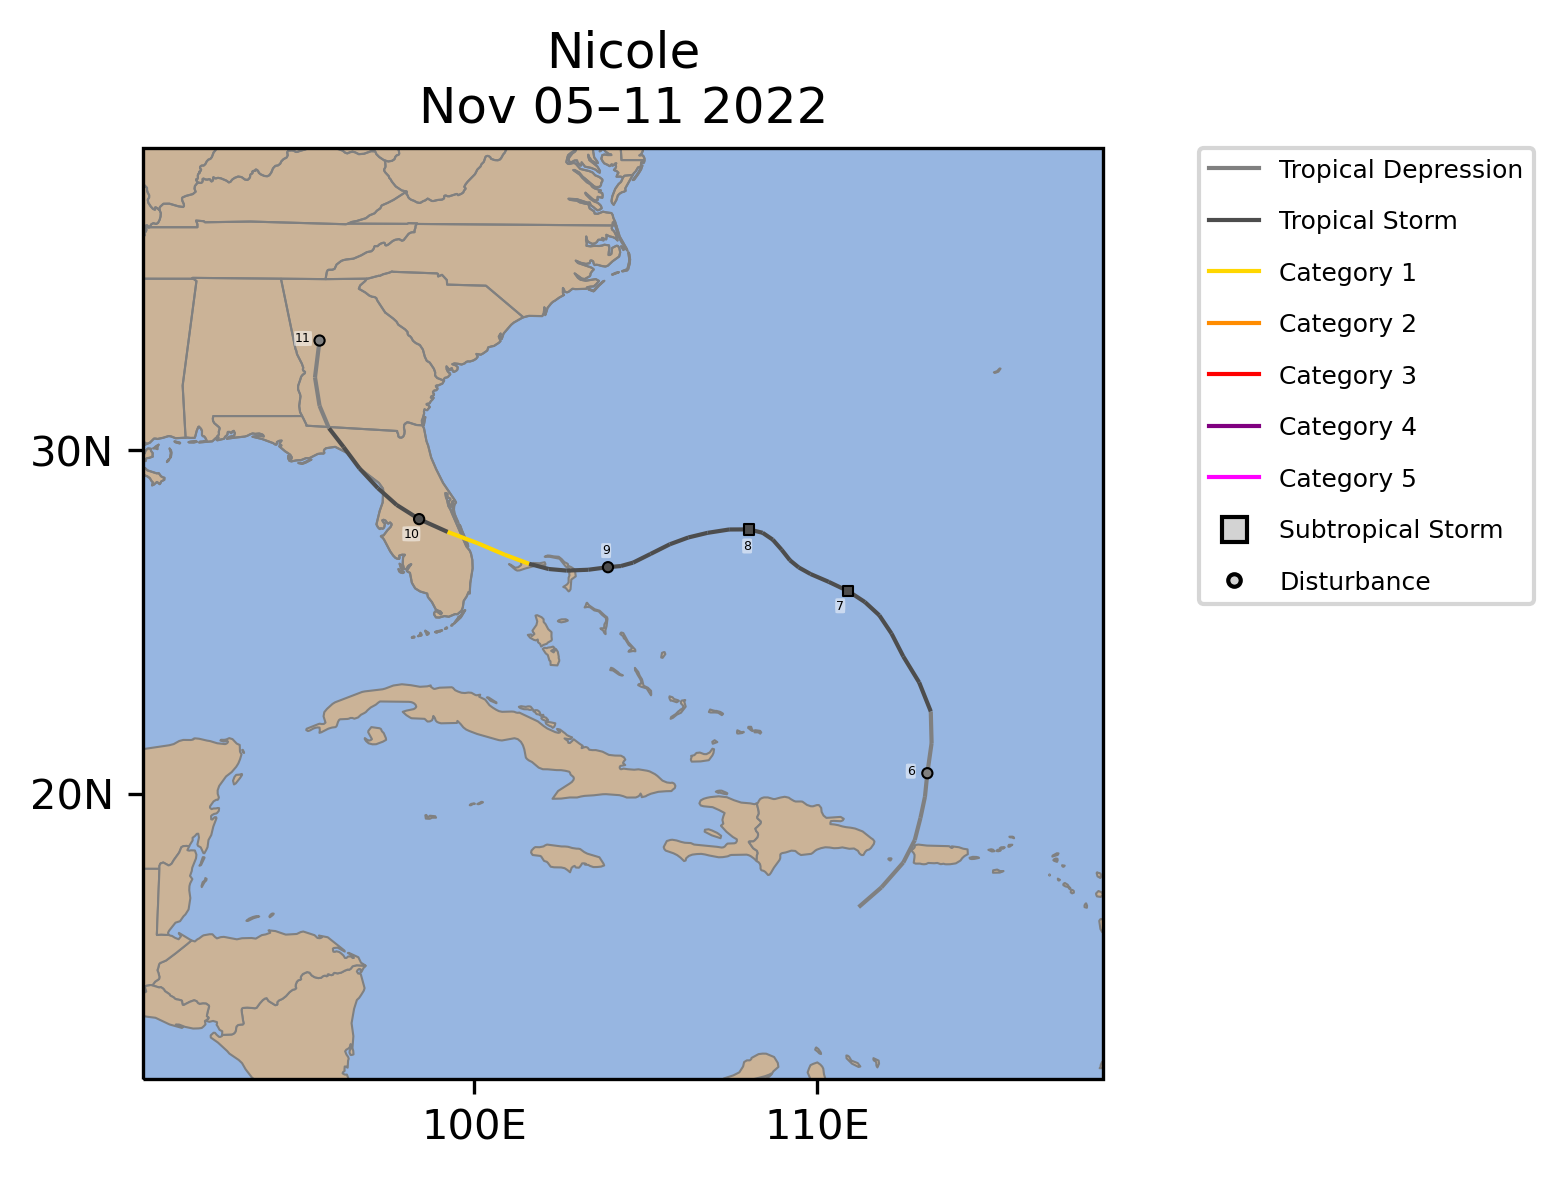
The North Atlantic hurricane activity was near its 1991-2020 average. However, both the 14 named storms and the ACE were their lowest values since 2015. Hurricane Fiona brought massive flooding to Puerto Rico, with some areas receiving 12-18 inches of rain. One station reported more than two feet of rain in a 24-hour period. After its extratropical transition, Fiona ultimately made landfall in Nova Scotia as the strongest and costliest post-tropical cyclone on record for Canada. Hurricane Ian made landfall in southwestern Florida shortly after achieving a peak intensity of 155 mph, just shy of category 5 strength (≥157 mph). Ian was the third costliest U.S. hurricane on record behind Katrina and Harvey. Just a few weeks later, Hurricane Nicole made landfall in eastern Florida with heavy rain and flooding. Nicole was the first hurricane to make landfall in Florida during November since Kate in 1985.
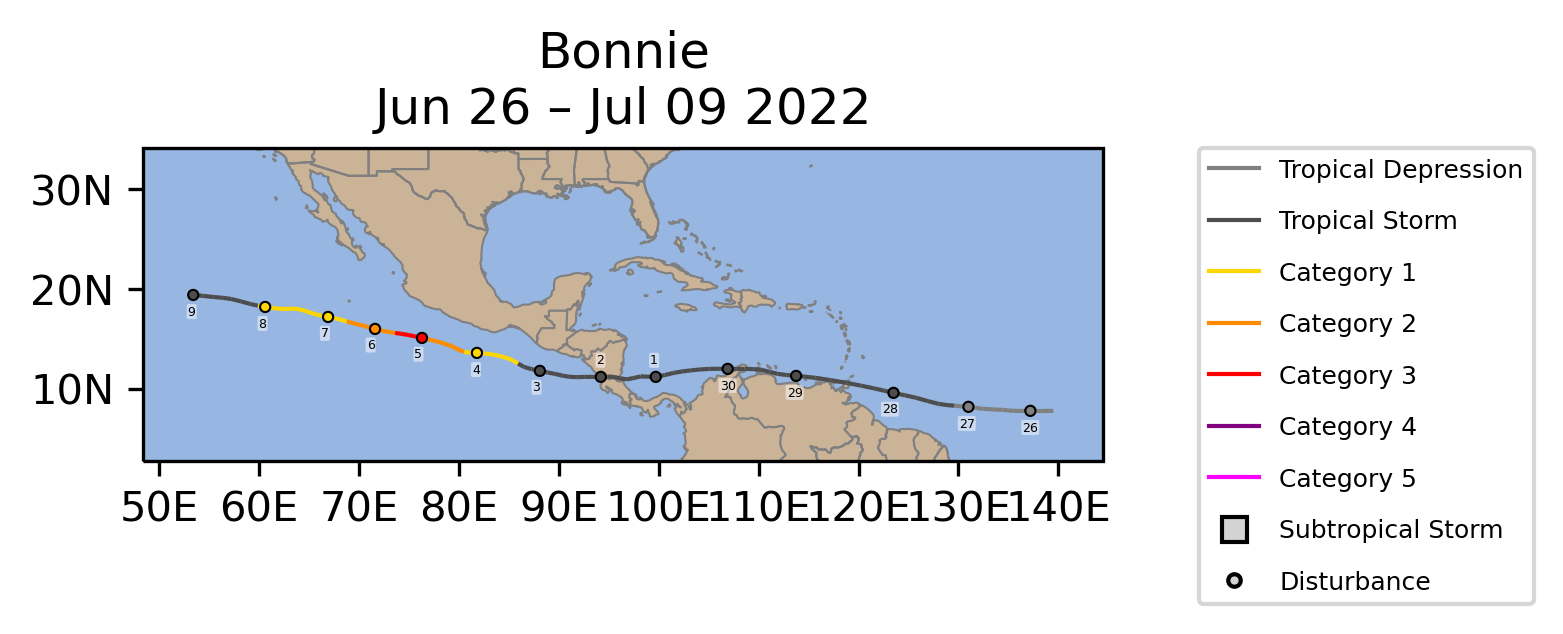
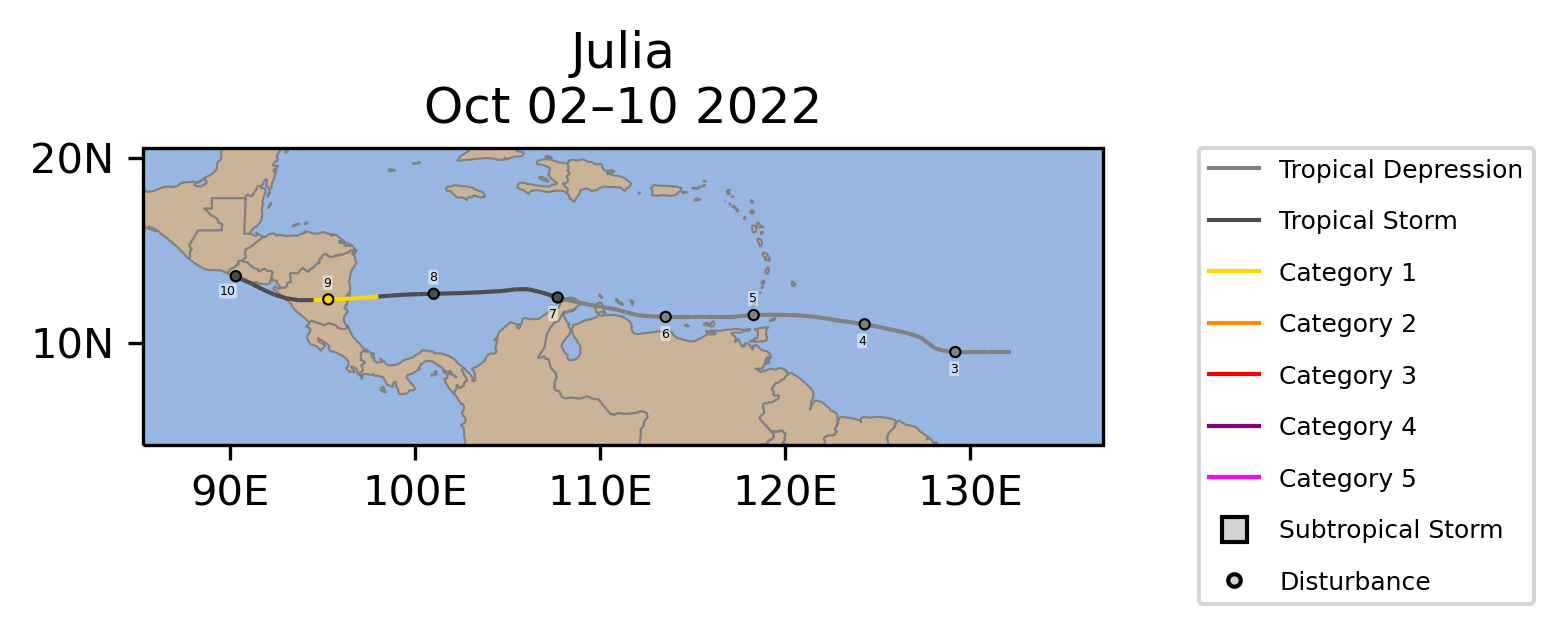
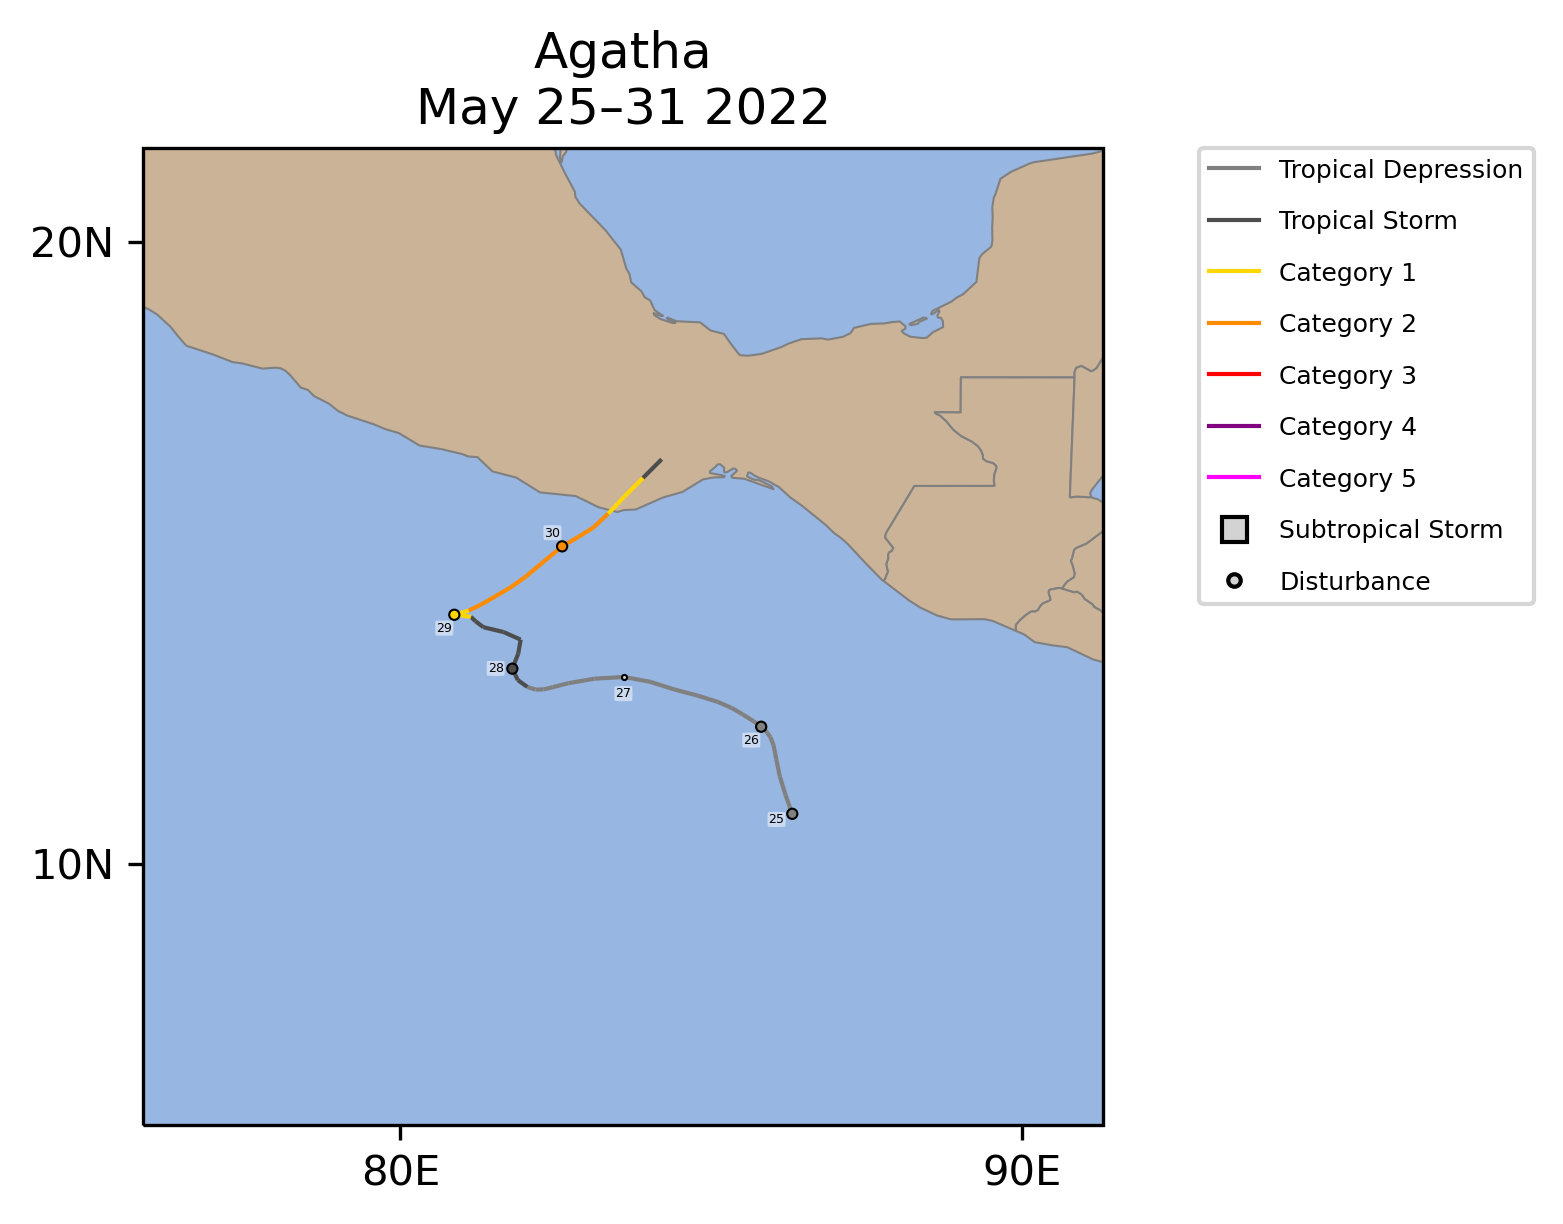
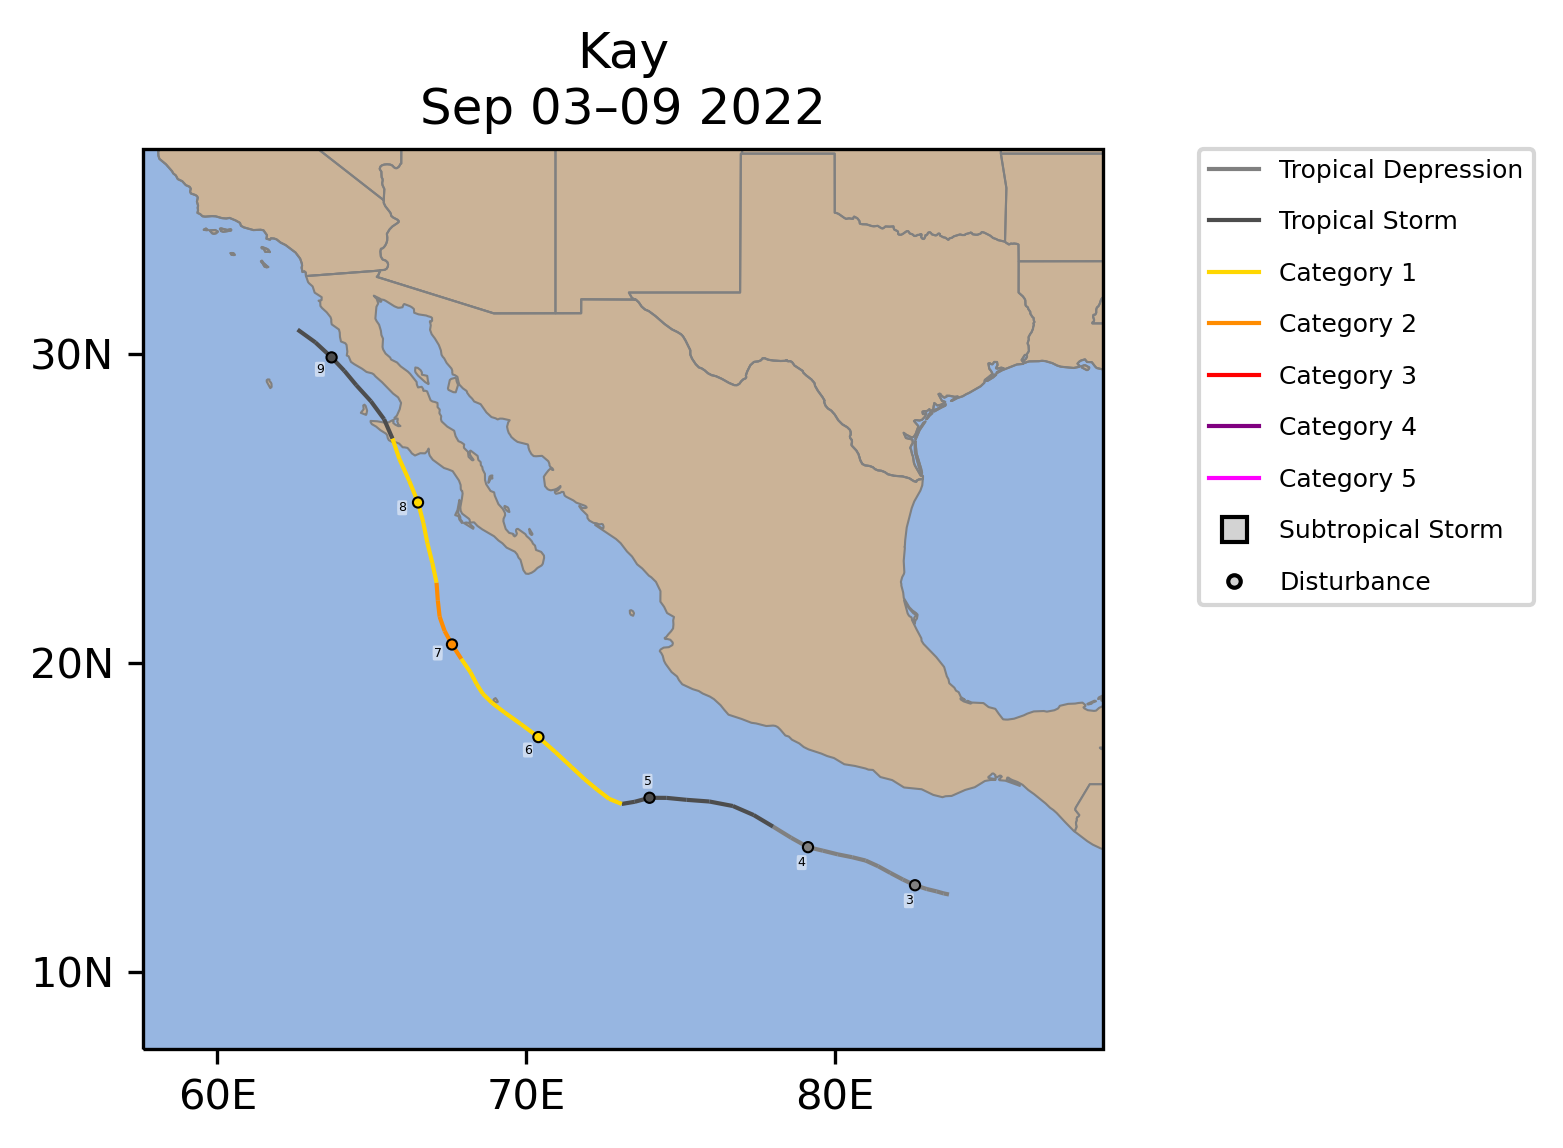
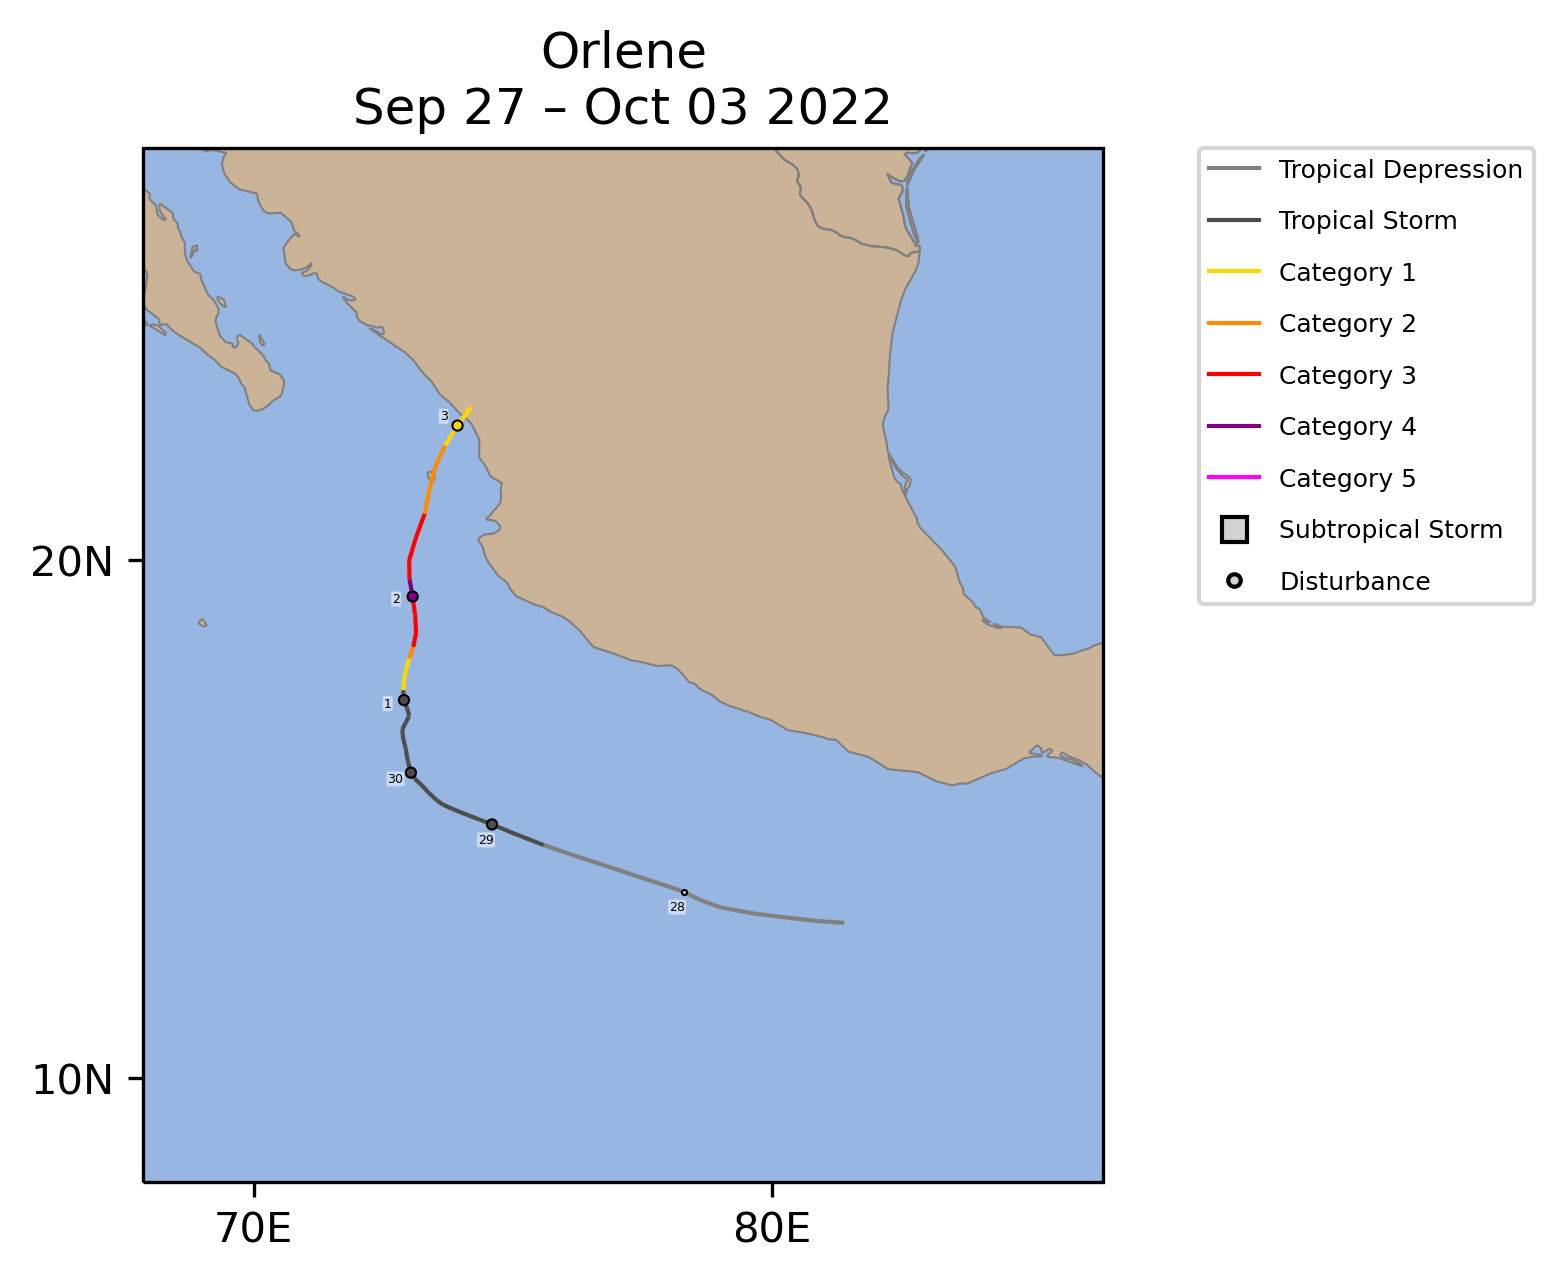
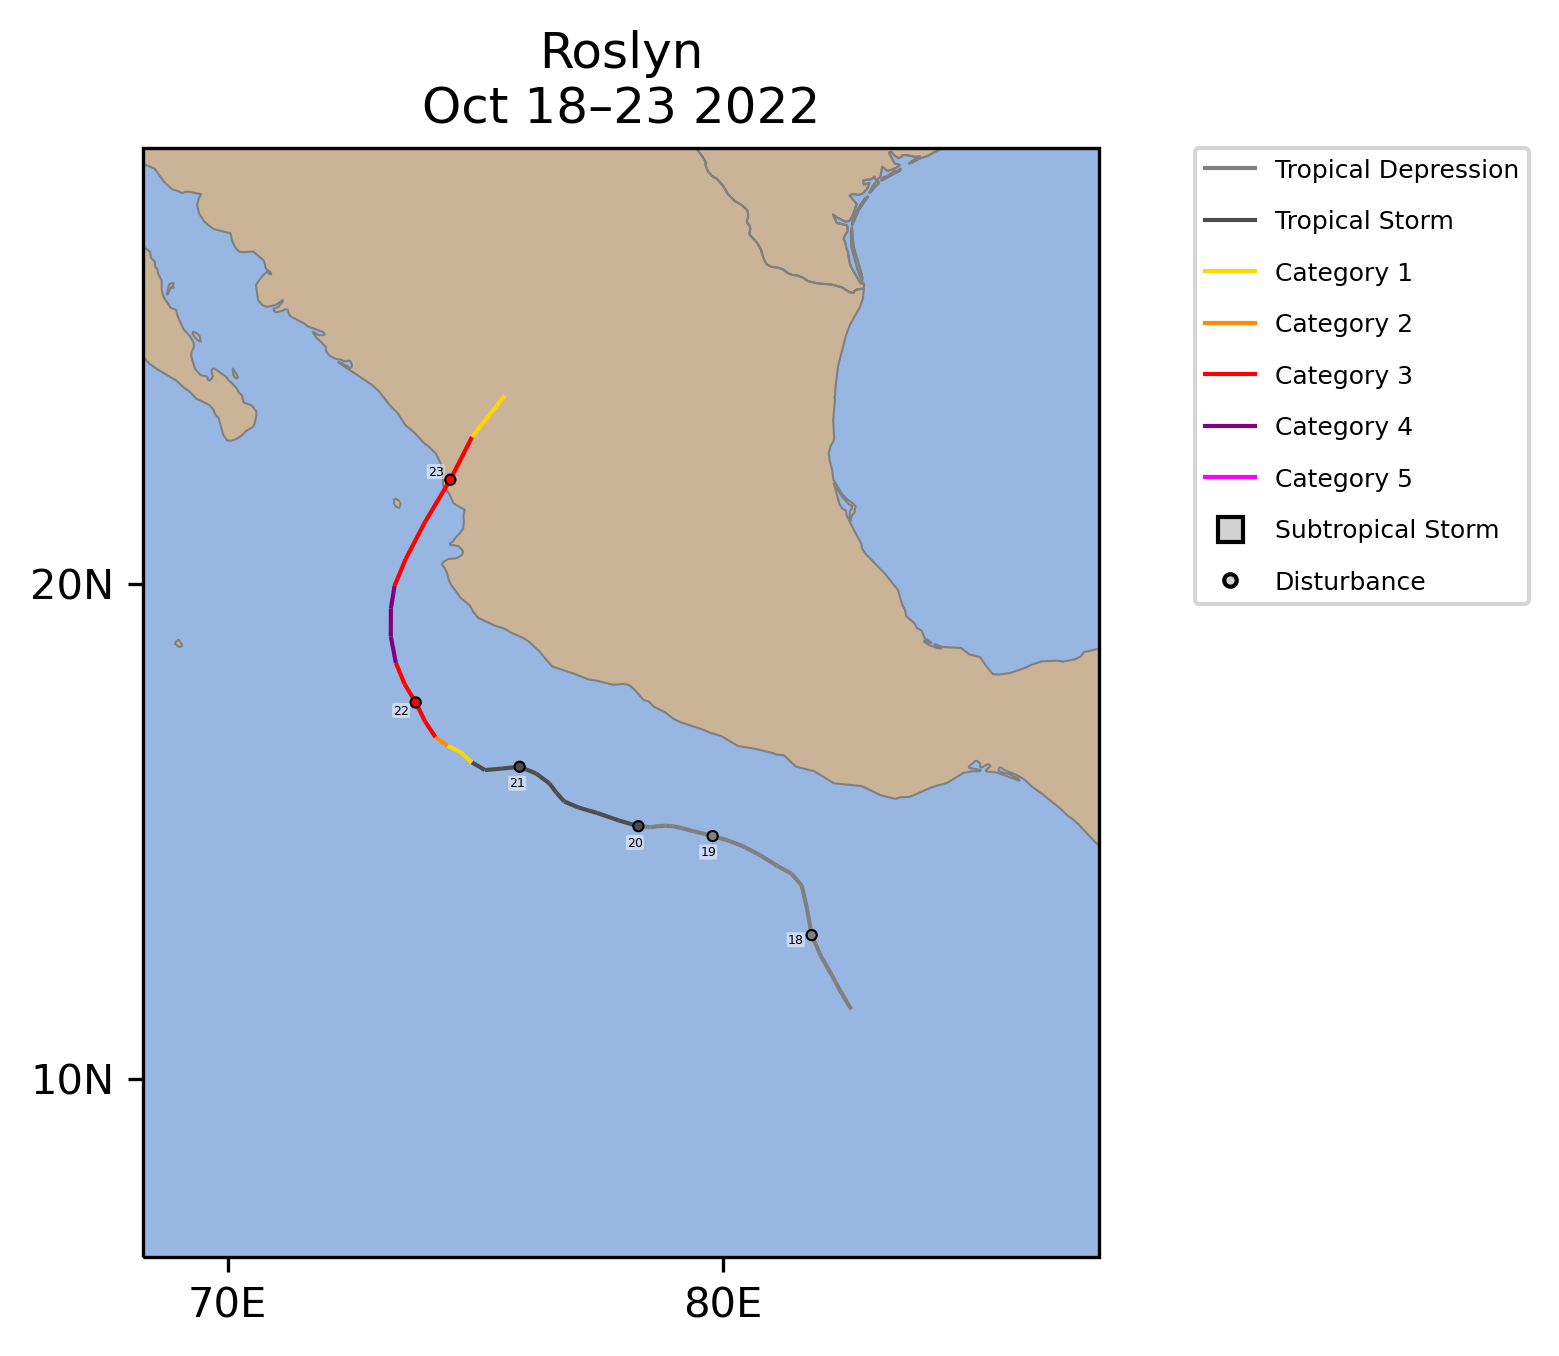
The East Pacific activity for 2022 was near its 1991-2020 average. It included Hurricanes Bonnie and Julia, both of which formed in the Atlantic before crossing Central America into the East Pacific. Four East Pacific storms made landfall in Mexico at hurricane strength in 2022: Agatha, Kay, Orlene, and Roslyn. Orlene and Roslyn made landfall in the same part of the Mexican coast just three weeks apart. Roslyn was the strongest East Pacific landfall since Hurricane Patricia in 2015.
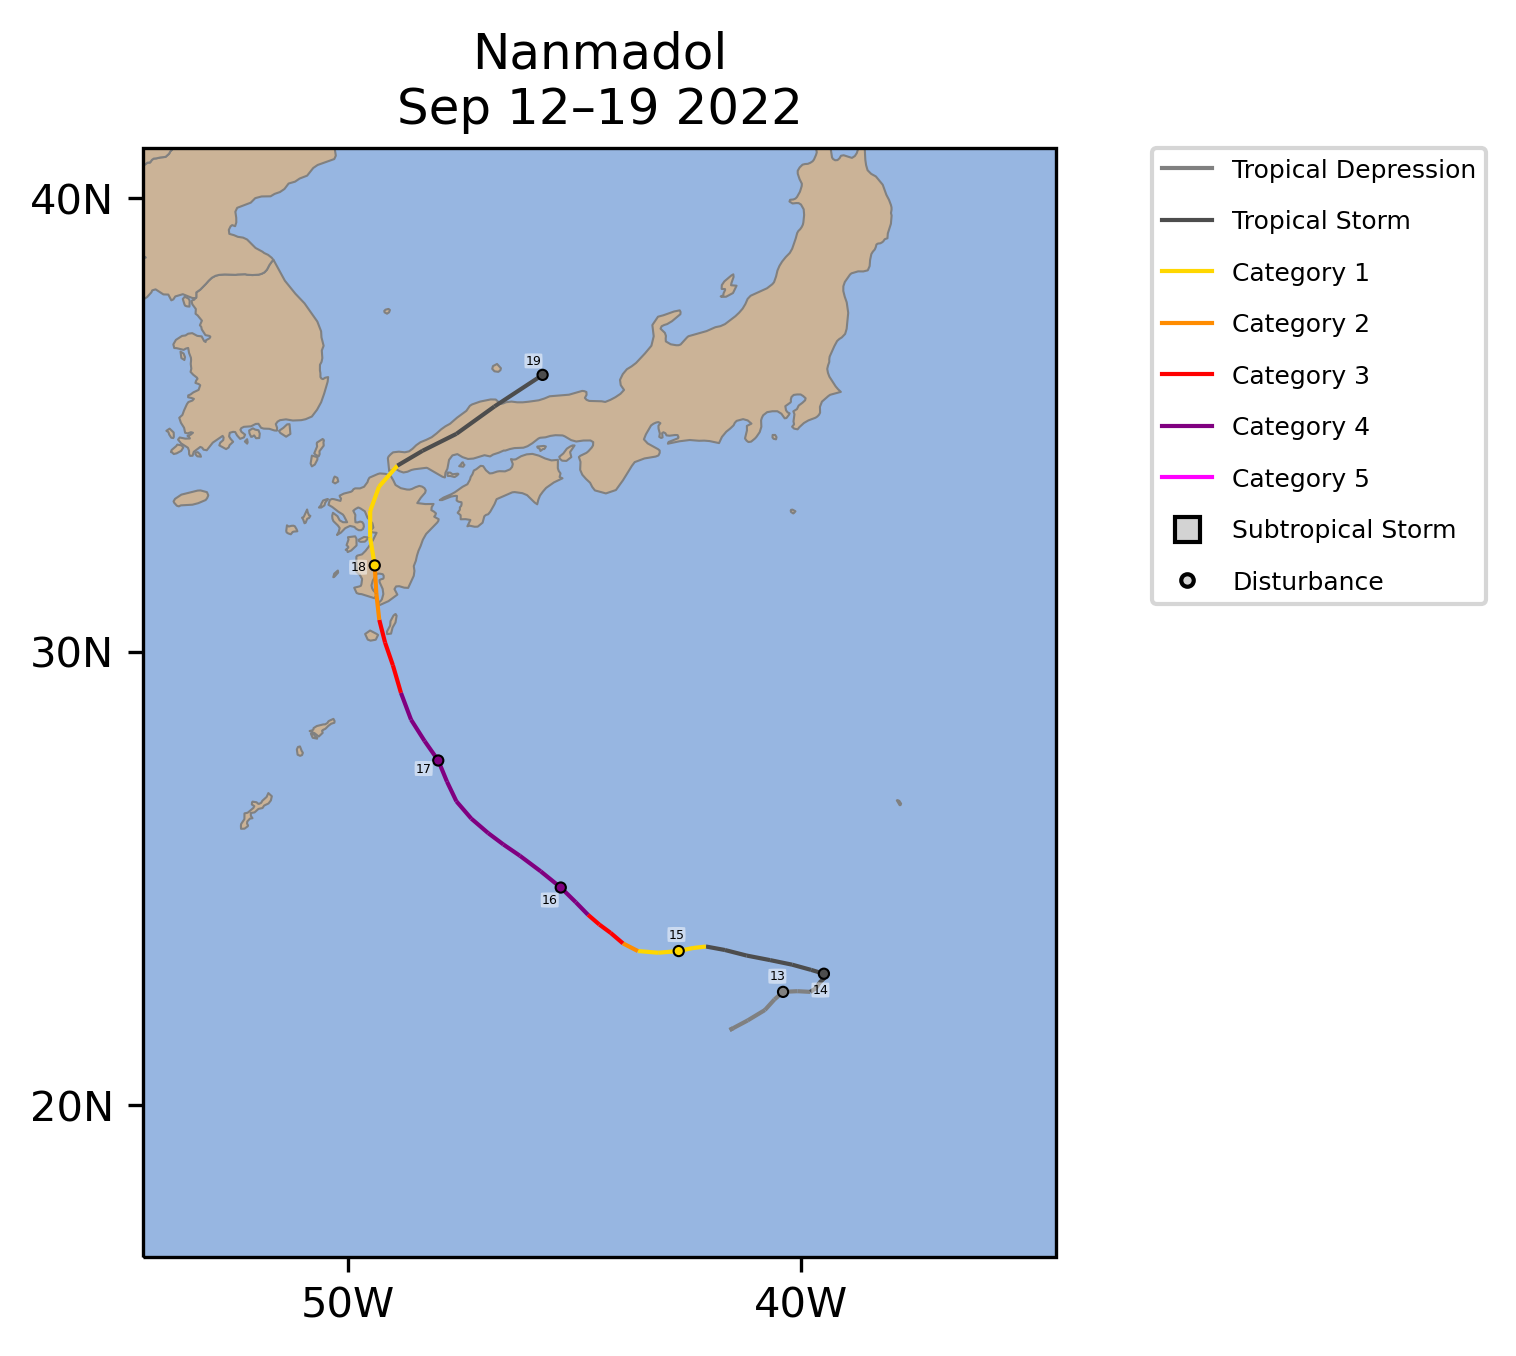
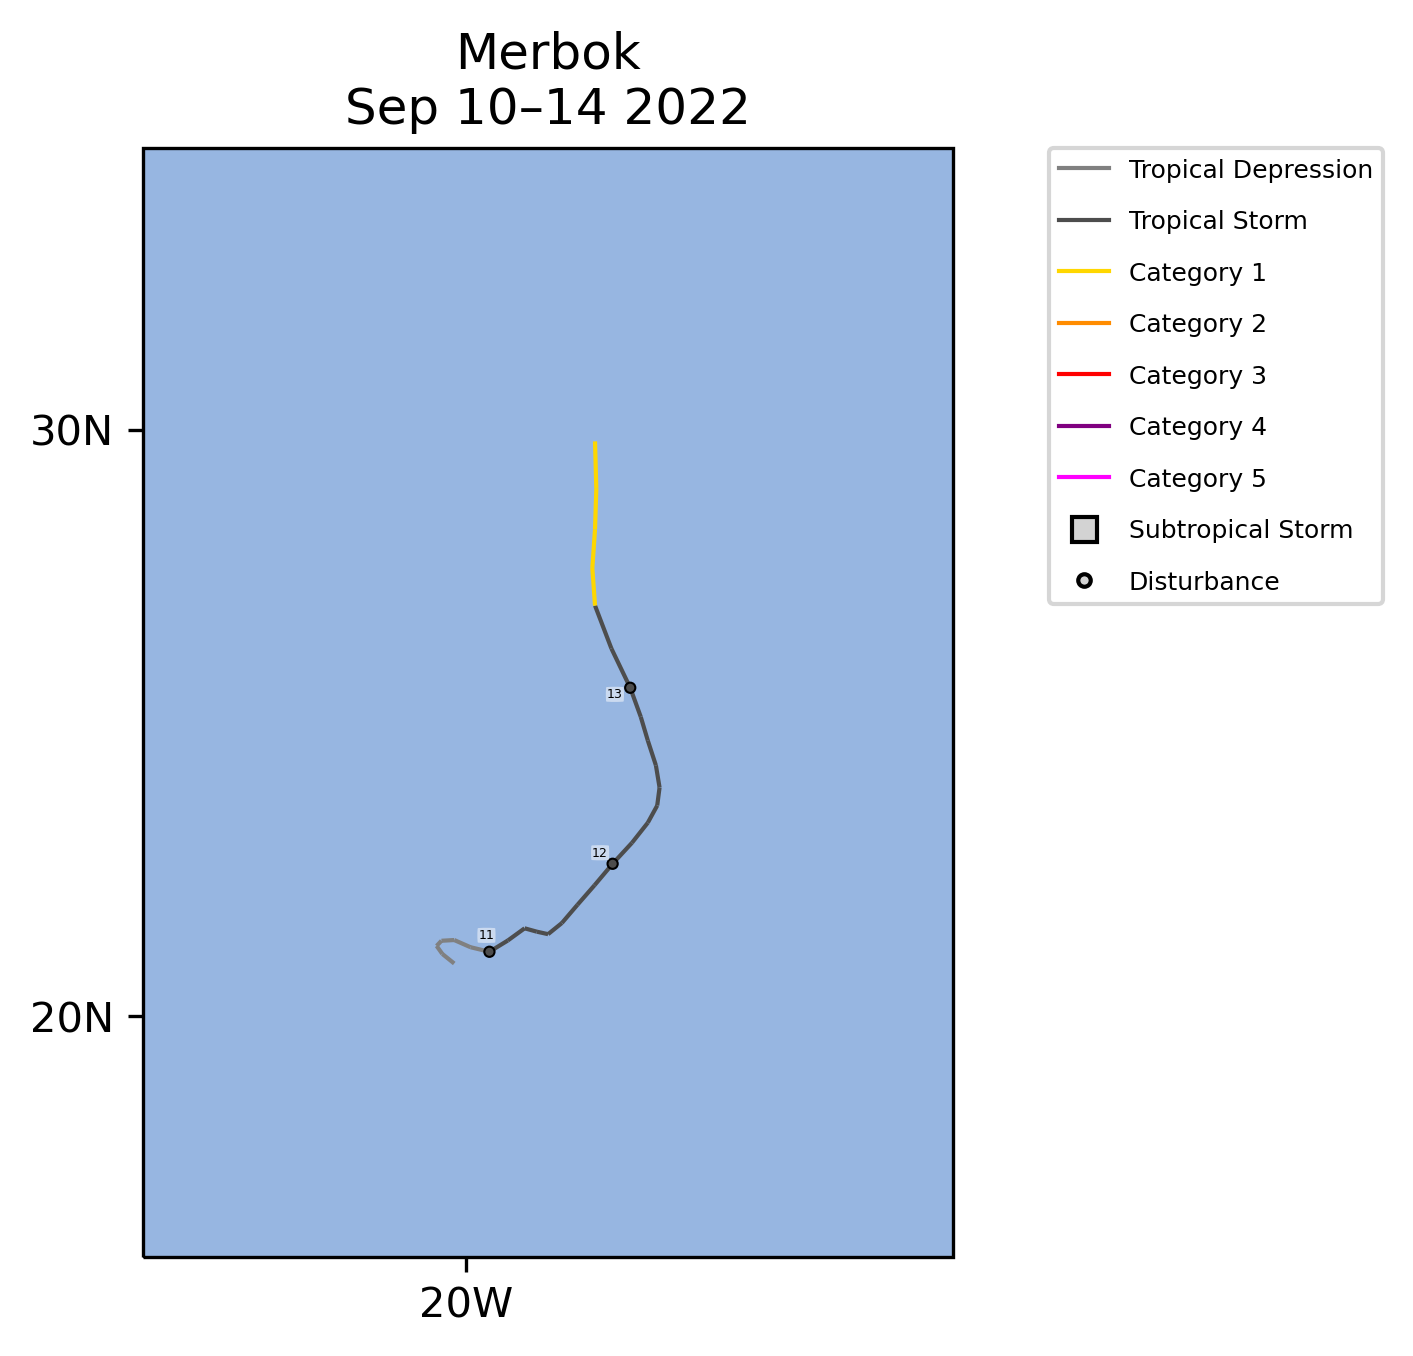
The West Pacific was less active than its 1991-2020 average by most metrics for the third year in a row. However, the West Pacific produced the only two category 5 storms that occurred globally in 2022. Both of these typhoons, Hinnamnor and Noru, occurred during an active period from late August through September. Hinnamnor weakened as it approached South Korea but still made landfall as a category 2 typhoon and one of the strongest in history there. Noru caused severe damage to the Philippines and Southeast Asia. Typhoon Nanmadol had peak winds of 155 mph, just shy of category 5 strength. It weakened before making landfall in Japan, but still produced significant flooding. The post-tropical remnants of Typhoon Merbok caused hurricane strength winds and coastal flooding in the Aleutians and western Alaska.
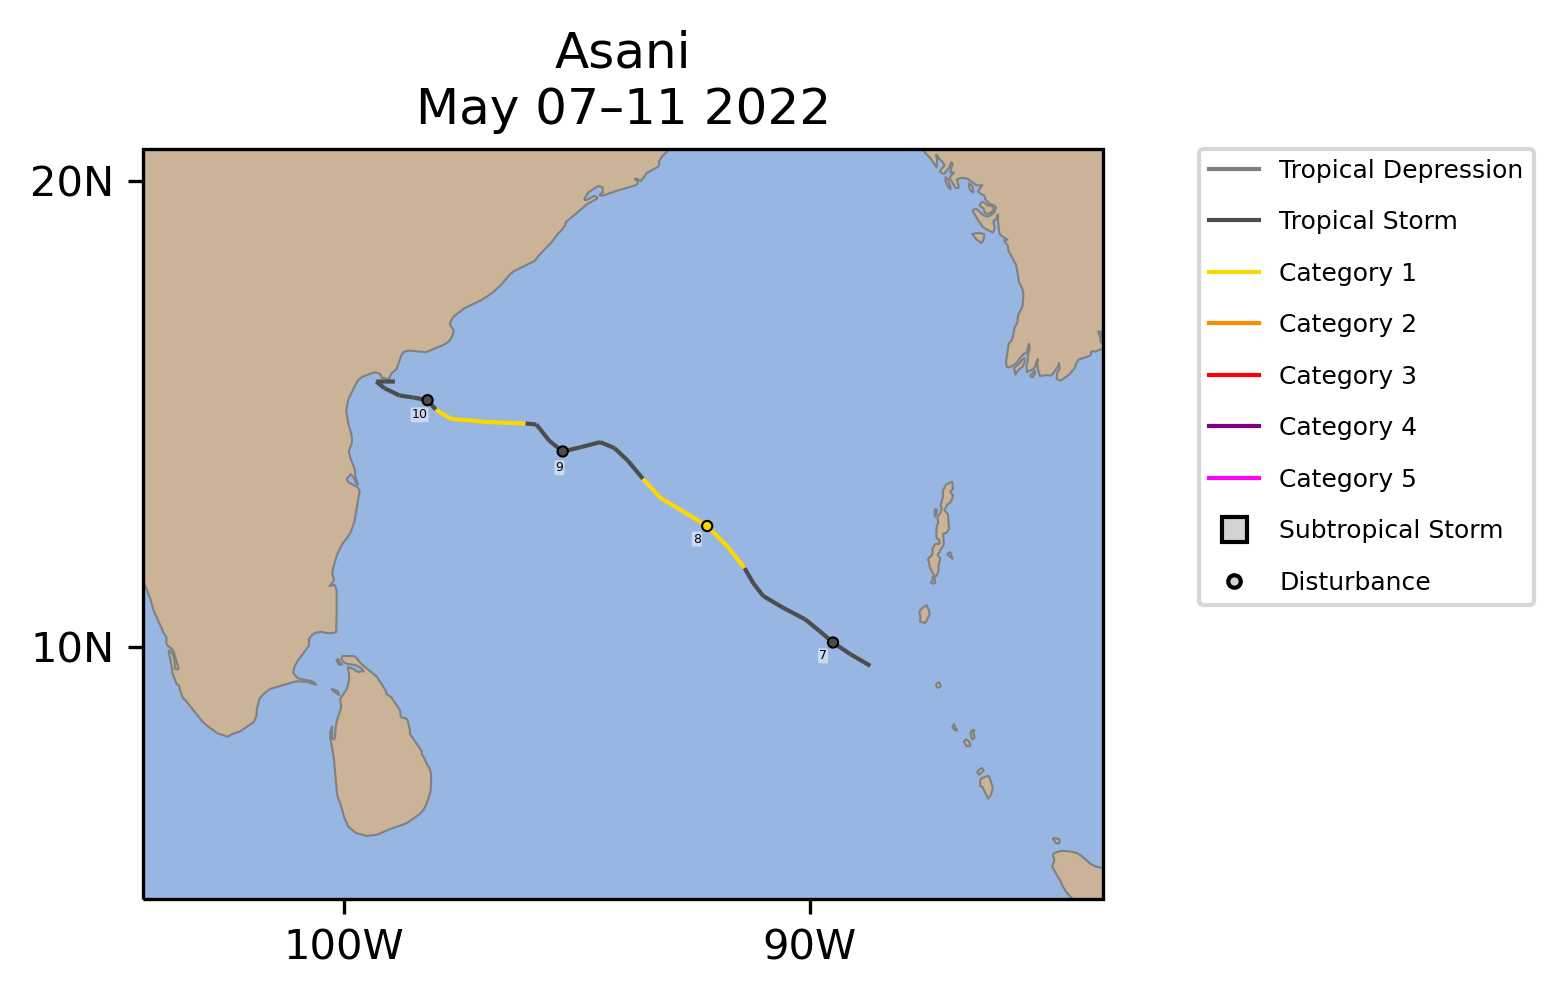
The seven named storms in the North Indian Ocean was above its 1991-2020 average. However, only one of these achieved cyclone strength, Asani, and none reached major cyclone strength. As a result, the ACE was below its 1991-2020 average.
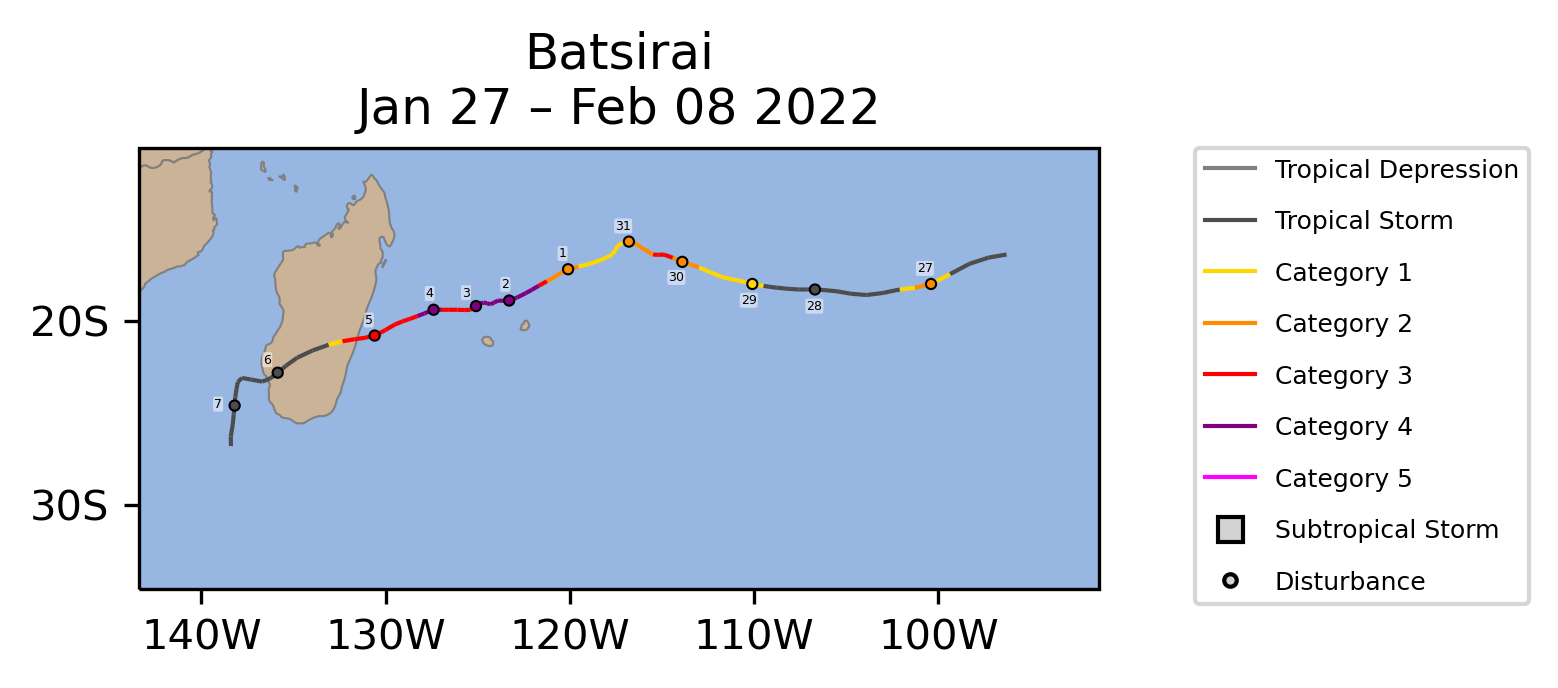
The tropical cyclone seasons in the Southern Hemisphere basins begin in July and end in June, so the seasons summarized here are the 2021/22 seasons that ended in June 2022. It is also more common for storms to cross basins in the Southern Hemisphere, so some storms are counted in multiple basins. The South Indian Ocean tropical cyclone activity was near normal in term of ACE. However, all five storms that reached cyclone strength also became major cyclones, and Madagascar was affected by an unprecedented six tropical cyclones. The strongest was Major Cyclone Batsirai, which caused widespread wind damage, power outages, and flooding.
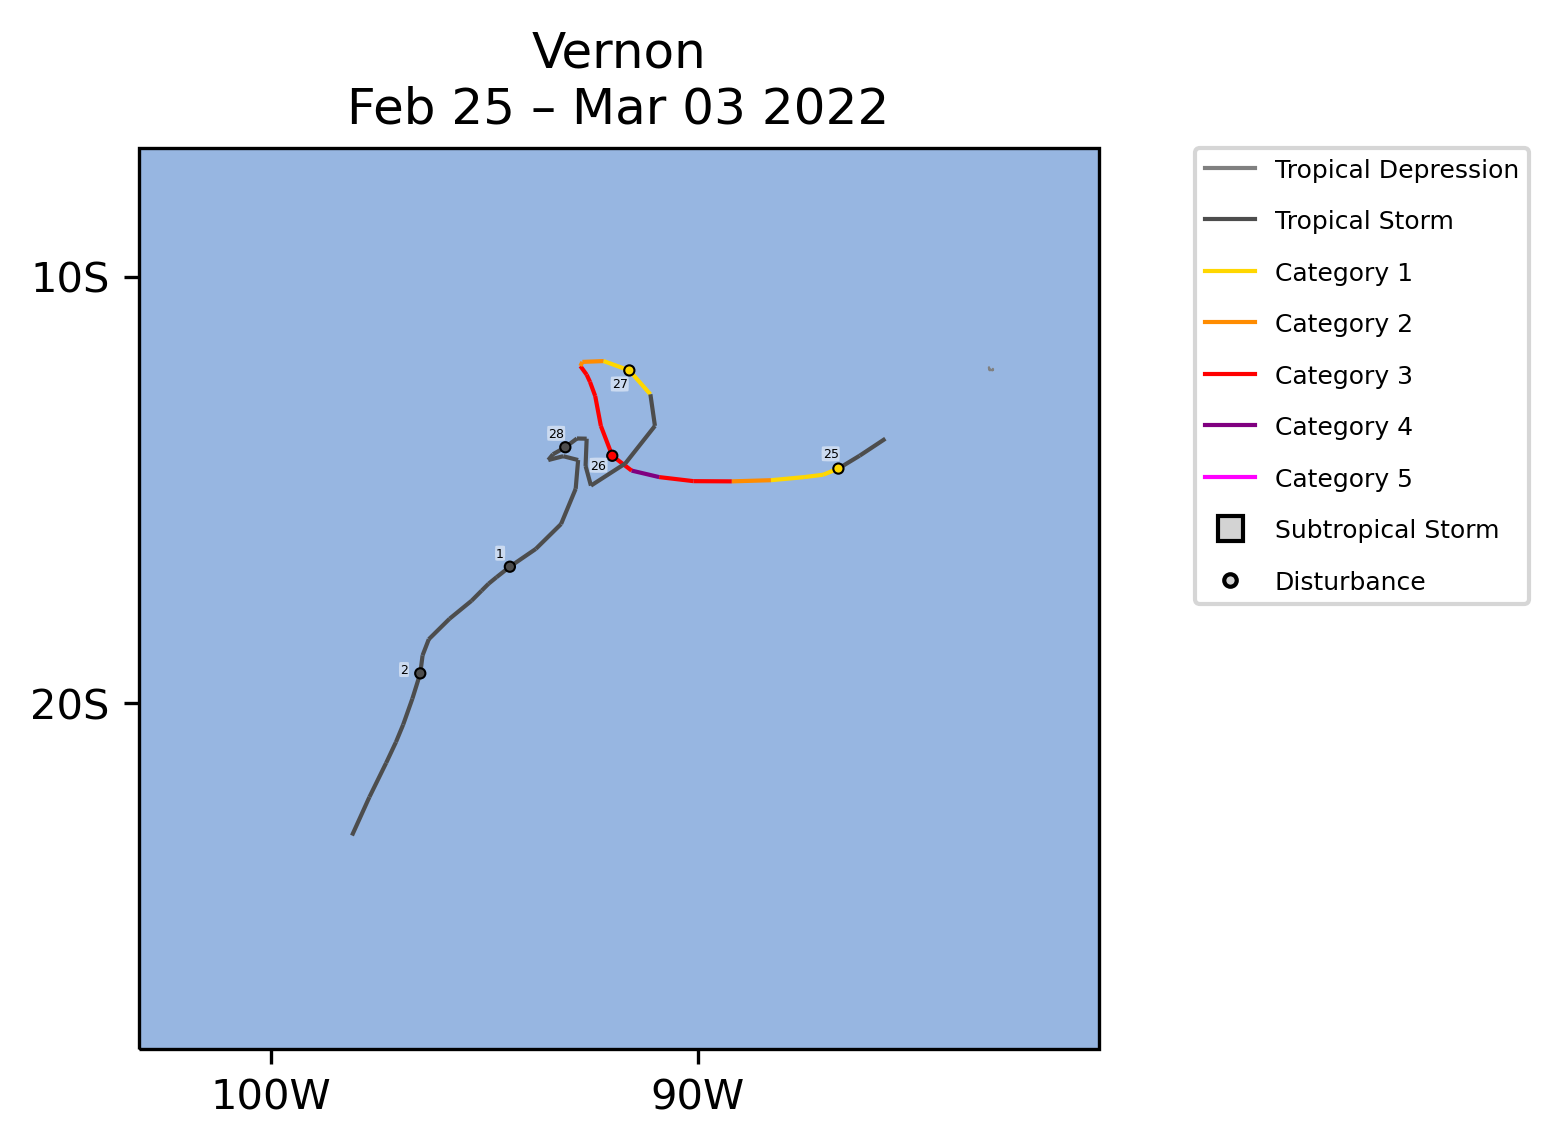
The Australian region was less active than normal in terms of ACE and the quietest since 2015/16. Despite a normal number of named storms and cyclones, Vernon was the only storm to achieve major cyclone intensity. The Southwest Pacific was similarly quiet with no major cyclones for the first time since 2008/09.