Use the form below to select from a collection of monthly summaries recapping climate-related occurrences on both a global and national scale.
Tropical Cyclones ReportAnnual 2023

Summary
|
Tropical Storm
Winds ≥ 39 mph (34 kts)
|
Tropical Cyclone
Winds ≥ 74 mph (64 kts)
|
Major Tropical Cyclone
Winds ≥ 111 mph (96 kts)
|
Category 5 Cyclone
Winds ≥ 157 mph (137 kts)
|
ACE
ACE×10⁴ kt²
|
|
|---|---|---|---|---|---|
| North Atlantic | 20++ | 7 | 3 | 1+ | 144 |
| Eastern North Pacific | 17 | 10+ | 8+ | 2+ | 166+ |
| Western North Pacific | 17-- | 12- | 8 | 2 | 268 |
| North Indian | 8++ | 4++ | 3++ | 1++ | 56++ |
| South Indian | 9- | 7+ | 4+ | 1++ | 134+ |
| Australia | 9- | 5 | 4+ | 0 | 67 |
| Southwest Pacific | 6 | 3 | 2 | 0 | 31 |
| Global | 78- | 45 | 30+ | 7+ | 854+ |
Seventy-eight named storms occurred across the globe in 2023, which was below the 1991-2020 average of 87.5. Forty-five of those reached tropical cyclone strength (≥74 mph), and thirty reached major tropical cyclone strength (≥111 mph). These also included seven storms that reached category 5 (≥157 mph) on the Saffir-Simpson hurricane wind scale. The global accumulated cyclone energy (ACE: an integrated metric of the strength, frequency, and duration of tropical storms) was about 8% above the 1991-2020 average.
The North Atlantic had 20 named storms, which was much above the 1991-2020 average of 14.4. Seven of those were hurricanes, including three major hurricanes. The ACE was about 18% above normal. Idalia was the only billion dollar hurricane to impact the continental United States in 2023. In just 30 hours, Idalia went from a tropical storm to making landfall in the Florida Big Bend region as a major hurricane with widespread flooding. Lee was the strongest storm in the Atlantic in 2023 and the only category 5 storm. Lee's wind field expanded as it weakened, which caused tropical storm conditions on Bermuda, New England, and Atlantic Canada.
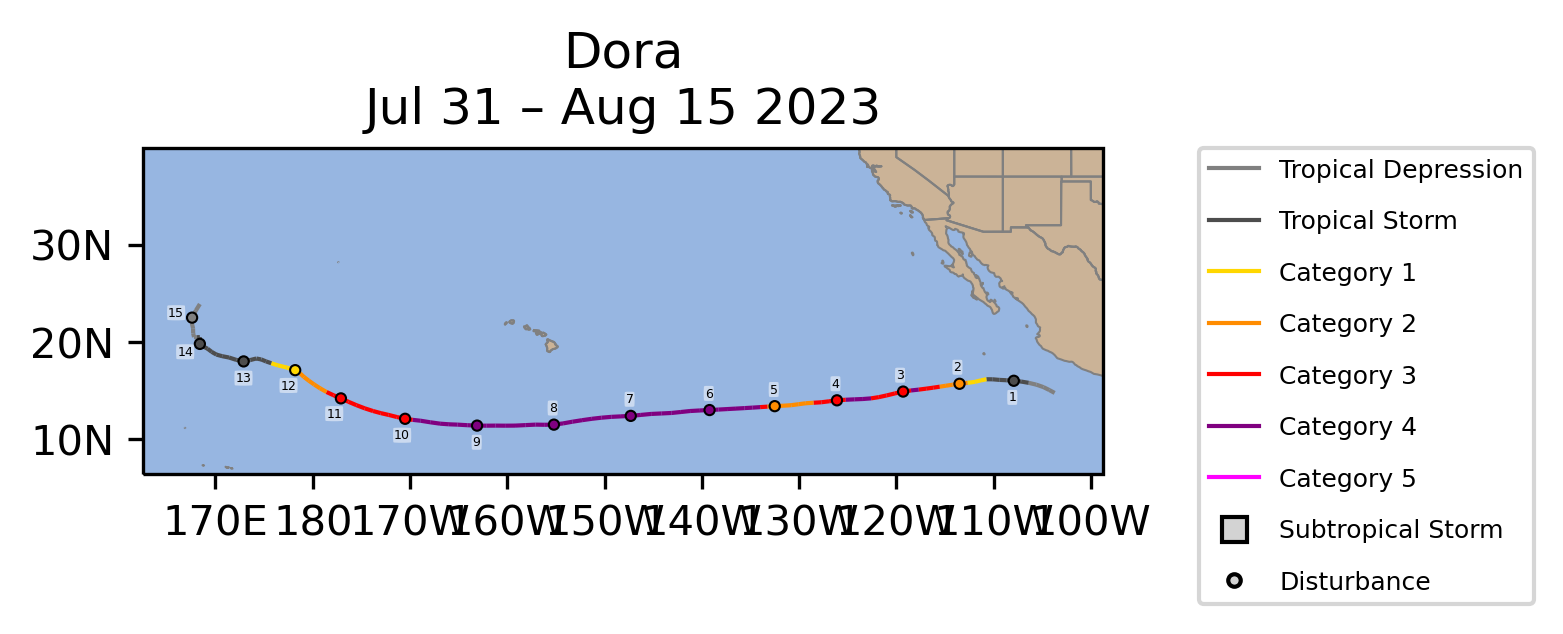
The East Pacific hurricane season had 17 named storms, which was near the 1991-2020 average. Of those, 10 became hurricanes including 8 major hurricanes. The ACE was about 25% above the 1991-2020 average. Hilary peaked as a category 4 hurricane before making landfall as a tropical storm on the northern Baja peninsula. It maintained tropical storm strength as it crossed into Southern California bringing heavy rain and flooding to the Southwest. Jova was the first category 5 storm in the East Pacific in 2023, but remained off shore with minimal impacts. The season's other category 5 storm, Otis, rapidly intensified to become the strongest hurricane on record to make landfall along Mexico's west coast. It caused catastrophic damage to Acapulco City.
The West Pacific had 17 named storms, including Dora, which crossed the dateline from the East Pacific. The only year since 1951 with fewer named storms in the West Pacific was 2010 with 15. Twelve of the storms became typhoons including 8 major typhoons. The ACE was about 11% below the 1991-2020 average. Mawar was the first category 5 typhoon of the season. Before reaching its peak strength, it became just the third category 4 (winds ≥130 mph) typhoon to pass within 100 miles of Guam in the Western Pacific. Doksuri was the most destructive West Pacific storm in 2023. It passed near the northern Philippines as a category 4 storm. As it moved northwestward, Doksuri caused heavy rain and flooding in Taiwan and eastern China. Bolaven was the second category 5 typhoon near the Northern Mariana Islands.
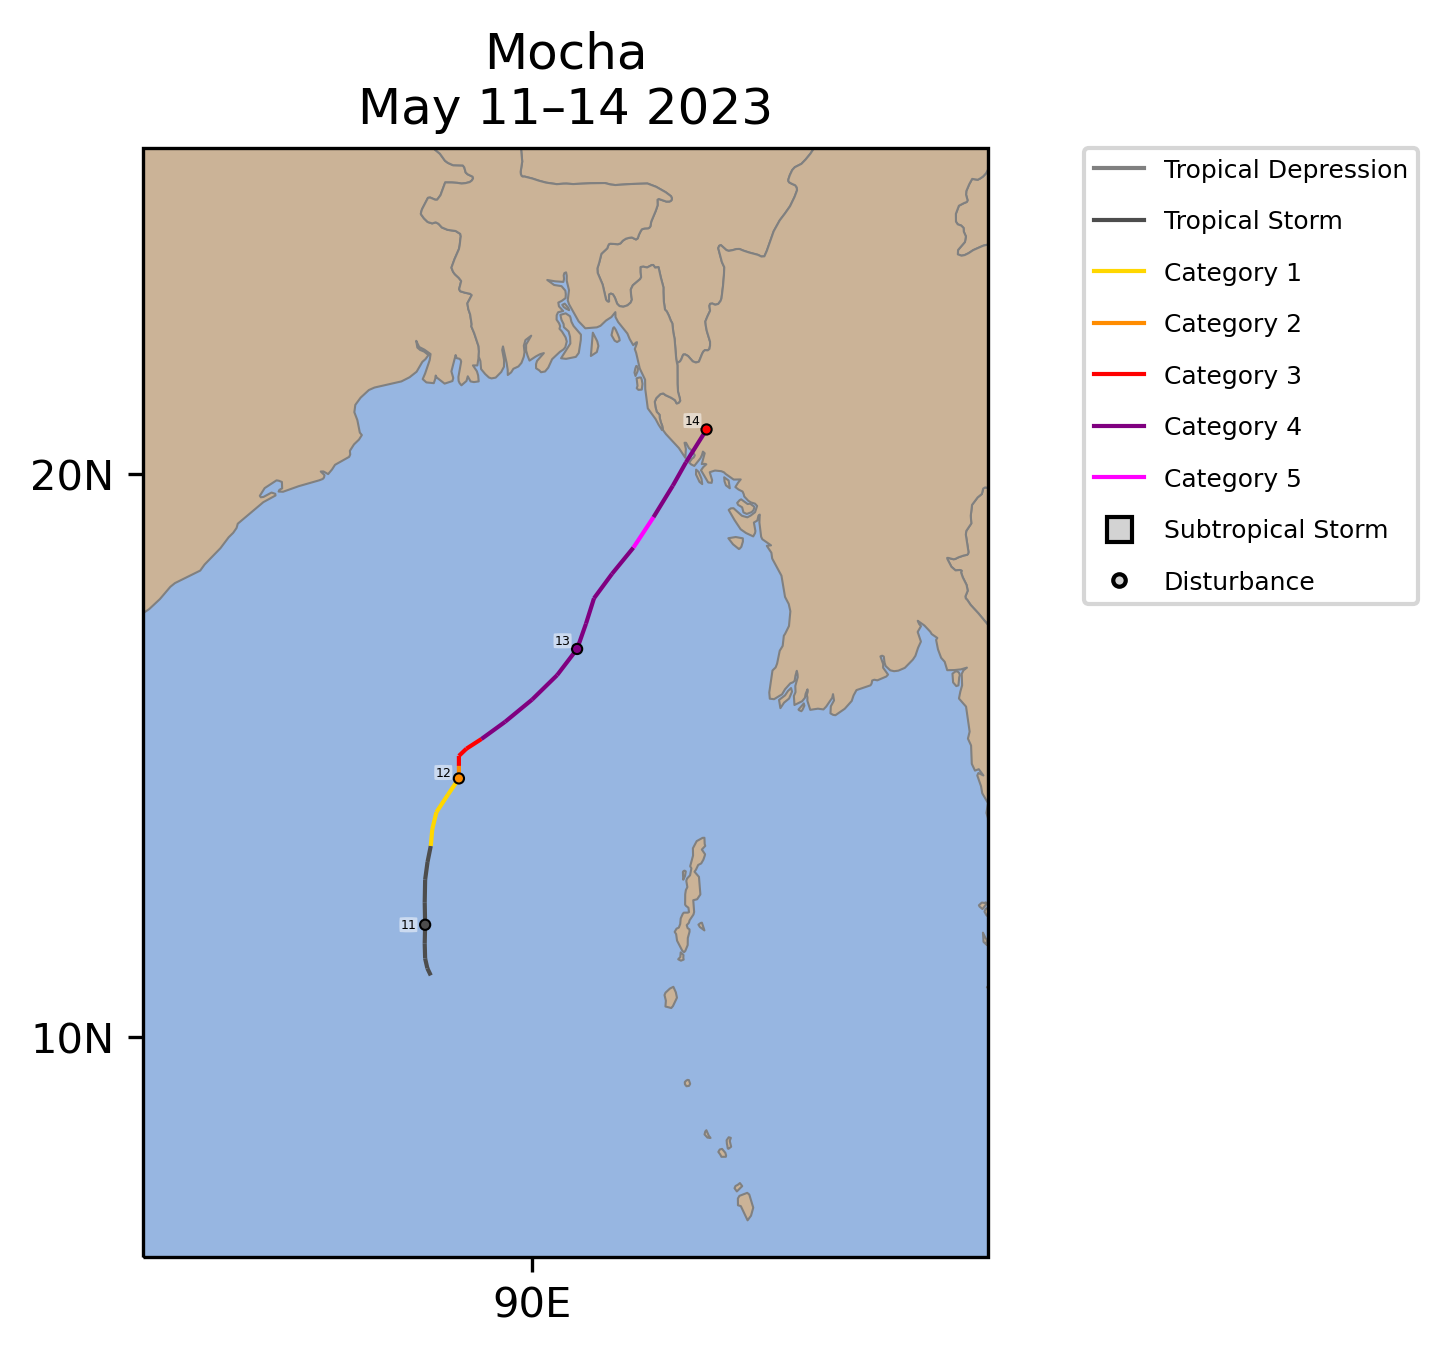
The North Indian Ocean had arguably its second most active season on record with three major cyclones and about 225% of the 1991-2020 average ACE. Only 2019 exceeded these levels with five major cyclones and over 375% of the average ACE. The most significant storm of the season was Mocha, which achieved category 5 strength as it approached landfall in Myanmar. It made landfall as a category 4 cyclone, and the winds, rainfall, and storm surge resulted in hundreds of deaths.
The tropical cyclone seasons in the Southern Hemisphere basins begin in July and end in June, so the seasons summarized here are the 2022/23 seasons that ended in June 2023. It is also more common for storms to cross basins in the Southern Hemisphere, so some storms are counted in multiple basins.
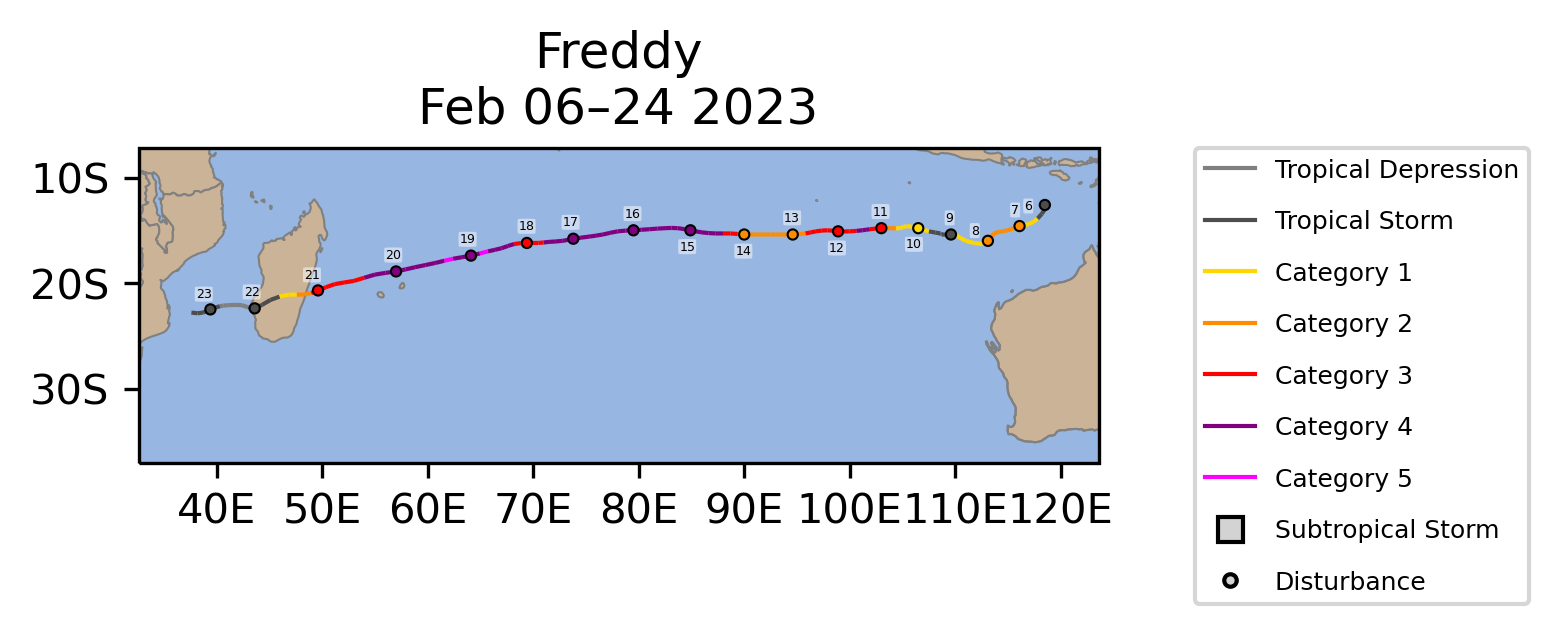
The South Indian Ocean ACE was about 40% above the 1991-2020 average. The most noteworthy storm was Freddy, which formed near Indonesia and crossed the Indian Ocean before making landfall over Madagascar and Mozambique. After weakening over southeastern Africa, Freddy redeveloped over the Mozambique Channel and regained major cyclone strength. It eventually made another landfall over Mozambique before dissipating 35 days after it first developed. If verified, this would be the longest lifespan for a tropical cyclone on record. It caused heavy rain and flooding over Madagascar, Malawi, and Mozambique.
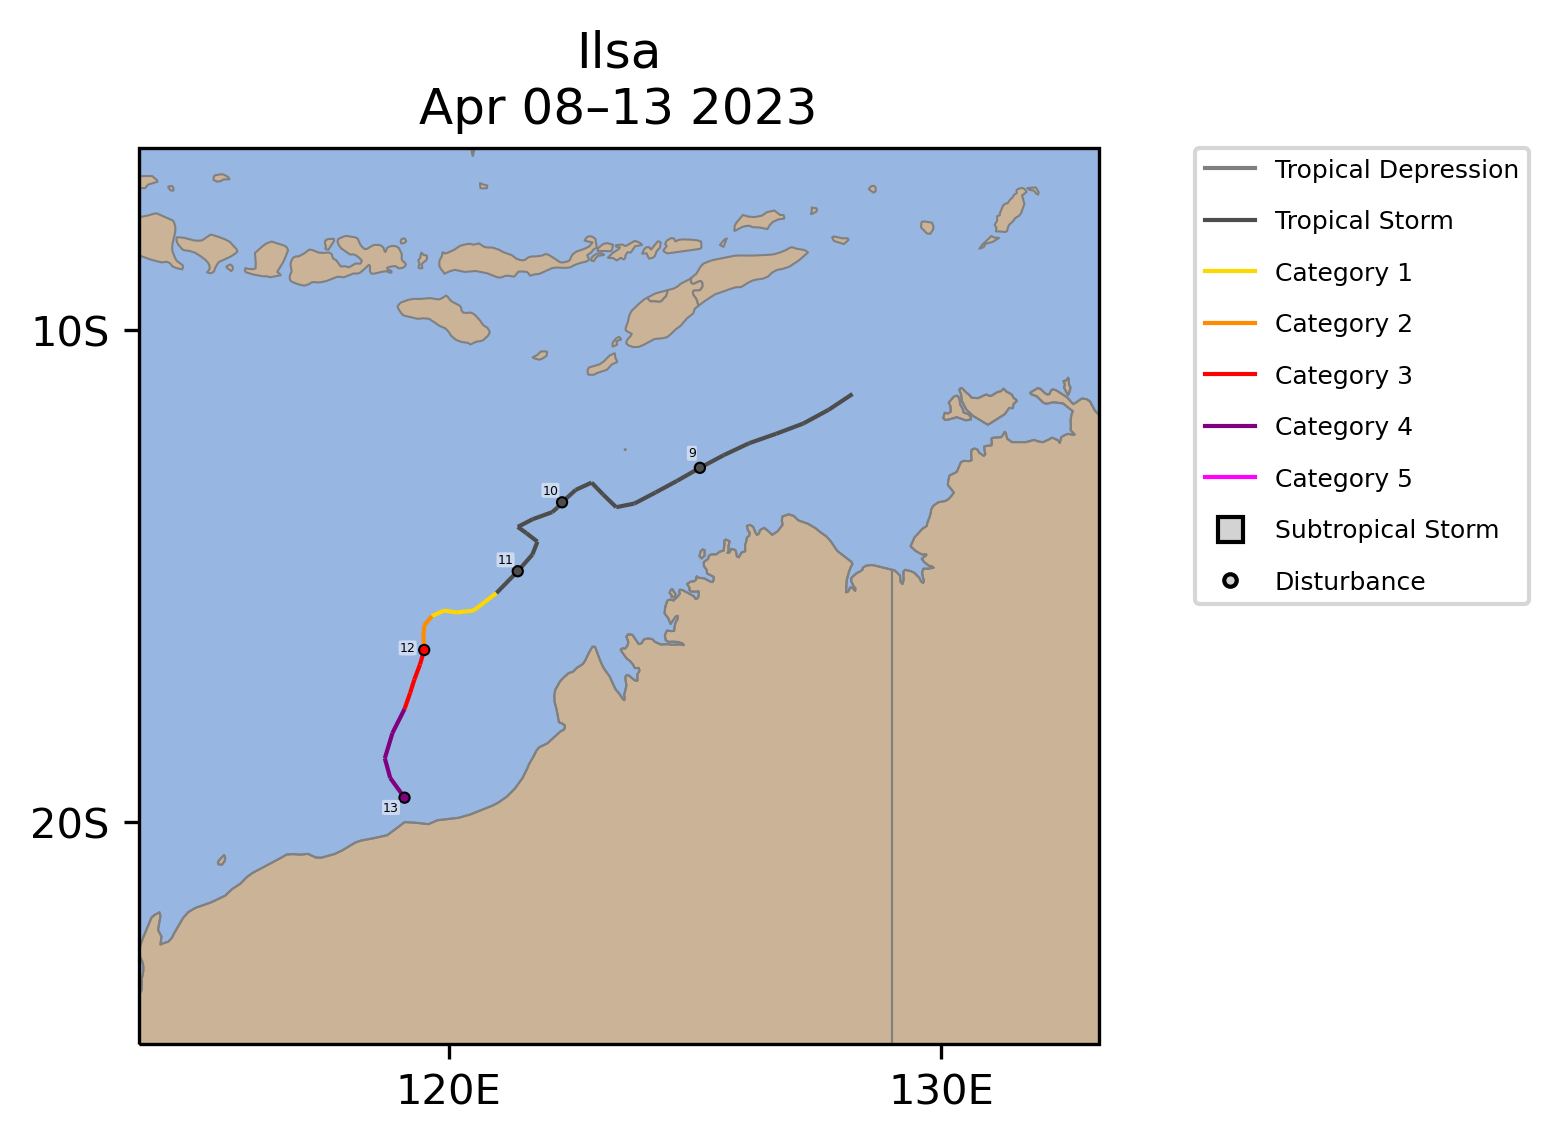
The Australian and Southwest Pacific were both near normal in terms of ACE. The remnants of Gabrielle caused over $1 billion USD with heavy rain and flooding in New Zealand, becoming one of the costliest Southern Hemisphere cyclones ever. Ilsa made landfall over Northwest Australia as a category 4 cyclone on the Saffir-Simpson hurricane wind scale—setting a record for the strongest winds observed in western Australia. Fortunately, Ilsa made landfall in a sparsely populated portion of northwestern Australia, which limited its impacts.