Summary
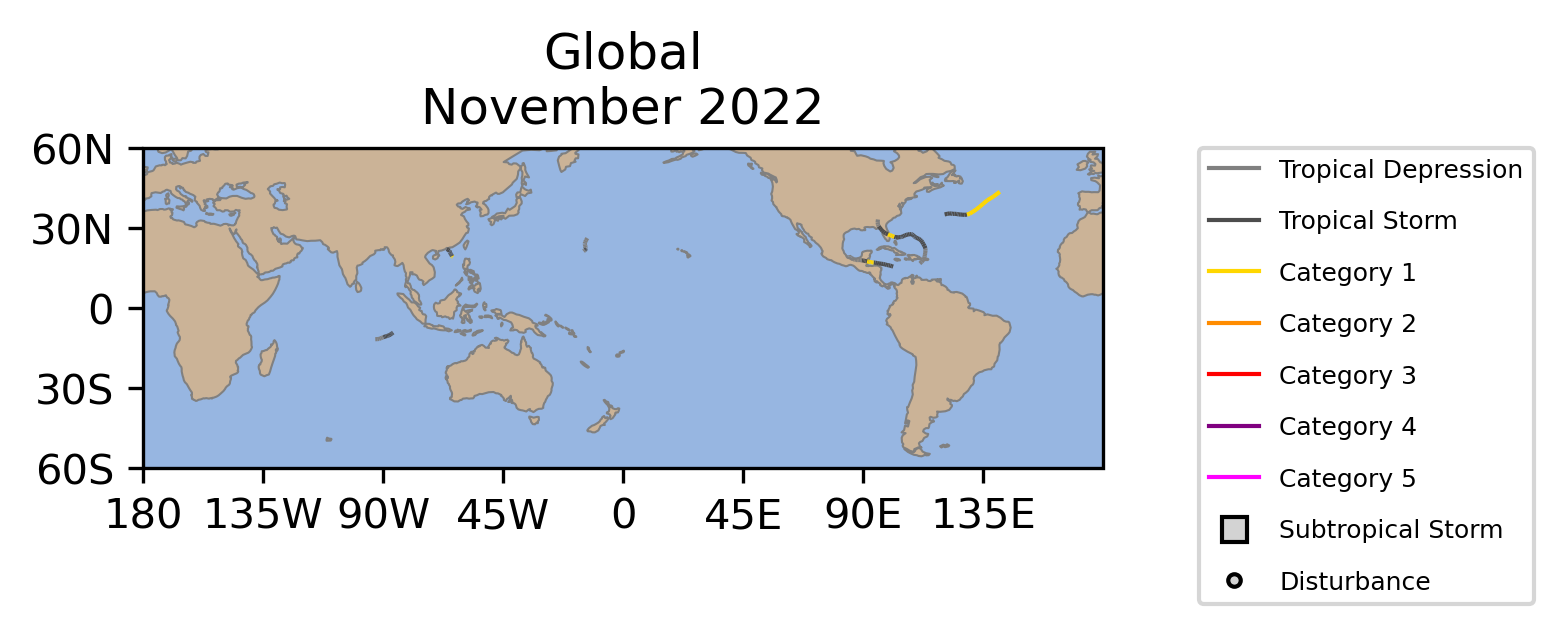
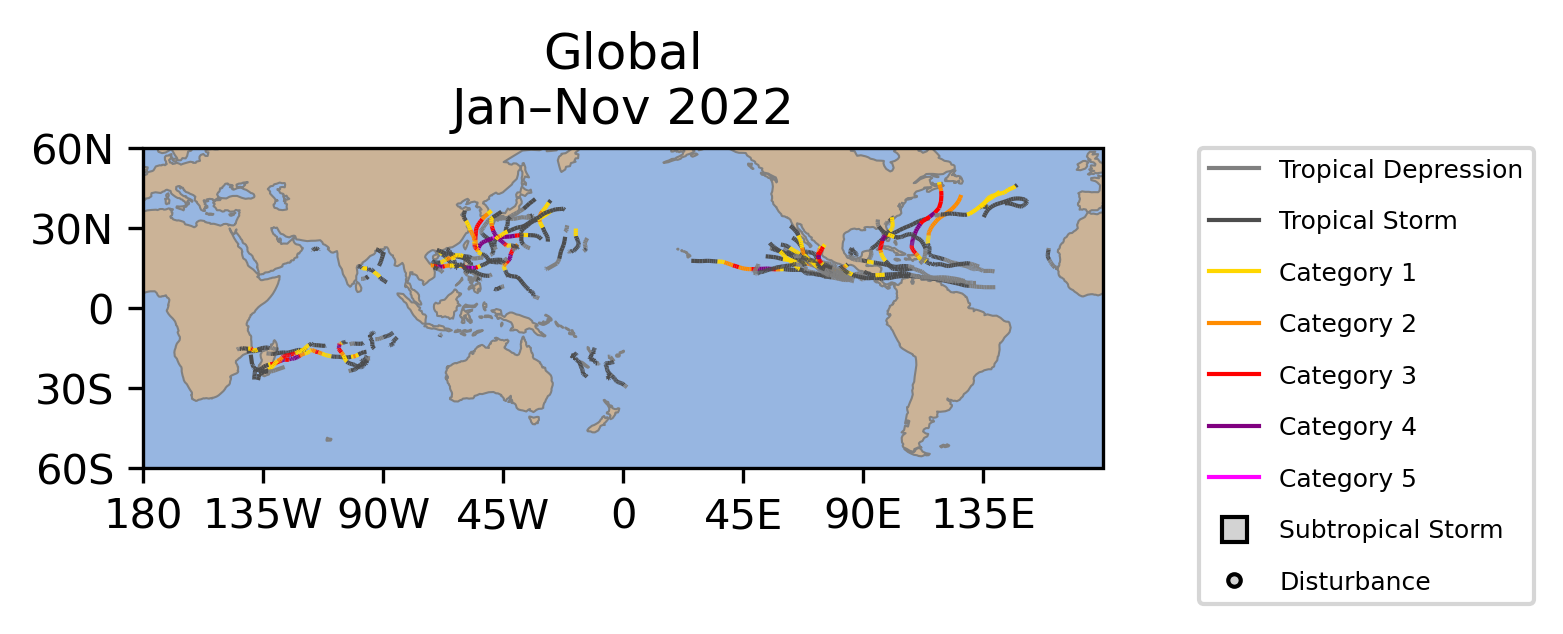
Six named storms occurred across the globe in November. Four of those reached tropical cyclone strength (≥74 mph), but none reached major tropical cyclone strength (≥111 mph). The global accumulated cyclone energy (ACE: an integrated metric of the strength, frequency, and duration of tropical storms) was about 26% of its 1991-2020 average in November. The numbers of named storms and major tropical cyclones were both below normal, but the number of tropical cyclones was near normal. All metrics for January-November are below normal including ACE, which is the lowest on record since 1981.
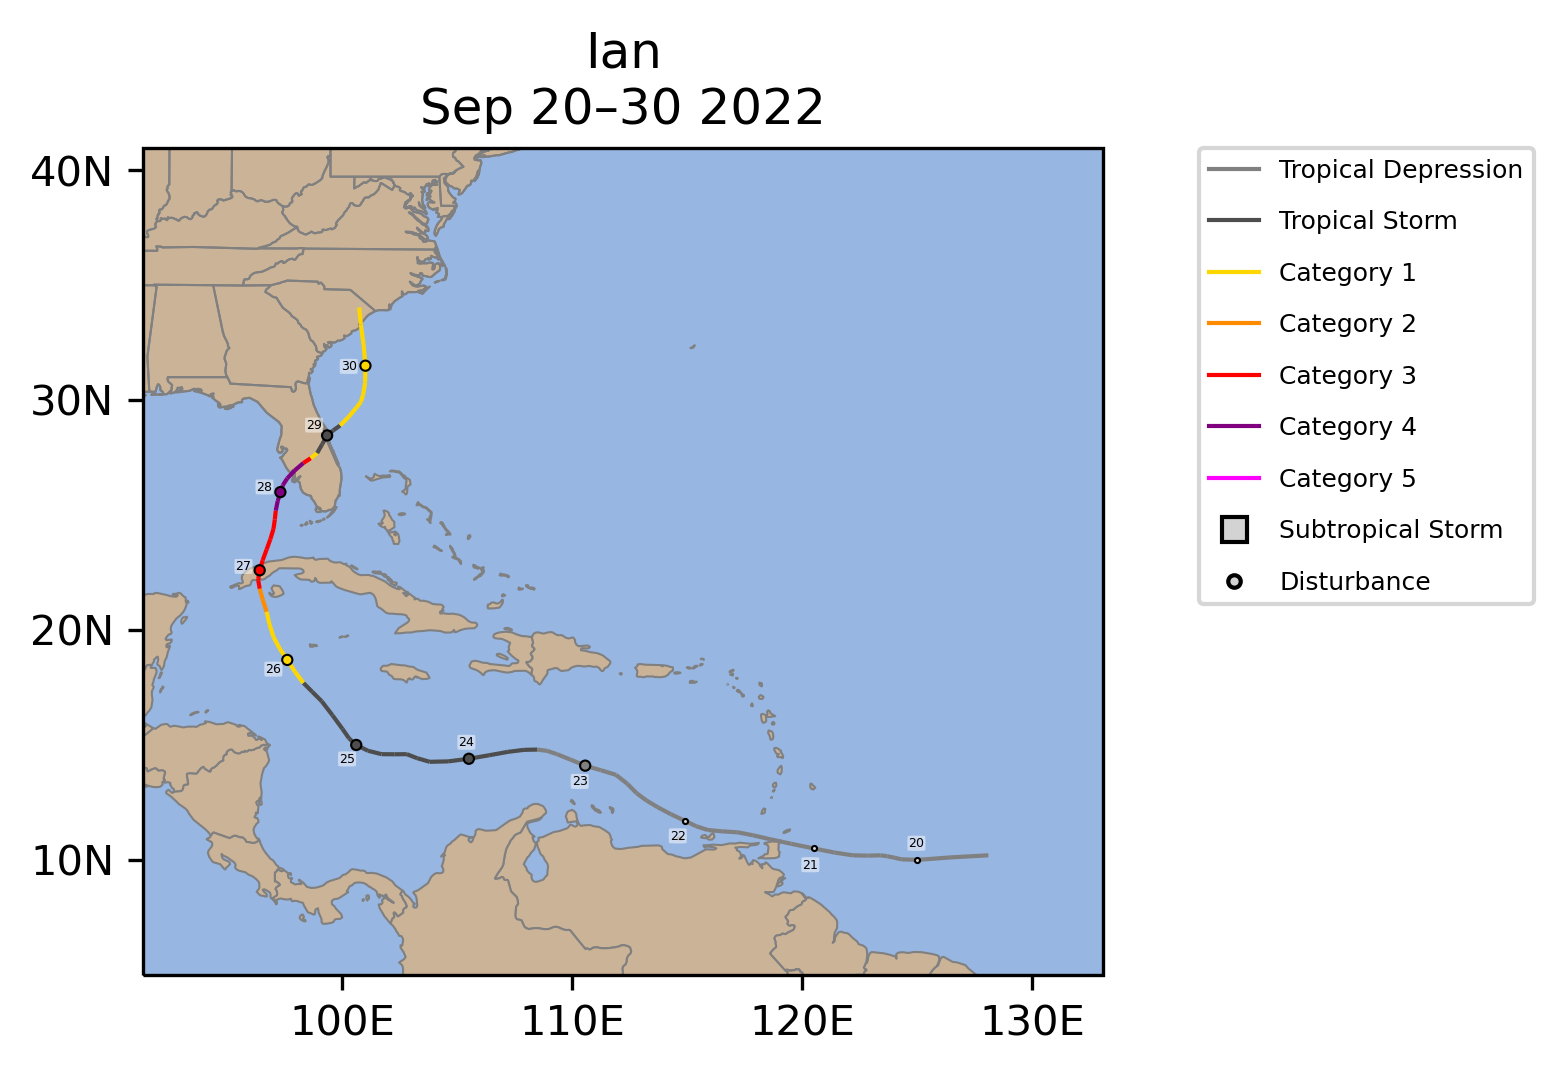
The North Atlantic was more active than normal during November. There were three named storms in November including Hurricane Lisa, which developed in late October and became a hurricane in November. All three storms became hurricanes. Hurricane Nicole brought heavy rain and flooding to Florida, which was still recovering from Hurricane Ian a few weeks earlier. Nicole was the first hurricane to make landfall in Florida during November since Kate in 1985. Overall, the Atlantic Hurricane Season for January-November was near normal.
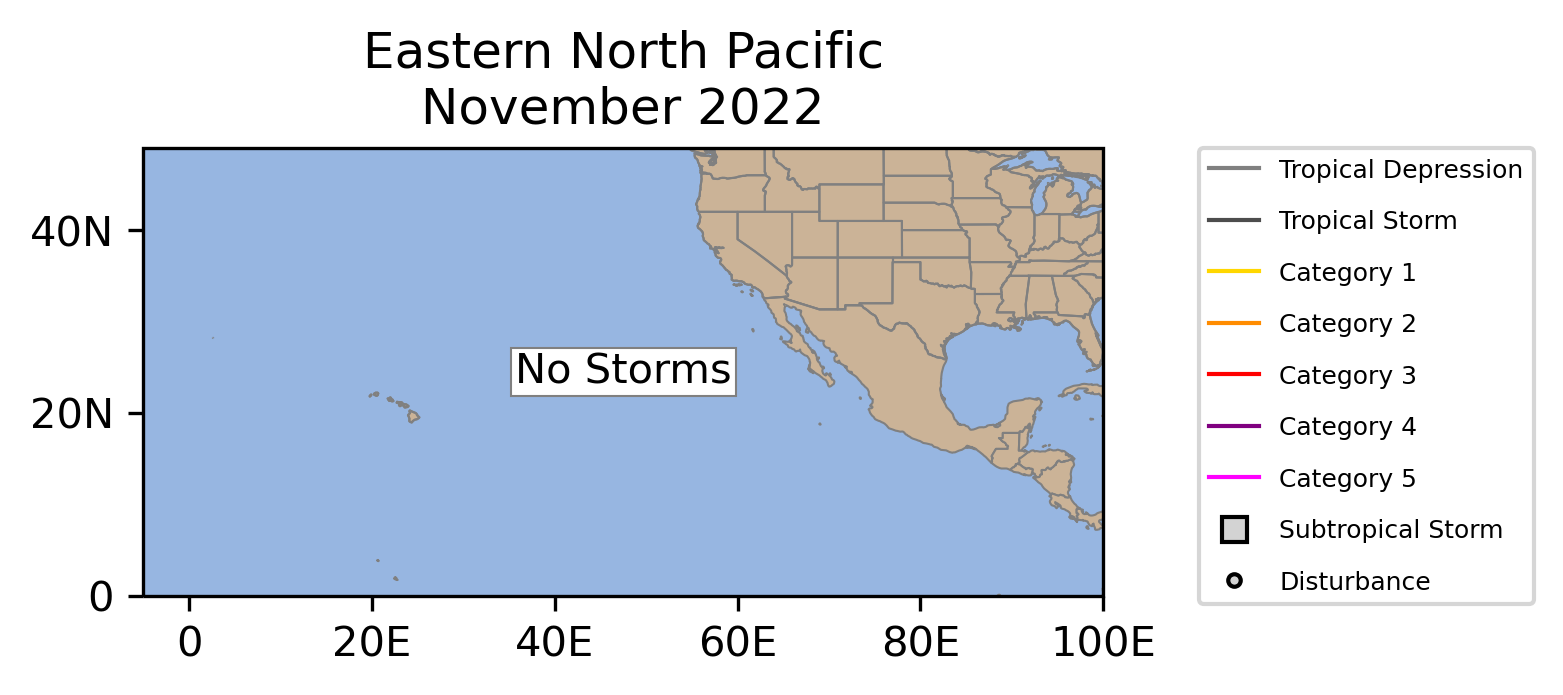
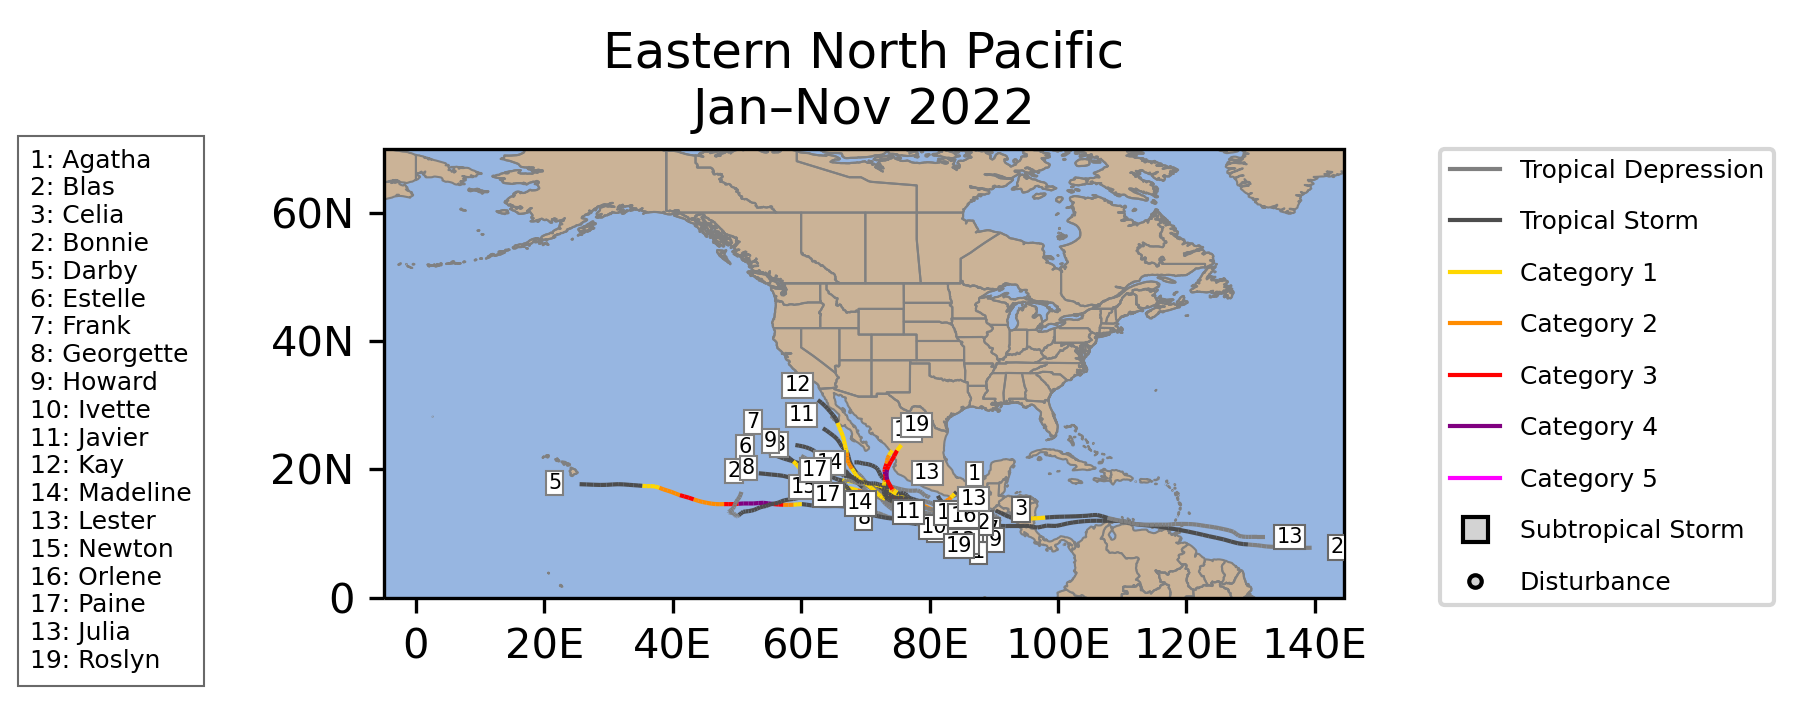
No storms were active in the East Pacific during November for the first time since 2017. However, this lack of activity was normal with 20 of the last 42 years having no storms. Overall, the East Pacific Hurricane Season for January-November was above normal in terms of named storms and hurricanes. It was also near the 1991-2020 averages for major hurricanes and ACE.
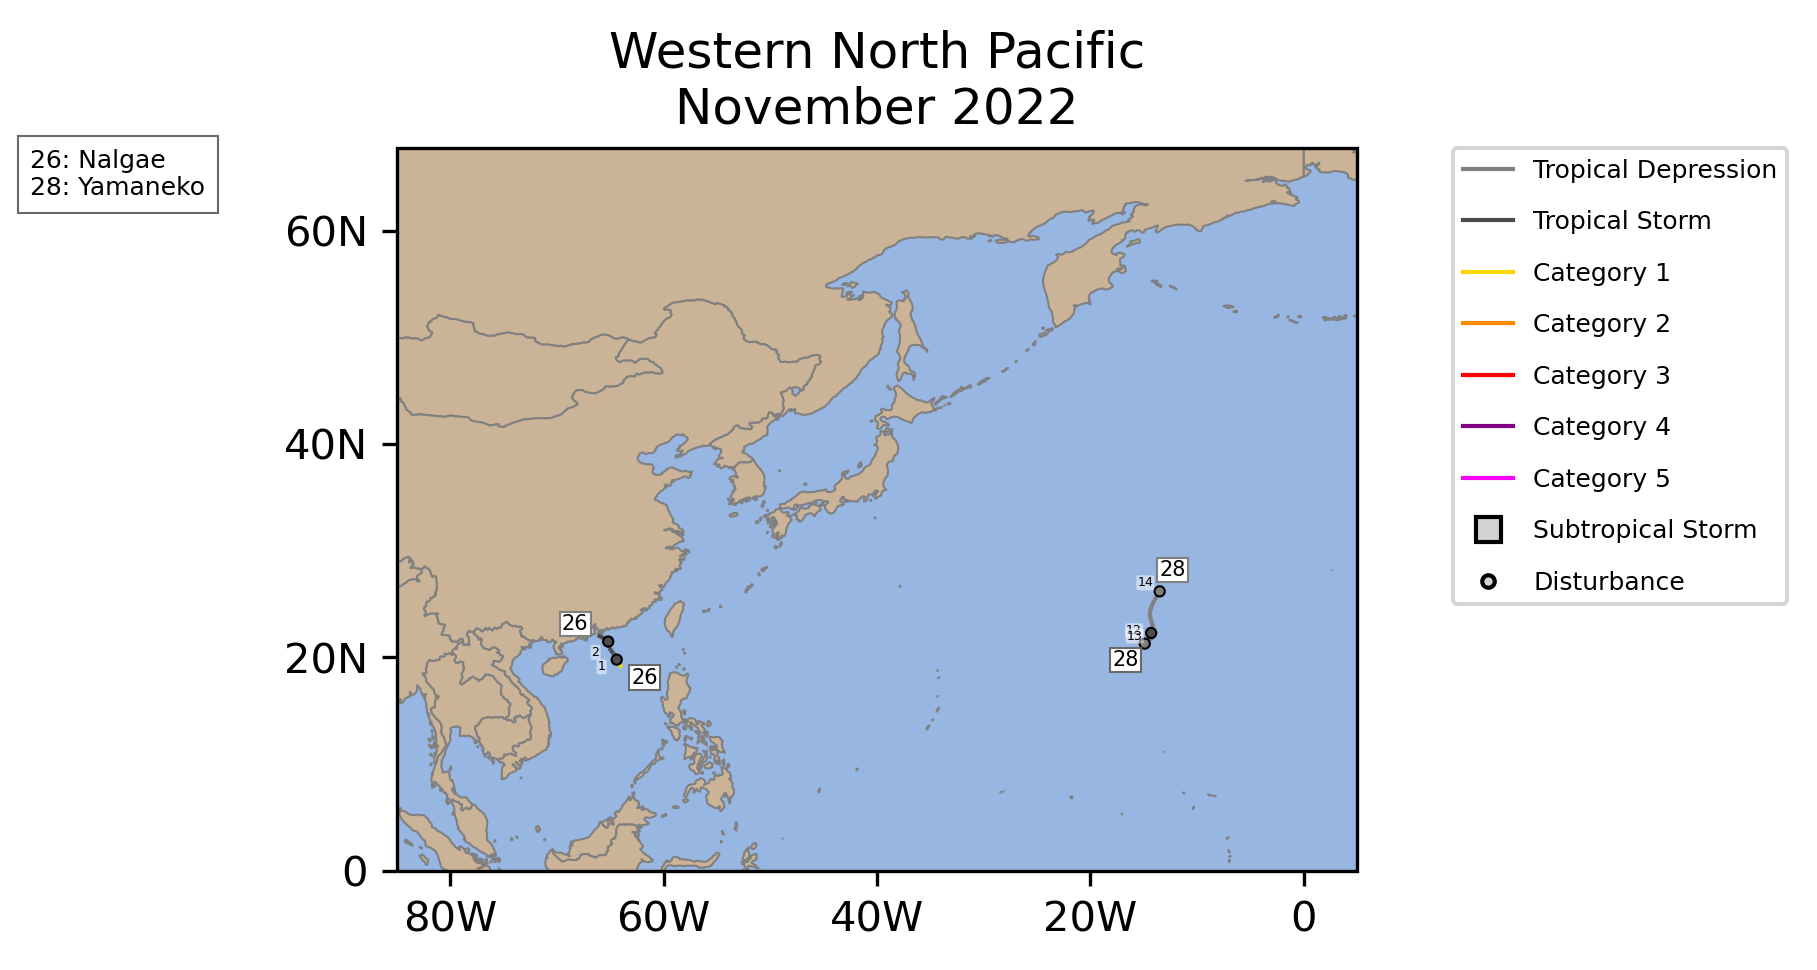
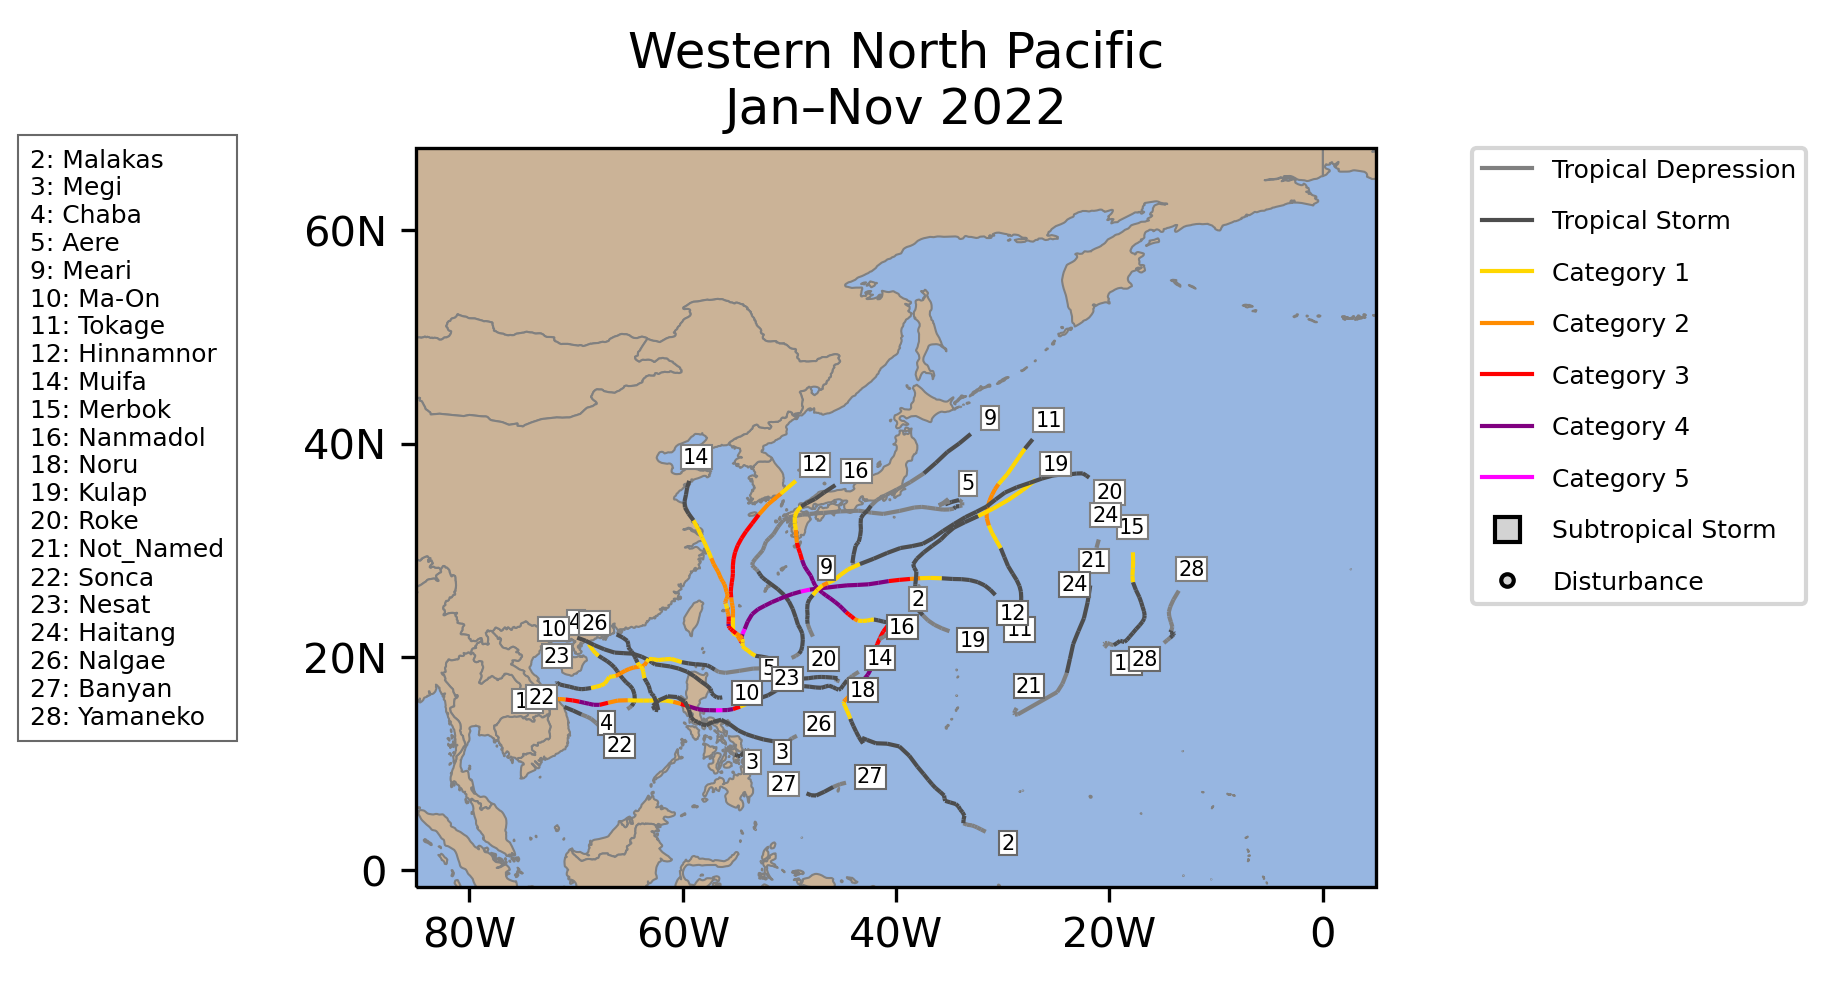
The West Pacific had two named storms including one typhoon. These numbers and the lack of any major typhoons were both below normal. The ACE for November was about one-tenth of the 1991-2020 average. The activity metrics for January-November are also below average.
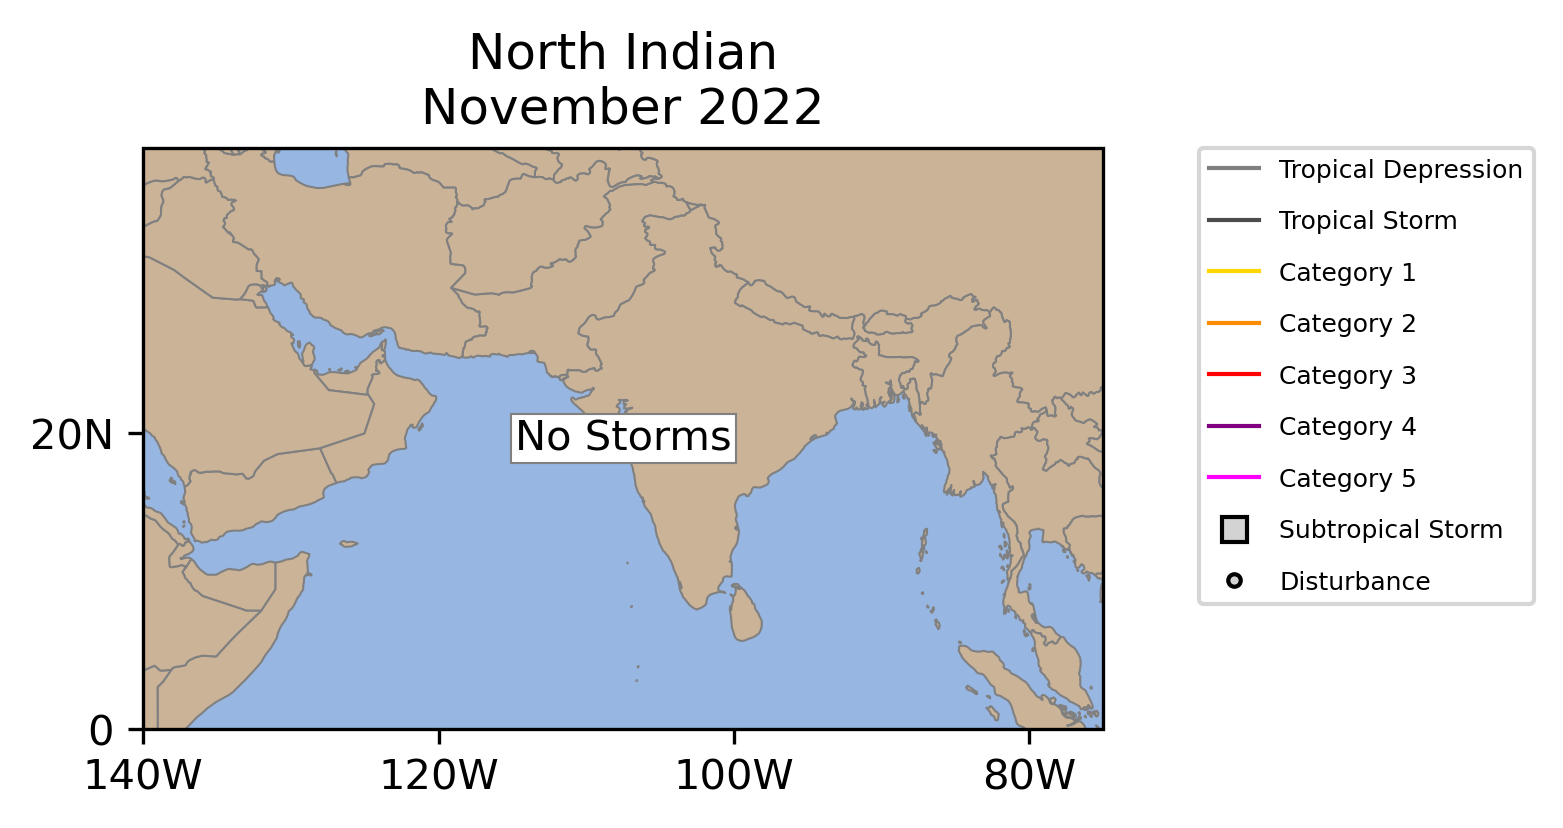
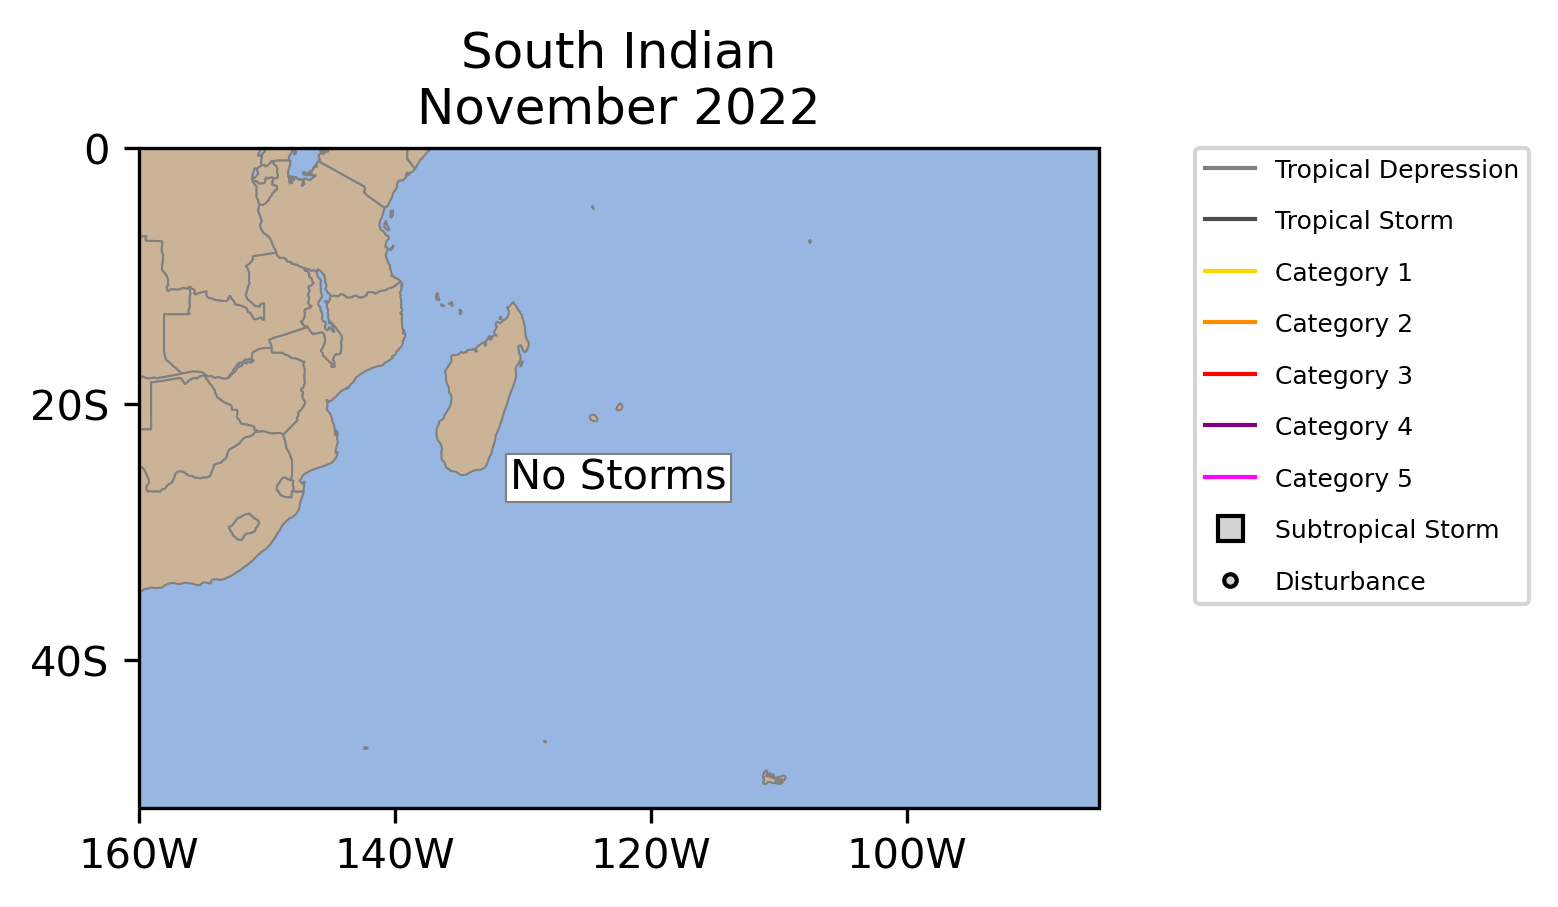
No storms formed in the North Indian Ocean during November, which has only happened in four other Novembers since 1981. Only one storm was active in any of the Southern Hemisphere basins: a short-lived unnamed tropical storm to the southwest of Sumatra. However, the lack of activity in the Southern Hemisphere is not unusual for November.
North Atlantic
| Name |
Maximum CategoryMax Cat |
Dates >39 mph |
Maximum Sustained Winds | Minimum Central Pressure |
|---|---|---|---|---|
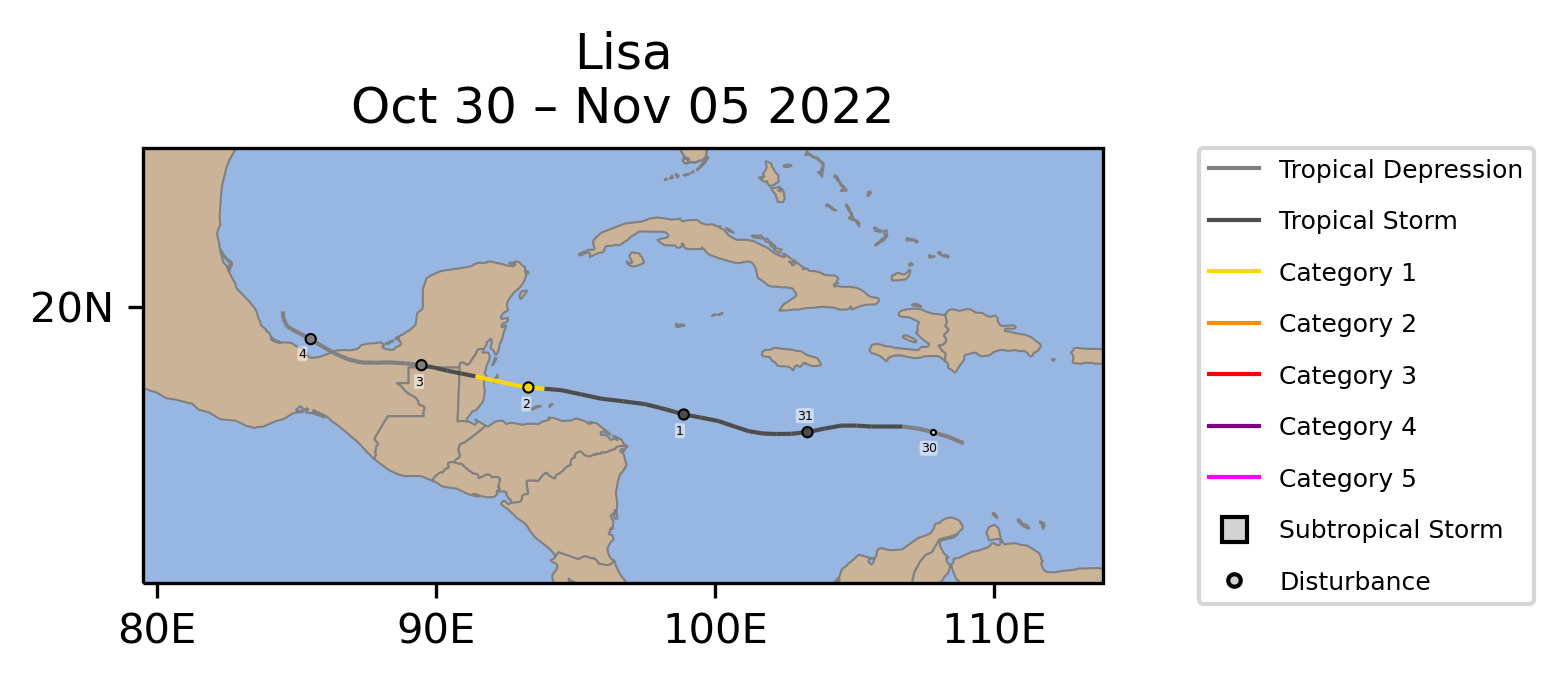 | 1 | October 31-November 3Oct 31-Nov 3 | 80 mph | 988 mb |
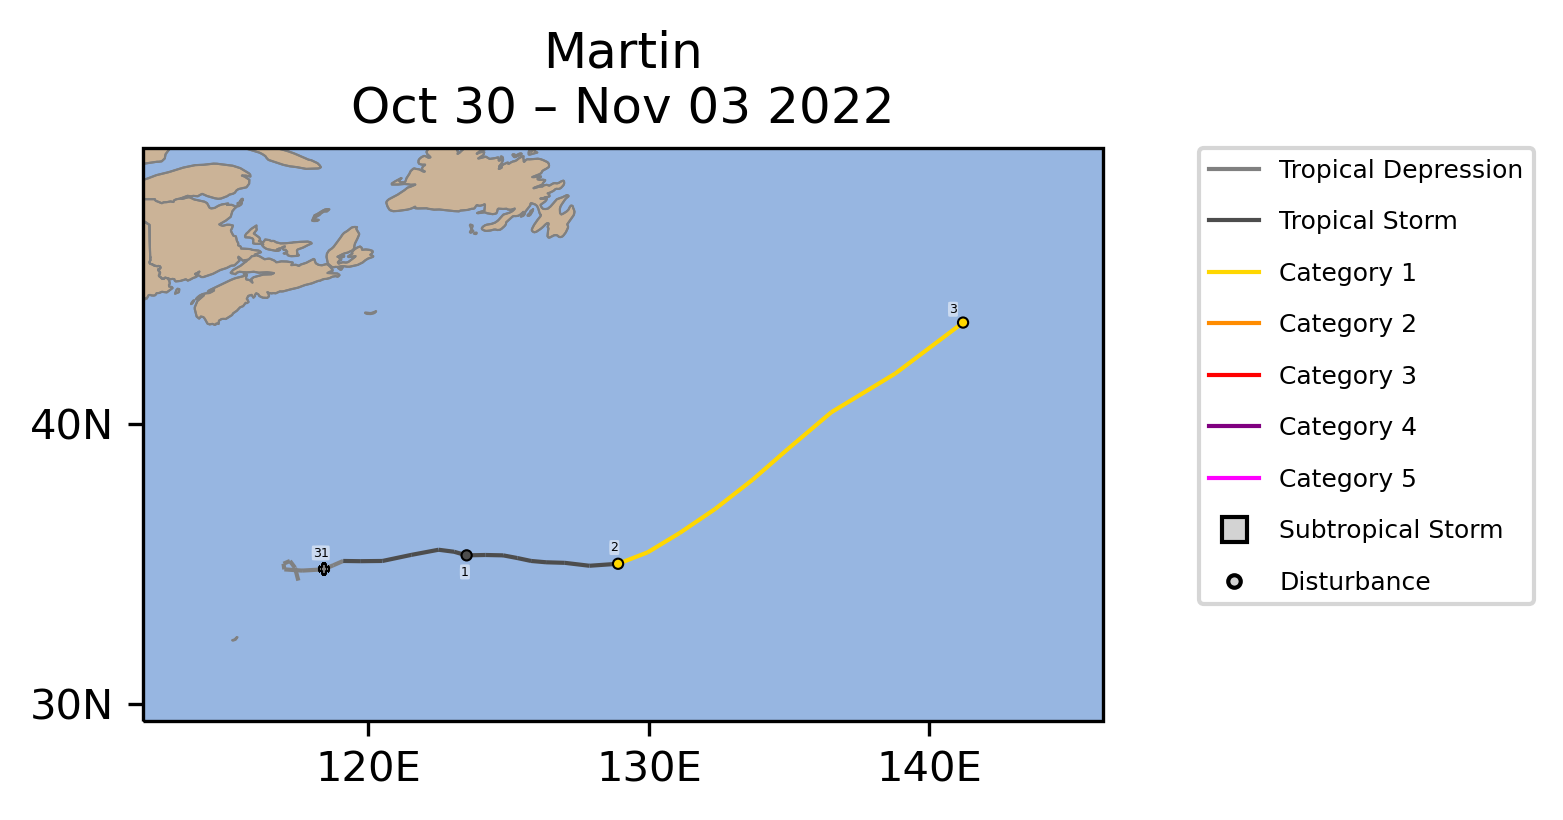 | 1 | November 1Nov 1-3 | 85 mph | 955 mb |
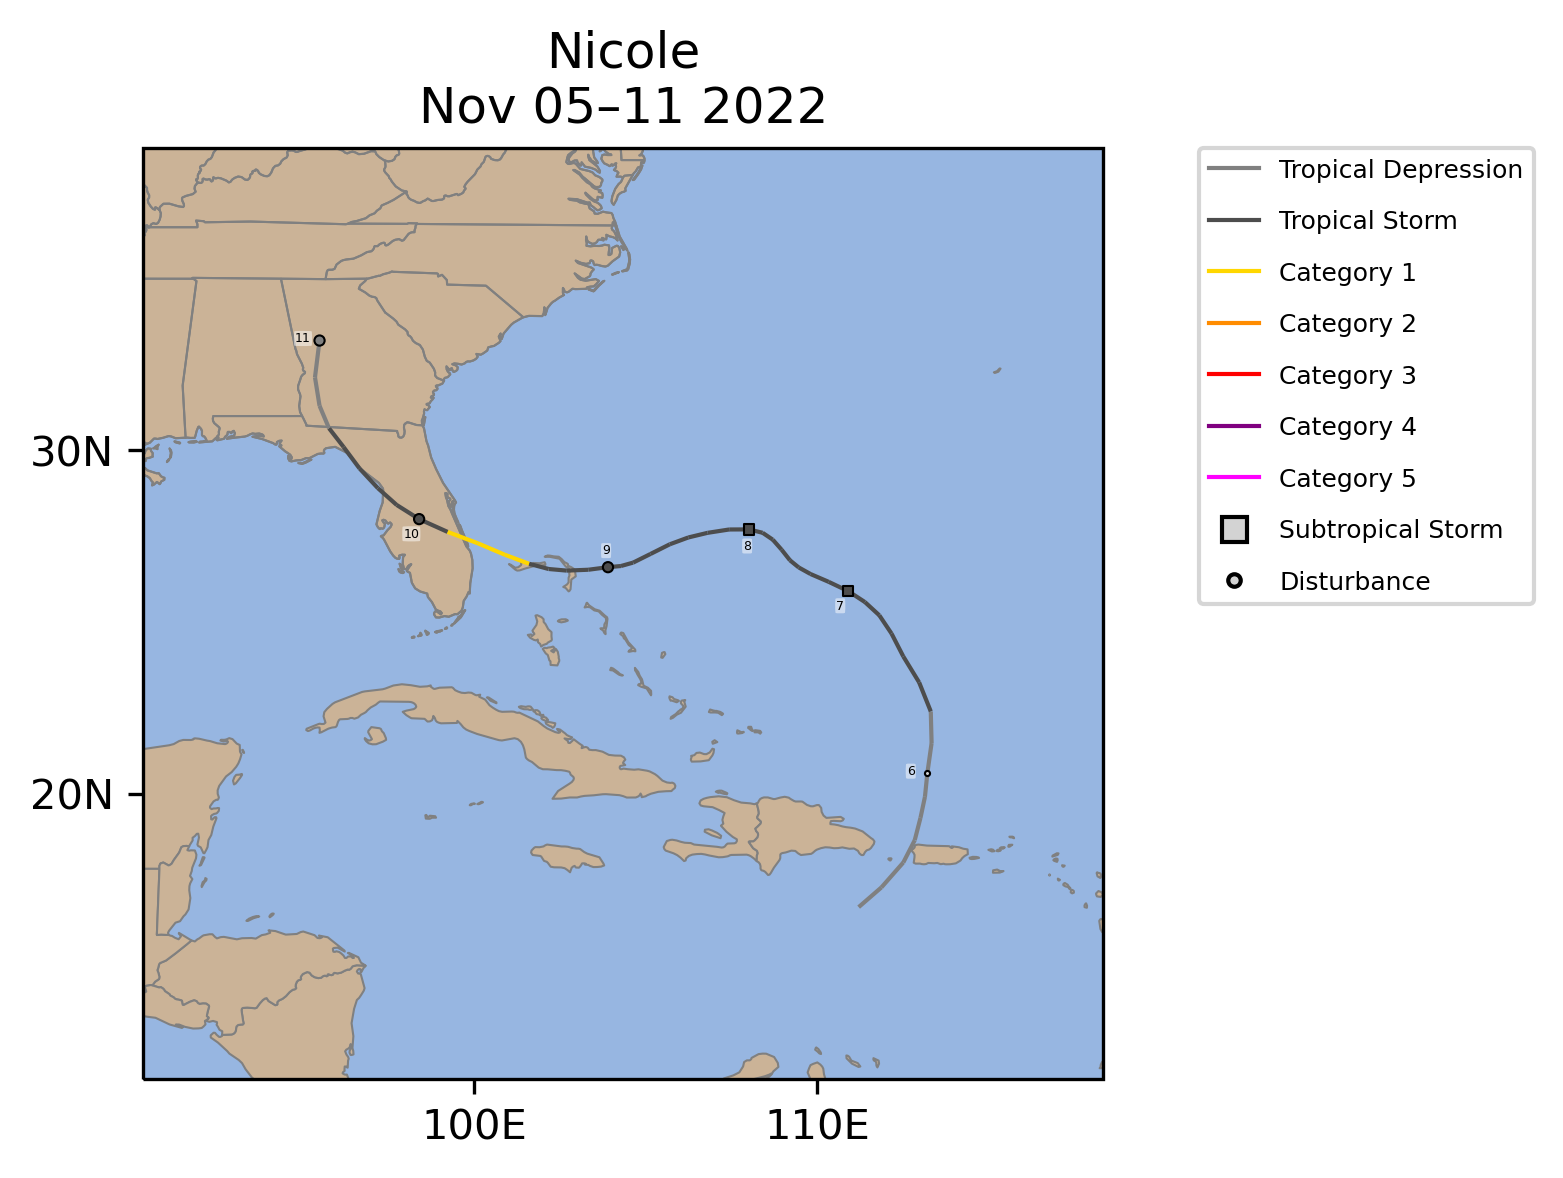 | 1 | November 7Nov 7-11 | 75 mph | 980 mb |
| Storm Type | Count | 1991-2020 Mean |
1981-2022 Rank* |
1851-2022 Record |
|---|---|---|---|---|
| Tropical Storm Winds ≥ 39 mph (34 kts) | 3 | 1.0 (10 in 10 Novembers) | 1st (tied with 4 other Novembers) | 4 (1961) |
| Hurricane Winds ≥ 74 mph (64 kts) | 3 | 0.6 (6 in 10 Novembers) | 1st (tied with 1 other November) | 3 (2001, 2022) |
| Major Hurricane Winds ≥ 111 mph (96 kts) | 0 | 0.2 (2 in 10 Novembers) | 7th (tied with 35 other Novembers) | 2 (2020) |
| Accumulated Cyclone Energy ACE×10⁴ kt² | 10.7 | 6.1 | 8th | 71.0 (1932) |

| Storm Type | Count | 1991-2020 Mean |
1981-2022 Rank* |
1851-2022 Record |
|---|---|---|---|---|
| Tropical Storm Winds ≥ 39 mph (34 kts) | 14 | 14.3 | 16th (tied with 4 other seasons) | 30 (2020) |
| Hurricane Winds ≥ 74 mph (64 kts) | 8 | 7.2 | 11th (tied with 5 other seasons) | 14 (2005, 2020) |
| Major Hurricane Winds ≥ 111 mph (96 kts) | 2 | 3.2 | 21st (tied with 10 other seasons) | 7 (2005, 2020) |
| Accumulated Cyclone Energy ACE×10⁴ kt² | 95.0 | 121.7 | 24th | 258.6 (1933) |

East Pacific
No East Pacific Tropical Cyclones occurred during November 2022.
| Storm Type | Count | 1991-2020 Mean |
1981-2022 Rank* |
1949-2022 Record |
|---|---|---|---|---|
| Tropical Storm Winds ≥ 39 mph (34 kts) | 0 | 0.7 (7 in 10 Novembers) | 22nd (tied with 20 other Novembers) | 2 (8 Novembers) |
| Hurricane Winds ≥ 74 mph (64 kts) | 0 | 0.3 (3 in 10 Novembers) | 10th (tied with 32 other Novembers) | 1 (12 Novembers) |
| Major Hurricane Winds ≥ 111 mph (96 kts) | 0 | 0.1 (1 in 10 Novembers) | 3rd (tied with 39 other Novembers) | 1 (2011, 2015) |
| Accumulated Cyclone Energy ACE×10⁴ kt² | 0.0 | 2.5 | 22nd (tied with 20 other Novembers) | 14.0 (2015) |
| Storm Type | Count | 1991-2020 Mean |
1981-2022 Rank* |
1949-2022 Record |
|---|---|---|---|---|
| Tropical Storm Winds ≥ 39 mph (34 kts) | 19 | 16.9 | 16th (tied with 4 other seasons) | 27 (1992) |
| Hurricane Winds ≥ 74 mph (64 kts) | 10 | 8.8 | 13th (tied with 5 other seasons) | 16 (1990, 1992, 2014, 2015) |
| Major Hurricane Winds ≥ 111 mph (96 kts) | 4 | 4.6 | 21st (tied with 4 other seasons) | 11 (2015) |
| Accumulated Cyclone Energy ACE×10⁴ kt² | 117.0 | 132.6 | 21st | 318.1 (2018) |
West Pacific
| Name |
Maximum CategoryMax Cat |
Dates >39 mph |
Maximum Sustained Winds | Minimum Central Pressure |
|---|---|---|---|---|
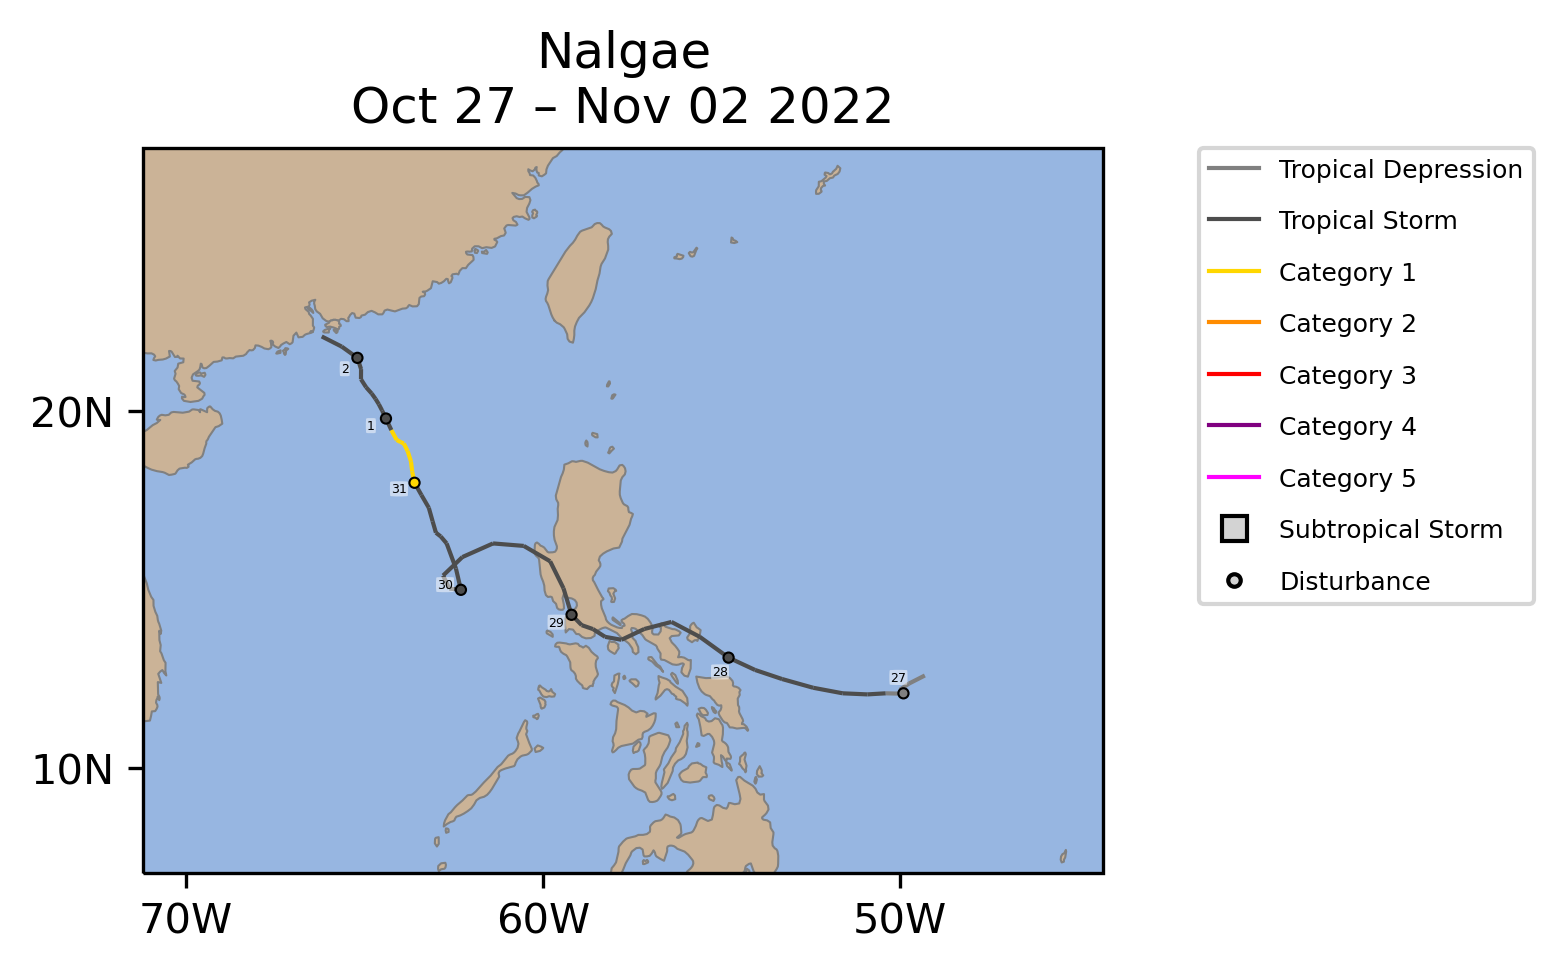 | 1 | October 27-November 2Oct 27-Nov 2 | 80 mph | 979 mb |
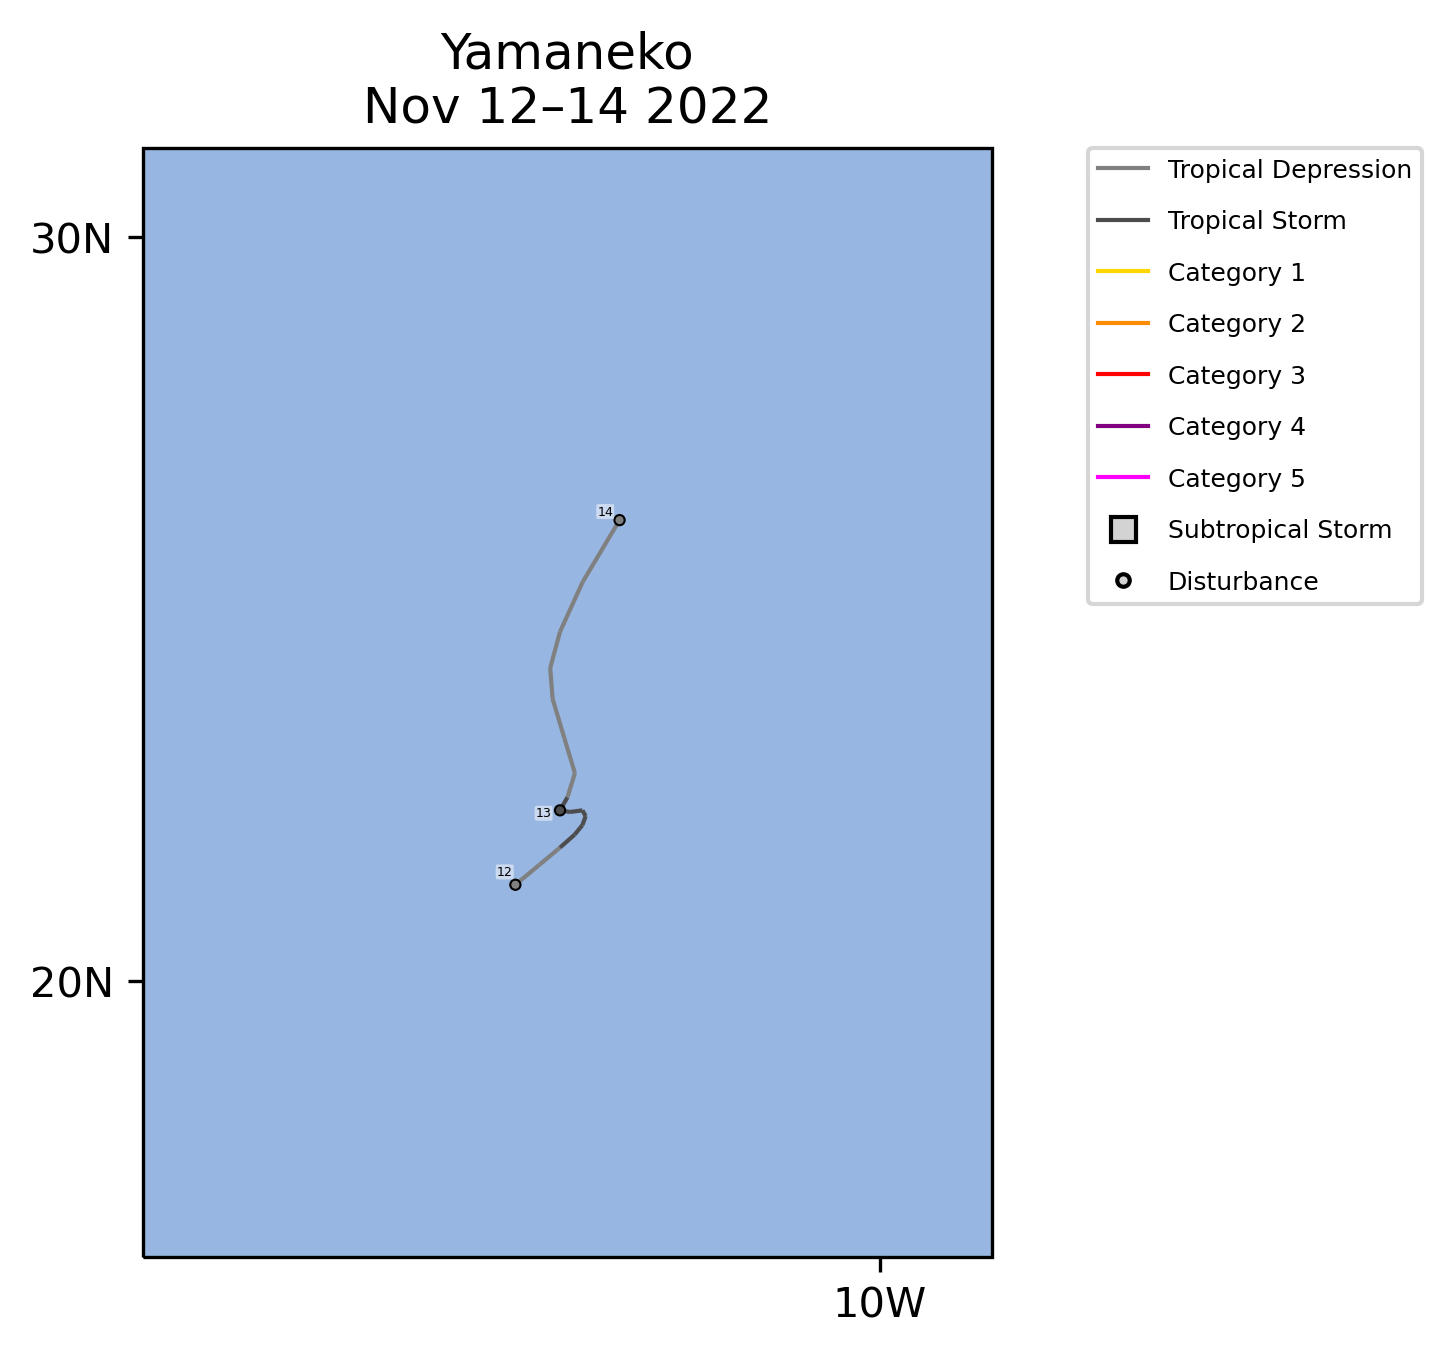 | TS | November 12Nov 12-13 | 40 mph | 1000 mb |
| Storm Type | Count | 1991-2020 Mean |
1981-2022 Rank* |
1945-2022 Record |
|---|---|---|---|---|
| Tropical Storm Winds ≥ 39 mph (34 kts) | 2 | 3.0 | 29th (tied with 7 other Novembers) | 7 (1947) |
| Typhoon Winds ≥ 74 mph (64 kts) | 1 | 1.8 | 26th (tied with 10 other Novembers) | 6 (2019) |
| Major Typhoon Winds ≥ 111 mph (96 kts) | 0 | 1.0 (10 in 10 Novembers) | 28th (tied with 14 other Novembers) | 4 (1947, 1952, 1954, 1992) |
| Accumulated Cyclone Energy ACE×10⁴ kt² | 2.8 | 29.8 | 37th | 130.9 (1954) |
| Storm Type | Count | 1991-2020 Mean |
1981-2022 Rank* |
1945-2022 Record |
|---|---|---|---|---|
| Tropical Storm Winds ≥ 39 mph (34 kts) | 21 | 25.2 | 35th (tied with 3 other seasons) | 37 (1964) |
| Typhoon Winds ≥ 74 mph (64 kts) | 12 | 15.6 | 32nd (tied with 4 other seasons) | 25 (1964, 1971) |
| Major Typhoon Winds ≥ 111 mph (96 kts) | 5 | 9.0 | 35th (tied with 3 other seasons) | 15 (1957, 1965, 2015) |
| Accumulated Cyclone Energy ACE×10⁴ kt² | 159.6 | 286.0 | 36th | 522.4 (1997) |
North Indian
No North Indian Tropical Cyclones occurred during November 2022.
| Storm Type | Count | 1991-2020 Mean |
1981-2022 Rank* |
1972-2022 Record |
|---|---|---|---|---|
| Tropical Storm Winds ≥ 39 mph (34 kts) | 0 | 1.6 | 38th (tied with 4 other Novembers) | 4 (1992, 2013) |
| Cyclone Winds ≥ 74 mph (64 kts) | 0 | 0.7 (7 in 10 Novembers) | 21st (tied with 21 other Novembers) | 2 (8 Novembers) |
| Major Cyclone Winds ≥ 111 mph (96 kts) | 0 | 0.3 (3 in 10 Novembers) | 10th (tied with 32 other Novembers) | 2 (2015, 2019) |
| Accumulated Cyclone Energy ACE×10⁴ kt² | 0.0 | 6.4 | 38th (tied with 4 other Novembers) | 25.5 (1992) |
| Storm Type | Count | 1991-2020 Mean |
1981-2022 Rank* |
1972-2022 Record |
|---|---|---|---|---|
| Tropical Storm Winds ≥ 39 mph (34 kts) | 5 | 4.8 | 10th (tied with 9 other seasons) | 10 (1992) |
| Cyclone Winds ≥ 74 mph (64 kts) | 1 | 1.9 | 19th (tied with 14 other seasons) | 6 (2019) |
| Major Cyclone Winds ≥ 111 mph (96 kts) | 0 | 1.0 | 25th (tied with 17 other seasons) | 5 (2019) |
| Accumulated Cyclone Energy ACE×10⁴ kt² | 8.0 | 21.8 | 31st | 89.7 (2019) |

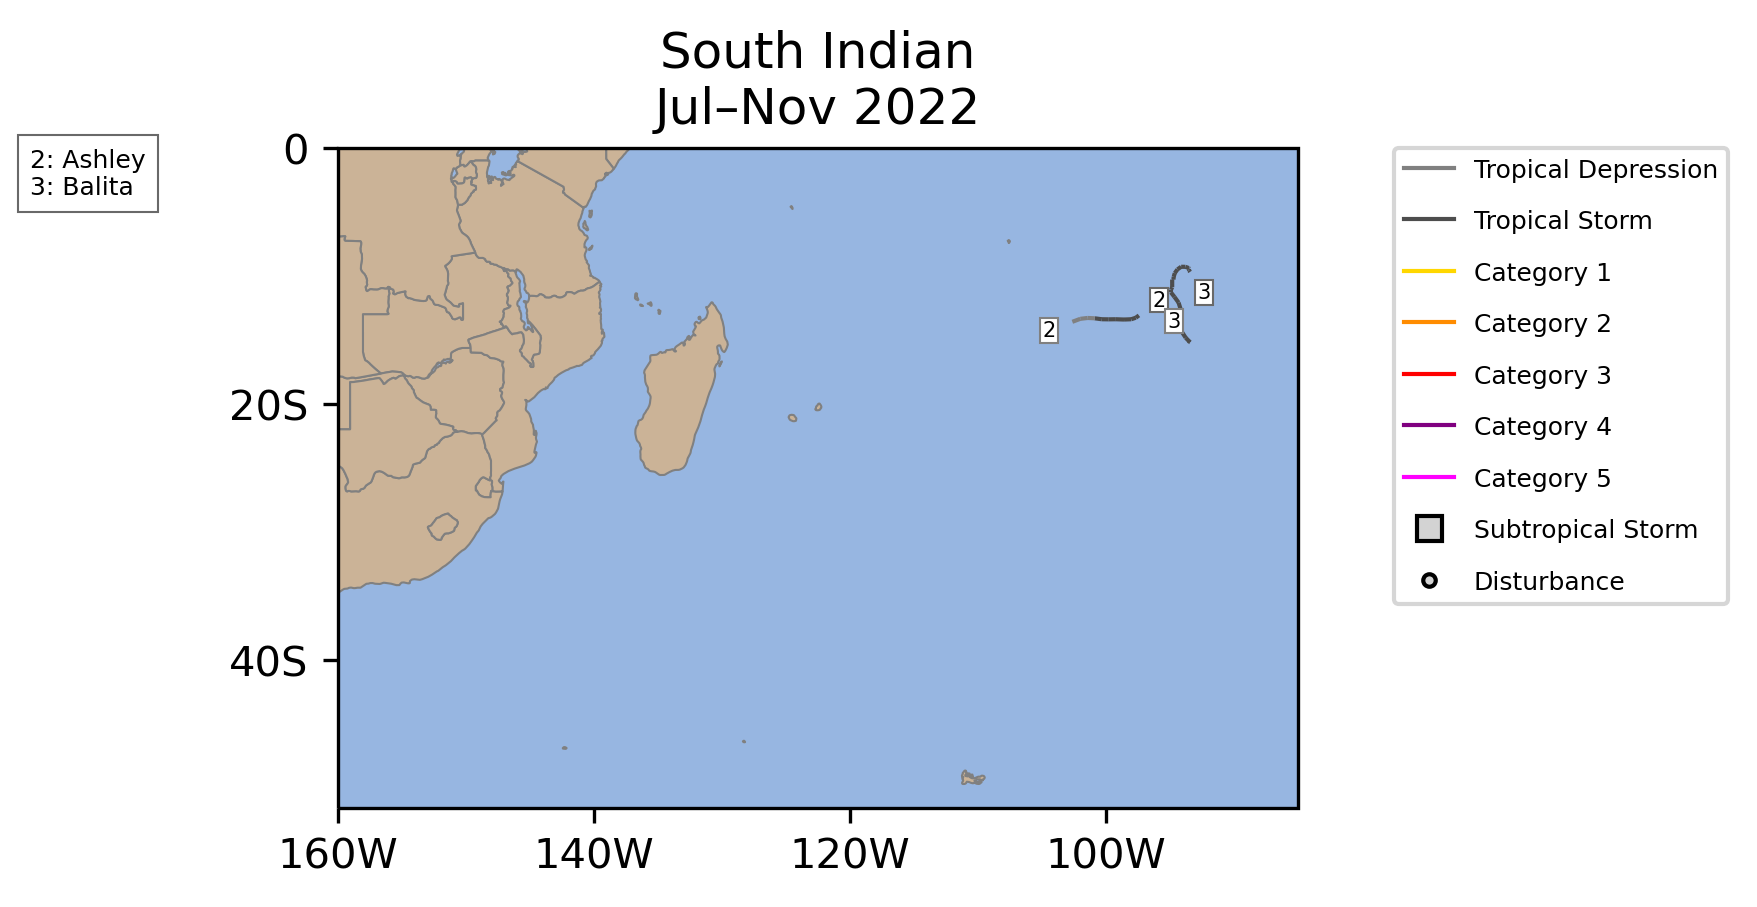
South Indian
No South Indian Tropical Cyclones occurred during November 2022.
| Storm Type | Count | 1991-2020 Mean |
1981-2022 Rank* |
1956-2022 Record |
|---|---|---|---|---|
| Tropical Storm Winds ≥ 39 mph (34 kts) | 0 | 1.0 (10 in 10 Novembers) | 27th (tied with 16 other Novembers) | 3 (1982) |
| Cyclone Winds ≥ 74 mph (64 kts) | 0 | 0.4 (4 in 10 Novembers) | 15th (tied with 28 other Novembers) | 2 (1982, 1989, 1997, 2005) |
| Major Cyclone Winds ≥ 111 mph (96 kts) | 0 | 0.3 (3 in 10 Novembers) | 10th (tied with 33 other Novembers) | 1 (10 Novembers) |
| Accumulated Cyclone Energy ACE×10⁴ kt² | 0.0 | 7.0 | 27th (tied with 16 other Novembers) | 38.5 (1997) |
| Storm Type | Count | 1991-2020 Mean |
1981-2022 Rank* |
1956-2022 Record |
|---|---|---|---|---|
| Tropical Storm Winds ≥ 39 mph (34 kts) | 2 | 1.7 | 9th (tied with 14 other seasons) | 5 (1997) |
| Cyclone Winds ≥ 74 mph (64 kts) | 0 | 0.5 (5 in 10 seasons) | 18th (tied with 25 other seasons) | 3 (1982, 1997) |
| Major Cyclone Winds ≥ 111 mph (96 kts) | 0 | 0.3 (3 in 10 seasons) | 11th (tied with 32 other seasons) | 1 (11 seasons) |
| Accumulated Cyclone Energy ACE×10⁴ kt² | 2.5 | 8.6 | 27th | 47.4 (1997) |
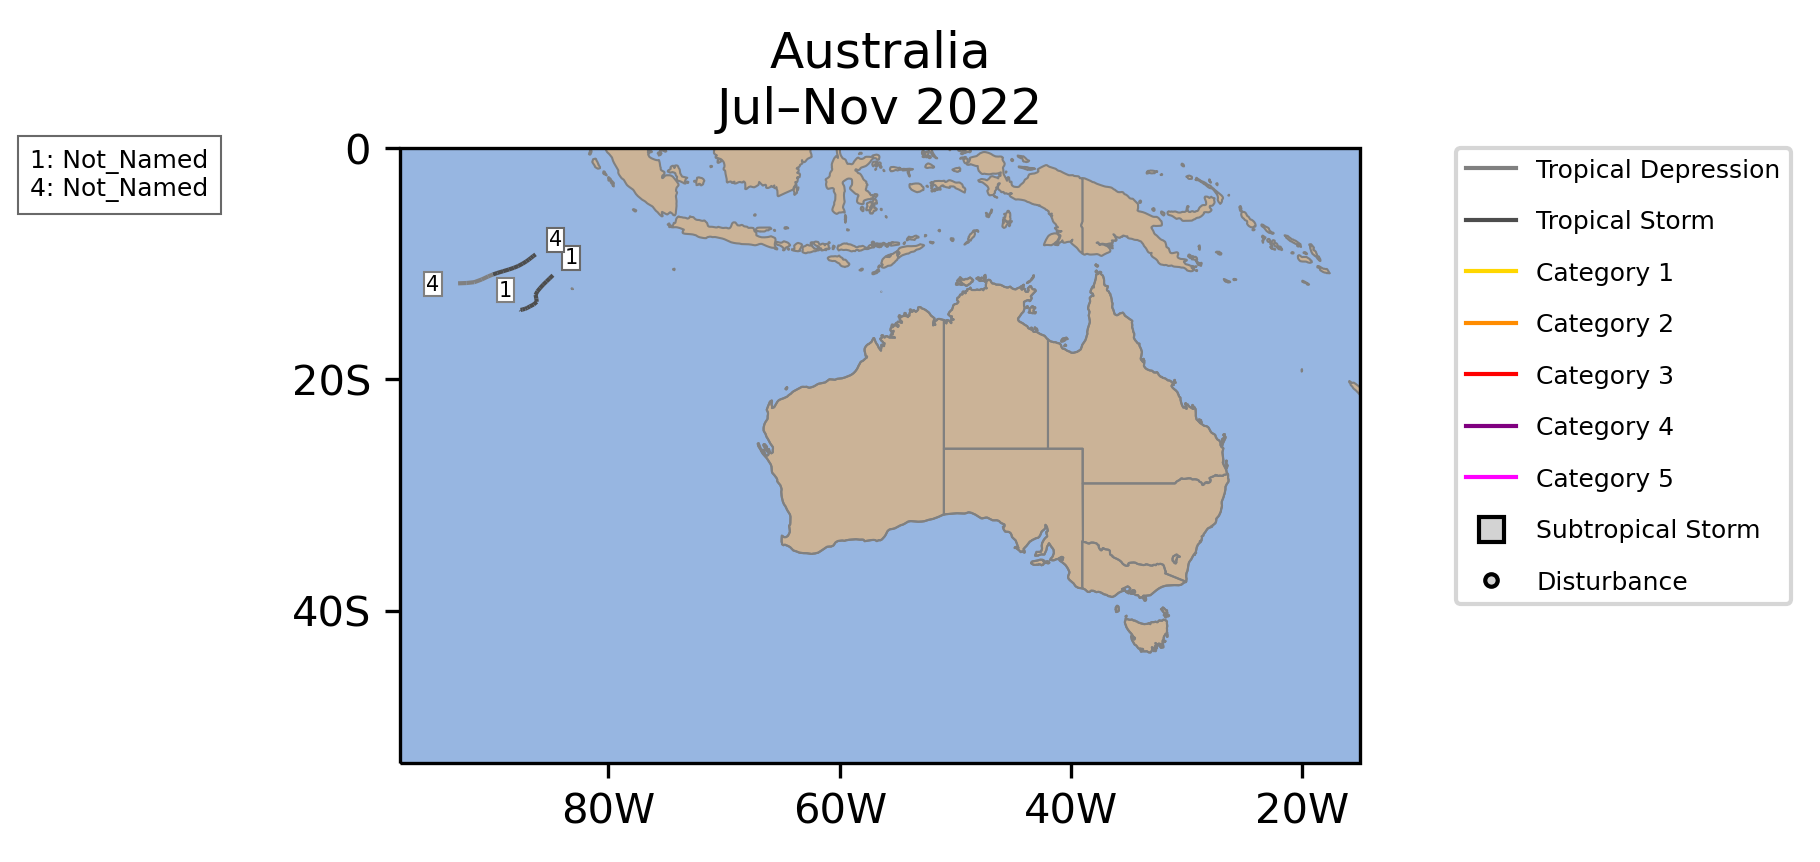
Australia
| Name |
Maximum CategoryMax Cat |
Dates >39 mph |
Maximum Sustained Winds | Minimum Central Pressure |
|---|---|---|---|---|
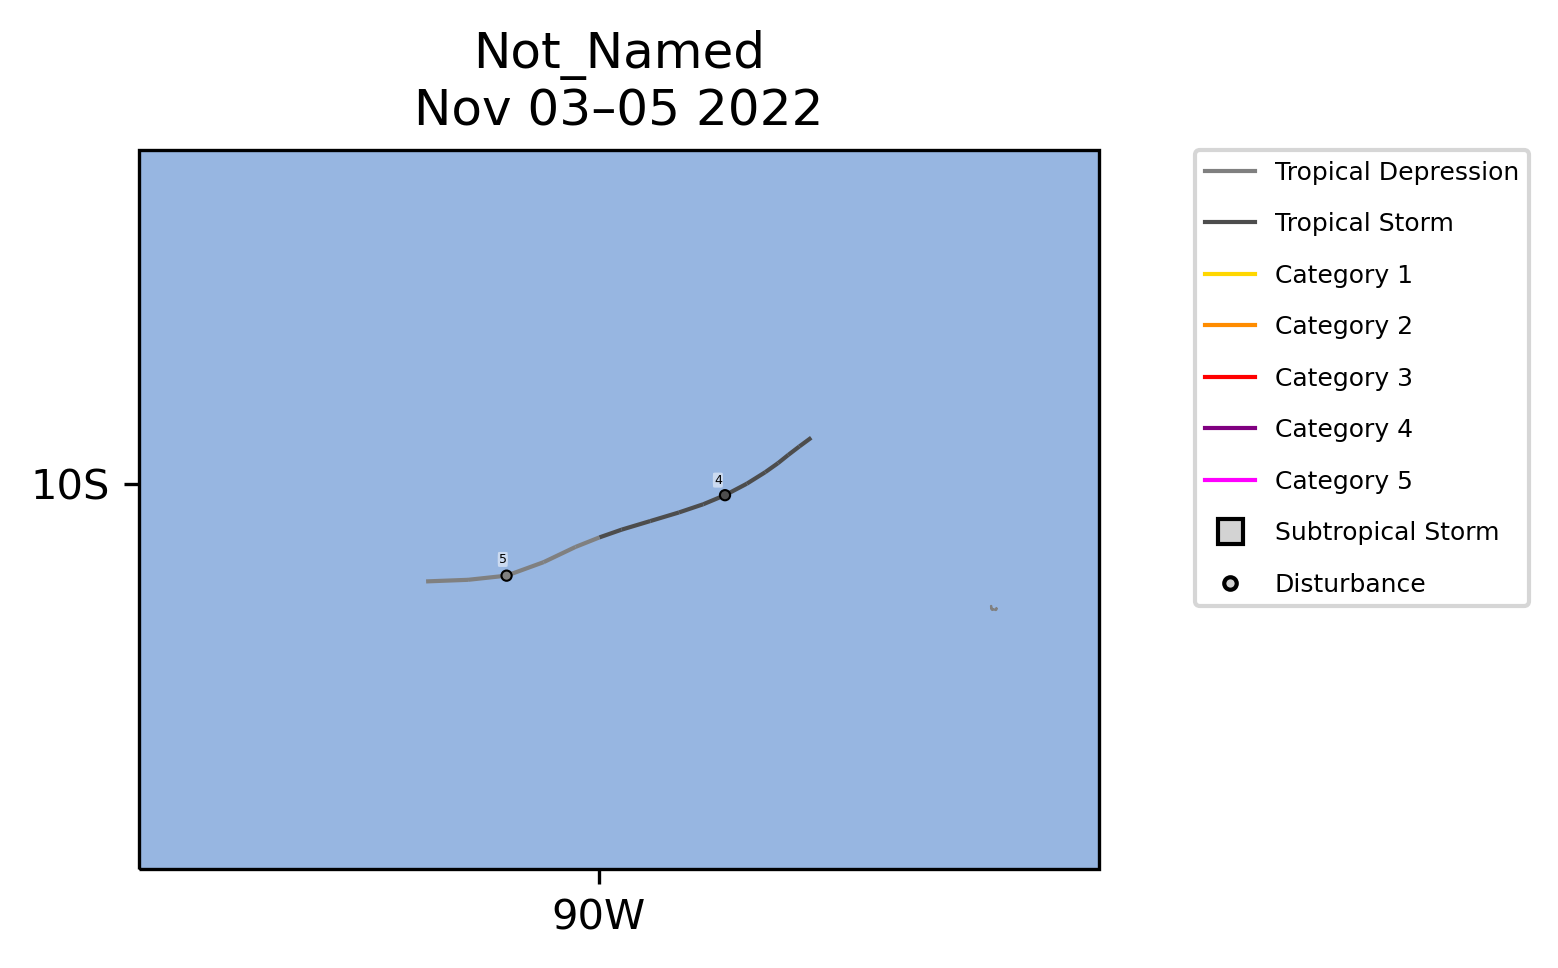 | TS | November 3Nov 3-5 | 40 mph | 1004 mb |
| Storm Type | Count | 1991-2020 Mean |
1981-2022 Rank* |
1956-2022 Record |
|---|---|---|---|---|
| Tropical Storm Winds ≥ 39 mph (34 kts) | 1 | 0.5 (5 in 10 Novembers) | 7th (tied with 11 other Novembers) | 3 (1984) |
| Tropical Cyclone Winds ≥ 74 mph (64 kts) | 0 | 0.2 (2 in 10 Novembers) | 8th (tied with 35 other Novembers) | 1 (7 Novembers) |
| Major Tropical Cyclone Winds ≥ 111 mph (96 kts) | 0 | 0.0 (0 in 10 Novembers) | 2nd (tied with 41 other Novembers) | 1 (2006) |
| Accumulated Cyclone Energy ACE×10⁴ kt² | 0.7 | 1.4 | 17th | 11.8 (2006) |

| Storm Type | Count | 1991-2020 Mean |
1981-2022 Rank* |
1956-2022 Record |
|---|---|---|---|---|
| Tropical Storm Winds ≥ 39 mph (34 kts) | 2 | 0.8 (8 in 10 seasons) | 5th (tied with 5 other seasons) | 4 (1984) |
| Tropical Cyclone Winds ≥ 74 mph (64 kts) | 0 | 0.2 (2 in 10 seasons) | 8th (tied with 35 other seasons) | 2 (1984) |
| Major Tropical Cyclone Winds ≥ 111 mph (96 kts) | 0 | 0.0 (0 in 10 seasons) | 2nd (tied with 41 other seasons) | 1 (2006) |
| Accumulated Cyclone Energy ACE×10⁴ kt² | 2.2 | 1.7 | 12th | 11.8 (2006) |
Southwest Pacific
No Southwest Pacific Tropical Cyclones occurred during November 2022.
| Storm Type | Count | 1991-2020 Mean |
1981-2022 Rank* |
1956-2022 Record |
|---|---|---|---|---|
| Tropical Storm Winds ≥ 39 mph (34 kts) | 0 | 0.4 (4 in 10 Novembers) | 12th (tied with 31 other Novembers) | 3 (1998) |
| Tropical Cyclone Winds ≥ 74 mph (64 kts) | 0 | 0.2 (2 in 10 Novembers) | 6th (tied with 37 other Novembers) | 3 (1998) |
| Major Tropical Cyclone Winds ≥ 111 mph (96 kts) | 0 | 0.1 (1 in 10 Novembers) | 3rd (tied with 40 other Novembers) | 1 (1991, 1998) |
| Accumulated Cyclone Energy ACE×10⁴ kt² | 0.0 | 1.5 | 12th (tied with 31 other Novembers) | 17.2 (1998) |
| Storm Type | Count | 1991-2020 Mean |
1981-2022 Rank* |
1956-2022 Record |
|---|---|---|---|---|
| Tropical Storm Winds ≥ 39 mph (34 kts) | 0 | 0.6 (6 in 10 seasons) | 14th (tied with 29 other seasons) | 5 (1998) |
| Tropical Cyclone Winds ≥ 74 mph (64 kts) | 0 | 0.2 (2 in 10 seasons) | 6th (tied with 37 other seasons) | 3 (1998) |
| Major Tropical Cyclone Winds ≥ 111 mph (96 kts) | 0 | 0.1 (1 in 10 seasons) | 4th (tied with 39 other seasons) | 1 (1991, 1998, 2007) |
| Accumulated Cyclone Energy ACE×10⁴ kt² | 0.0 | 2.1 | 13th (tied with 30 other seasons) | 22.0 (1998) |

Global
| Name |
Maximum CategoryMax Cat |
Dates >39 mph |
Maximum Sustained Winds | Minimum Central Pressure |
|---|---|---|---|---|
| 1 | October 27-November 2Oct 27-Nov 2 | 80 mph | 979 mb |
| 1 | October 31-November 3Oct 31-Nov 3 | 80 mph | 988 mb |
| 1 | November 1Nov 1-3 | 85 mph | 955 mb |
| TS | November 3Nov 3-5 | 40 mph | 1004 mb |
| 1 | November 7Nov 7-11 | 75 mph | 980 mb |
| TS | November 12Nov 12-13 | 40 mph | 1000 mb |
| Storm Type | Count | 1991-2020 Mean |
1981-2022 Rank* |
1972-2022 Record |
|---|---|---|---|---|
| Tropical Storm Winds ≥ 39 mph (34 kts) | 6 | 7.6 | 28th (tied with 5 other Novembers) | 12 (2019, 2020) |
| Tropical Cyclone Winds ≥ 74 mph (64 kts) | 4 | 4.1 | 17th (tied with 8 other Novembers) | 9 (2019) |
| Major Tropical Cyclone Winds ≥ 111 mph (96 kts) | 0 | 1.8 | 36th (tied with 6 other Novembers) | 5 (1992, 2020) |
| Accumulated Cyclone Energy ACE×10⁴ kt² | 14.2 | 54.4 | 39th | 150.6 (1992) |
| Storm Type | Count | 1991-2020 Mean |
1981-2022 Rank* |
1972-2022 Record |
|---|---|---|---|---|
| Tropical Storm Winds ≥ 39 mph (34 kts) | 74 | 82.8 | 33rd (tied with 2 other seasons) | 99 (2020) |
| Tropical Cyclone Winds ≥ 74 mph (64 kts) | 35 | 45.1 | 40th (tied with 2 other seasons) | 57 (1990) |
| Major Tropical Cyclone Winds ≥ 111 mph (96 kts) | 15 | 24.2 | 39th (tied with 1 other season) | 38 (2015) |
| Accumulated Cyclone Energy ACE×10⁴ kt² | 475.1 | 740.8 | 42nd | 1,113.0 (1992) |
Data Description
The data in this report are derived from NCEI's IBTrACS dataset (Knapp et al. 2010; Schreck et al. 2014). IBTrACS tropical cyclone track and intensity data from agencies and sources around the globe. In this report, data from NOAA's National Hurricane Center (NHC) are used for the North Atlantic and East Pacific. The other basins use data from the U.S. Military's Joint Typhoon Warning Center (JTWC).
Historical values use the "best track" data that have been analyzed by forecasters after the season using all available data. Operational procedures and observing systems have changed with time and between regions, which makes these data heterogeneous. Intensity data are generally the most reliable since the early 1970s in the Atlantic (Landsea and Franklin 2013) and since the mid-1980s in other regions (Chu et al. 2002). The number of short-lived storms (≤2 days) has also increased since around 2000 due to improvements in observations and analysis techniques (Landsea et al. 2010).
Values for the current year are provisional values from the operational forecast advisories. IBTrACS obtains these from NCEP's TC Vitals, the NCAR Tropical Cyclone Guidance Project, and NHC provisional data. These values are subject to change during the post-season best track analysis. They also only include 6-hourly storm fixes, which means they may miss special advisories at landfall, peak intensity, etc.
The tropical cyclone seasons in the Southern Hemisphere begin in July and end in June, while the Northern Hemisphere seasons are counted from January to December. Storms are counted in all basins, months, and years in which they occur, which means some storms may appear more than once. However, the global totals only include each storm one time.
References
- Chu, J.-H., C. R. Sampson, A. S. Levine, and E. Fukada, 2002: The joint typhoon warning center tropical cyclone best-tracks, 1945–2000. Naval Research Laboratory, Reference Number NRL/MR/7540-02-16, 22 pp., https://www.metoc.navy.mil/jtwc/products/best-tracks/tc-bt-report.html.
- Knapp, K. R., M. C. Kruk, D. H. Levinson, H. J. Diamond, and C. J. Neumann, 2010: The International Best Track Archive for Climate Stewardship (IBTrACS). Bull. Amer. Meteor. Soc., 91, 363–376, https://doi.org/10.1175/2009BAMS2755.1.
- Landsea, C. W., and J. L. Franklin, 2013: Atlantic Hurricane database uncertainty and presentation of a new database format. Mon. Wea. Rev., 141, 3576–3592, https://doi.org/10.1175/MWR-D-12-00254.1.
- ——, G. A. Vecchi, L. Bengtsson, and T. R. Knutson, 2010: Impact of duration thresholds on Atlantic tropical cyclone counts. J. Climate, 23, 2508–2519, https://doi.org/10.1175/2009JCLI3034.1.
- Schreck, C. J., K. R. Knapp, and J. P. Kossin, 2014: The Impact of Best Track Discrepancies on Global Tropical Cyclone Climatologies using IBTrACS. Mon. Wea. Rev., 142, 3881–3899, https://doi.org/10.1175/MWR-D-14-00021.1.