Note: This report catalogs recent tropical cyclones across the North Atlantic and East Pacific and places each basin’s tropical cyclone activity in a climate-scale context. It is not updated in real time. Users seeking the real time status and forecasts of tropical cyclones should visit The National Hurricane Center.

The Atlantic continued its record-setting pace in September, which is the climatological peak of hurricane season. The 10 named storms that formed in September broke the previous record of eight, which happened in 2002, 2007, and 2010. Five named storms were active on September 14 alone—the first time since 1971 to have that many simultaneously. The season as a whole has produced 23 storms, which puts 2020 six storms ahead of the current record-holder, 2005, through September. However, as has been the case all year, many of the storms in September were weak or short-lived. Four of the ten named storms became hurricanes, but only one, Teddy, became a major hurricane. Similar to the rest of the season, half of the named storms lasted 3 days or less. As a result, the Accumulated Cyclone Energy (ACE), which measures the strength and duration of tropical storms and hurricanes, is about 20-25% above average and just on the cusp of the top one-third of years since 1981 for both September alone and the season as a whole.

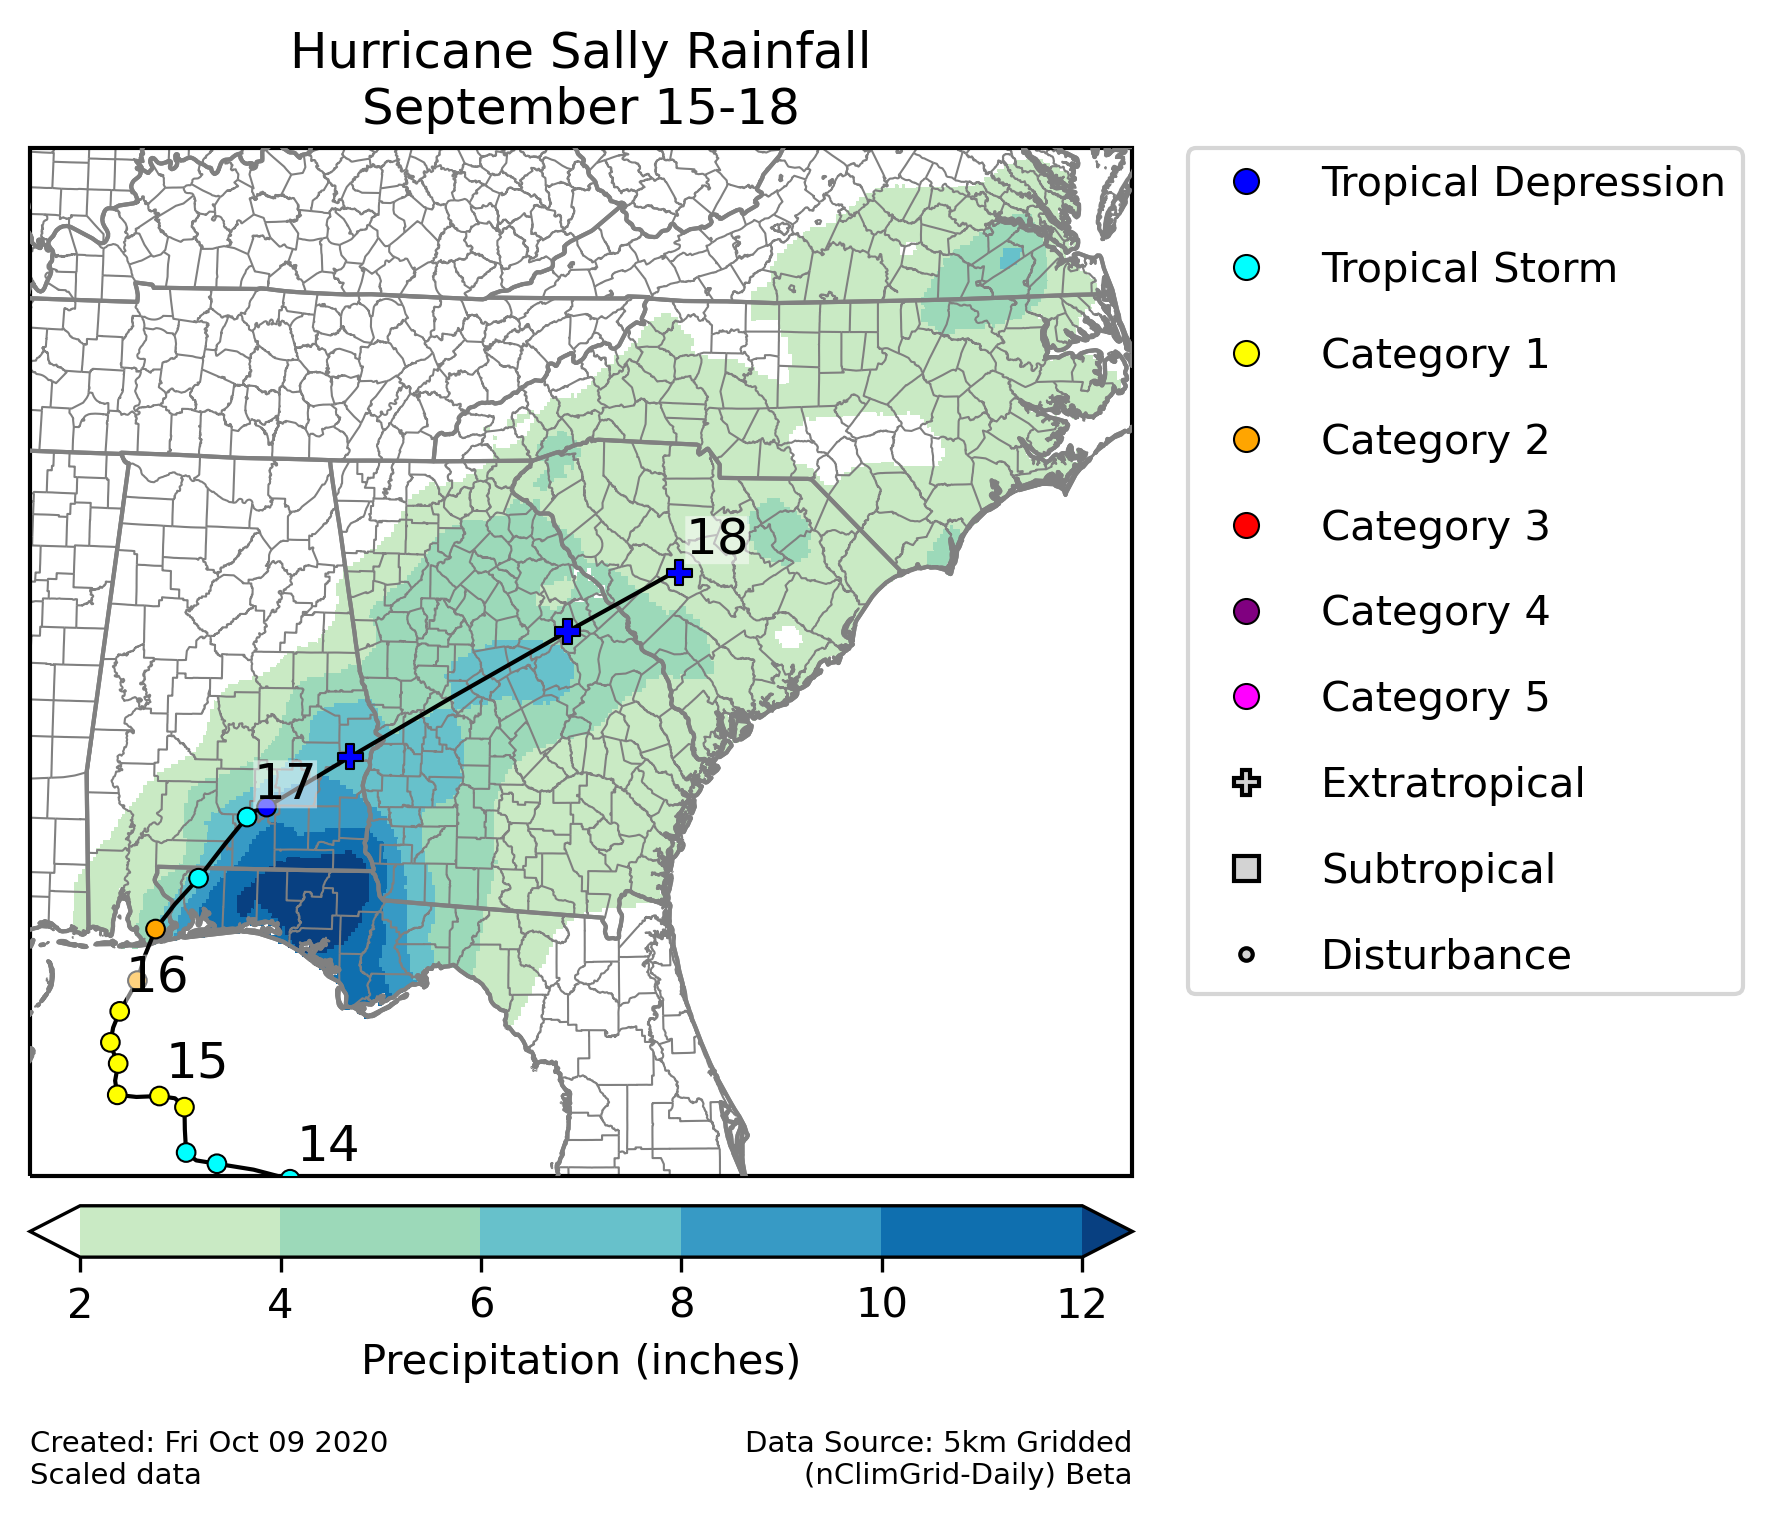
Hurricane Teddy was the strongest storm in September and the second major hurricane of the 2020 Atlantic hurricane season. It was a typical Cape Verde hurricane but it recurved northward and largely stayed out to sea until its landfall in Nova Scotia as an post-tropical storm with gale-force winds. Hurricane Sally was the fourth hurricane to make landfall over the contiguous U.S. in 2020. It came ashore in Alabama as a category 2 hurricane and brought heavy rain across the Southeast. The heaviest rain fell in the Florida Panhandle, but totals over 2 inches in four days were observed a swath extending to southeastern Virginia.

In contrast to the Atlantic, the East Pacific has remained unusually quiet in 2020. Four named storms developed during September, which is close to the 1981-2010 average of 3.6. However, none of them attained hurricane strength during the month. Hurricane Marie became a named storm on September 29 but became a hurricane on October 1. The season as a whole remains in the bottom third of years since 1981 for most metrics, and the ACE is less than half of its 1981-2010 mean value through September.

North Atlantic

September 2020 North Atlantic Tropical Cyclones
Name Maximum
Category
Max
Cat
Dates
>39 mph
Maximum Sustained Winds Minimum Central Pressure
Nana1September 1Sep 1-375 mph994 mb
OmarTSSeptember 2Sep 240 mph1003 mb
Paulette2September 7Sep 7-22105 mph965 mb
ReneTSSeptember 7Sep 7-1250 mph1000 mb
Sally2September 12Sep 12-17105 mph967 mb
Teddy4September 14Sep 14-23140 mph945 mb
VickyTSSeptember 14Sep 14-1750 mph1000 mb
WilfredTSSeptember 18Sep 18-2040 mph1007 mb
AlphaTSSeptember 18Sep 1850 mph998 mb
BetaTSSeptember 18Sep 18-2260 mph994 mb
North Atlantic Tropical Cyclone September Counts
Storm Type Count 1981-2010
Mean
1981-2020
Rank*
1851-2020
Record
Tropical Storm
Winds ≥ 39 mph (34 kts)
104.01st10
(2020)
Hurricane
Winds ≥ 74 mph (64 kts)
42.65th
(tied with 8 other Septembers)
5
(1981, 1998, 2000, 2005)
Major Hurricane
Winds ≥ 111 mph (96 kts)
11.316th
(tied with 16 other Septembers)
3
(1981, 1996, 2004, 2010, 2017)
Accumulated Cyclone Energy
ACE×10⁴ kt²
62.651.214th173.7
(2017)
Previous record 8 (2002, 2007, 2010)
North Atlantic Tropical Cyclone Season Counts January-September 2020
Storm Type Count 1981-2010
Mean
1981-2020
Rank*
1851-2020
Record
Tropical Storm
Winds ≥ 39 mph (34 kts)
239.21st23
(2020)
Hurricane
Winds ≥ 74 mph (64 kts)
84.72nd
(tied with 4 other seasons)
10
(2005)
Major Hurricane
Winds ≥ 111 mph (96 kts)
22.212th
(tied with 12 other seasons)
6
(2004)
Accumulated Cyclone Energy
ACE×10⁴ kt²
104.083.513th219.0
(2004)
Previous record 17 (2005, 2011)

East Pacific

September 2020 East Pacific Tropical Cyclones
Name Maximum
Category
Max
Cat
Dates
>39 mph
Maximum Sustained Winds Minimum Central Pressure
JulioTSSeptember 5Sep 5-645 mph1004 mb
KarinaTSSeptember 13Sep 13-1660 mph996 mb
LowellTSSeptember 21Sep 21-2550 mph999 mb
Marie4September 29-October 6Sep 29-Oct 6130 mph948 mb
Value occurred in October
East Pacific Tropical Cyclone September Counts
Storm Type Count 1981-2010
Mean
1981-2020
Rank*
1949-2020
Record
Tropical Storm
Winds ≥ 39 mph (34 kts)
43.615th
(tied with 8 other Septembers)
6
(1992, 1994, 1997, 2001, 2005, 2019)
Hurricane
Winds ≥ 74 mph (64 kts)
02.337th
(tied with 3 other Septembers)
6
(1992)
Major Hurricane
Winds ≥ 111 mph (96 kts)
01.126th
(tied with 14 other Septembers)
3
(1983, 1985, 1992, 1993)
Accumulated Cyclone Energy
ACE×10⁴ kt²
7.035.735th111.8
(1992)
East Pacific Tropical Cyclone Season Counts January-September 2020
Storm Type Count 1981-2010
Mean
1981-2020
Rank*
1949-2020
Record
Tropical Storm
Winds ≥ 39 mph (34 kts)
1314.126th
(tied with 2 other seasons)
22
(1992)
Hurricane
Winds ≥ 74 mph (64 kts)
37.539th
(tied with 1 other season)
14
(1990, 1992)
Major Hurricane
Winds ≥ 111 mph (96 kts)
23.728th
(tied with 7 other seasons)
9
(1993)
Accumulated Cyclone Energy
ACE×10⁴ kt²
54.8110.934th255.1
(1992)
*Tropical cyclone data before 1981 have a low bias due to limited access to satellite data and techniques over the open ocean.

Citing This Report

NOAA National Centers for Environmental Information, Monthly Tropical Cyclones Report for September 2020, published online October 2020, retrieved on July 16, 2024 from https://www.ncei.noaa.gov/access/monitoring/monthly-report/tropical-cyclones/202009.