Use the form below to select from a collection of monthly summaries recapping climate-related occurrences on both a global and national scale.
Tropical Cyclones ReportJune 2012

Note: This report catalogs recent tropical cyclones across the North Atlantic and East Pacific and places each basin’s tropical cyclone activity in a climate-scale context. It is not updated in real time. Users seeking the real time status and forecasts of tropical cyclones should visit The National Hurricane Center.
West North Pacific Basin
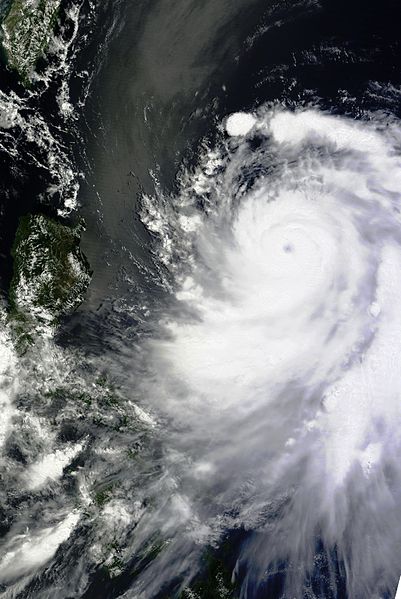
 Tropical Storm Mawar Satellite Image |
 Tropical Storm Mawar Forecast Track  Saffir-Simpson Scale Color Legend |
| Tropical Cyclone | Mawar(Ambo) | ||||||||
| Cyclogenesis Date | 06/01 | ||||||||
| Cyclolysis Date | 06/05 | ||||||||
| Highest Saffir-Simpson Category | Cat 3 | ||||||||
| Maximum 6-hr Sustained Wind | 115 mph (100 kt or 185 km/h) | ||||||||
| Min Pressure | 960 mbar | ||||||||
| Accumulated Cyclone Energy (ACE*) Index (kt2) | 11.2450 x 10⁴ | ||||||||
| Landfall Information (date, location and sustained winds) | |||||||||
| Deaths | 3 | ||||||||
| *The (ACE) Index calculations are based on preliminary data. | |||||||||
 Tropical Storm Guchol Satellite Image |
 Tropical Storm Guchol Forecast Track Saffir-Simpson Scale Color Legend |
| Tropical Cyclone | Guchol(Butchoy) | ||||||||
| Cyclogenesis Date | 06/12 | ||||||||
| Cyclolysis Date | 06/19 | ||||||||
| Highest Saffir-Simpson Category | Cat 4 | ||||||||
| Maximum 6-hr Sustained Wind | 150 mph (130 kt or 241 km/h) | ||||||||
| Min Pressure | 930 mbar | ||||||||
| Accumulated Cyclone Energy (ACE*) Index (kt2) | |||||||||
| Landfall Information (date, location and sustained winds) | 06/19 - Kii Penninsula, Japan (55 kt or 102 km/h) | ||||||||
| Deaths | 27 | ||||||||
| *The (ACE) Index calculations are based on preliminary data. | |||||||||
 Tropical Storm Talim Satellite Image |
 Tropical Storm Talim Forecast Track Saffir-Simpson Scale Color Legend |
| Tropical Cyclone | Talim(Carina) | ||||||||
| Cyclogenesis Date | 06/18 | ||||||||
| Cyclolysis Date | 06/20 | ||||||||
| Highest Saffir-Simpson Category | TS | ||||||||
| Maximum 6-hr Sustained Wind | 58 mph (50 kt or 93 km/h) | ||||||||
| Min Pressure | 985 mbar | ||||||||
| Accumulated Cyclone Energy (ACE*) Index (kt2) | 2.0300 x 10⁴ | ||||||||
| Landfall Information (date, location and sustained winds) | |||||||||
| Deaths | 0 | ||||||||
| *The (ACE) Index calculations are based on preliminary data. | |||||||||
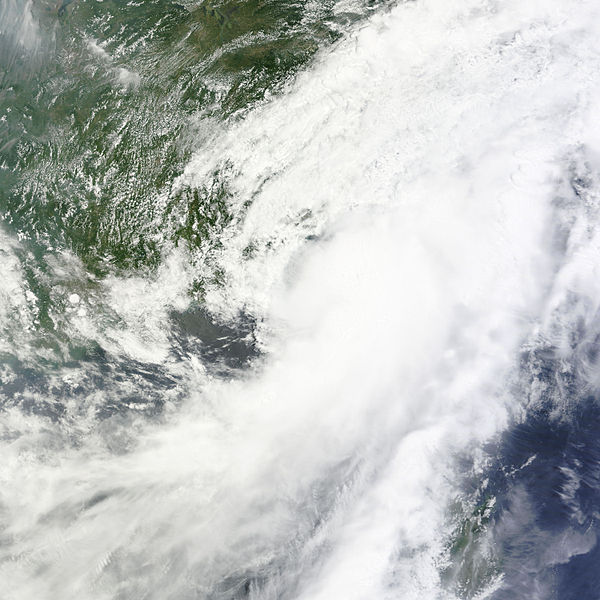
 Tropical Storm Doksuri Satellite Image |
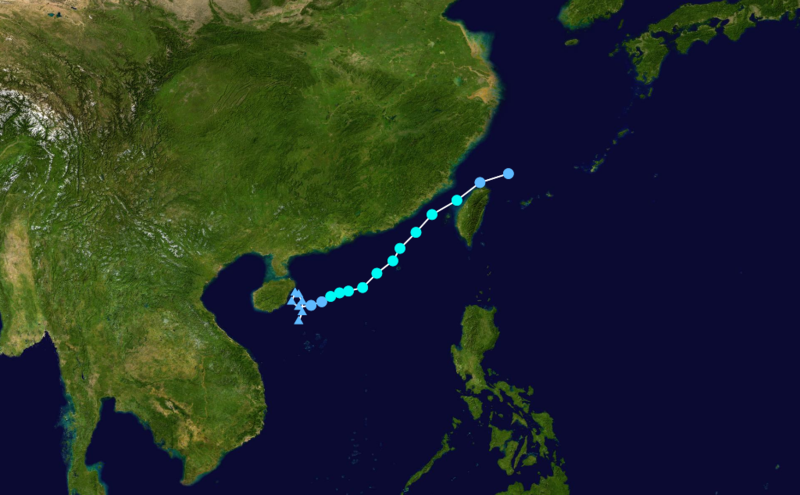
 Tropical Storm Doksuri Forecast Track Saffir-Simpson Scale Color Legend |
| Tropical Cyclone | Doksuri(Dindo) | ||||||||
| Cyclogenesis Date | 06/26 | ||||||||
| Cyclolysis Date | 06/30 | ||||||||
| Highest Saffir-Simpson Category | TS | ||||||||
| Maximum 6-hr Sustained Wind | 58 mph (50 kt or 93 km/h) | ||||||||
| Min Pressure | 992 mbar | ||||||||
| Accumulated Cyclone Energy (ACE*) Index (kt2) | 1.7850 x 10⁴ | ||||||||
| Landfall Information (date, location and sustained winds) | 06/29 - Guangdong, China (40 kt or 74 km/h) | ||||||||
| Deaths | 6 | ||||||||
| *The (ACE) Index calculations are based on preliminary data. | |||||||||
South Indian Basin
 Tropical Storm Kuena Satellite Image |
 Tropical Storm Kuena Forecast Track Saffir-Simpson Scale Color Legend |
| Tropical Cyclone | Kuena(Ambo) | ||||||||
| Cyclogenesis Date | 06/06 | ||||||||
| Cyclolysis Date | 06/07 | ||||||||
| Highest Saffir-Simpson Category | TS | ||||||||
| Maximum 6-hr Sustained Wind | 58 mph (50 kt or 93 km/h) | ||||||||
| Min Pressure | 990 mbar | ||||||||
| Accumulated Cyclone Energy (ACE*) Index (kt2) | 1.1500 x 10⁴ | ||||||||
| Landfall Information (date, location and sustained winds) | |||||||||
| Deaths | 0 | ||||||||
| *The (ACE) Index calculations are based on preliminary data. | |||||||||
East North Pacific Basin
 Tropical Storm Carlotta Satellite Image |
 Tropical Storm Carlotta Forecast Track Saffir-Simpson Scale Color Legend |
| Tropical Cyclone | Carlotta | ||||||||
| Cyclogenesis Date | 06/14 | ||||||||
| Cyclolysis Date | 06/16 | ||||||||
| Highest Saffir-Simpson Category | Cat 2 | ||||||||
| Maximum 6-hr Sustained Wind | 104 mph (90 kt or 167 km/h) | ||||||||
| Min Pressure | 976 mbar | ||||||||
| Accumulated Cyclone Energy (ACE*) Index (kt2) | 3.4325 x 10⁴ | ||||||||
| Landfall Information (date, location and sustained winds) | 06/15 - near Puerto Escondido, Mexico (78 kt or 145 km/h) | ||||||||
| Deaths | 2 | ||||||||
| *The (ACE) Index calculations are based on preliminary data. | |||||||||
Atlantic Basin
 Tropical Storm Chris Satellite Image | 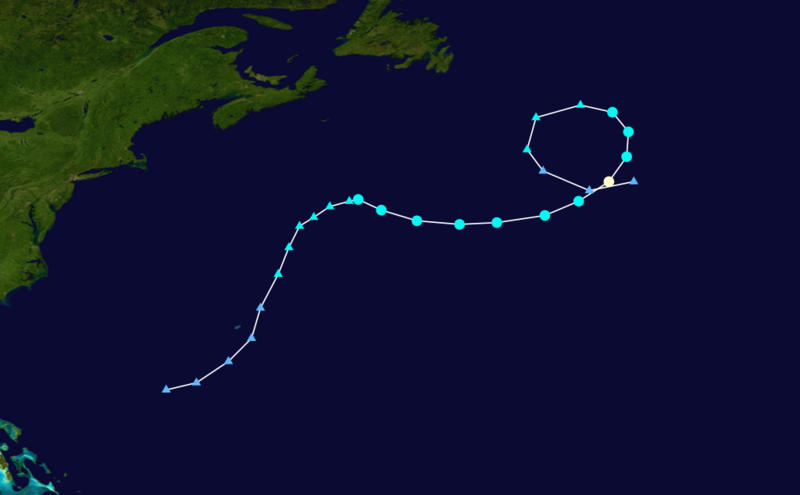 Tropical Storm Chris Track Saffir-Simpson Scale Color Legend |
| Tropical Cyclone | Chris | ||||||||
| Cyclogenesis Date | 06/19 | ||||||||
| Cyclolysis Date | 06/22 | ||||||||
| Highest Saffir-Simpson Category | Cat 1 | ||||||||
| Maximum 6-hr Sustained Wind | 75 mph (65 kt or 120 km/h) | ||||||||
| Min Pressure | 987 mbar | ||||||||
| Accumulated Cyclone Energy (ACE*) Index (kt2) | 2.9225 x 10⁴ | ||||||||
| Landfall Information (date, location and sustained winds) | |||||||||
| Deaths | 0 | ||||||||
| *The (ACE) Index calculations are based on preliminary data. | |||||||||
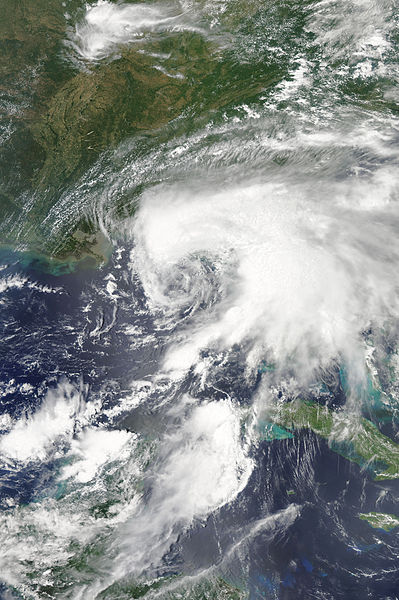 Tropical Storm Debby Satellite Image | 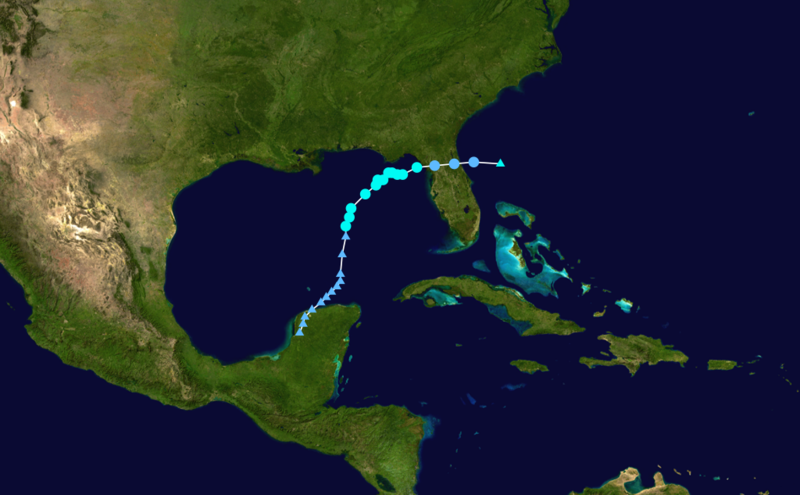 Tropical Storm Debby Track Saffir-Simpson Scale Color Legend |
| Tropical Cyclone | Debby | ||||||||
| Cyclogenesis Date | 06/23 | ||||||||
| Cyclolysis Date | 06/26 | ||||||||
| Highest Saffir-Simpson Category | TS | ||||||||
| Maximum 6-hr Sustained Wind | 58 mph (50 kt or 93 km/h) | ||||||||
| Min Pressure | 990 mbar | ||||||||
| Accumulated Cyclone Energy (ACE*) Index (kt2) | 2.4400 x 10⁴ | ||||||||
| Landfall Information (date, location and sustained winds) | 06/26 - Steinhatchee, Florida (35 kt or 65 km/h) 06/22–06/26 Total Precip (map) |
||||||||
| Deaths | 3 | ||||||||
| *The (ACE) Index calculations are based on preliminary data. | |||||||||