Use the form below to select from a collection of monthly summaries recapping climate-related occurrences on both a global and national scale.
National Snow and Ice ReportAnnual 2024

According to NOAA data analyzed by the Rutgers Global Snow Lab, the contiguous U.S. (CONUS) snow cover extent during the winter season (December 2023–February 2024) was nearly 283,000 square miles below the 1991–2020 average and ranked third lowest in the 58-year period of record.
Snowfall during the 2023-2024 snow season was above average across the southern Cascades, Sierra Nevada, Bitterroots, central and southern Rockies as well as portions of the Adirondack, Green and White mountains in the Northeast. Seasonal snowfall was at least 3 or more feet below average across parts of the northern Cascades, northern Rockies, the northern Plains as well as much of the Great Lakes and Northeast.
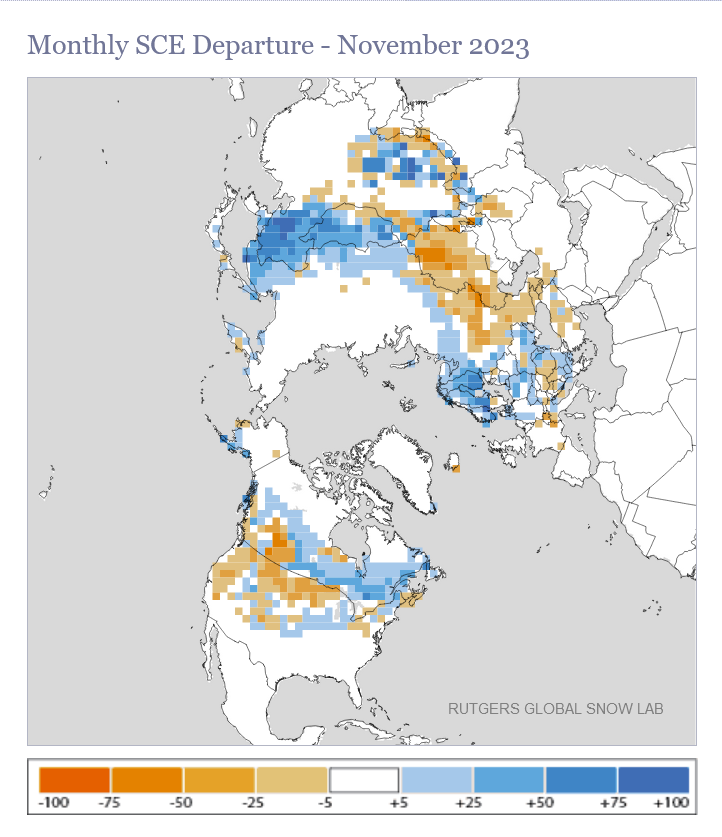
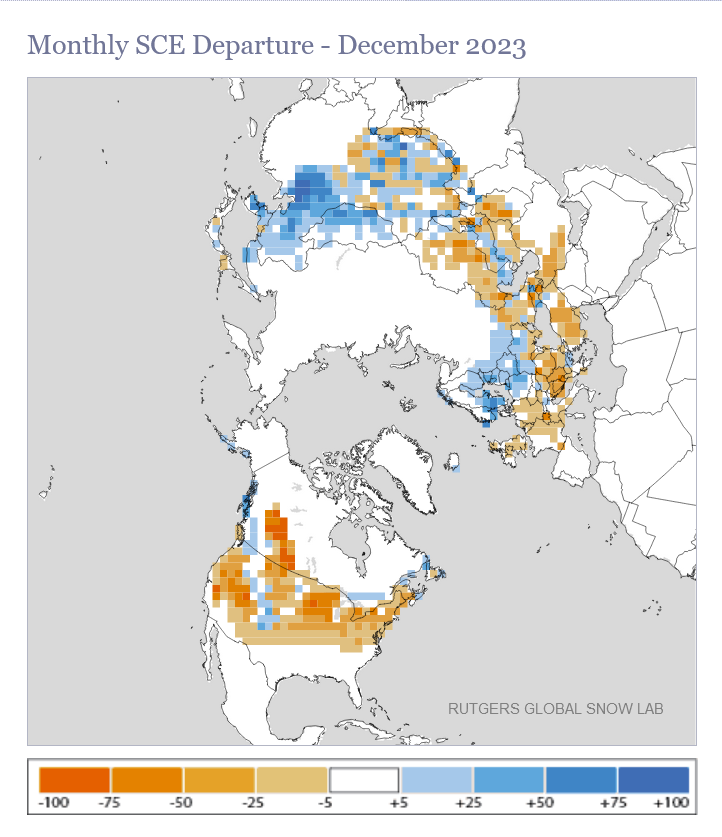
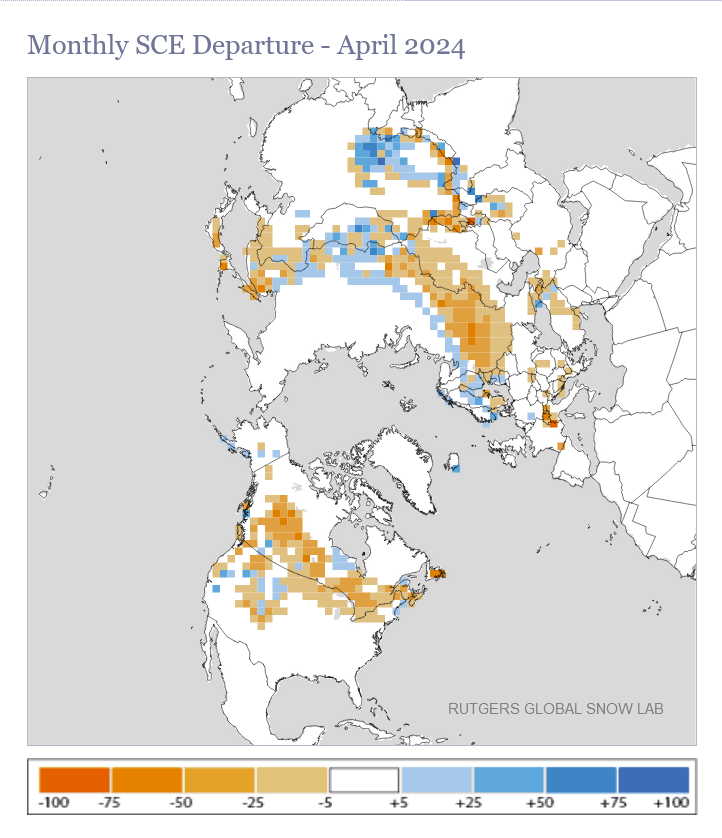
Early in the 2023-2024 snow season, snow cover extent (SCE) was below average across much of the West and Northern Tier in November 2023. Early season snowfall occurred across parts of the central Plains and extended into the Great Lakes. SCE for December 2023 was third lowest on record for December and was due in large part to the record warm month that occurred across the CONUS. Below-average snow cover was evident across much of the West and from the Plains to the Northeast. Above-average snow cover did occur across parts of the Pacific Northwest and central Rockies. Several cold-air outbreaks in January helped turn around SCE for the month with above-average SCE across much of the Plains and from the South to the Northeast. The first blizzard warning in over 11 years was issued in Seattle after a bomb cyclone brought heavy snowfall to the region in January. February was third-warmest on record with average temperatures that were on average 10°-20°F above average across much of the northern Plains and Great Lakes. Snow cover deficits were evident from the Plains into the Northeast and SCE was second lowest on record for the month. Across the western half of the Lower 48, multiple snow events provided for above-average SCE in March. Snow cover across the eastern half of the U.S. was below average. A few April snow showers across the Sierra Nevada and central Rockies brought above-average SCE, but the rest of the mountainous regions and Northern Tier, that typically receive snowfall in April, saw little new snowfall in April.
The 2024-2025 snowfall season to-date from October 1–December 31, 2024 saw above-average snowfall for locations along the West Coast impacted by early-season atmospheric river events. This includes much of the Cascades, northern Sierra Nevada range, Bitterroots as well as the highest elevations of the central Rockies and adjacent Plains as well as locations downwind of the Great Lakes. Snowfall deficits prevailed across the southern Sierra Nevada range and from the northern Rockies to the Upper Midwest and across portions of New England.
November 2024 was an active month for early-season snow across the West with several Arctic blasts ushering in some of the first snows of the season. SCE was overall near average for the month. December SCE was above average across portions of the Northwest, central Rockies, Northern Tier and New England. Much of the central and southern Sierras, southern Rockies, Plains and from the Midwest to the Mid-Atlantic experienced snow cover deficits for the month.
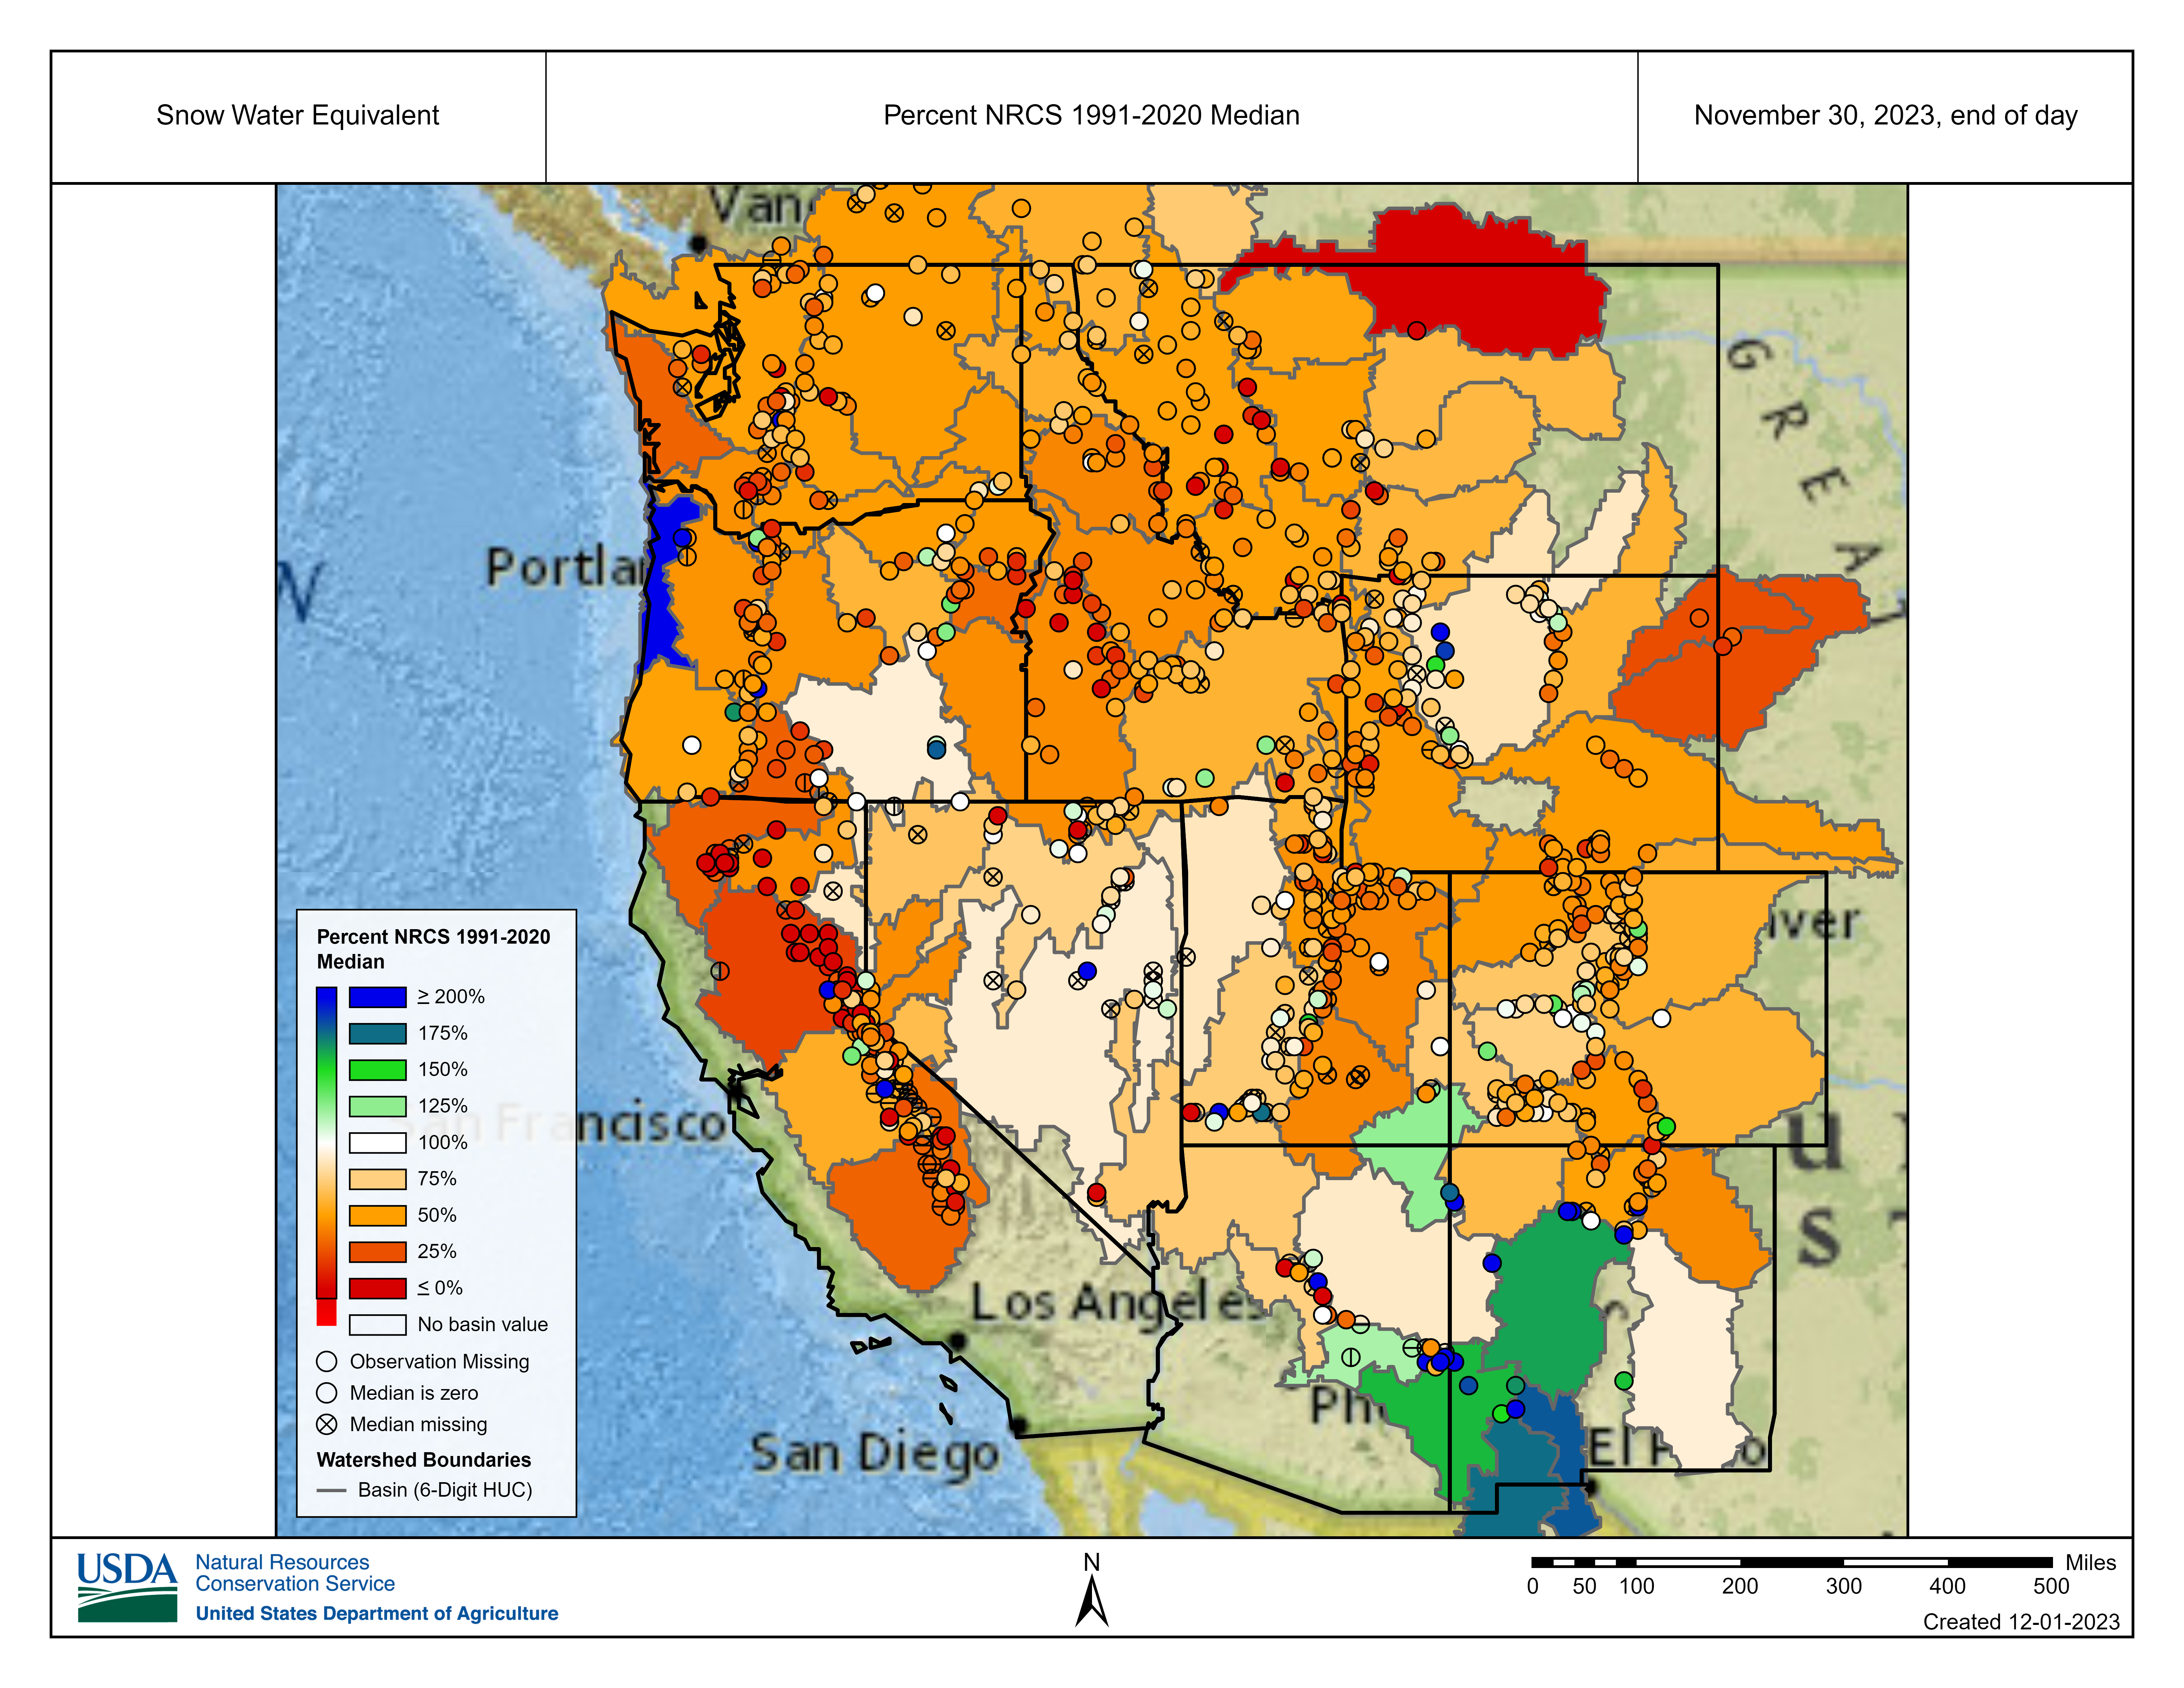
Melting of winter and spring mountain snowpack provides a crucial summer water source across much of the western United States. The total annual water budget for agriculture and human use in the mountainous West is highly dependent on the amount of snow melt that will occur in spring and is proportional to the amount of snow on the ground, which can be approximated by a measure of the snow water equivalent (SWE).
Early-season SWE values across most of the West were well-below median at the end of both November and December 2023. However, by the end of January, SWE values were at or above 100 percent across much of the Great Basin and parts of the central and southern Rockies. In February, SWE values increased to at least 100% of median across the southern Cascades, northern Sierra Nevada and from the Great Basin to the central and southern Rockies. The northern Cascades, northern Bitterroots and northern Rockies had SWE values that were 75% or less than the median value for this time of year. Late season snowfall in March brought significant snowpack from the southern Cascades and Sierra Nevada range to the Front Range. By the end of March 2024, SWE values were greater than 175% of median across much of the Great Basin and southern Rockies. The Northern Tier continued to struggle with most basins reporting less than 75% of median for the month. During April, snowpack remained intact across the higher elevations of the Cascades, Sierras, Bitterroots and parts of the northern and central Rockies. By the end of April, SWE values remained at or above 100% of median from the southern Cascades to parts of the central and southern Rockies.
For additional information on specific events please visit our Monthly Reports, Storm Events Database, and Billion-dollar Weather and Climate Disasters.