Use the form below to select from a collection of monthly summaries recapping climate-related occurrences on both a global and national scale.
National Snow and Ice ReportMarch 2019
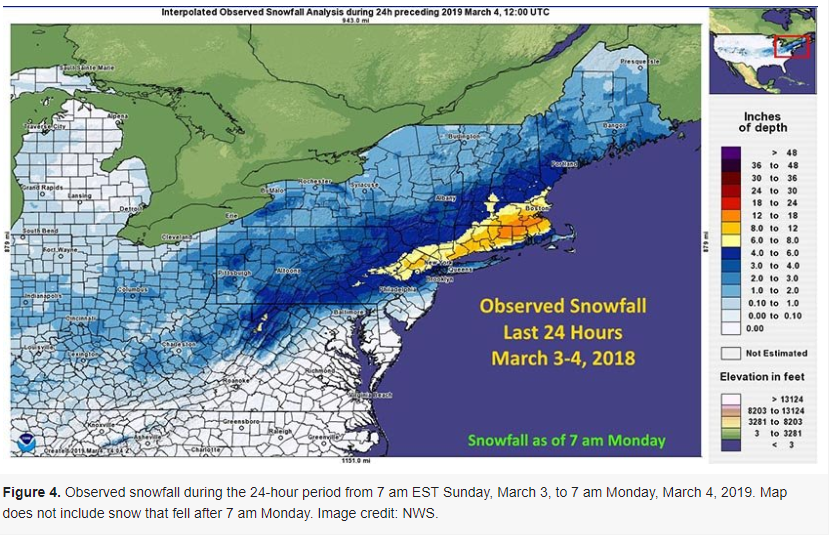
During March, below-average temperatures were observed across the Northwest and northern and central Plains. Above- to much-above average precipitation fell from California eastward into the Midwest. Some of this precipitation fell as rain while some added to the above-average snow season occurring throughout much of the West and northern Plains states. According to NOAA's National Snow Analysis, the month began with 56.7 percent snow cover across the contiguous U.S. (CONUS) — across much of the mountainous West, northern and central Plains, Great Lakes, and Northeast. A snowstorm, which impacted the Northeast early in the month, brought the snow cover to 57.1 percent on the 5th, the monthly peak. Over a foot of snow fell over Connecticut and Rhode Island as well as parts of Massachusetts with lesser amounts blanketing the ground from Indiana to Maine. As the month progressed, the overall snowcover trend began a steady decline as springtime temperatures began to errode the snowpack. By March 29th, the monthly minimum of 18.1 percent of the CONUS was covered by snow — from the higher elevations of the western mountains to the northern Plains and into the northern Great Lakes and the Northeast.

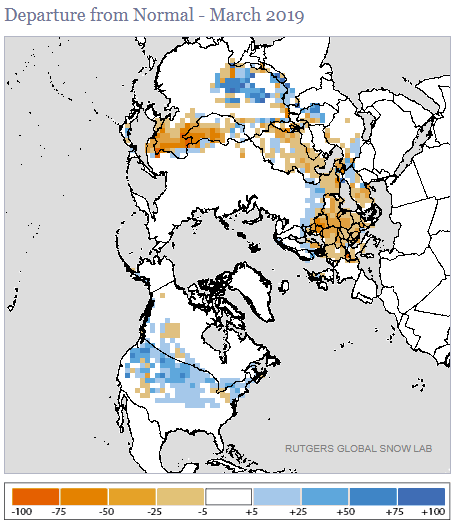
According to NOAA data analyzed by the Rutgers Global Snow Lab, the March snow cover extent was 1.06 million square miles, 321,235 square miles above the 1981-2010 average. This was the sixth highest value in the 53-year satellite record. Above-average snow cover was observed across much of the West, Rockies, Great Plains, Midwest and Northeast. Below-average snow cover was observed in parts of the Southern Rockies and Ohio Valley.

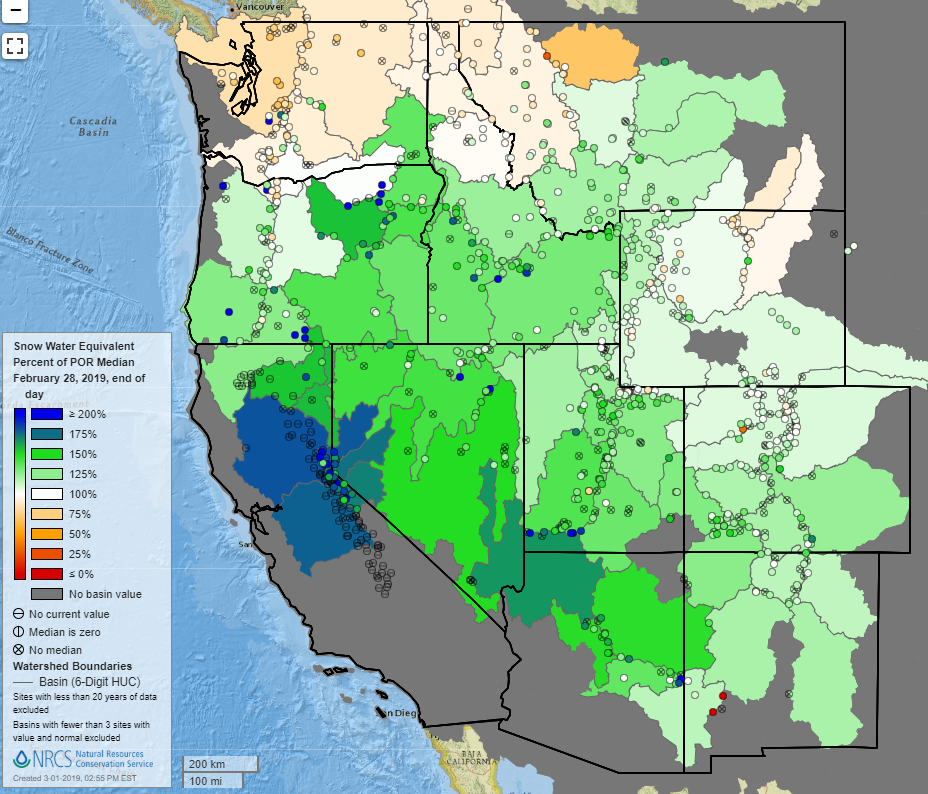
Melting of winter and spring mountain snowpack provides a crucial summer water source across much of the western United States. The total annual water budget for agriculture and human use in the mountainous West is highly dependent on the amount of snow melt that will occur in spring and is proportional to the amount of snow on the ground, which can be approximated by a measure of the snow water equivalent (SWE). On February 28th, below-average SWE was observed across the northern Cascades as well as the northern Bitterroots. SWE values of 125% to 200% of median were present across much of the West with the highest percentages found along the Sierra Nevada range. By the end of March, SWE values in excess of 200% of median were observed across the Sierra Nevada range, the Great Basin and across much of northern Arizona. Near-to and above-median SWE values were present across much of the southern Cascades and Bitterroots as well as the central and southern Rockies. Below-average SWE values intensified across the northern Cascades as well as the northern Bitterroots.

On March 13th, a rapidly developing cyclone dropped over 24 millibars in a 24-hour period, qualifying it as a "bomb cyclone". This storm system brought record- to near-record low atmospheric pressure readings to several states as well as blizzard conditions and heavy rainfall. Localized flooding resulted across many communities as snowpack melted beneath a layer of new rainfall onto frozen ground. Frozen rivers gave way to ice jams as the water toppled its banks. Travel was brought to a standstill from Colorado to North Dakota as over a foot of snow fell in some locations with wind gusts reaching nearly 100 miles per hour.

The Bering Sea, between Russia and the west coast of Alaska, typically reaches its maximum sea ice extent in late March or early April. In the image on the right, taken on March 31, 2019, we see that a largely ice-free area exists from nearly one coast to the other. This is in contrast with the image on the left, taken on April 1, 2014, which depicts what would have been considered a very typical extent of sea ice in this region during this time of year. The 2019 sea ice extent is the lowest on record for March at 37% of average, surpassing the record low extent observed in 2018. It is thought that the recent warm summers and autumns have delayed the onset of ice formation, leading to thinner ice, and thus, the ice coverage "season" becomming abbreviated.