Use the form below to select from a collection of monthly summaries recapping climate-related occurrences on both a global and national scale.
National Climate ReportSeptember 2022
Hurricane Ian Special Summary
Key Points
- Hurricane Ian was the second major hurricane of the 2022 North Atlantic hurricane season and the first to make landfall in the contiguous U.S.
- Based on preliminary data, Ian was a strong Category 4 hurricane that made landfall in Florida on September 28 and as a Category 1 hurricane in South Carolina on September 30.
- Damage from Ian across Florida was extensive. With assessments ongoing, Ian will likely be one of the costliest hurricanes on record in Florida.
Overview
Hurricane Ian began as a tropical wave on September 19, east of the Windward Islands of the Caribbean. As it moved westward, the wave gradually strengthened and four days later became a tropical depression. Located in the central Caribbean, with convection increasing and wind shear across the region decreasing, the depression gained additional organization and Tropical Storm Ian formed later that same day. Warm ocean sea surface temperatures and light wind shear across the region aided Ian as it became more organized and strengthened into a Category 1 hurricane on September 26. Ian progressed northward toward western Cuba, where it made landfall as a strong Category 3 storm with sustained winds of 125 mph. After briefly weakening from the landfall, Ian gained strength and reached Category 4 intensity early on September 28. As Ian approached the central Florida coast, it continued to strengthen and attained peak intensity with sustained winds of 155 mph.
At 3:05pm EDT on September 28, Hurricane Ian made landfall near Cayo Costa, FL, with sustained winds of 150 mph. Hurricane Ian slowly traversed the Florida peninsula, causing inland flooding from sustained heavy rainfall, before re-emerging over open waters of the Atlantic as a tropical storm. Ian quickly regained organization and strength and fueled by the warm Gulf Stream waters, Ian re-intensified into a Category 1 hurricane on September 30. Later that day, Ian made landfall near Georgetown, SC, with sustained winds of 85 mph. As Ian weakened, moving further inland, it transitioned into a post-tropical cyclone as it slowly moved up the coast.
Winds and Storm Surge
Based on preliminary data, Hurricane Ian was a large, strong Category 4 storm at landfall along the Gulf coast of Florida. Tropical storm-force or stronger winds (>39 mph) were observed across all of Florida east and south of Tallahassee. Although measuring accurate hurricane wind speeds once on land can be elusive, unofficial wind gusts of 140 mph were reported in Cape Coral and 135 mph in Punta Gorda. The preliminary landfall wind speed estimate of 150 mph tied for the fifth strongest on record in the U.S. and was the fourth-highest for Florida.
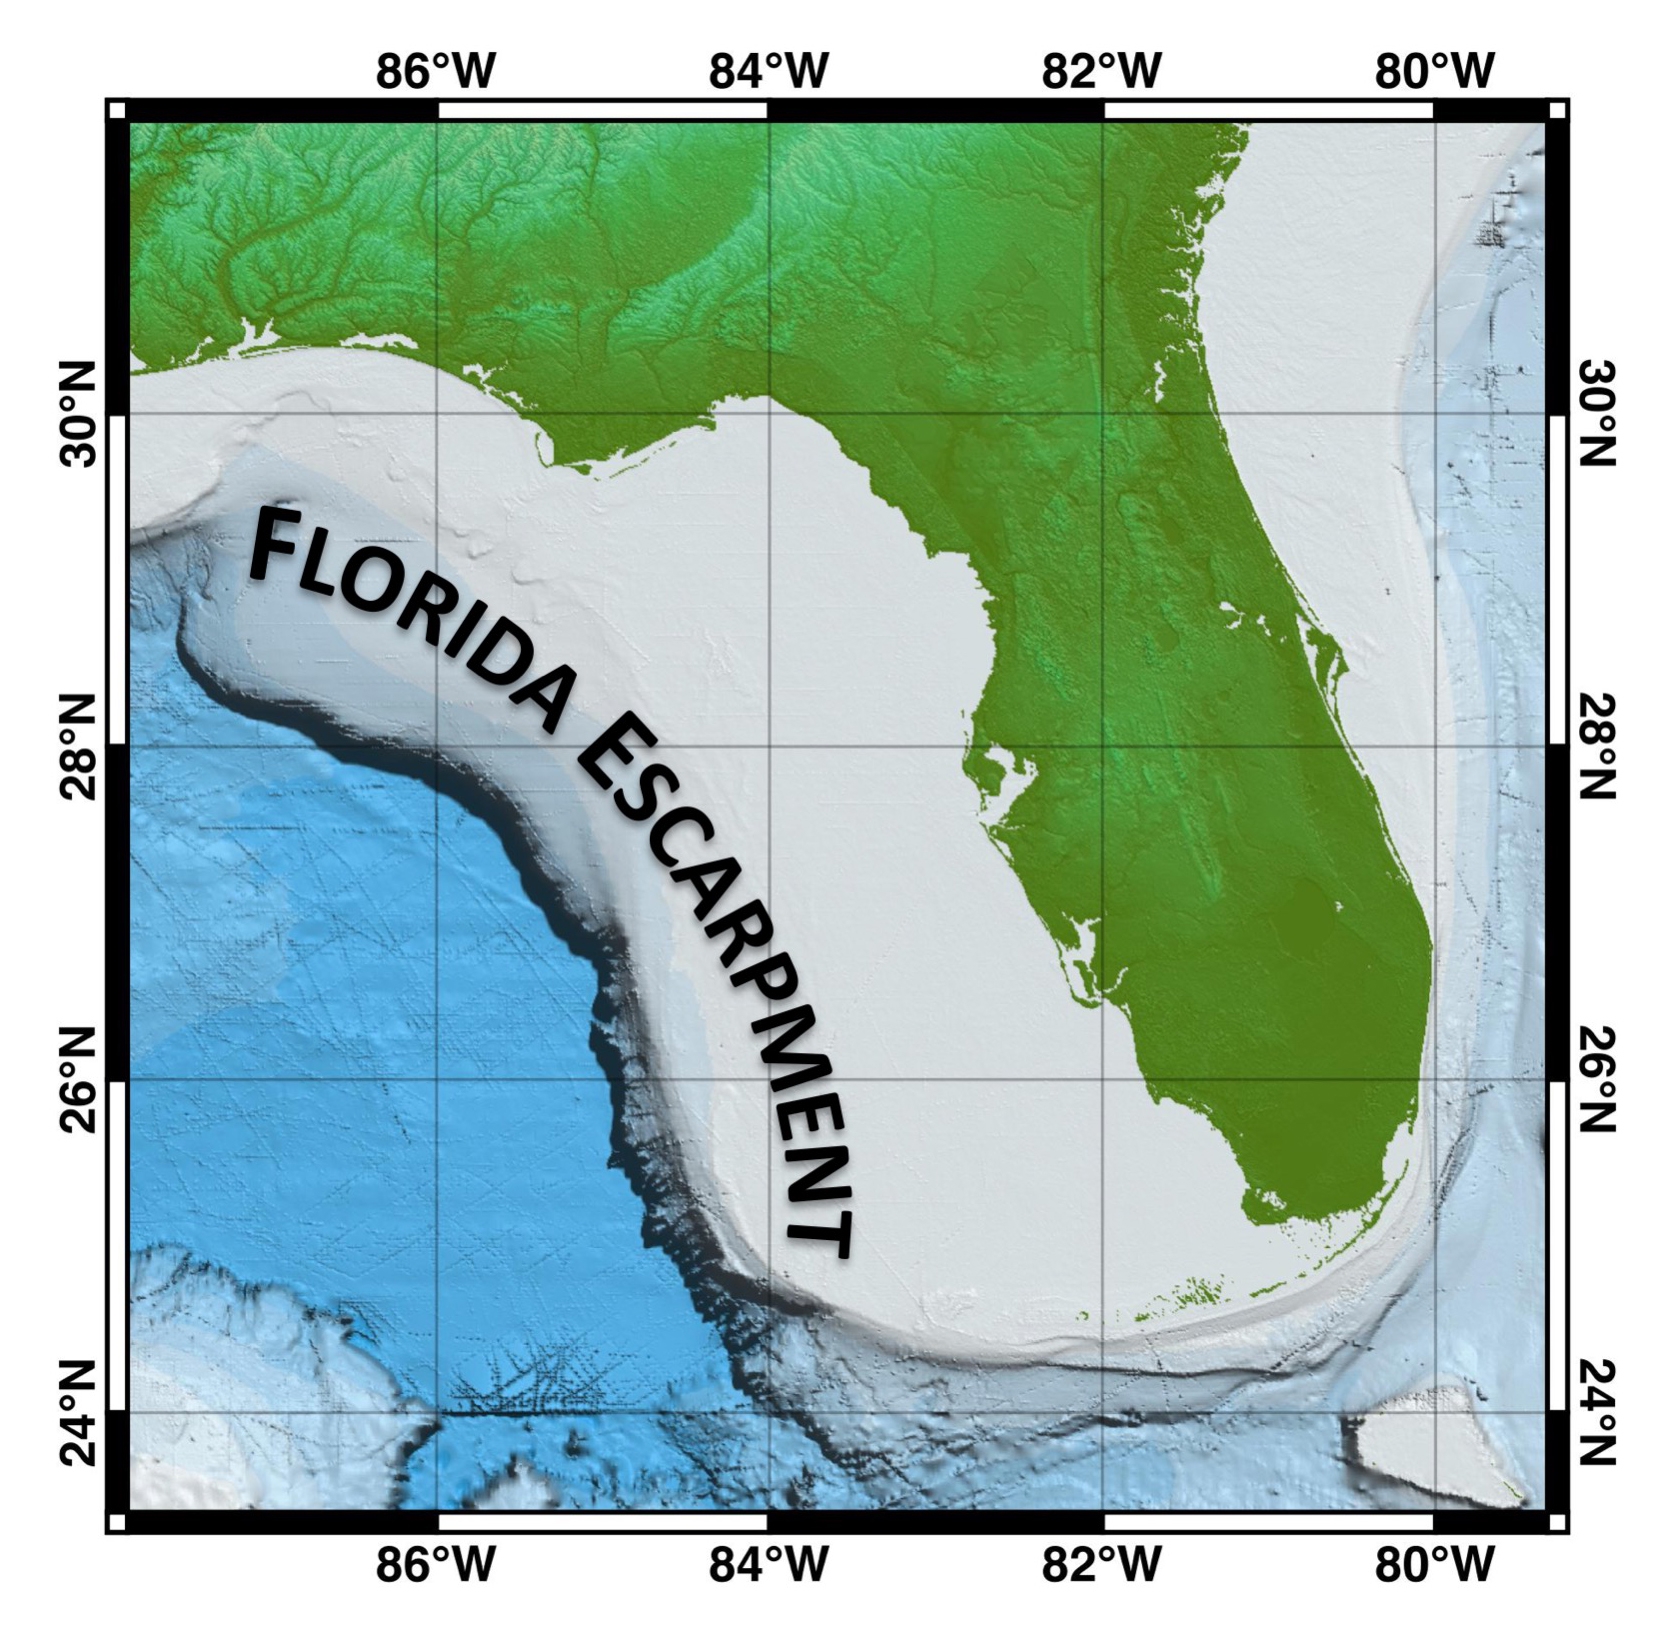
Resulting from the intense Category 4 storm, the shallow Florida Escarpment and the eastward-component of motion of the storm, estimated storm surge level forecasts issued by the National Hurricane Center on the morning of September 28 were in the 12-18 foot range from Englewood to Bonita Beach and 8-12 feet from Bonita Beach to Chokoloskee, FL. For many of the barrier islands and coastal communities along the western Florida shoreline, surge levels of this magnitude would be catastrophic in nature. As it was, the Naples and Fort Myers observed water levels measured at the highest levels on record for these gauges. With peak tide information still being gathered, it is believed that some of the coastal communities may have experienced storm surge heights of up to 12 feet.
As Hurricane Ian neared the South Carolina coastline, peak wind observations ranged from 73 mph at Follow Beach to 92 mph at Shutes Folly and the Chesapeake Light Tower in Virginia. A storm surge of approximately 5 feet was reported in the Myrtle Beach area — the third-highest value on record for this location. Much of downtown Charleston flooded as well as other coastal communities near Myrtle Beach. Portions of several prominent piers along the South Carolina coast were also washed away by the waves and storm surge.
| Location, State | Winds (mph) |
|---|---|
| Punta Gorda AP, FL | 135 (gust) |
| Fort Myers SW Regional AP, FL | 110 (gust) |
| Sarasota Bradenton AP, FL | 86 (5-sec gust) |
| Daytona Beach INTL AP, FL | 81 (5-sec gust) |
| Orlando, FL | 74 (gust) |
| St Petersburg AP, FL | 77 (gust) |
Rainfall
In addition to the coastal rainfall, Ian's slow forward motion across the peninsula produced significant inland freshwater flooding across portions of central and eastern Florida, with widespread rainfall totals in the 10-20 inch range for this 4-day period. Orlando reported 13.20 inches of rainfall associated with Ian, making September 2022 its wettest September and month on record with a total accumulation of 22.42 inches. The previous wettest month on record was July 1960 (19.57 inches), with records going back to 1892. Some of the largest rainfall accumulations from Hurricane Ian were located in portions of Volusia, Orange, Seminole, Brevard and Osceola counties. Totals exceeding 20 inches were reported in Daytona Beach (21.49 inches), Spruce Creek (21.09 inches) and New Smyrna Beach (20.95 inches).
Heavy rains accumulated across the Carolinas and portions of southern Virginia associated with Ian's landfall in South Carolina. Large swaths of 3-5 inch totals were evident across portions of South Carolina, the North Carolina Piedmont, the Coastal Plain of North Carolina as well as coastal Virginia. Localized rainfall in excess of 6 inches occurred around the Charleston and Myrtle Beach communities.

nClimGrid Daily total precipitation and track
Source: NOAA/NCEI/NHC

Hurricane Ian preliminary storm total rainfall and track
Source: NOAA/NCEI/NHC
| Location, State | Total Precipitation (inches) |
|---|---|
| Daytona Beach, FL (COOP) | 21.49 |
| Merritt Island, FL (COCORAHS) | 19.40 |
| Okeechobee 18.0 NNW, FL (COCORAHS) | 19.34 |
| Valrico 2.2 SE, FL (COCORAHS) | 17.24 |
| Riverview 0.9 ENE, FL (COCORAHS) | 16.59 |
| Orlando Sanford AP, FL (WBAN) | 16.10 |
| Sarasota Springs 4.4 E, FL (COCORAHS) | 15.80 |
| Daytona Beach Intl AP, FL (WBAN) | 13.92 |
| Sanford, FL (COOP) | 13.67 |
| Scottsmoor 2.5 SSW, FL (COOP) | 13.57 |
| Titusville, FL (WBAN) | 12.28 |
Impacts
The combination of Ian's excessive rainfall, severe winds, and exceptional storm surge contributed to widespread damage and property losses across the state of Florida. Following the landfall of Ian, more than 2.6 million customers were without power. According to state authorities, Lee and Charlotte counties were essentially “off the grid” and would likely require a rebuild of the infrastructure to bring the systems back to full capacity. Significant parts of many coastal communities, including those along the barrier islands of Captiva, Sanibel, Pine and Fort Myers Beach, were washed away by the winds and surge. The Sanibel Island causeway, which provides the only roadway access to the island, was partially washed away, limiting access to the island by air and boat. Similarly, the sole bridge connecting Pine Island to the mainland was destroyed during the storm and residents of the island can only access the island by air and boat.
One way to assess areas impacted by Ian is by looking at the Social Vulnerability Index (SVI) from the Centers for Disease Control and Prevention. This index refers to the potential negative effects on communities caused by external stresses from disasters such as tropical cyclones. The higher the index, the more likely communities will need continued support from emergency personnel to recover following a weather-related disaster. The center track of Ian passed over the most vulnerable areas of Florida's peninsula, including the counties of Polk, Hardee, De Soto, Glades, Hendry, and Okeechobee. These inland areas experienced hurricane force winds, more than 5 inches of rain, and localized flooding.
With assessments ongoing, it is anticipated that economic losses from Hurricane Ian will reach well into the billions (USD). An evolving summary of losses and impacts is available in NOAA's Billion-Dollar Weather and Climate Disaster tool. Since 1980, five hurricanes have produced $20+ billion (USD) in damage costs in Florida — Andrew (1992), Charley (2004), Wilma (2005), Irma (2017), and Michael (2018). Hurricanes Andrew and Irma produced the highest damage totals in Florida with approximately $50 billion (USD) for each storm. Hurricane Ian's impact is anticipated to reach or exceed this level of total direct costs.
Climatology
| Year | Storm | Winds @ Landfall (mph) | Category |
|---|---|---|---|
| 1935 | Labor Day | 185 | 5 |
| 1992 | Andrew | 165 | 5 |
| 2018 | Michael | 160 | 5 |
| 2022 | Ian | 150 | 4 |
| 2004 | Charley | 150 | 4 |
| 1919 | Florida Keys | 150 | 4 |
For what had been a slow start to the 2022 Atlantic hurricane season, Hurricane Ian was the second major hurricane to form in the North Atlantic Basin, with both Ian and Fiona developing during the month of September and attaining Category 4 intensity. Hurricane Ian was the sixth Category 4 or 5 storm to make landfall in the United States over the last six years, joining Harvey (2017), Irma (2017), Michael (2018), Laura (2020), and Ida (2021). Since 1851, Hurricane Ian tied with Charley (2004) and the Florida Keys hurricane (1919) as the the fourth-strongest landfalling hurricane in Florida, based on maximum peak sustained winds during landfall and the fifth-strongest landfalling hurricane across the contiguous U.S. Ian, much like Hurricane Michael in 2018, intensified rapidly as it approached the Florida Gulf coastline. Other historical hurricanes making landfall along the west-coast of Florida include Charley, Irma, and Eta (2020).
Both Charley and Ian made landfall in similar locations (in both Florida and South Carolina) and with similar intensities, but Charley was about half the size of Ian, when looking at the spatial extent of hurricane and tropical storm-force winds. Ian was also moving about half as fast as Charley as they approached and crossed Florida. The difference in size and forward motion contributed to both the storm surge and the rainfall totals being about twice as high in Ian compared to Charley.