National Overview

April Highlights


April Temperature
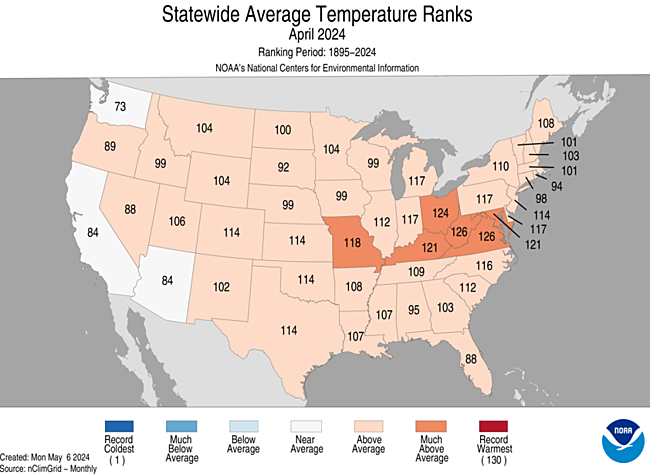
The contiguous U.S. average temperature during April was 53.8°F, 2.7°F above average, ranking 12th warmest in the 130-year record.
Temperatures were above average across much of the contiguous U.S., while near- to below-average temperatures were observed in parts of the West, northern Plains, Upper Midwest, Southeast and in small pockets of the Northeast.
For the month of April, Virginia and West Virginia each had their fifth-warmest April on record. Three additional states ranked among their top-10 warmest April on record for the month.
The contiguous U.S. average maximum (daytime) temperature during April was 66.2°F, 2.7°F above the 20th century average, ranking 15th warmest in the historical record for daytime temperatures. Maximum temperatures were above average across the majority of the contiguous U.S., while near-average temperatures were observed across much of the West Coast, from much of the northern Plains to the Upper Midwest and in the Southeast, as well as parts of the southern Plains and Northeast. No states ranked among their top-10 warmest or coldest April for daytime temperatures.
The contiguous U.S. average minimum (nighttime) temperature during April was 41.3°F, 2.7°F above the 20th century average, ranking seventh-warmest April on record for overnight temperatures. Minimum temperatures were above average across most of the contiguous U.S. while near- to below-average temperatures along the West Coast, Southwest and Southeast, and in parts of the Plains and Northeast. Virginia ranked second-warmest on record for April, while 12 additional states experienced a top-10 warmest April for nighttime temperatures.
The Alaska statewide April temperature was 13.9°F, 3.6°F above the long-term average, ranking in the warmest third of the 100-year period of record for the state. Temperatures were above average across most of the state with near- to below-normal temperatures in parts of the Southwest and in parts of the Panhandle.
Based on NOAA's Residential Energy Demand Temperature Index (REDTI), the contiguous U.S. temperature-related energy demand during April was 31 percent of average and the eighth-lowest value in the 130-year period of record.
April Precipitation
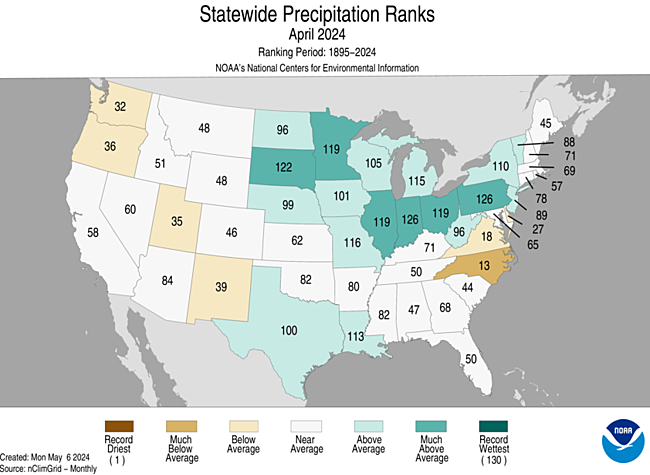
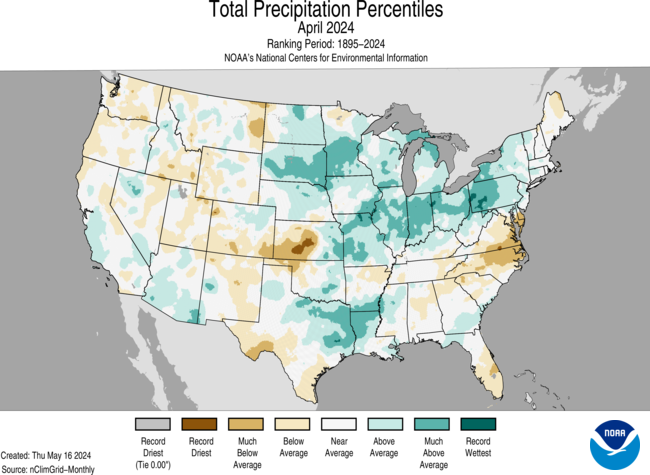
The April precipitation total for the contiguous U.S. was 2.77 inches, 0.25 inch above average, ranking in the wettest third of the 130-year record.
Precipitation was below average across much of the West, Southeast, and parts of the central and southern Plains. Conversely, precipitation was above normal from portions of the Plains to the Northeast, and in parts of the Southwest.
Indiana and Pennsylvania each ranked fifth-wettest on record for April, while one additional state had their top-10 wettest April on record.
Across the state of Alaska, the average monthly precipitation ranked in the driest third of the historical record. Precipitation was above average in parts of the North Slope and West Coast, while below-normal precipitation was observed in parts of the Southeast Interior and Panhandle during the month.
According to the April 30 U.S. Drought Monitor, about 17% of the contiguous U.S. was in drought, down about 1% from the beginning of April. Drought conditions expanded or intensified in much of the central and southern Plains, and parts of the Northwest and Southeast this month. Drought contracted or was reduced in intensity across much of the central Mississippi Valley and Upper Midwest, and in parts of the Southwest, northern Plains, Hawaii and Puerto Rico.
Billion-Dollar Weather and Climate Disasters
Five new billion-dollar weather and climate disasters were confirmed this month, including three severe storm events that impacted the central, southern and eastern U.S. in mid-February and early April. There were also two winter storms that impacted the northwest and central U.S. in mid-January.
There have been seven confirmed weather and climate disaster events this year, each with losses exceeding $1 billion. These disasters consisted of five severe storm events and two winter storms.
Since these billion-dollar disaster records began in 1980, the U.S. has sustained 383 separate weather and climate disasters where overall damages/costs reached or exceeded $1 billion (based on the CPI adjustment to 2024) per event. The total cost of these 383 events exceeds $2.720 trillion.
Other Notable Events
Persistent heat brought record-breaking temperatures to portions of the U.S. during April:
- Approximately 178 million people, across portions of the Great Lakes, Mid-Atlantic, Southeast and southern Plains, experienced their top-10 warmest April on record.
- It was the 12th warmest April and the fifth warmest January-April period on record for the contiguous U.S.
- A total of 455 counties experienced their top-10 warmest April on record. For the year-to-date period, 31 counties were record warm while an additional 1,658 counties ranked in the top-10 for this January-April period. There are 3,143 counties in the U.S.
- Temperatures in the Northeast, Upper Midwest and Ohio Valley ranked third, third and fourth warmest on record, respectively, for the January-April period, while minimum temperatures in the Northeast and Upper Midwest ranked warmest and second warmest on record for this year-to-date period.
Several notable storms impacted portions of the U.S. in April:
- On April 2-4, a spring storm brought rain, heavy snow, damaging winds and thunderstorms across much of the Great Lakes and Northeast, causing significant damage and knocking out power to hundreds of thousands in these regions.
- On April 10, a flash flood emergency was declared in the New Orleans area due to heavy rains from thunderstorms, as many roads in and around the city were underwater and impassable.
- On April 11-12, a strong low-pressure system brought heavy rain and thunderstorms to Hawaii. In Kauai, over 10 inches of rainfall in less than 12 hours, prompting several evacuations and multiple road closures.
- On April 20, severe thunderstorms brought large hail across the Carolinas, including 4.5 inch-diameter hail in Lumberton, NC and 4 inch-diameter hail in Rock Hill, SC.
- On April 25–28, a severe weather outbreak brought over one hundred tornadoes (including one EF-4) to parts of the Midwest and Great Plains, causing heavy damage and loss of life. The National Weather Service in Omaha, Nebraska issued 48 tornado warnings on April 26—the most the office has ever issued in a single day.
Year-to-Date Highlights


January-April Temperature

For the January-April period, the average contiguous U.S. temperature was 43.0°F, 3.8°F above average, ranking fifth warmest on record for this period.
Temperatures were above average across nearly all of the contiguous U.S., while record-warm temperatures were observed in parts of the Northeast and Great Lakes.
Wisconsin, Michigan, New York, Vermont, New Hampshire and Maine each ranked second warmest on record, while an additional 22 states ranked in their top-10 warmest year-to-date period. No state experienced a top-10 coldest event for this four-month period.
The contiguous U.S. average maximum (daytime) temperature during January-April was 54.0°F, 3.6°F above the 20th century average, ranking eighth warmest in the historical record. Above-average temperatures were observed across much of the conterminous U.S., while near- to below-average temperatures were observed in parts of the West, western Plains and Southeast. Michigan had its second-warmest January-April period on record for daytime temperatures. An additional 21 states ranked among their top-10 warmest for daytime temperatures during this period.
The contiguous U.S. average minimum (nighttime) temperature during this four-month period was 31.9°F, 4.1°F above the 20th century average, ranking third warmest in the historical record. Above-average nighttime temperatures were observed across nearly all of the Lower 48, while near- to below-average temperatures were observed in small portions of the West, Lower Mississippi Valley and Southeast. Michigan, New York, New Hampshire and Vermont each ranked warmest on record, while 26 additional states ranked among their top-10 warmest January-April period on record for nighttime temperatures.
The Alaska January-April temperature was 13.9°F, 3.6°F above the long-term average, ranking in the warmest third of the historical record for the state. Much of the state was above average for the four-month period while temperatures were near average across parts of the East, Southeast and parts of the Panhandle.
Based on REDTI, the contiguous U.S. temperature-related energy demand during January-April was 22 percent of average and was the third-lowest value on record.
January-April Precipitation
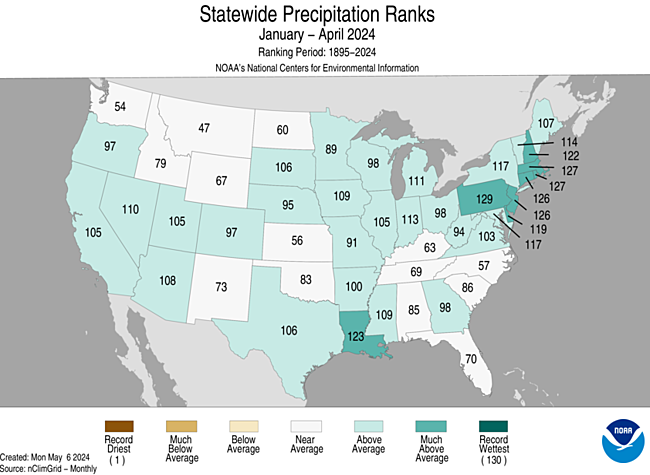
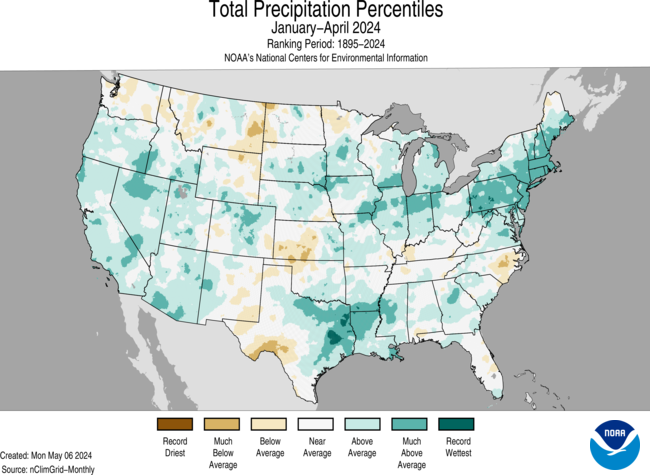
The January-April precipitation total for the contiguous U.S. was 10.95 inches, 1.48 inches above average, ranking 11th wettest in the 130-year record.
Precipitation was above average across much of the contiguous U.S., with Pennsylvania having its second-wettest year-to-date period on record. Six additional states ranked among their top-10 wettest on record for this four-month period.
Conversely, precipitation was below average across parts of the Northern Tier and western and southern Plains, and in a small portion of the Southeast during the January–April period. No states ranked among their top-10 driest year-to-date period on record.
The January-April precipitation for Alaska ranked in the middle third of the 100-year record, with above-average precipitation observed across much of the state, while near-normal precipitation was observed in parts of the northeast Interior and along parts of the Gulf of Alaska coast. Below-average precipitation were observed in portions of Interior and south-central Alaska and parts of the southern Panhandle during this period.
Extremes
The U.S. Climate Extremes Index (USCEI) for the year-to-date period was 44 percent above average, ranking in the upper third of the 115-year period of record. Extremes in warm maximum and minimum temperatures were the major contributors to this elevated CEI value. The USCEI is an index that tracks extremes (occurring in the upper or lower 10 percent of the record) in temperature, precipitation and drought across the contiguous United States.
On the regional scale, the Northeast, Upper Midwest and Ohio Valley each ranked much-above average with the Northeast experiencing the largest extent of extremes on record for this period. Each of these regions experienced elevated extremes in warm maximum temperatures, warm minimum temperatures and one-day precipitation. Extremes in wet PDSI were elevated across much of the Northeast, while extremes in dry PDSI affected around one fourth of the Upper Midwest. Below-average extremes were observed across the Northern Plains and Rockies, Northwest and West regions during this four-month period.
Monthly Outlook
According to the April 30 One-Month Outlook from the Climate Prediction Center, above-normal monthly average temperatures in May are favored to impact areas from the southern Plains to the East Coast, while above-normal monthly precipitation is likely to occur from much of the central Plains to the Mid-Atlantic and parts of the Upper Midwest during May. Drought is likely to persist along portions of the Northern Tier, the Southwest and Hawaii.
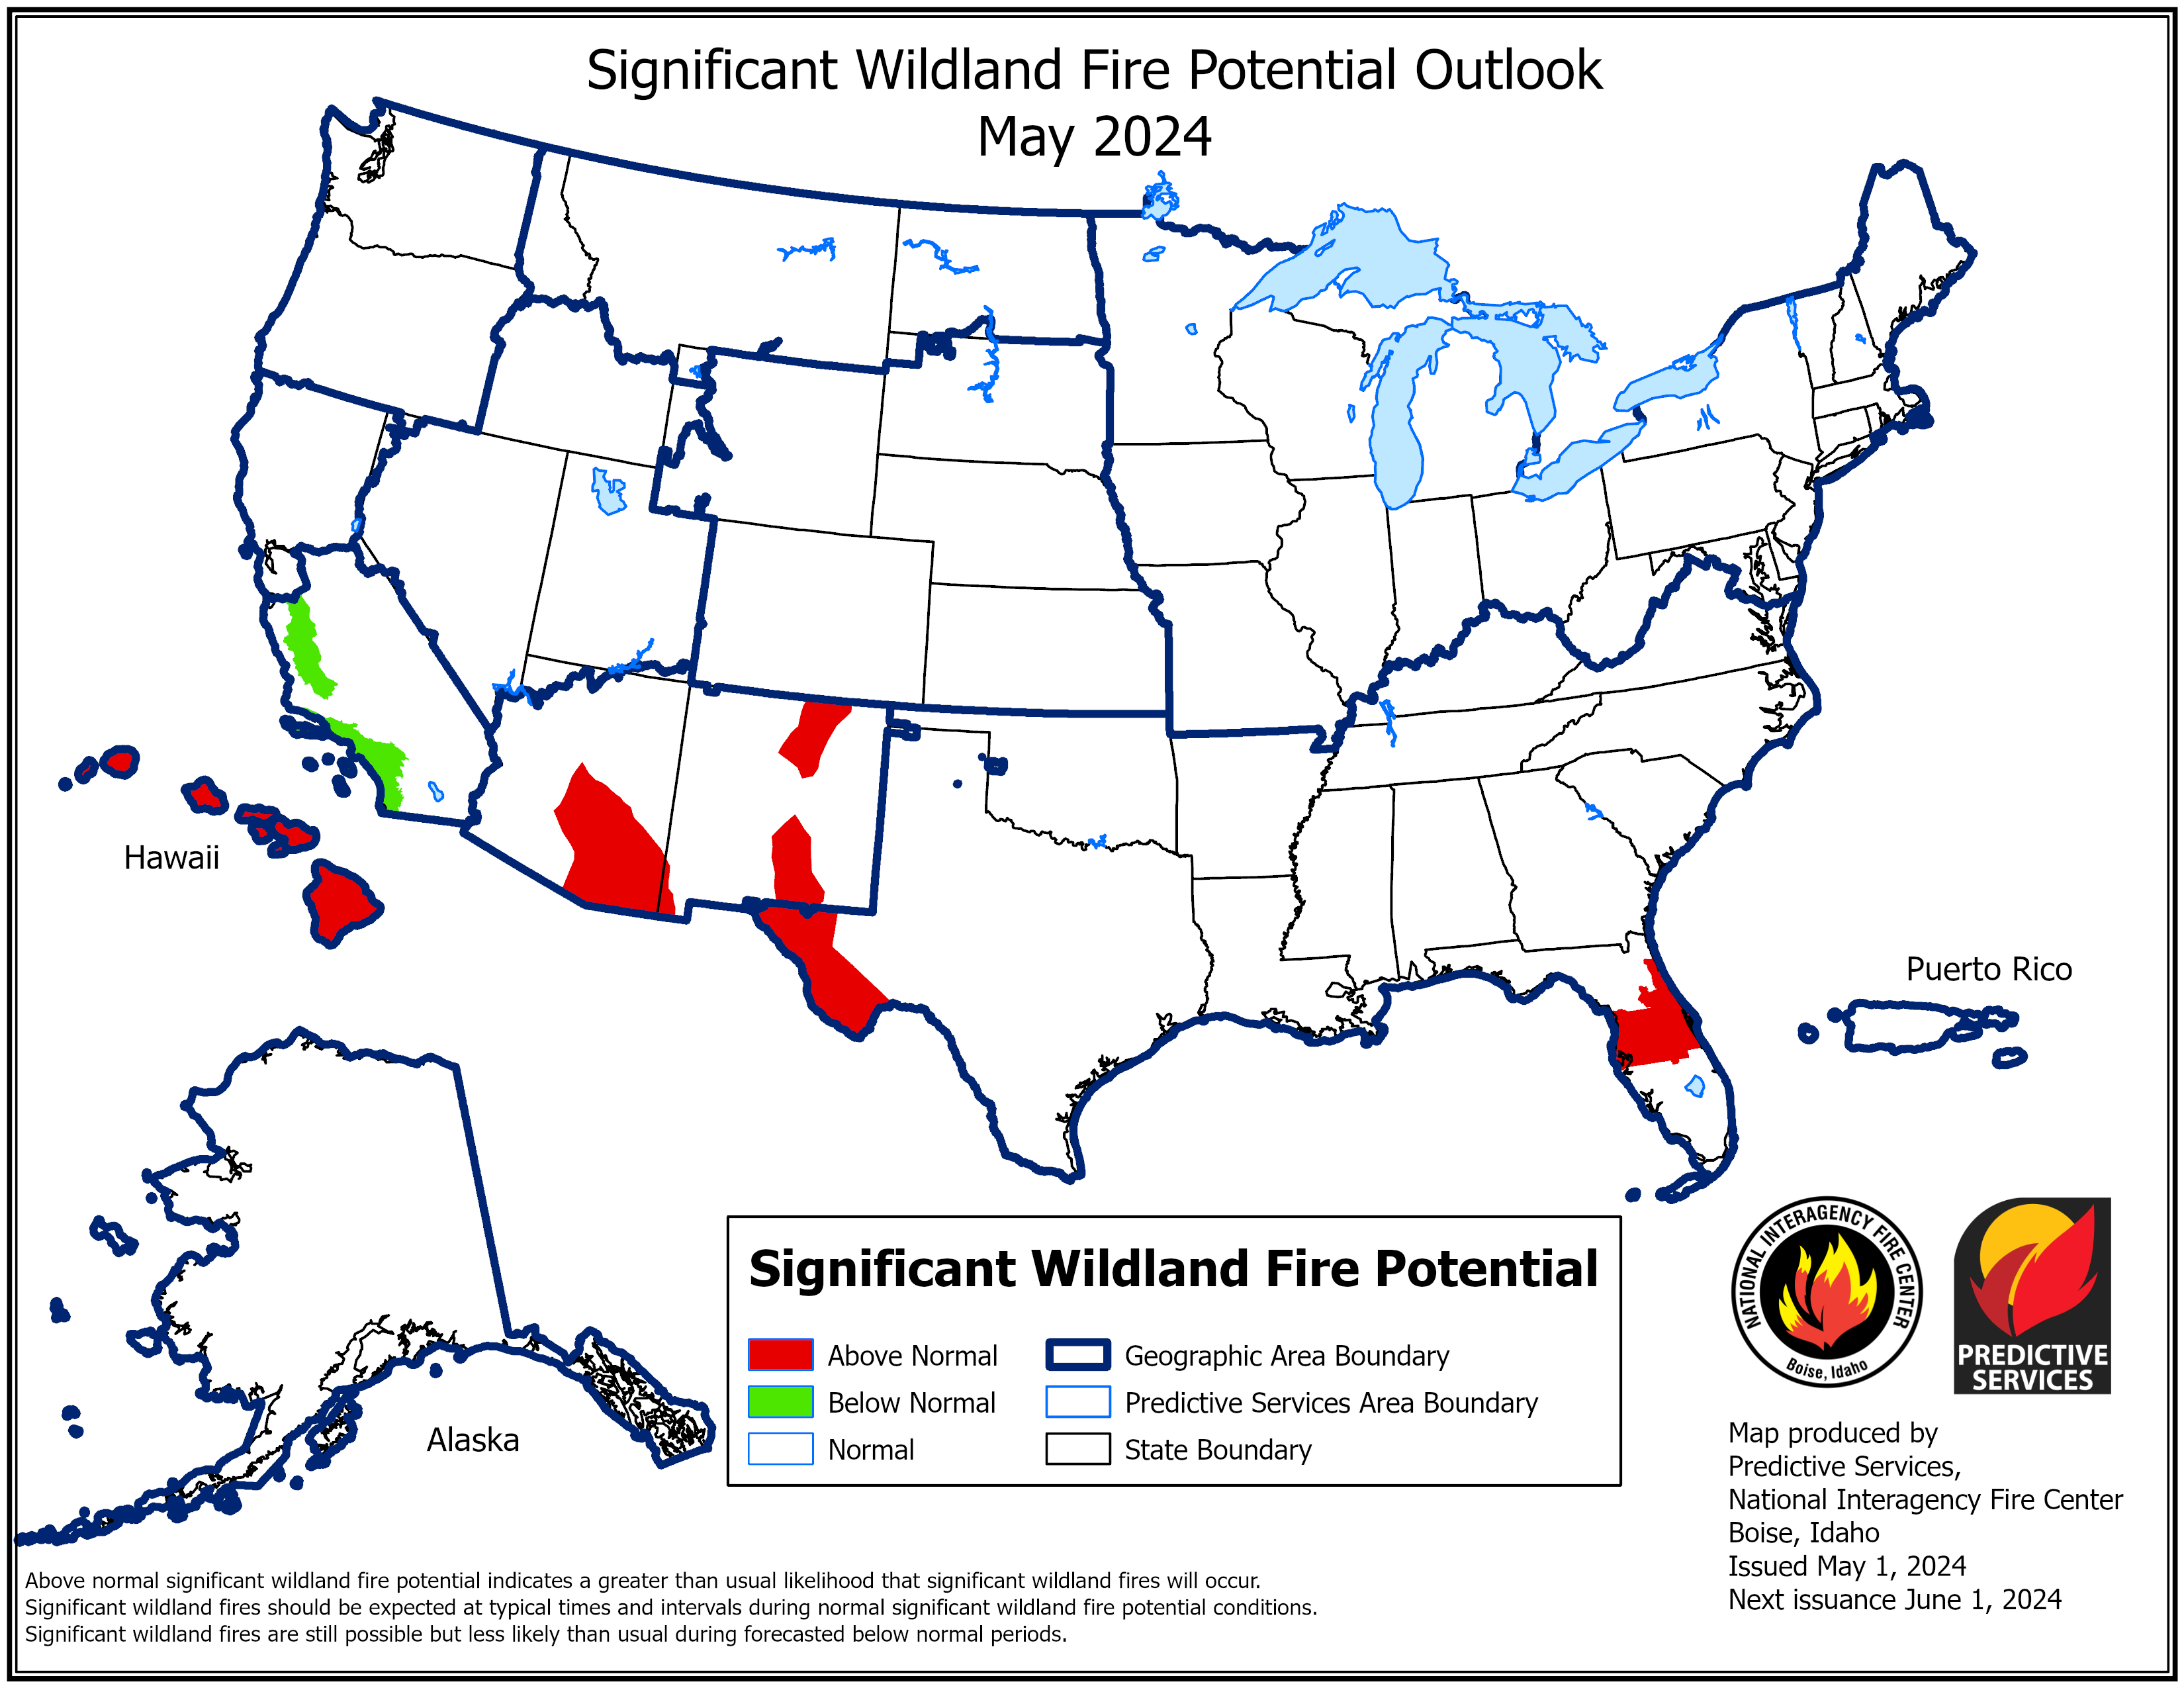
According to the One-Month Outlook issued on May 1 from the National Interagency Fire Center, the Hawaiian Islands and portions of the Southwest and Florida Peninsula have an above-normal significant wildland fire potential during the month of May, while parts of California are expected to have below-normal potential for the month.
Regional Highlights
These regional summaries were provided by the six Regional Climate Centers and reflect conditions in their respective regions. These six regions differ spatially from the nine climatic regions of the National Centers for Environmental Information.
Northeast (Information provided by the Northeast Regional Climate Center)
While conditions were variable, April leaned to the warm and wet side of normal for the Northeast as a whole.
Temperature
The Northeast’s average temperature for April was 47.4 degrees F, 1.2 degrees F warmer than normal. Average temperature departures for the 12 Northeast states ranged from 0.2 degrees F below normal in Rhode Island to 2.0 degrees F above normal in West Virginia, with 10 states wrapping up the month on the warm side of normal. This April ranked among the 20 warmest Aprils since recordkeeping began in 1895 for four states: West Virginia, 15th warmest; Delaware, 17th warmest; and Maryland and Pennsylvania, 20th warmest.
Precipitation
The Northeast accumulated 4.16 inches of precipitation in April, which was 111 percent of normal. Seven of the 12 Northeast states experienced a drier-than-normal April, with precipitation ranging from 67 percent of normal in Delaware to 156 percent of normal in Pennsylvania, its fifth-wettest April. Elkins, West Virginia; Charleston, West Virginia; and Pittsburgh, Pennsylvania, had their wettest April day on record. See the Notable Events section below for details.
Drought
The U.S. Drought Monitor from April 2 showed less than one percent of the Northeast in moderate drought and three percent as abnormally dry. Beneficial precipitation, particularly during the first half of the month, eased moderate drought in western New York and on Nantucket, Massachusetts, allowing the Northeast to be free of drought for the first time since spring 2023. Additionally, abnormal dryness was erased from Nantucket and contracted in western New York. The U.S. Drought Monitor from April 30 showed two percent of the Northeast as abnormally dry.
Notable Weather
Between April 1 and 5, a complex storm system brought severe weather, record rainfall, and heavy snow to the Northeast. The system produced mostly rain, particularly in areas outside of northern New England, from April 1 to 3. Pittsburgh, Pennsylvania, picked up 2.68 inches of rain on April 2, ranking as the site’s wettest April day on record. Meanwhile, Elkins, West Virginia, received 2.40 inches of rain on April 3, making it the site’s wettest April day on record. Areas such as western Pennsylvania, northern West Virginia, and western Maryland saw the greatest storm rainfall totals of 4 to 6 inches, resulting in widespread flooding that led to road closures, flooded buildings, some water rescues, and a few landslides. The Ohio River at Pittsburgh hit its highest level since 2005. Meanwhile, 10 tornadoes touched down in West Virginia on April 2, making it the state’s largest single-day tornado outbreak since records began in 1950. The tornadoes, as well as several microbursts, damaged hundreds of trees and multiple homes and buildings. On April 4 and 5, the system transitioned into producing heavy snow in portions of northern New York and northern New England. The greatest snow totals approached 24 inches in several Vermont counties and were near 21 inches in parts of New Hampshire and Maine. Burlington, Vermont, had its fourth snowiest April day, accumulating 10.0 inches of snow on April 4. Wind gusts of 30 to 60 mph, with locally higher gusts, accompanied the storm, fueling coastal flooding that inundated roads. The strong winds, as well as heavy, wet snow in some areas, downed trees and power lines, with more than 600,000 customers in the Northeast losing power. Many of those customers, over 300,000, were in Maine, while over 100,000 were in New Hampshire. There were five storm-related deaths across the Northeast. About a week later, from April 11 to 12, western Pennsylvania and portions of West Virginia saw another round of heavy rain with storm totals generally up to 3.50 inches. April 11 became the wettest April day on record for Charleston, West Virginia, with 3.32 inches of precipitation. Meanwhile, Pittsburgh, Pennsylvania, saw 2.77 inches of precipitation on April 11, beating its record for wettest April day that had been set nine days earlier. The National Weather Service stated that April was the only month on record at Pittsburgh that the first and second wettest days for the month have occurred in the same year. As of the 11th, this April had already become Pittsburgh’s fourth-wettest April on record (it finished as the site’s second wettest April). The rainfall combined with wet antecedent conditions resulted in widespread flooding in western Pennsylvania and parts of West Virginia. Storm reports noted numerous flooded roadways, mudslides, inundated homes and buildings, trapped vehicles, evacuations, and water rescues. In fact, the National Weather Service issued a Flash Flood Emergency for parts of Allegheny and Washington counties in western Pennsylvania, signifying a dangerous, life-threatening situation.
For more information, please visit the Northeast Regional Climate Center Home Page.
Midwest Region (Information provided by the Midwest Regional Climate Center)
Temperature
The preliminary average April temperature for the Midwest was 50.9 degrees F (10.5 degrees C), which was 2.2 degrees F (1.2 degrees C) above the 1991-2020 normal. Temperatures were 2-6 degrees F (1.1-3.3 degrees C) above normal across the region, with the warmest anomalies across the eastern and southern Midwest. Preliminary statewide average temperatures ranged from 1.3 degrees F (0.7 degrees C) above normal in Iowa to 3 degrees F (1.7 degrees C) above normal in Ohio. Temperatures were notably warm across the Midwest mid-month. Long Prairie, Minnesota, a station with over 100 years of records, recorded a maximum temperature of 84 degrees F (28.9 degrees C) on April 13, which was the warmest April temperature at that location since 2009. Des Moines, Iowa recorded a temperature of 88 degrees F (31.1 degrees C) on April 14, the warmest April temperature since 2012. Terre Haute, Indiana, reported a temperature of 87°F on April 15, which was only the 10th time the temperature rose that high in April since 1875, and the first time since 1952. From April 14-17, Louisville, Kentucky, observed 4 consecutive days of temperatures at or above 85°F for only the 8th time in April since 1872. A handful of long-running stations in the eastern half of the region recorded a top 5 warmest April, including Louisville, Kentucky; Muskegon, Michigan; Detroit, Michigan; and Cleveland, Ohio.
Precipitation
Preliminary April precipitation totaled 4.89 inches (124 mm) for the Midwest, which was 1.22 inches (31 mm) above normal, or 133 percent of normal. A wide swath of 5-10 inches (125-254 mm) of precipitation fell across most of Missouri, Illinois, Indiana, and Ohio. The rest of the region had about 2-5 inches (50.8-125 mm) of precipitation in April. Preliminary statewide precipitation totals ranged from near normal in Kentucky to 2.3 inches (58 mm) above normal in Indiana. Fort Wayne, Indiana, and Ann Arbor, Michigan, had their wettest April on record, measuring 7.39 inches (187.8 mm) and 7.94 inches (201.7 mm), respectively. Numerous locations region-wide had a top 10 wettest April, including Vernon County, Missouri, which recorded 10.18 inches (258.6 mm) for the month (6th wettest since 1894).
Drought
Regional drought improvement that began in March continued through April. The month started with about 62 percent of the region in drought or abnormally dry and ended with about 34 percent affected. Iowa remained the most affected region, although drought severity lessened throughout the month. In the upper Midwest, drought conditions affected northern Minnesota, Michigan’s Upper Peninsula, and portions of Wisconsin. Across the lower Midwest, drought conditions were present in portions of Missouri, far southern Illinois, and extreme western Kentucky. Indiana and Ohio were completely free of drought or abnormal dryness by month’s end.
Notable Weather
An active pattern brought widespread severe wind, hail, and tornadoes to the Midwest on at least eight days in April, plus a few additional days with isolated severe weather. Over 35 tornadoes were confirmed April 1-2 stretching from Missouri to Ohio. Multiple waves of severe weather traversed the central Midwest April 16-18, causing damage from Iowa and Missouri eastward through Ohio. Over two dozen tornadoes were confirmed in western Iowa and Missouri on April 26-27, which was part of a larger outbreak that affected locations from Nebraska to Texas.
For more information, please visit the Midwest Climate Watch Home page.
Southeast (Information provided by the Southeast Regional Climate Center)
Temperature
Temperatures were mostly above average across the Southeast in April, except across parts of Alabama, southern Georgia, and most of Florida, where temperatures were near to slightly below average for the month. The greatest departures were found across Virginia and the Carolinas, where mean monthly temperatures were 3 to 4 degrees F (1.8 to 2.2 degrees C) above average. Temperatures were also above average across Puerto Rico and the U.S. Virgin Islands, with daily heat index values exceeding 100 degrees F (37.8 degrees C) in San Juan, prompting heat advisories from the National Weather Service. Raleigh-Durham, NC and Roanoke, VA recorded their second warmest April on record (since 1887 and 1912, respectively), while Fort Lauderdale, FL and San Juan, PR recorded their fourth warmest April on record (since 1912 and 1898, respectively). Charlottesville, VA tied its fourth warmest April on record (since 1893), while Charlotte, NC and Washington Dulles Airport recorded their fifth warmest April on record (since 1878 and 1962, respectively). The month began with unseasonably warm weather. Mean temperatures were 10 to 20 degrees F (5.6 to 11.1 degrees C) above average across most of the region, with maximum temperatures reaching 80 degrees F (26.7 degrees C) across the northern tier from the 1st to the 3rd. This was followed by several days of unseasonably cool temperatures, with mean temperatures running 5 to 10 degrees F (2.8 to 5.6 degrees C) below average across much of the region. Freeze warnings were issued from Virginia to northern Georgia between the 5th and 7th, with temperatures dropping below 30 degrees F (-1.1 degrees C), and in some cases below 20 degrees F (-6.7 degrees C), across northern and interior portions of the region. Warm weather returned to much of the region during the middle of the month, except across Alabama and much of Florida, with temperatures running 5 to 10 degrees F (2.8 to 5.6 degrees C) above average in most places. The warmest weather was observed between the 15th and 20th, as much of the region was 10 to 20 degrees F (5.6 to 11.1 degrees C) above average. Several locations reached 90 degrees F (32.2 degrees C) for the first time this year between the 18th and 20th, which is 2 to 4 weeks earlier than average. Unseasonably cool weather returned from the 21st to the 24th, with subfreezing temperatures observed as far south as northern Georgia. Freeze warnings were issued across parts of Virginia. Temperatures remained below average across the northern tier of the region through the 26th as a wedge of cool air moved in from the Northeast. Some parts of Virginia and North Carolina were as much as 15 degrees F (8.3 degrees C) below average. Warm weather returned again at the end of the month, with temperatures running between 5 and 15 degrees F (2.8 and 8.3 degrees C) above average across much of the region. Washington Dulles Airport reached 91 degrees F (32.8 degrees C) on the 29th, which is nearly one month earlier than the average first 90 degree F (32.2 degree C) day of the year.
Precipitation
Following a very wet winter and early spring, precipitation in April was mostly below average across the Southeast. The driest locations were found across northern portions of Alabama, Georgia, and South Carolina, central and eastern portions of North Carolina, southern and eastern portions of Virginia, and the southern half of Florida, where monthly totals were 2 to 4 inches (51 to 102 mm) below average (25 to 75 percent of normal). Elizabeth City, NC recorded its third driest April on record (since 1934) with 0.55 inches (14 mm) of precipitation, while Danville, VA recorded its fourth driest April on record (since 1916) with 0.82 inches (21 mm). Raleigh-Durham, NC recorded 1.02 inches (26 mm) in April, which is less than 30 percent of normal. Some locations in South Florida recorded less than half an inch (13 mm) of precipitation (less than 25 percent of normal), including Vero Beach [0.45 inches (11 mm)], Marathon Key [0.35 inches (9 mm)], Marco Island [0.17 inches (4 mm)], and Naples [0.09 inches (2 mm)]. In contrast, above average precipitation was recorded across central and southern portions of Georgia and the central Panhandle of Florida, where monthly totals were 2 to 4 inches (51 to 102 mm) above average (150 to 200 percent of normal). Some locations across North Florida recorded over 10 inches (254 mm) for the month. Much of this precipitation fell on the 10th and 11th in association with a large squall line. Tallahassee, FL recorded 7.11 inches (181 mm), making it the second highest two-day total for the month of April on record (since 1896). Of this, 2.13 inches (54 mm) fell in just one hour, making it the fourth highest hourly total for April since 1942 and prompting flash flood emergencies across the city. Valdosta, GA recorded 5.55 inches (141 mm) on the 10th, making it the wettest April day on record (since 1948). Of this, 1.58 and 1.46 inches (40 and 37 mm) fell in two separate hours. These rank in the top 5 highest hourly totals for April on record. Ocala, FL recorded 7.45 inches (189 mm) on the 11th, making it the second wettest April day on record (since 1892). For the month, Ocala recorded 9.16 inches (233 mm), making it the third wettest April on record. On the 30th, Huntsville, AL recorded 3.37 inches (86 mm) of precipitation, making it the wettest April day on record (since 1894). In terms of winter precipitation, mostly trace amounts of snow and sleet were reported across northern and western portions of Virginia and the Carolinas from the 4th to the 6th, with 1 to 2 inches (25 to 51 mm) across the higher elevations of the Appalachian Mountains. Precipitation was above average across Puerto Rico. The wettest locations were found across southwestern and eastern portions of the island, where monthly totals were 4 to 8 inches (102 to 203 mm) above average (150 to 300 percent of normal), with some locally heavier amounts. San Juan recorded 9.14 inches (232 mm), which is more than twice its normal monthly total. Paraiso, located in the eastern interior portion of the island, recorded its wettest April on record (since 1956) with 23.45 inches (596 mm). Precipitation was also above average across the U.S. Virgin Islands. Most locations on Saint Thomas and Saint John recorded between 3 and 5 inches (76 and 127 mm) for the month, while most locations on Saint Croix recorded between 7 and 10 inches (178 and 254 mm). This included East Hill, which recorded its wettest April on record (since 1972) with 7.25 inches (184 mm) of precipitation.
Drought
Following several months of above average precipitation, April began with nearly the entire region free of any drought or abnormal dryness. However, mostly warm and dry weather during the month resulted in an expansion of abnormal dryness (D0) across eastern and central North Carolina and southern portions of the Florida Peninsula. Abnormal dryness (D0) also emerged across southern Virginia, northern portions of Alabama, Georgia and South Carolina, extreme southwestern Virginia, and around Augusta, GA. Moderate (D1) drought also emerged across southeastern Florida from around Lake Okeechobee to Cape Canaveral. By the end of April, nearly 25 percent of the region was in at least some abnormal dryness or drought. In contrast, moderate (D1) drought was eliminated across Puerto Rico, with only a small pocket of abnormal dryness (D0) remaining in the extreme northwest corner of the island. For the second straight month, abnormal dryness (D0) persisted on Saint Thomas, while Saint John and Saint Croix remained free of any drought or abnormal dryness.
Agriculture
Wet and windy conditions early in the month delayed some field activities, particularly planting and spraying. Some farmers were forced to switch from planting corn to planting cotton or peanuts. However, generally warmer and drier conditions later in the month allowed many farmers to catch up on planting and other field activities. Strawberries and other fruit crops, including blueberries and peaches, were in generally good condition. Winter wheat also improved across parts of Alabama, and soybeans made good progress due to the warm temperatures. Pastures were in good condition across much of the region as initial rounds of cutting and baling were completed, with fewer farmers requiring supplemental hay for feeding. However, wet conditions across parts of central and southern Georgia led to issues with fungal diseases and slowed the harvest of Vidalia onions. Dry weather forced some farmers to begin using irrigation and delayed the planting of cotton and peanuts across parts of the Carolinas. There is concern that dry land corn could be negatively impacted if the dry weather pattern continues. Dry conditions also slowed pasture growth in parts of Florida.
Notable Weather
There were 312 reports of severe weather across the Southeast in April, which is near the median frequency of 322 reports over the period 2000 to 2022 (97 percent of normal). There were 18 confirmed tornadoes (4 EF-0s, 13 EF-1s, 1 EF-2), which is below the median frequency of 31 (58 percent of normal). These tornadoes were split across two severe weather outbreaks. The first occurred on the 2nd and 3rd of the month, where 11 tornadoes touched down across northern and central portions of Alabama and Georgia, as well as northeast Florida and eastern Virginia. The strongest tornado was an EF-2 that touched down in Rockdale County, GA, located southeast of Atlanta. The most significant damage was found in the Briarwood subdivision near the town of Conyers, where numerous homes were heavily damaged or destroyed by falling trees. At least two people were injured. A second outbreak occurred from the 10th to the 12th, where seven tornadoes touched down across southern Alabama, northern Florida, central North Carolina, and southern Virginia. At least one person was injured. Most of the damage consisted of downed trees and power lines with some structural damage to homes and other buildings, including an elementary school in Rowan County, NC. There were 244 wind reports in April, which is above the median frequency of 197 reports (124 percent of normal). The severe weather outbreak on the 2nd and 3rd produced straight-line winds of 50 to 60 mph (22 to 27 m/s) across parts of Alabama and the Carolinas and 60 to 75 mph (27 to 34 m/s) across parts of Florida, with some gusts over 90 mph (40 m/s). These winds brought down numerous trees and power lines and caused significant damage to homes and businesses. Straight-line winds of 50 to 60 mph (22 to 27 m/s) were also reported across the region from southern Alabama to eastern Virginia as part of the severe weather outbreak from the 10th to the 12th. Severe storms on the 20th of the month produced winds of 70 to 90 mph (31 to 40 m/s) along the North and South Carolina border. Numerous trees and power lines were blown over, with damage to homes and businesses, including torn roofs, torn siding, and blown out windows. Multiple injuries were also reported. There were 45 hail reports in April, which is below the median frequency of 94 reports (48 percent of normal). Quarter-sized hail [1 inch (25 mm)] was reported near the Jefferson Memorial and National Mall in Washington D.C. on the 15th. Numerous reports of large hail were found across parts of the Carolinas on the 20th, including some reports of very large hail [over 2 inches (51 mm)]. The largest hailstone was grapefruit-sized [4.5 inches (114 mm)] near the town of Lumberton in Robeson County, NC. This tied for the largest hailstone on record in the state (since 1950) and the first of this size since 2000 (eighth occurrence all-time). Softball-sized [4 inches (102 mm)] hailstones were reported near Rock Hill, SC, the first of this size recorded in the state since 2011. The combination of high winds and very large hail resulted in significant damage to homes and vehicles, with estimated losses of around $5 million. Raleigh, NC recorded a daily pollen concentration of 5,232.7 grains per cubic meter on the 1st of the month, which is the highest daily concentration recorded since 1999. Just two days later, Raleigh recorded its second highest daily concentration with 3,634.6 grains per cubic meter. These contributed to the highest accumulated pollen concentration through the first three months of the season (February-April) since 1999. On the 8th, the U.S. experienced a total solar eclipse. While the Southeast region was not in the path of totality, much of the region experienced at least 70 percent of totality, which resulted in temperature drops of 3 to 5 degrees F (1.6 to 2.8 degrees C). The Masters golf tournament in Augusta, GA recorded its seventh warmest final round on record (since 1934) with a maximum temperature of 86 degrees F (30 degrees C) on the 14th. Wind gusts exceeded 40 mph (18 m/s) during the first two rounds of the tournament, making conditions difficult for the players.
2023 Atlantic Hurricane Season
The Atlantic basin saw seven named storms in September, three of which affected the Southeast region. The circulation associated with Hurricane Lee brought high surf with waves up to 15 feet (4.6 m) and dangerous rip currents to Puerto Rico and the U.S. Virgin Islands on the 11th and 12th of the month. On the morning of the 23rd, Tropical Storm Ophelia made landfall in Emerald Isle, NC with winds of 70 mph (31.3 m/s). It gradually weakened as it tracked inland along the I-95 corridor through eastern North Carolina, becoming a tropical depression after crossing into Virginia later that evening. Wind gusts of 30 to 50 mph (13.4 to 22.4 m/s) were reported across central and eastern portions of North Carolina and Virginia. A few gusts exceeded 70 mph (31.3 m/s) near Wilmington, NC and along the Outer Banks, where storm surge ranged from 2 to 4 feet (0.6 to 1.2 m). Five people were rescued from a boat anchored in Lookout Bight as it was battered by rough surf and high winds. Water levels rose over 3 feet (0.9 m) across parts of the James River, with moderate to major tidal flooding observed in Jamestown and the city of Hopewell in eastern Virginia. Storm surge flooding was also observed on the Neuse and Pamlico rivers in eastern North Carolina, which resulted in significant flooding in the towns of New Bern and Washington. Further inland, flash flooding from heavy rainfall was observed in Greenville, NC and Richmond, VA, resulting in several road closures. Tens of thousands of power outages were reported across North Carolina and Virginia. At the end of the month, the circulation associated with Tropical Storm Philippe brought high surf and dangerous rip currents to Puerto Rico and the U.S. Virgin Islands.
For more information, please visit the Southeast Regional Climate Center Home Page.
High Plains (Information provided by the High Plains Regional Climate Center)
Severe weather significantly ramped up this month, with one of the more impactful outbreaks in recent years striking the southern parts of the region at the end of the month. Heavy precipitation and downpours with the multiple rounds of storms led to tremendous recorded totals. After several weeks of scattered severe storms, conditions rapidly became favorable towards the end of the month. Several weak tornadoes and reports of 3-inch (7.62 cm) hail struck western Kansas and eastern Colorado on the 25th, setting the stage for what was to come. The next day, eastern Nebraska was ravaged by an onslaught of strong tornadoes. Multiple EF-3s struck the state for the first time since 2014, wreaking havoc along their paths. Lincoln narrowly avoided a direct hit, with a large tornado packing 158 mph (254 km/h) winds touching down just on the edge of town. It would track across Interstate 80, before dissipating just outside of Waverly. The same storm would spawn a mile-wide (1.6 km) behemoth that would cause devastating damage to the towns of Elkhorn, Bennington, and Blair on the outskirts of Omaha with 165 mph (266 km/h) winds. Homes were leveled and cars were tossed like ragdolls during its 30-mile (48 km) reign of terror. Downtown Omaha also escaped a near disaster, with another EF-3 touching down at Eppley Airfield. Several hangers and planes were destroyed, with the tornado tracking across the airport before crossing into Iowa. Despite the disaster that had unfolded, there were only a small number of injuries from the tornadoes on the 26th. After several more rounds of severe weather in the following days, the month concluded with an outbreak in Kansas. Several tornadoes touched down, with one dangerously close to Topeka. One did impact the town of Westmoreland, with the EF-3 causing exceptional damage and one fatality.
Temperature
Warmer temperatures returned this month, with the region experiencing slightly above-normal temperatures. Outside of an anomaly, the southern half of the region likely observed their last frost this month. Average temperatures this month were 2 to 4 degrees F (1.1 to 2.2 degrees C) above normal this month. While temperatures were slightly above normal this month, there were no significant records broken. This does, however, continue a trend that stretches back to the beginning of the year with large portions of the region 4 degrees F (2.2 degrees C) above normal. Many locations rank in the top 10 for the warmest January through April, with several locations in the region ranking in the top 5. Sioux Falls, South Dakota and Grand Forks, North Dakota recorded their 4th warmest start to the year, thanks in part to a strong El Nino this winter. Scattered throughout the region ranking as 3rd warmest include Fargo, North Dakota, Grand Junction, Colorado, and Laramie, Wyoming.
Precipitation
The northern High Plains and eastern Kansas received normal to above normal precipitation this month, while others were not as fortunate. Parts of western Kansas are on their second month in a row of well below to near zero amounts. Areas around in southeastern Kansas had buckets of rain dumped on them at the end of the month. Fort Scott and the surrounding areas recorded over 10 inches (25.4 cm) from the 26th to the 28th. Much of this fell on the 28th when locations such as Humboldt observed 8.10 inches (20.57 cm). To the north in South Dakota, several locations were in the top 10 wettest. The town of Martin recorded their wettest April on record, with 4.23 inches (10.74 cm) this month. Rapid City in the west ranked 5th and Pierre in the central part of the state ranked 7th. On the flip side, western Kansas has once again entered an extended period of missing out on any meaningful precipitation. Dodge City tied with 1909 for their driest April, while also ranking 3rd for driest March-April. Nearby places such as Bucklin, Cimarron, and Offerle ranked driest for the two months, with only those locations receiving around 0.25 inches of precipitation (0.64 cm).
Drought
Heavy precipitation this month improved drought conditions for some, while others were not as fortunate. Up to 2 classes of change occurred on both ends of the spectrum, with an overall reduction of 6 percent of D0 to D4 (abnormally dry to exceptional drought conditions) in the High Plains. After steadily climbing out of a significant drought, Kansas took a big step backward this month. At the beginning of April, less than 2 percent of the state was experiencing D2 (severe drought). Over the month, it rapidly rose to over 27 percent. Much of the western part of the state slipped back into drought conditions, after a short period of being close to drought free. The Dakotas received beneficial precipitation this month, reducing the extent of D0 conditions across both states. Most of South Dakota is drought-free, while conditions in northeastern North Dakota remain firmly entrenched. Elsewhere in the region, other improvements and degradation were observed.
For more information, please visit the High Plains Regional Climate Center Home Page.
South (Information provided by the Southern Regional Climate Center)
Severe weather was prevalent in April with several instances of tornadoes, heavy rain, and flooding across the Southern Region.
Temperature
Temperatures were above normal for the entire Southern Region during April, with most stations averaging two to four degrees F above normal. Statewide averages reflected this with all six states in the Region running well above normal: Oklahoma (17th warmest, out of 130 years), the Southern Region as a whole (18th warmest), Texas (19th warmest), Tennessee (22nd warmest), Arkansas (23rd warmest), Louisiana (24th warmest), and Mississippi (24th warmest). The warmest recorded temperature in the Region was 111 F at Rio Grande Village, Texas on April 16th. The coldest recorded temperature in the Region was 13 F at Mt. Leconte, Tennessee on April 8th. The coldest lowland temperature was 25 F at Kingston Springs, Tennessee on April 7th. One long-term station in the Big Bend region of Texas set a record for highest maximum monthly temperature during April: Panther Junction (102 F, April 16th). No long-term stations set records for lowest minimum monthly temperature during April.
Precipitation
Precipitation amounts were mixed across the Southern Region during April. Stations in northeastern Texas, much of Louisiana, central Mississippi, southern Arkansas, southeastern Oklahoma, and isolated portions of the Texas Panhandle received between 150 and 300 percent of normal precipitation, while stations in Deep South Texas, Far West Texas, western Oklahoma, much of Arkansas, and Tennessee were below normal during April. Statewide rankings were above normal for Louisiana (18th wettest), Texas (31st wettest), the Southern Region as a whole (38th wettest), and Mississippi (49th wettest). Oklahoma, Arkansas, and Tennessee were near their historical median values. Three stations, all in Texas, recorded more than 22 inches of precipitation during April: Woodville 7.2 S (23.07 inches), Woodville 5.3 WSW (22.34 inches), and Town Bluff Dam (22.06 inches). Two stations, both in Texas, recorded twelve or more inches of precipitation on a single day: Town Bluff Dam (12.31 inches, April 10th) and Woodville 5.3 WSW (12.0 inches, April 10th). Six long-term stations set single day accumulation records for April: Huntsville, Texas (7.56 inches, April 29th), near Pontotoc, Oklahoma (5.56 inches, April 28th), College Station, Texas (5.43 inches, April 28th), Houston, Mississippi (4.51 inches, April 10th), Cranfills Gap, Texas (3.08 inches, April 28th), and Fort Worth Meacham Field, Texas (2.82 inches, April 20th).
Drought/Flooding
During April, drought conditions remained steady across much of the Region Improvements were noted in western Tennessee, northwestern Mississippi, East Central Arkansas, West Central Louisiana, and isolated portions of Central Texas. Degradations in drought conditions were prevalent across northern Oklahoma, northern Arkansas, and South Central Texas. As of April 30th, according to the US Drought Monitor, Louisiana, Mississippi, and Tennessee are drought free and there is no Exceptional Drought anywhere in the Southern Region. With recent precipitation across the Region, soil moisture has continued to rebound with the USDA reporting mostly adequate subsoil moisture, as of April 28th, in Louisiana (83 percent), Tennessee (81 percent), and Mississippi (70 percent). The only state with less than 50 percent of land having adequate subsoil moisture is Texas (44 percent). Worsening drought conditions in Santa Rosa, Texas have led to the shutdown of the only operating sugar mill in the State due to lack of adequate water supply. Flash flooding and river flooding were associated with an outbreak of severe weather across parts of Oklahoma and North Texas on April 27th and 28th. Around this same time heavy rains in East Texas began to fall and led to evacuations and flooding in that region of Texas over the following days.
Notable Weather
A slow-moving but potent late April storm system produced an outbreak of at least 27 tornadoes and other types of severe weather from the late morning of April 27, 2024 through the early morning hours of April 28, 2024 in central Oklahoma and western North Texas. Excessive rainfall of 4 to 8.75 inches produced severe flash flooding and river flooding across parts of Oklahoma and western North Texas. Hail up to 3 inches in diameter and severe wind gusts up to 60 mph were observed during this event. There were 76 tornadoes reported across the Southern Region in April: 19 rated EF0, 48 EF1, 6 EF2, 2 EF3, and 1 EF4, with at least one tornado in every state in the Southern Region. On April 27th an EF4 tornado struck Marietta, Oklahoma, resulting in one fatality. Also on April 27th, an EF3 tornado struck Sulphur, Oklahoma, resulting in one fatality. There were 263 reports of hail across the Region in April, with the largest being 4.5 inches near Briar, Texas on April 1st. There were 336 severe wind reports, with the fastest being 88 mph on April 9th at Caprock Canyons State Park, Texas.
For more information, please visit the Southern Regional Climate Center Home Page.
West (Information provided by the Western Region Climate Center)
The month of April was marked by average temperatures across most of the western United States and no areas experiencing below-average temperatures. Some areas of warmer than average temperatures occurred in the northern and northwestern states in the region. Precipitation records were broken in multiple states for both lack of precipitation and record rainfall totals. Record low snowpack continues to be a problem for areas in the northern Rockies.
Temperature
Most of the western United States recorded average temperatures for the month of April. Areas of temperatures two to five degrees Fahrenheit above normal occurred in western Montana, northwestern Washington, and northern Utah. Many areas in western Montana were four to five degrees Fahrenheit above average. Some of these locations include Glasgow, 4 degrees Fahrenheit above normal, Circle, 4 degrees Fahrenheit above normal, Terry, 5 degrees Fahrenheit above normal, and Mildred, 4 degrees Fahrenheit above normal. Quillayute, Washington recorded its third warmest April with an average of 50 degrees Fahrenheit (3 degrees Fahrenheit above normal). Other cities of noticeable warmer averages were Everett, Washington (2 degrees Fahrenheit above normal), Logan, Utah (2 degrees Fahrenheit above normal), and Neola, Utah (3 degrees Fahrenheit above normal). The western United States recorded no areas with below average temperatures.
Precipitation
Conditions were near record and above record dryness in western Montana, most of New Mexico, and scattered across Washington. Montana had many locations reporting averages more than an inch below normal. Glendive recorded its third driest April with a 0.03 inches total (1.47 inches below normal), Plevna was 1.44 inches below normal, Circle was 1.15 inches below normal, and Terry was 1.38 inches below normal. New Mexico recorded four stations that tied their driest April records in Carlsbad (0.45 inches below normal), Gran Quivira (0.56 inches below normal), Yeso (0.78 inches below normal), and Hillsboro (0.35 inches below normal). Washington also had a few below average precipitation totals in Seattle (2.29 inches below normal), Mazama (0.74 inches below average), and Walla Walla (1.58 inches below normal). On the other hand, areas in Arizona, Idaho, and Nevada had above average precipitation totals for the month of April. Arizona, in particular, recorded record and near record totals for most of the state, including Cameron which had its record wettest at 3.91 inches (3.5 inches above normal), Wilcox at 0.47 inches above normal, Hereford at 0.81 inches above normal, and Youngtown at 1.09 inches above normal. Winnemucca, Nevada reported 1.1 inches above normal and Boise, Idaho with its 4th wettest April at 1.14 inches above normal.
Drought
According to the U.S. Drought Monitor (USDM) at the end of April, 20.6 percent of the West was in drought, a slight improvement from last month. Areas of extreme (D3) and exceptional (D4) drought are still found in southern New Mexico and western Montana. Areas of dryness and drought are found in all western states, however most of them are only in moderate (D1) or abnormally dry (D0) conditions.
Alaska Summary
Temperatures were above normal for the western Interior and Southeast with temperatures in those locations ranging from two to seven degrees Fahrenheit above normal. Eagle broke its warmest April record at 36.7 degrees Fahrenheit, 7 degrees Fahrenheit above normal. Sitka was 2 degrees Fahrenheit above normal, and Craig was 4 degrees Fahrenheit above normal with a mean temperature of 46.4 degrees Fahrenheit. Eastern, northeastern, and Kodiak Island Alaska recorded above average precipitation totals. Kotzebue saw 0.75 inches above normal; Nome saw 1.9 inches of precipitation (1.16 inches above normal), Barrow saw 0.31 inches above normal, and Kodiak saw its second wettest April at 10.38 inches (4.24 inches above normal) about 170 percent of normal. Tied record dryness was seen in central and western Alaska, where three stations reported 0 inches for the month of April, including Tanana (0.3 inches below average), Northway (0.22 inches below average), and Chicken (0.3 inches below average). From the USDM, abnormally dry conditions (D0) can be found in the southeast region with a risk of degradation.
Hawaii Summary
Hawaii saw average temperatures across most of the state for the month of April with sites only being a degree or two Fahrenheit warmer. Kauai Island saw above average precipitation totals with Lihue setting a record 13.14 inches (11.11 inches above average) about a 650 percent increase of normal. The rest of the islands saw average precipitation totals. Drought conditions improved for the state with only 33.4 percent being in D1 or higher, an 8.6 percent decrease from March. Areas of severe drought (D2) are occurring on the Big Island and Maui.
Notable Weather
Below average snowpack in Montana threatens water supply: This winter for Montana has been its worst snowpack in 25 years. Upcoming weather conditions are not favorable in helping the water supply with summer streamflow predictions estimated at well below normal for most of the state. The snowpack total was nearly 5 inches of snow water equivalent below normal by the second week of April. Montana’s current snowpack is only at 12 inches of snow water equivalent, 74 percent of normal. The Bear Paw snowpack is already entirely gone with many other locations sitting between 45 to 69 percent of average.
For more information, please go to the Western Regional Climate Center Home Page.