National Overview

June Highlights


June Temperature

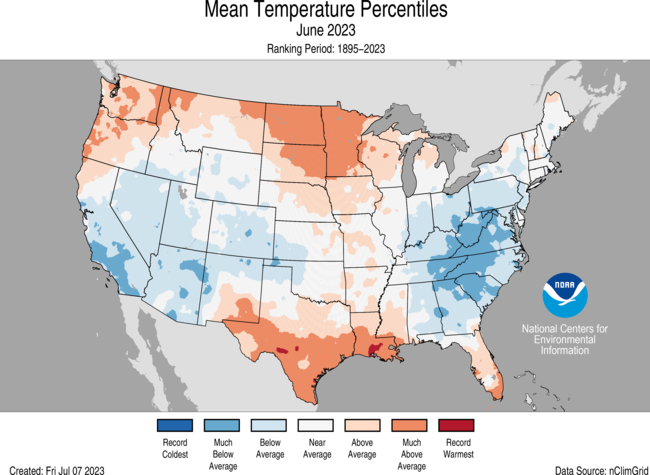
The contiguous U.S. average temperature during June was 69.0°F, 0.5°F above average, ranking in the middle third of the 129-year record.
Generally, temperatures were below average from California to the central Plains and across much of the Mid-Atlantic and Southeast. Temperatures were above average from the Northwest to the northern Plains, as well as in the southern Plains and Florida Peninsula.
For the month of June, North Dakota ranked third warmest on record while Minnesota ranked fourth and Louisiana ranked ninth warmest on record. Conversely, West Virginia and Virginia had their ninth- and 10th-coldest June on record, respectively.
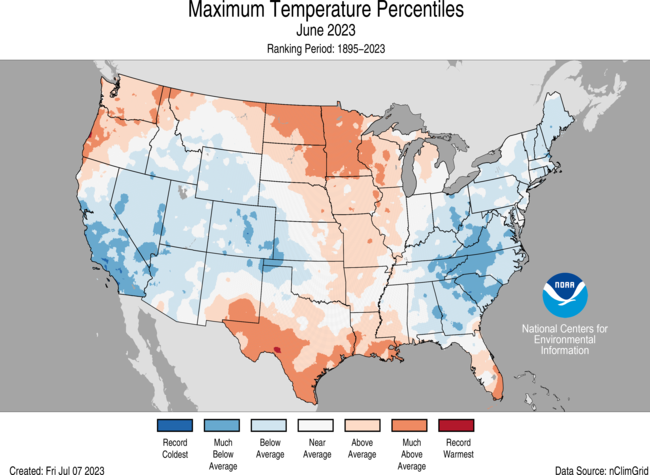
The contiguous U.S. average maximum (daytime) temperature during June was 81.6°F, 0.3°F above the 20th century average, ranking in the middle third of the historical record. Maximum temperatures were above average across much of the Northwest, from the northern Plains to the Lower Mississippi River Valley and in parts of the southern Plains and Florida Peninsula. Temperatures were below average from Califorina to the central Rockies and across much of the Eastern U.S. Minnesota and North Dakota ranked sixth and seventh warmest June for daytime temperatures, respectively, while South Carolina had its eighth coldest June for daytime temperatures.
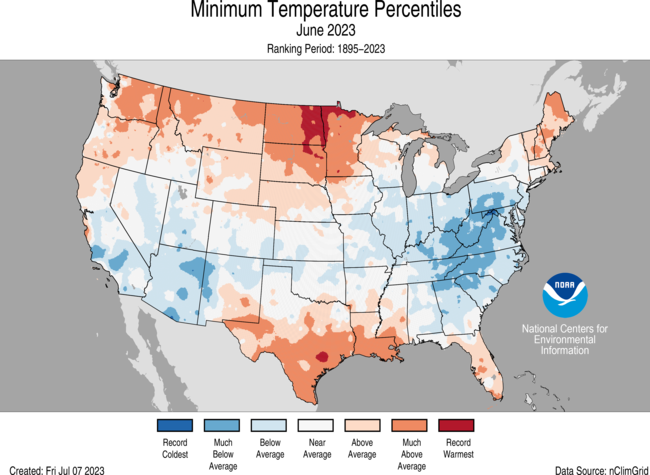
The contiguous U.S. average minimum (nighttime) temperature during June was 56.4°F, 0.8°F above the 20th century average, ranking in the middle third of the historical record. Minimum temperatures were above average from the Northwest to the northern Plains and in parts of the northern Great Lakes, southern Plains, Northeast and Florida. Temperatures were near or below normal from California to the central Mississippi River Valley and across much of the Ohio River Valley and Mid-Atlantic, and in parts of the Northeast and Southeast. North Dakota ranked second warmest June on record, while four additional states experienced a top-10 warmest June for nighttime temperatures. Conversly, West Virginia had its sixth coldest June on record for nighttime temperatures.
The Alaska statewide June temperature was 50.0°F, 0.8°F above the long-term average. This ranked in the middle third of the 99-year period of record for the state. Temperatures were above average across the Aleutians and in parts of the North Slope and the Southeast during the month while small pockets of below-average temperatures were observed in interior portions of the state.
Based on NOAA's Residential Energy Demand Temperature Index (REDTI), the contiguous U.S. temperature-related energy demand during June was 81 percent of average and the 47th-lowest value in the 129-year period of record.
June Precipitation
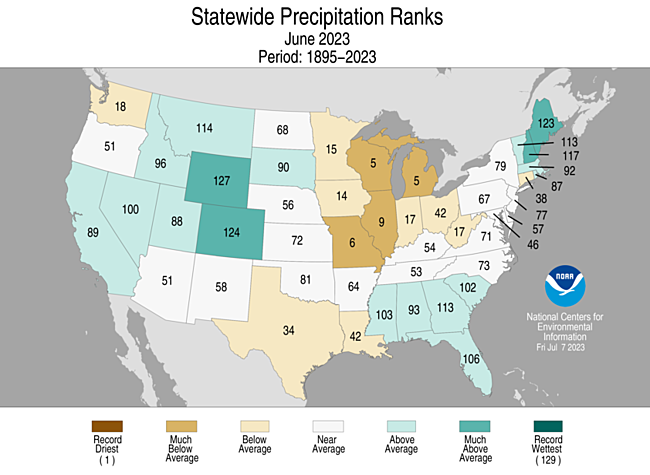
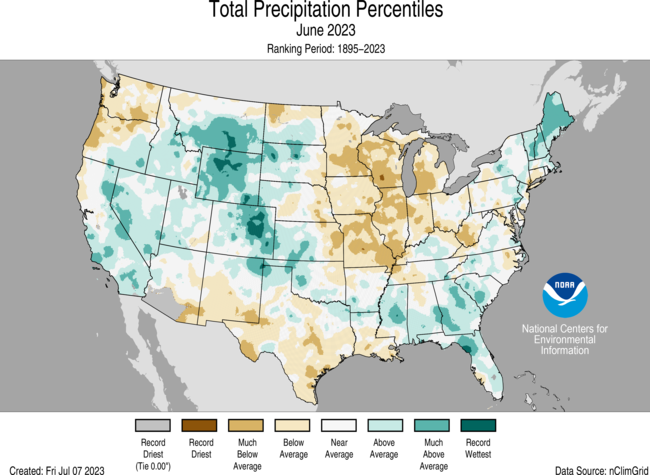
The June precipitation total for the contiguous U.S. was 2.85 inches, 0.08 inch above average, ranking in the middle third of the 129-year record.
Precipitation was above average across much of the West and western portions of the Great Plains, and in parts of the Southeast and New England. Precipitation was below average across much of the Midwest and in parts of the Northwest, Southwest, southern Plains, Mid-Atlantic and southern New England.
Wisconsin and Michigan each had their fifth-driest June on record, while two additional states had their top-10 driest June on record. Conversely, Wyoming ranked third wettest with two additional states ranking among their top-10 wettest June on record.
Across the state of Alaska, the average monthly precipitation was 2.85 inches, making last month the 19th-wettest June in the 99-year record. Conditions were wetter than average across most of the state while parts of the Northeast, Southwest and Panhandle were near normal and parts of the Southeast Interior and Aleutians observed below-normal precipitation during the month.
According to the July 4 U.S. Drought Monitor, about 27.0% of the contiguous U.S. was in drought, up about 8.0% from the end of May. Drought or abnormally dry conditions expanded or intensified in parts of the Northwest, eastern Plains, Mississippi River Valley, Great Lakes, Northeast, Alaska, Hawaii and Puerto Rico this month. Drought contracted or was reduced in intensity across interior parts of the West, the western Great Plains, and parts of the Ohio and Tennessee valleys, Florida Peninsula and Northeast.
Billion-Dollar Weather and Climate Disasters
Three new billion-dollar weather and climate disasters were confirmed this month, two of which occurred during the month of May. All of these disasters were severe storm events.
There have been 12 confirmed weather and climate disaster events, each with losses exceeding $1 billion this year. These disasters consisted of ten severe storm events, one winter storm and one flooding event. The total cost of these events exceeds $32.7 billion, and they have resulted in 100 direct and indirect fatalities. For this year-to-date period, the first six months of 2023 rank second-highest for disaster count, behind 2017 with 14 disasters and behind 2021 which had $42.5 billion in terms of total cost.
The very active U.S. severe storm season is reflected in the high count of billion-dollar events that have produced destructive tornadoes, severe hail and high wind across much of the central and eastern U.S.
The 1980–2022 annual average is 8.1 events (CPI-adjusted); the annual average for the most recent five years (2018–2022) is 18.0 events (CPI-adjusted).
Since these billion-dollar disaster records began in 1980, the U.S. has sustained 360 separate weather and climate disasters where overall damages/costs reached or exceeded $1 billion (based on the CPI adjustment to 2023) per event. The total cost of these 360 events exceeds $2.570 trillion.
Other Notable Events
Heat waves impacted the southern Plains, Northeast and Puerto Rico this month, breaking temperature records and creating life-threatening conditions:
- An early June heat wave brought life-threatening conditions to Puerto Rico as heat indices reached as high as 125°F. On June 6, San Juan set a new daily high temperature record of 95°F.
- A heat wave brought record heat to portions of the Northeast, Mid-Atlantic and Great Lakes during early June. Daily temperature records were set in parts of Michigan, New York and Vermont.
- A heat wave caused temperatures to soar well above 100°F across parts of the southern Plains. In Texas, the cities of Del Rio and Rio Grande reached 113°F and San Angelo reported 114°F on June 20, setting the all-time heat record at each location. On June 24, the temperature at Rio Grande Village, Texas, topped out at 119°F–1°F below the all-time temperature record for the state.
Smoke from Canadian wildfire created air quality issues for millions in portions of the Northeast and Great Lakes this June:
- On June 7, around 100 million people across 16 states were under air quality alerts while New York City reported the worst air quality of major cities worldwide.
- On June 27, wildfire smoke impacted a large portion of the Midwest, resulting in the city of Chicago having the worst air quality of major cities worldwide.
Several notable weather systems produced severe thunderstorms and tornadoes that impacted portions of the U.S. in June:
- On June 14-19, a tornado outbreak, including two EF-3 tornadoes, occurred across parts of the southern U.S. and Ohio Valley.
- On June 16, a severe storm brought tornadoes and flash flooding to parts of Pensacola, FL. The airport received over 9 inches of rainfall, surpassing the previous daily record set in 1985.
- On June 20-26, over 70 tornadoes were confirmed, including two EF-3 tornadoes, resulting in loss of life and widespread damage across portions of the Great Plains, Midwest and eastern U.S.
- On June 29, a life-threatening derecho brought severe thunderstorms, tornadoes and wind gusts upwards of 100 mph to a large portion of the Midwest, causing significant damage to homes and leaving hundreds of thousands without power in the region.
Year-to-Date Highlights


January-June Temperature

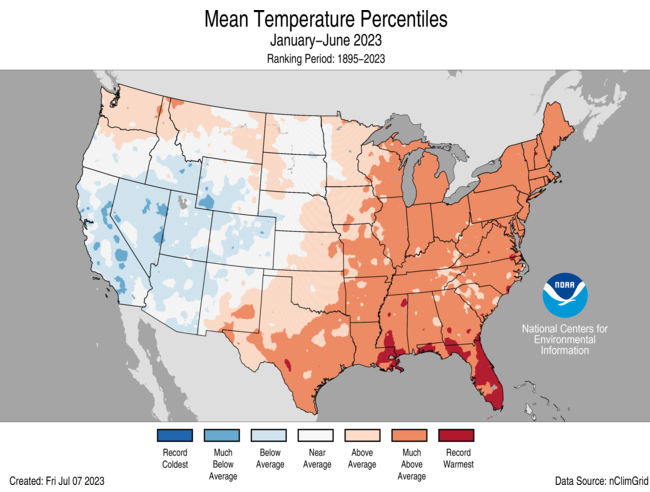
For the January-June period, the average contiguous U.S. temperature was 49.2°F, 1.7°F above average, ranking 21st warmest on record for this period.
Temperatures were above average from the southern Plains to the East Coast and along parts of the Northern Tier, with near- to below-average temperatures from the northern Plains to the West Coast.
Florida ranked warmest on record while Massachusetts had its second-warmest January–June period. An additional 27 states had a top-10 warmest year-to-date period. No state experienced a top-10 coldest event for this six-month period.
The contiguous U.S. average maximum (daytime) temperature during January-June was 60.8°F, 1.5°F above the 20th century average, ranking in the warmest third of the historical record. Above-average temperatures were observed across much of the eastern contiguous U.S. and in parts of the Northwest. Near- to below-average temperatures were observed from the northern Plains to the West Coast. Florida ranked warmest on record while Pennsylvania, New Jersey, Maryland and Delaware each ranked second warmest on record for daytime temperatures during January-June period, while 21 additional states ranked among their top-10 warmest January-June on record for daytime temperatures. No state experienced a top-10 coldest June on record for this six-month period.
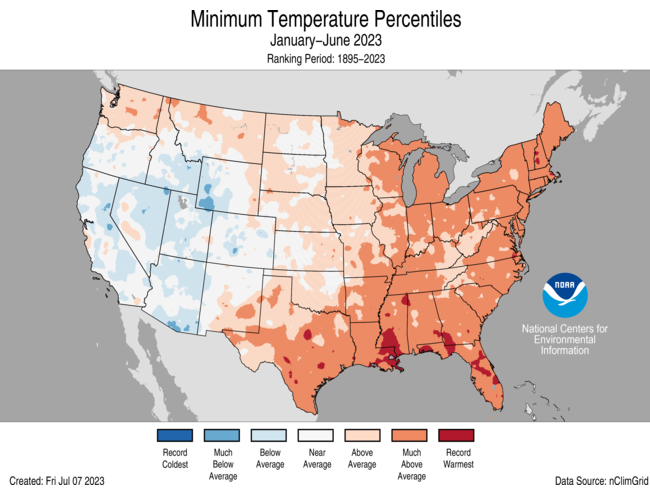
The contiguous U.S. average minimum (nighttime) temperature during this six-month period was 37.6°F, 1.9°F above the 20th century average, ranking 17th warmest in the historical record. Above-average nighttime temperatures were observed across much of the eastern contiguous U.S. and along parts of the Northwest and Plains. Florida ranked second warmest on record, while New Hampshire, Massachusetts and Mississippi each ranked third warmest on record for nighttime temperatures. 23 additional states experienced a top-10 warmest event for nighttime temperatures during the January-June period. Nighttime temperatures were near- to below-average from the West Coast to the Rockies and in parts of the Plains.
The Alaska January-June temperature was 22.8°F, 1.5°F above the long-term average, ranking in the middle third of the historical record for the state. Much of the state was near-normal for the six-month period while temperatures were above average across much of the North Slope and in parts of the southeast, Kodiak Island and the Aleutians.
Based on REDTI, the contiguous U.S. temperature-related energy demand during January-June was 29 percent of average and was the third-lowest value on record.
January-June Precipitation

The January-June precipitation total for the contiguous U.S. was 15.70 inches, 0.39 inch above average, ranking in the middle third of the 129-year record.
Precipitation was above average from California to the western Great Plains and in parts of the southern Mississippi Valley, northern Great Lakes, Southeast and Northeast.
Conversely, precipitation was below average across parts of the Northwest, northern and central Plains, Southwest, central Mississippi Valley, Mid-Atlantic and along parts of the Gulf during the January–June period. Maryland ranked fourth driest on record for this six-month period.
The January-June precipitation ranked 14th wettest in the 99-year record for Alaska, with above-average precipitation observed across much of the state. Precipitation was near average in parts of south-central Alaska and along the Gulf of Alaska coast while below-average precipitation was observed in part of the Aleutians during this period.
Extremes
The U.S. Climate Extremes Index (USCEI) for the year-to-date period was 15 percent above average, ranking in the middle third of the 114-year period of record. Extremes in warm maximum temperatures and warm minimum temperatures were the major contributors to this elevated CEI value. The USCEI is an index that tracks extremes (occurring in the upper or lower 10 percent of the record) in temperature, precipitation and drought across the contiguous United States.
On the regional scale, the South and Ohio Valley ranked above average while the Northeast and Southeast ranked much-above average for this year-to-date period. Each of these regions experienced elevated extremes in warm maximum temperatures and warm minimum temperatures. Conversely, extremes across the Northwest were 96 percent below average ranking as their second lowest year-to-date period on record.
Monthly Outlook
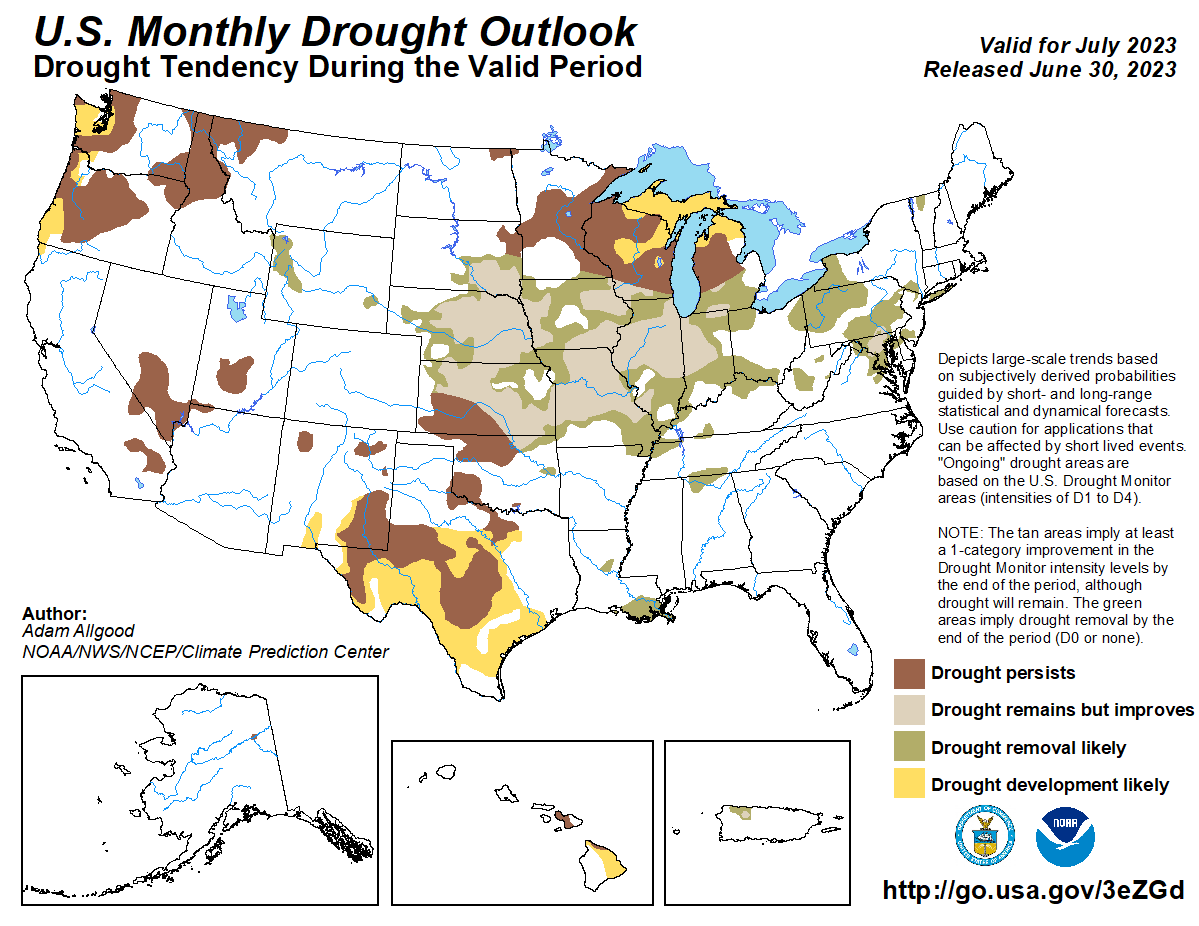
According to the June 30 One-Month Outlook from the Climate Prediction Center, areas from Arizona to the East Coast and in parts of the Northwest, Great Lakes and northeast Alaska favor above-normal monthly average temperatures in July, with the greatest odds in parts of the southern Plains. The best chances for below-normal temperatures are forecast for parts of the central Rockies, northern Plains and in parts of southwest Alaska. Much of the Plains to the Northeast, as well as parts of northern and eastern Alaska are favored to see above-normal monthly total precipitation while below-normal precipitation is most likely to occur in parts of the Southwest. Drought improvement or removal is forecast from the central Plains to the southern Great Lakes and in parts of the Northeast, southern Louisiana and Puerto Rico, while persistence is more likely in portions of the Northwest, Southwest, southern Plains, northern Great Lakes and parts of the central Plains and Hawaii. Drought development is likely in parts of the Northwest, southern Plains, Great Lakes and Hawaii.
According to the One-Month Outlook issued on July 1 from the National Interagency Fire Center, Hawaii and portions of the Northwest, northern Great Lakes and Southwest have above-normal significant wildland fire potential during July, while parts of California, New Mexico and Alaska are expected to have below-normal potential for the month.
Regional Highlights
These regional summaries were provided by the six Regional Climate Centers and reflect conditions in their respective regions. These six regions differ spatially from the nine climatic regions of the National Centers for Environmental Information.
Northeast (Information provided by the Northeast Regional Climate Center)
June was consistently cool across the Northeast and featured variable amounts of precipitation, as well as multiple rounds of reduced air quality.
Temperature
The Northeast’s average temperature for June was 63.7 degrees F, 1.8 degrees F cooler than normal. All twelve Northeast states wrapped up June on the cool side of normal, with average temperatures ranging from 4.0 degrees F below normal in West Virginia, its ninth coolest June since 1895, to 0.4 degrees F below normal in Vermont.
Precipitation
June precipitation in the Northeast totaled 4.46 inches, 101 percent of normal. For the 12 Northeast states, precipitation ranged from 59 percent of normal in Connecticut to 156 percent of normal in Maine. This June ranked as West Virginia’s 17th driest on record but among the 20 wettest Junes for three states: Maine, seventh wettest; New Hampshire, 13th wettest; and Vermont, 17th wettest.
Drought
The U.S. Drought Monitor from June 6 showed 20 percent of the Northeast in moderate drought and 47 percent as abnormally dry. During the first three weeks of June, drought and abnormally dry conditions generally persisted or deteriorated in many parts of the Northeast. Severe drought was introduced in south-central Pennsylvania and central Maryland, while moderate drought and/or abnormal dryness expanded in West Virginia, Maryland, Pennsylvania, New Jersey, New York, and Connecticut. This was due to increasing precipitation deficits, low streamflow, below-normal groundwater levels, declining soil moisture, and impacts on agriculture and water resources. The main exception was northern New England, which saw some improvement due to abundant rain. During the last week of the month, locally heavy rainfall chipped away at drought and dryness across much of the region, with drought and/or abnormal dryness contracting in the Mid-Atlantic states and New York. The U.S. Drought Monitor from June 27 showed 1 percent of the Northeast in severe drought, 24 percent in moderate drought, and 40 percent as abnormally dry. At times during June, record low 7-day streamflow and/or groundwater levels were noted in parts of West Virginia, Maryland, New Jersey, Pennsylvania, and New York. Streamflow on the Potomac River in Maryland dropped to a level low enough to require daily monitoring. The low streamflow contributed to an abundance of algae that altered the taste and smell of the drinking water in some areas. Low streamflow temporarily halted whitewater rafting activities in part of West Virginia. Falling water levels in reservoirs prompted New Jersey officials to ask residents to conserve water. Meanwhile, at least 18 water suppliers in Pennsylvania asked customers to voluntarily conserve water. Pennsylvania has seen an uptick in wildfires this year, with officials temporarily prohibiting open fires in all state forests due to the dry conditions. Burn bans were enacted in several municipalities and counties in central Pennsylvania. Dry conditions have also helped fuel wildfires in New Jersey, which had seen at least 10 major fires between January 1 and mid-June. Two large fires in June were caused by lightning, an uncommon occurrence in the state. For the week ending June 18, topsoil moisture was rated very short (the lowest rating) for 71 percent of Maryland and was rated short (the second lowest rating) for just under 50 percent of Pennsylvania and West Virginia. For the same period, pasture and range conditions were rated very poor or poor for just under half of Pennsylvania and around a quarter of Maryland. Growers in several states relied on irrigation to keep plants growing; however, it increased operation costs. In parts of Pennsylvania, emergence of some crops such as corn and soybeans were slow and issues such as uneven corn fill was observed. Farmers in Pennsylvania also noted that it was difficult for newly planted crops to establish roots and some pastures turned brown, with reduced wheat yields expected. However, the conditions were favorable for haymaking and allowed for plenty of fieldwork. In some eastern West Virginia locations, seeds failed to germinate, and grass was growing slowly. Meanwhile, growers in parts of Maryland noted stunted corn and soybean crops and slow growth of hay, with reduced yields anticipated.
Notable Weather
The first two days of June featured highs in the 90s in northern areas, allowing a few sites to have one of their 10 warmest June temperatures on record. The weather pattern from around June 3 to 10 featured a stalled upper-level low pressure system near northern New England and a high-pressure system over the central U.S., producing northerly winds over much of the Northeast and ushering cooler-than-normal air and thick smoke from wildfires burning in the province of Quebec, Canada. Air Quality Alerts were in place for several days as the air smelled of smoke. The air quality index, which ranges from 1 to 500, reached 151 (unhealthy), 201 (very unhealthy), or even 301 (hazardous) in most Northeast states, with some locations approaching 500. Multiple locations had their poorest air quality since Environmental Protection Agency records began in 1999 including New York City. Visibilities were reduced to as little as a half-mile at times, leading to flight delays and, in some cases, temporary ground stops at major airports such Newark, LaGuardia, Kennedy, and Philadelphia. Major sporting events and outdoor activities were cancelled, while outdoor spaces such as zoos and parks were closed in some areas. Daily high temperatures were slightly cooler due to the thick smoke. There were generally limited opportunities for meaningful rainfall during this period; however, enough rain fell on June 8 to end Binghamton, New York’s driest 30-day period on record: 0.04 inches of precipitation from May 21 to June 7. Closer to the upper low, Maine was mostly spared from the worst of the poor air quality but saw numerous showers and cool temperatures. For instance, Caribou, Maine, had its longest streak of June days with a high less than 60 degrees F with seven such days from June 3 to 9. Parts of the Northeast saw additional rounds of wildfire smoke, mostly aloft, through mid-month. June wrapped up as it began—with a significant amount of wildfire smoke pouring into the region. While not as intense as the early-June event, air quality between June 28 and 30 reached unhealthy levels in multiple states and very unhealthy levels in Pennsylvania. Smoke hung in the air, reducing visibilities, leading to closures of things such as pools and camps, and sending outdoor activities inside. While the wildfire smoke was likely the biggest story of the month, there were a few other notable events. Several rounds of severe storms, on June 12, June 16, and from June 25 to 27, produced small hail and downed trees and wires in multiple parts of the region. There were five weak tornadoes: three in Pennsylvania and two in New Jersey, with damage generally limited to trees. Some storms also produced torrential rain, with localized amounts of 4 to 7 inches in portions of northern Delaware, southeastern Pennsylvania, and northern New Jersey. Storm reports noted flooded roads and multiple water rescues. Wilmington, Delaware, saw two of its 10 wettest June days this month, each with over 3 inches of rain. The site had its third wettest June and its 10th all-time wettest month with 11.91 of precipitation.
For more information, please visit the Northeast Regional Climate Center Home Page.
Midwest Region (Information provided by the Midwest Regional Climate Center)
Temperature
The average June temperature for the Midwest was 69.3 degrees F (20.7 degrees C), which was 0.3 degrees F (0.2 degrees C) above the 1991-2020 normal. Temperatures were up to 5 degrees F (2.8 degrees C) above normal in the northwest and up to 4 degrees F (2.2 degrees C) below normal in the southeast. Maximum and minimum temperatures followed a similar west-to-east pattern. Preliminary statewide average temperatures ranged from 4.1 degrees F (2.3 degrees C) above normal in Minnesota to 2.9 degrees F (1.6 degrees C) below normal in Kentucky and Ohio. Preliminary rankings indicate Minnesota tied for the 4th warmest June since 1895. Minneapolis-St. Paul had the 3rd warmest June in 151 years. Over 500 daily high temperature records were broken or tied in June, with nearly all of those occurring from June 1-5. Over 380 daily low temperature records were broken or tied in June, with a large portion of those records occurring from June 8-16. Dangerous heat index values settled across the lower Midwest in late June. Heat index values ranged from 100-115 degrees F (38-46 degrees C) across Missouri, southern Illinois, southern Indiana, and western Kentucky on multiple days during the last week of June.
Precipitation
June precipitation totaled 2.6 inches (66 mm) for the Midwest, which was 1.94 inches (49 mm) below normal, or 57 percent of normal. Based on preliminary rankings, the Midwest had the 5th driest June since 1895. All nine Midwestern states measured below-normal precipitation, with totals ranging from 0.2 inches (5 mm) below normal in Kentucky to 2.71 inches (69 mm) below normal in Illinois. Preliminary rankings indicate Wisconsin was tied for the 5th driest June on record, while Missouri was tied for 7th driest. Illinois had the 10th driest June since 1895. A large portion of the Midwest had less than 50 percent of normal precipitation in June, with patchy areas of 10-25 percent of normal precipitation. Charles City, Iowa, had its driest June in 131 years, with just 0.37 inches (9.4 mm) of precipitation for the month. Hasting, Michigan, had its driest June in 120 years of observations. Minneapolis-St. Paul had the 2nd driest June in 151 years. Muskegon, Michigan, had the 3rd driest June in 124 years. Notably, numerous locations in Illinois, Indiana, Michigan, Ohio, and Wisconsin exceeded 20 consecutive days without precipitation from May into early June. Knoxville and Galesburg, Illinois, went 27 days without rainfall from May 15 to June 10. Conversely, central Kentucky had near- to above-normal precipitation in June, with a wide swath of the region accumulating up to 7.5 inches (190.5 mm) for the month. Numerous central Kentucky stations reported one-day rainfall totals of 2-4 inches (50.8-101.6 mm) on June 26.
Drought
A lack of rainfall, low humidity, and abundant sunshine resulted in drought expansion and intensification across the Midwest in June. By month’s end, about 65 percent of the region was in drought, and 26 percent was abnormally dry, according to the U.S. Drought Monitor. Drought affected all nine Midwest states. Extreme (D3) drought conditions were reported in central and northeast Missouri and southeast Iowa. A large portion of Illinois and Indiana were degraded to severe drought (D2). The only locations with drought improvement in June were Kentucky and central Ohio. Elevated fire danger was widespread across Michigan for the first several weeks of June. In early June, a wildfire burned 3,600 acres in northern Michigan, prompting evacuations and closing a 5-mile stretch of Interstate 75. With just 3 days, the Indianapolis Airport had the fewest number of June days on record where the dew point temperature reached or exceeded 65 degrees F (18.3 degrees C). By late June, topsoil moisture was short to very short on over 85 percent of cropland in Illinois, Michigan, and Missouri. In those same states, corn conditions were rated poor to very poor on 25-30 percent of acres.
Notable Weather
Air Quality: Ongoing Canadian wildfires and a persistent upper air pattern resulted in an excessive number of air quality alerts across the Midwest in June. Most NWS offices across the region issued over 20 alerts during the month. The NWS in Northern Indiana issued 46 alerts, the highest in the country. The Air Quality Index (AQI) exceeded 101 (unhealthy for sensitive groups) nearly every day of the month, with about half the days exceeding 151 (unhealthy). The worst air quality was measured on June 27 and June 28 when the AQI exceeded 201 (very unhealthy) across a large portion of the central Midwest, including areas near Madison, Chicago, Indianapolis, Detroit, and Cleveland.
June 25 Severe Weather Outbreak: A frontal system traversed the Midwest on June 25, prompting high winds, large hail, and some isolated tornadoes across Michigan, Indiana, and Kentucky. Michigan primarily had widespread wind damage, with gusts reaching up to 65 mph (105 kph), and nearly 80,000 customers experienced power outages. There were 4 confirmed tornadoes in Indiana, and tragically, one resulting fatality. There were numerous reports of large hail ranging in size from 2-4 inches (50.8-101.6 mm) from nearly a dozen Indiana counties. Kentucky was affected by straight-line winds up to 110 mph (177 kph), several confirmed tornadoes, and large damaging hail June 29 Derecho and Severe Weather: A damaging storm with widespread 70 mph (113 kph) winds moved southeast across Illinois and Indiana on June 29. The storm downed trees and powerlines, damaged buildings, and caused extensive power outages. Several tornadoes were confirmed in Illinois.For further details on the weather and climate events in the Midwest, see the weekly and monthly reports at the Midwest Climate Watch page.
Southeast (Information provided by the Southeast Regional Climate Center)
Temperature
For the second straight month, mean temperatures in June were below average across much of the Southeast region. The greatest departures were found across central portions of Virginia and the Carolinas, as well as pockets of Georgia and Alabama, where temperatures were 4 to 5 degrees F (2.2 to 2.8 degrees C) below average, with some locations running up to 7 degrees F (3.9 degrees C) below average for the month. Several long-term stations recorded one of their coldest Junes on record, including Mount Airy, NC (coldest in a record going back to 1893), Statesville, NC (coldest in a record going back to 1901), and Lexington, VA (tied for coldest in a record going back to 1889). Many of the coolest temperatures during the month occurred on the 9th and 10th as a high pressure from Canada settled over much of the region. Minimum temperatures dropped below 40 degrees F (4.4 degrees C) across the higher elevations of the Southern Appalachian Mountains, with subfreezing temperatures observed in a few spots. Clouds and precipitation associated with an upper-level low resulted in more unseasonably cool weather on the 21st and 22nd, with mean temperatures from northern Georgia to northern Virginia between 10 and 15 degrees F (5.6 and 8.3 degrees C) below average. In contrast, mean temperatures were 1 to 2 degrees F (0.5 to 1.1 degrees C) above average across southern portions of Alabama and Georgia, and much of South Florida. Key West, FL recorded its second warmest June on record (since 1871). Remarkably, the greatest departures were found across Puerto Rico and the U.S. Virgin Islands, where temperatures were 3 to 4 degrees (1.6 to 2.2 degrees C) above average in places. San Juan, PR recorded its second warmest June on record (since 1898), while Saint Croix tied its third warmest June on record (since 1951). Extreme heat was observed across much of the Caribbean during the first half of the month. Several daily temperature records were tied or broken across Puerto Rico. San Juan tied its highest minimum temperature for any June day of 82 degrees F (27.8 degrees C) from the 3rd to the 5th. Excessive heat warnings were issued across the island as heat index values approached 110 degrees F (43.3 degrees C). The persistence of the heat was also noteworthy. San Juan recorded its highest mean average temperature for any 2-week period on record of 86.8 degrees F (30.4 degrees C) between the 3rd and 16th of the month. The heat index at San Juan also reached 107 degrees C (41.7 degrees C) during this period, which is just two degrees shy of the June record (since 2000). Above average temperatures were also observed across the rest of the region during the latter part of the month. Brunswick, GA and Muscle Shoals, AL reached 100 degrees F (37.8 degrees C) on the 27th and 30th, respectively. Minimum temperatures were also quite warm in places. On the 27th, Dry Tortugas National Park in the Florida Keys tied its all-time (since 1950) warmest minimum temperature of 87 degrees F (30.6 degrees C) on the 23rd, while Tallahassee, FL failed to drop below 80 degrees F (26.7 degrees C) on the 27th for only the fifth time on record (since 1892).
Precipitation
Precipitation was highly variable across the Southeast in June, as is typical for this time of the year. The wettest locations were found across southern portions of Alabama and Georgia, central portions of South Carolina, and northern portions of Florida, where monthly precipitation was 4 to 8 inches (102 to 203 mm) above average (150 to 200 percent of normal), while a few locations across the Big Bend region of Florida observed more than double their average precipitation for the month. Cross City, FL recorded 17.51 inches (445 mm) of precipitation, which is more than 10 inches (254 mm) above average. Albany, GA recorded its second wettest June on record (since 1892) with 11.45 inches (291 mm) of precipitation. Much of the precipitation in these areas occurred on the 14th and 15th of the month as part of a large severe weather outbreak across the region. Albany, GA and Columbus, GA (1891-2023) recorded their greatest one-day totals for any June day on record with 5.19 inches (132 mm) and 4.4 inches (112 mm), respectively, on the 14th of the month. Pensacola, FL recorded 9.3 inches (236 mm) of precipitation on the 15th, which is the third greatest one-day total in June on record (since 1879). Of this, 3.45 inches (88 mm) and 2.91 inches (74 mm) fell over the final two hours, which rank as the second and fifth greatest one-hour totals, respectively, for any month since 1948. In contrast, the driest locations were located across northern portions of Alabama and Virginia, eastern North Carolina, southwest Florida, and Puerto Rico and the U.S. Virgin Islands, where monthly precipitation ranged from 2 to 6 inches (51 to 152 mm) below average (25 to 75 percent of normal). While several inches of precipitation fell across the island of Saint Croix over the last two days of the month, the year-to-date total at Henry Rohlsen Airport of 7.37 inches (187 mm) still ranks as the second driest on record (since 1951).
Drought
June began with about 15 percent of the region in abnormal dryness (D0), while moderate (D1) and severe (D2) drought covered less than 3 percent of the region. During the month, moderate (D1) drought emerged across extreme northern Alabama, while abnormal dryness (D0) expanded into northwest Georgia. Severe (D2) drought also emerged across extreme northern Virginia and was briefly introduced in the District of Columbia. Streamflow in the Potomac River fell to levels that may require releases from upstream reservoirs later this summer. The Virginia Department of Environmental Quality issued a drought watch advisory for the northern Piedmont, Eastern Shore, and Shenandoah Valley due to moisture deficits over the past two to four months. In contrast, pockets of abnormal dryness (D0) were eliminated across parts of Georgia and the Carolinas, while moderate (D1) and severe (D2) drought were eliminated across the western Panhandle of Florida, leaving a small area of abnormal dryness (D0) along the Sun and Cultural coasts. The combination of improvements and degradations yielded little overall change in drought coverage across the region. Low soil moisture and streamflows led to further intensification and expansion of drought across the Caribbean. Severe (D2) drought emerged in northwest Puerto Rico, while abnormal dryness (D0) expanded to the east and along the northern and southern slopes. Severe (D2) drought persisted on Saint Thomas and emerged on Saint John. Exceptional (D4) drought emerged on Saint Croix for the first time since U.S. Drought Monitor records began in the U.S. Virgin Islands in 2019.
Agriculture
Generally dry conditions at the start of the month allowed operators to carry out much field work, including the harvesting of winter wheat and planting of cotton, peanuts, and soybeans. Some dryland or non-irrigated corn was negatively impacted in places experiencing larger moisture deficits and warmer temperatures, particularly northern Alabama, central Georgia, and Florida. The wet weather that dominated the rest of the month did help in these areas, as it occurred during the period of peak moisture requirements, but also caused problems for many operators. There were reports of flooded fields in Georgia and South Carolina, which prevented farmers from planting and harvesting crops, as well as applying fertilizers and pesticides. Many operators were forced to replant, and there was growing concern over fungal diseases, including rust and brown rot, and reduced yields due to delays in field work. Heavy precipitation also delayed the sugarcane harvest across South Florida but helped alleviate moisture deficits that had persisted across much of the Citrus belt. The large number of hail and high wind events resulted in considerable damage to crops, particularly across parts of Alabama and Georgia. Cattle and pastures were in mostly good to fair condition. Hay cutting and drying were delayed in many places due to wet and cool conditions, while drought stress and overgrazing were noted in parts of Virginia and Florida that missed out on much of the precipitation during the month. Cool, wet, and cloudy conditions also slowed the accumulation of growing degree days for many crops. Across the Caribbean, farmers reported significant vegetation stress, soil moisture deficits, and water supply issues. Numerous livestock deaths were reported due to extreme heat, lack of water, and feed shortages. Producers on Saint Croix have qualified for direct assistance through the USDA’s Livestock Forage Program.
Notable Weather
There were 1,392 reports of severe weather across the Southeast in June, which is nearly double the median frequency of 734 reports over the period 2000 to 2022 (190 percent of normal). There were 24 confirmed tornadoes (9 EF-0s, 13 EF-1s, 2 EF-2s), which is more than double the median frequency of 11 (218 percent). All of these were associated with a severe weather outbreak that affected parts of the southern Plains and Southeast from the 14th to the 19th of the month. The strongest tornado was an EF-2 that touched down in the town of Blakely in extreme southwest Georgia on the 14th with estimated peak winds of 125 mph (56 m/s). Numerous trees were snapped and uprooted, and several structures sustained roof and siding damage. Another EF-2 caused significant damage along Pensacola Beach, FL on the 15th with estimated peak winds of 120 mph (54 m/s). A rare anticyclonic tornado was confirmed near Mobile, AL on the morning of the 16th. A few hours earlier, a weak tornado tracked across Perry Foley Airport located southeast of Tallahassee, FL, causing some aircraft tie-downs to snap. No fatalities or injuries were reported from these tornadoes. There were 1,139 wind reports in June, which is well-above the median frequency of 633 reports (180 percent of normal). On the 3rd, thunderstorm gusts over 50 mph (22 m/s) were observed across Broward and Miami-Dade counties in southeast Florida, with an 83 mph (37 m/s) gust recorded by a mesonet station in Dania Beach. Numerous reports of high winds were associated with the severe weather outbreak from the 14th to the 19th. Large swaths of straight-line winds between 50 and 70 mph (22 and 31 m/s) were observed across parts of Alabama, Georgia, and Florida, with several reports of downed and uprooted trees and damage to structures. One person was killed when a tree fell on their home in west Pensacola, FL on the evening of the 15th. A mesonet station maintained by Alabama A&M University recorded a 96 mph (43 m/s) gust in Escambia County in southern Alabama on the 16th. Several buildings were damaged or destroyed. Later that evening, a large swath of straight-line wind damage was confirmed across Pickens, Greene, and Tuscaloosa counties in west-central Alabama. The highest gusts were estimated at 95 mph (42 m/s). Another round of severe weather with strong straight-line winds occurred across central portions of Alabama, Georgia, and South Carolina on the 25th and 26th of the month. Numerous trees were snapped and blown down, and several farm buildings were damaged. Thunderstorm downburst winds estimated at 60 to 80 mph (27 to 36 m/s) blew across Lake Murray just outside of Columbia, SC on the evening of the 26th. Numerous trees were snapped and uprooted around Timberlake Country Club, some of which fell on homes and vehicles. There were 225 hail reports in June, which is two-and-a-half times the median frequency of 90. The largest hailstone was softball-sized, or 4 inches (102 mm), in the community of Doerun in Colquitt County, GA on the 15th of the month. This marks the first time since 2011 that a hailstone of this size has been recorded in the state of Georgia, and the second straight month where Colquitt County has recorded the largest hailstone in the region. The upper-level trough that persisted for most of the month helped direct smoke from wildfires in central Canada into parts of the Southeast, resulting in numerous air quality alerts, particularly during the early part of the month. On the 6th, Charlotte, NC observed its first Code Red alert since 2006, while Washington D.C. observed a rare Code Purple alert with visibility down to 1 mile (1.6 km) on the 8th of the month. There were 17 surf zone fatalities in the Southeast in June, 16 that were caused by rip currents. Most of the fatalities occurred in Florida and Alabama during the week of the 17th through the 24th. There were no lightning fatalities in the region in June; however, an individual was hospitalized due to a lightning strike in Miami-Dade County, FL on the 1st of the month.
2023 Atlantic Hurricane Season
The Atlantic basin saw three named storms in June: Tropical Storms Arlene, Bret, and Cindy. Arlene formed in the Gulf of Mexico on the 2nd of the month and tracked southeastward, prompting flood watches across parts of South Florida. Arlene was downgraded to a remnant low the next day. Between 1 and 2 inches (25 and 51 mm) of precipitation was observed across central and southern portions of Florida on the 2nd and 3rd, with some locally heavier amounts. No other impacts were noted in the region.
For more information, please visit the Southeast Regional Climate Center Home Page.
High Plains (Information provided by the High Plains Regional Climate Center)
The month of June was both good and bad for the High Plains. Record precipitation greatly improved drought conditions for some, while others continued to remain dry. Drought conditions continued to intensify in the eastern portions of the region, leading to significant impacts. The dryness plaguing the central and eastern parts of the region has created lasting impacts. The lack of recharge this past winter has led to several cities implementing water restrictions in an effort to conserve the precious resource. The town of Waverly, Nebraska was forced to designate emergency restrictions due to low levels, while the outskirts of Lincoln implemented mandatory restrictions of 50 percent. Other locations like Hays, Kansas reintroduced summertime restrictions that include a ban on outdoor water use from noon to 7:00 PM. Severe weather was active throughout the region, with hail and winds being the primary threats this month. A hailstorm on the 21st interrupted a concert at Red Rocks Amphitheatre outside of Denver, Colorado. Nearly 100 people were injured, with seven taken to the hospital after concert goers failed to heed the severe thunderstorm warnings.
Temperature
Record to near-record warmth continued in the northern part of the region this month. Parts of North Dakota were 6 degrees F (3.3 degrees C) above normal, while the cooler and wetter western portions were up to 4 degrees F (2.2 degrees C) below normal. In North Dakota, Fargo and Grand Forks recorded their warmest June of 74.8 degrees F (23.8 degrees C) and 71.6 degrees F (22 degrees C). Both locations recorded their warmest May-June, after having their second warmest May the previous month. This contrasts sharply with early spring, when well below temperatures dominated North Dakota. Elsewhere in the Dakotas, Aberdeen and Sisseton ranked in the Top 5 warmest. While temperatures have not been excessively hot this year in eastern Nebraska, they have been steadily very warm. At the end of June, Lincoln had recorded 46 days at or above 85 degrees F (29.4 degrees C) for the year. This is the most on record for the first six months of a year, with two more days than 1934 which was the warmest year on record.
Precipitation
The trend of above-normal precipitation in the west and below-normal to the east continued into June. The Front Range and Rocky Mountains observed record to near-record amounts, while eastern Kansas was below 25 percent of their normal. Drought conditions were erased from the state of Colorado after this month’s record precipitation, with only minimal dryness left. Denver surpassed their previous record by over an inch (2.54 cm), with 6.10 inches (15.49 cm) of precipitation. Nearby Akron set their new record after 7.48 inches (19 cm) fell there. Colorado Springs received 9.62 inches (24.44 cm) to break the previous record, which is nearly 60 percent of its annual precipitation. Another benefactor from the recent precipitation was Wyoming. Numerous locations recorded one of their wettest months on record, while others like Laramie and Sheridan nearly broke theirs. Similar to Colorado, drought conditions greatly improved across the state. The severe weather this month was both ends of the extreme. The Dakotas observed record-low issuances of tornado warnings for June (period of record 2003-2023), with only three total issued for both states. On the opposite end of the spectrum, Colorado and Wyoming had near-record numbers of tornado warnings. Colorado had a particularly nasty month, with 71 tornado warnings issued and a whopping 152 reports of hail.
Drought
Drought conditions further improved in June, particularly in Kansas. Eastern Nebraska continued to remain dry, with exceptional drought (D4) observed over much of the area. Overall, abnormally dry to exceptional drought (D0-D4) was reduced by nearly seven percent in the High Plains. The steady stream of precipitation in Kansas brought relief this month. D4 was reduced by nine percent, with only small pockets remaining in the state. Nebraska experienced improvements in the west and degradation in the east. Drought is firmly entrenched across the eastern part of the state, after yet another dry month.
For more information, please visit the High Plains Regional Climate Center Home Page.
South (Information provided by the Southern Regional Climate Center)
Heat returns to the Southern Region with widespread high temperatures and records being set.
Temperature
In June, above normal temperatures were common in the southern portions of the region and below normal temperatures in the north and east, particularly Tennessee with temperatures averaging two to six degrees below normal. Statewide averages for June were above the median value for Louisiana (9th warmest, out of 129 years), Texas (16th warmest), the Southern Region as a whole (29th warmest), Mississippi (34th warmest), Arkansas (49th warmest). Tennessee experienced its 25th coolest June, while Oklahoma was near its historical median value. The warmest recorded temperature in the region was 119 F at Rio Grande Village, Texas on June 24th, one degree below the all-time record for the state. The coldest recorded temperature in the region was 35 F at Mt. Leconte, Tennessee on June 10th. The coldest recorded lowland temperature was 43 F at Greenville Experiment Station, Tennessee on June 10th. Fifteen long-term stations set records for highest maximum temperatures during June, all in Texas, with the warmest being Cope Ranch, TX with 118 F on June 26th. No stations set records for lowest minimum temperatures during June.
Precipitation
Precipitation was below normal for much of the southern and northeastern portions of the region during June. Precipitation was well above normal for western Oklahoma, the Texas Panhandle, extreme northeast Texas, southern Arkansas, and central Mississippi. Statewide average totals were above normal for Mississippi (27th wettest) and Oklahoma (51st wettest). Statewide average totals were below normal for Texas (34th driest), Louisiana (42 driest), the Southern Region as a whole (47th driest), and Tennessee (53rd driest). The June statewide average total for Arkansas was near its historical median value. Four stations exceed thirteen inches of precipitation for the month of June, all in Mississippi, and consisted of one COOP stations and three CoCoRaHS stations: Walnut Grove, Mississippi (14.67 inches), near Moss Point, Mississippi (13.99), near Union, Mississippi (13.48), and near Philadelphia, Mississippi (13.05). Two stations reported single day accumulations of 7 inches or more, both in Mississippi: near Moss Point, Mississippi (8.07 inches) on June 20th and at Walnut Grove, Mississippi (7.00) on June 19th. Four long-term stations set single day accumulation records for June: Walnut Grove, Mississippi (7.00, June 19th), Anson, Texas (6.18, June 2nd), Canyon, Texas (4.89, June 2nd), and Meridian Key Field, Mississippi (3.21, June 19th).
Drought/Flooding
During June the spatial extent and intensity of drought saw improvements in the Texas Panhandle, western Oklahoma, and portions of central Tennessee. While conditions along the southeast Louisiana Gulf Coast, central Texas, and deep south Texas saw worsening drought conditions during June. Areas of extreme and exceptional drought, according to the US Drought Monitor, persist in north central Oklahoma and near San Antonio, Texas. Much of the eastern portion of the region, eastern Texas, the Texas Panhandle, and eastern Oklahoma largely remain drought free. Despite improvements in drought status in many areas, areas that have experienced substantial drought continue to see impacts, particularly in the agriculture sector. As of July 2nd, the percentage of land with short to very short topsoil moisture in Texas and Louisiana was 70 percent and 55 percent. Pasture and rangelands in Texas, Arkansas, and Louisiana continued to show stress with only 26 percent, 38 percent, and 39 percent being rated as good to excellent.
Notable Weather
A few daily weather records were set in far south Texas during the first thirteen days of the month, but the June heat wave began in earnest on June 14 when Johnson City in central Texas set a new June record for highest minimum temperature, 79 F. During June 14-19, there were 52 daily maximum temperature records set and 86 daily high minimum temperature records set, an indication of the high humidity that was present during the early part of the heat wave. The heat wave peaked on June 21-23, with five all-time maximum temperature records, three all-time high minimum temperature records, and a total of 205 daily maximum and high minimum temperature records. Although its period of record was not long enough to be included among these totals, Rio Grande Village in Big Bend National Park on June 23 came within a degree of tying the all-time temperature record for the state of Texas. Records continued to fall during all but one day in the remainder of June. Heat-related death statistics are unavailable at this time, but the number of direct heat-related deaths may be in the dozens, with many more indirect heat-related deaths.
Thirty-six tornadoes were reported across the Southern Region in June, impacting all six states in the Southern Region. The ratings were 12 EF0, 16 EF1, 6 EF2, and 2 EF3. On June 15th, an EF3 tornado in Perryton, Texas resulted in three fatalities. On June 18th, an EF3 tornado in Louin, Mississippi resulted in 25 injuries and one fatality. On June 21st, an EF3 tornado in Matador, TX resulted in four fatalities. For Texas, this was the most tornado fatalities in one month since December 2015. There were 735 reports of hail in the Southern Region during June, with the largest report being 5.5 inch diameter hail in Lela, Texas on June 14th. There was a total of 1,083 reports of severe wind during June with the highest recorded winds being 98 MPH near Cushing, Oklahoma on June 18th.For more information, please visit the Southern Regional Climate Center Home Page.
West (Information provided by the Western Region Climate Center)
The atmospheric pattern for much of June resembled conditions in May with persistent low pressure (cutoff lows) across the Southwest and ridging across western Canada extending into the Pacific Northwest. This drove wetter and cooler than normal conditions across the Great Basin, Wyoming, and southern Montana. Warmer and drier than normal conditions persisted across western Oregon, Washington, northern Idaho, and northwest Montana leading to expanded drought conditions in the region.
Temperature
The Southwest, southern Idaho, and southwest Montana remained cool throughout June with temperatures 2-6 degrees Fahrenheit below normal across the region. The largest cool temperature anomalies were found across southeast California, Arizona, and central Nevada. Needles, California saw an average June temperature of 86.9 degrees Fahrenheit (6.1 degrees Fahrenheit below normal) and the ninth coldest June since 1940. Prescott, Arizona recorded an average June temperature of 64.4 degrees Fahrenheit (5.9 degrees Fahrenheit below normal) which is the coldest since 1982 and nearly ten degrees Fahrenheit colder than June 2022. Across western Oregon, Washington, northern Idaho, and northwest and eastern Montana temperatures were 2-5 degrees Fahrenheit above normal. Bonners Ferry, Idaho and Glasgow, Montana both saw their fourth warmest June on record at 66.4 degrees Fahrenheit (4.5 degrees Fahrenheit above normal) and 68.9 degrees Fahrenheit (4.4 degrees Fahrenheit above normal), respectively.
Precipitation
Precipitation totals for June were well above normal (greater than 200 percent in many locations) across parts of California, the Great Basin, and Montana. June is one of the drier months in the Southwest so absolute precipitation values were still relatively low. Huntley Experimental Station in south-central Montana shattered the previous June record for total precipitation (6.58 inches in 1944) with 8.10 inches (358 percent of normal) and a station record going back to 1911. Another longstanding June precipitation record (data since 1896) was broken at Clayton, New Mexico (in the northeast part of the state) where 5.89 inches fell (299 percent of normal). The eastern Sierra Nevada and western Nevada saw frequent thunderstorms that produced heavy rainfall. Carson City, Nevada logged 1.76 inches of precipitation for the month (476 percent of normal) coming in as the fifth wettest June since records began 102 years ago. Dry conditions, persisting since early May, continued for western Oregon and Washington where many places saw less than 25 percent of normal June precipitation. Walla Walla, Washington received just 0.04 inches of precipitation (3 percent of normal) and one day of measurable precipitation making it the second driest June since 1949. Along the Oregon coast, Astoria and North Bend recorded 30 percent of normal (0.70 inches) and six percent of normal (0.09 inches) June precipitation, respectively.
Drought
According to the U.S. Drought Monitor at the end of June, 15 percent of the West was in drought. All remaining areas of extreme drought (D3) were removed during June. This is the first time since April 2020 without D3 or exceptional drought (D4) in the West. One area where drought conditions expanded during June was western Oregon and most of Washington. Parts of western Oregon saw two category drought degradations and are now in moderate drought (D1).
Alaska Summary
Temperatures across most of Alaska were near normal or slightly below normal (anomalies of -1 to -3 degrees Fahrenheit) except for the North Slope where temperatures were slightly above normal. Parts of Southcentral Alaska and the North Slope saw much above normal precipitation while drier than normal conditions prevailed in parts of the interior and the southern extent of the Aleutian Islands. In Anchorage, the June monthly temperature was 53.9 degrees Fahrenheit (2 degrees Fahrenheit below normal) and 1.74 inches of precipitation fell (171 percent of normal). At Utqiaġvik the June monthly temperature was 36.6 degrees Fahrenheit (0.6 degrees Fahrenheit above normal) and 0.99 inches of precipitation fell (230 percent of normal).
Hawaii Summary
Temperatures across Hawaii were generally near normal, and precipitation was below normal for most of the state. June precipitation totals were 4.38 inches (60 percent of normal) at Hilo, 3.04 inches (68 percent of normal) at Hana, and 1.02 inches (57 percent of normal) at Lihue. Dryness during June led to expansion of the extent of drought conditions across parts of the state. The U.S. Drought Monitor at the end of June showed 33 percent of the state in abnormally dry conditions (D0) and ten percent of the state in moderate drought (D1) with D1 restricted to the islands of Maui and the Big Island.
Notable Weather
Tulare Lake receding after months of California government actions: Tulare Lake, in the San Joaquin Valley, began refilling this spring after one of the snowiest winters on record in the southern Sierra Nevada. This led to flooded croplands, roadways, homes, and other infrastructure. Through diversions and pumping mandated by the state to reduce flood impacts and make use of excess water at least 66,692 acre-feet of water have been diverted from the lake leading to lower late summer lake extent projections than originally thought at the beginning of May.
For more information, please go to the Western Regional Climate Center Home Page.