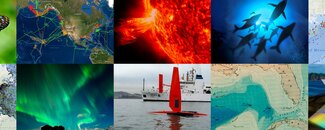
At NCEI, we appreciate the value of maps. Maps aggregate and organize raw data into a user-friendly format that displays a variety of data types in the same geographic location. Most maps produced by NCEI are interactive, allowing you to view data layers, zoom in and out, and specify search parameters. But there is another type of interactive map that has proven to be an effective communication method to present often complex scientific information in simple, easy-to-understand terms—a story map.
Visual Interactive Learning
NCEI’s data and products range from the bottom of the ocean to the surface of the sun. As a trusted source of environmental data, NCEI works to expand our understanding of our dynamic planet. NCEI uses story maps to help with that understanding.
Story maps transform NCEI data and products into a visual narrative. They combine custom maps with storytelling, and NCEI data have lots of stories to tell. By telling the story of the data, we can connect with a diversity of users.
NCEI uses ArcGIS StoryMaps resources to integrate maps, text, images, video, and sound to create user experiences that go beyond a simple explanation of our products toward an understanding of the data and their uses. We create story maps with all audience levels in mind. NCEI story maps have covered a variety of topics including how Earth’s magnetic field works and how passive acoustic data is used to monitor ocean life.
How It’s Done
The NCEI story map team has experience in outreach and education, GIS and mapping, graphic design, science, web development, social media, and technical writing. The team’s common goal is to engage with people and share information. For each story map, the team also includes a Subject Matter Expert (SME), or scientist, with expertise in the chosen subject as an integral part of the team.
Since storytelling is at the heart of a story map, each new project starts with a brainstorming session focused on finding the story behind the data. Once that is established, the team focuses on gathering resources including maps, graphics, video, and sound and begins to create content. The team also chooses an applicable ArcGIS StoryMap template. Working with the SME, the story map undergoes many iterations to ensure the information has been presented with both clarity and accuracy. When the story map is completed, it is published on the ArcGIS StoryMap website, the NCEI website, and the NOAA GeoPlatform.
Visit the NCEI Story Map Gallery and discover how we show off our data in this fun and unique format.


