
Several rounds of severe storms devastated the Midwest and Great Plains; four new billion-dollar weather and climate disasters were confirmed in May

Key Points:
- Twenty-three states from South Dakota to Florida had at least one tornado reported, including an EF-4, during a severe weather outbreak May 6–10 that caused significant damage and loss of life.
- The deadliest tornado of the year-to-date was an EF-4 that occurred on May 21 in Greenfield, Iowa and caused five fatalities.
- A derecho with winds of up to 100 mph occurred on May 16 in Houston, Texas, causing significant damage and seven fatalities.
- Four new Billion-Dollar Weather and Climate Disasters were confirmed in May. The year-to-date total currently stands at 11 disasters.
- March to May 2024 was the sixth-warmest spring on record for the contiguous U.S. and precipitation ranked in the wettest third of the historical record for the month of May 2024.
Other Highlights:
Temperature

The average temperature of the contiguous U.S. in May was 62.3°F, 2.1°F above average, ranking 13th warmest in the 130-year record. May temperatures were above average across much of the eastern contiguous U.S. including Florida, which saw its warmest May on record. Last month ranked among the top 10 warmest Mays on record in thirteen additional states. Conversely, near- to below-average temperatures were observed in portions of the central and northern Rocky Mountains.
The Alaska statewide May temperature was 38.3°F, 0.5°F above the long-term average, ranking in the middle third of the 100-year period of record for the state. Near- to below-average temperatures were observed throughout most of the state, with above-normal temperatures observed in the north and portions of the eastern Southeast Interior and Northeast Gulf regions.

The meteorological spring (March–May) average temperature for the contiguous U.S. was 53.7°F, 2.8°F above average, tying with 2016 as the sixth-warmest spring in the 130-year record. Temperatures were above average from the Rocky Mountains to the East Coast. Arkansas, Kentucky, Ohio, Virginia and West Virginia each ranked second warmest while an additional 21 states ranked within the top five warmest springs on record.
The Alaska spring temperature was 26.8°F, 2.8°F above the long-term average, ranking in the warmest third of the record for the state. Temperatures were above average across much of the state, while parts of the Panhandle and Aleutians saw near-average spring temperatures.
For the January–May period, the average contiguous U.S. temperature was 46.8°F, 3.4°F above average, ranking fifth warmest on record for this period. Temperatures were above average across nearly all of the contiguous U.S., while record-warm temperatures were observed in parts of the Northeast and Great Lakes. Illinois, Indiana, Ohio, Michigan, New York, Vermont, New Hampshire and Maine each saw their second-warmest January–May period. An additional 16 states had a top-five warmest year-to-date period. No state experienced a top-10 coldest event during this five-month period.
The Alaska January–May temperature was 18.9°F, 3.2°F above the long-term average, ranking in the warmest third of the historical record for the state. Much of the state was above normal for this five-month period while temperatures were near average across parts of the Panhandle.
Precipitation

May precipitation for the contiguous U.S. was 3.56 inches, 0.65 inch above average, ranking 13th wettest in the historical record. Precipitation was below average across much of the Southwest, Rio Grande Valley, and southern Florida. Conversely, precipitation was above normal in portions of the Plains, South, Midwest, and Tennessee Valley. Kentucky, Tennessee and Rhode Island each had their sixth-wettest May on record.
Alaska’s average monthly precipitation ranked in the driest third of the historical record. Precipitation was above average from Bristol Bay to the Central Panhandle, while below-normal precipitation was observed in parts of the Aleutian Islands during the month.

The U.S. spring precipitation total was 9.25 inches, 1.32 inches above average, ranking in the wettest third of the March–May record. Precipitation was above average from the Midwest to the Northeast, and in parts of the Gulf Coast and Southeast. Rhode Island saw its third-wettest spring on record and Iowa and Wisconsin their fourth wettest. Spring precipitation was below average in the Rio Grande Valley, southern Florida, and parts of the Southwest, central Plains, and Pacific Northwest.
For spring season precipitation, Alaska ranked in the middle third of the record with wetter-than-average conditions observed across most of the state. Precipitation was below average in parts of the Cook Inlet, the South Panhandle and the Aleutians.
The January–May precipitation total for the contiguous U.S. was 14.57 inches, 2.19 inches above average, ranking ninth wettest in the 130-year record. Precipitation was above average across much of the contiguous U.S., with Rhode Island having its second-wettest year-to-date period on record. Conversely, precipitation was below average across parts of the Northwest, central and southern Plains and Florida during the January–May period.
The January–May precipitation for Alaska ranked in the middle third of the 100-year record, with below-average precipitation observed across parts of the Aluetians, Central Interior, Cook Inlet and South Panhandle regions, near-normal precipitation in the Northeast Interior and above-average precipitation observed across much of the remaining climate divisions.
Billion-Dollar Disasters
Four new billion-dollar weather and climate disasters were confirmed in May 2024, including two tornado events that impacted the central, southern and eastern U.S. at the end of April and beginning of May, one severe weather event that impacted the central and eastern U.S. at the end of February and a derecho event that impacted portions of the South in mid-May.
There have been 11 confirmed weather and climate disaster events this year, each with losses exceeding $1 billion. These disasters consisted of nine severe storm events and two winter storms. The total cost of these events exceeds $25 billion, and they have resulted in at least 84 fatalities.
The U.S. has sustained 387 separate weather and climate disasters since 1980 where overall damages/costs reached or exceeded $1 billion (including CPI adjustment to 2024). The total cost of these 387 events exceeds $2.740 trillion.

Other Notable Events
A rare anti-cyclonic tornado occurred on May 1 in Tillman County, Oklahoma.
The National Weather Service issued a warning for DVD-sized hail (5 inches in diameter) for Hockley County, Texas on May 28, making this the first warning for hail that large on record.
Anchorage finished up the snowfall season with the second-highest snowfall total on record (133.3 inches).
On May 6, severe weather across Oklahoma resulted in an EF-4 tornado causing significant damage and loss of life in the towns of Barnsdall and Bartlesville.
Heavy rains during the first week of May prompted more than 200 rescues and two fatalities in Harris and Bosque Counties in Texas.
Severe storms tracked through the Southeast during May 8–9, producing damaging winds, heavy rain and tornadoes. Up to nine inches of rain prompted flash flood emergencies, water rescues and school closures just north of Nashville, Tennessee.

Drought
According to the May 28 U.S. Drought Monitor report, about 13% of the contiguous U.S. was in drought, down about 4% from the end of April. Drought conditions expanded or intensified across western Kansas, eastern Colorado, southeastern Wyoming, parts of the Northwest and Florida this month. Drought contracted or was reduced in intensity across much of the Upper Midwest, Midwest, Northern Rockies and in parts of Hawaii.
Monthly Outlook
Above-average temperatures are favored to impact areas across the western half of the U.S. in June, while above-average precipitation is likely to occur from the Lower Mississippi Valley to the central Rockies. Drought is likely to persist along portions of the Northern Tier, the Southwest, Florida and Hawaii. Visit the Climate Prediction Center’s Official 30-Day Forecasts and U.S. Monthly Drought Outlook website for more details.
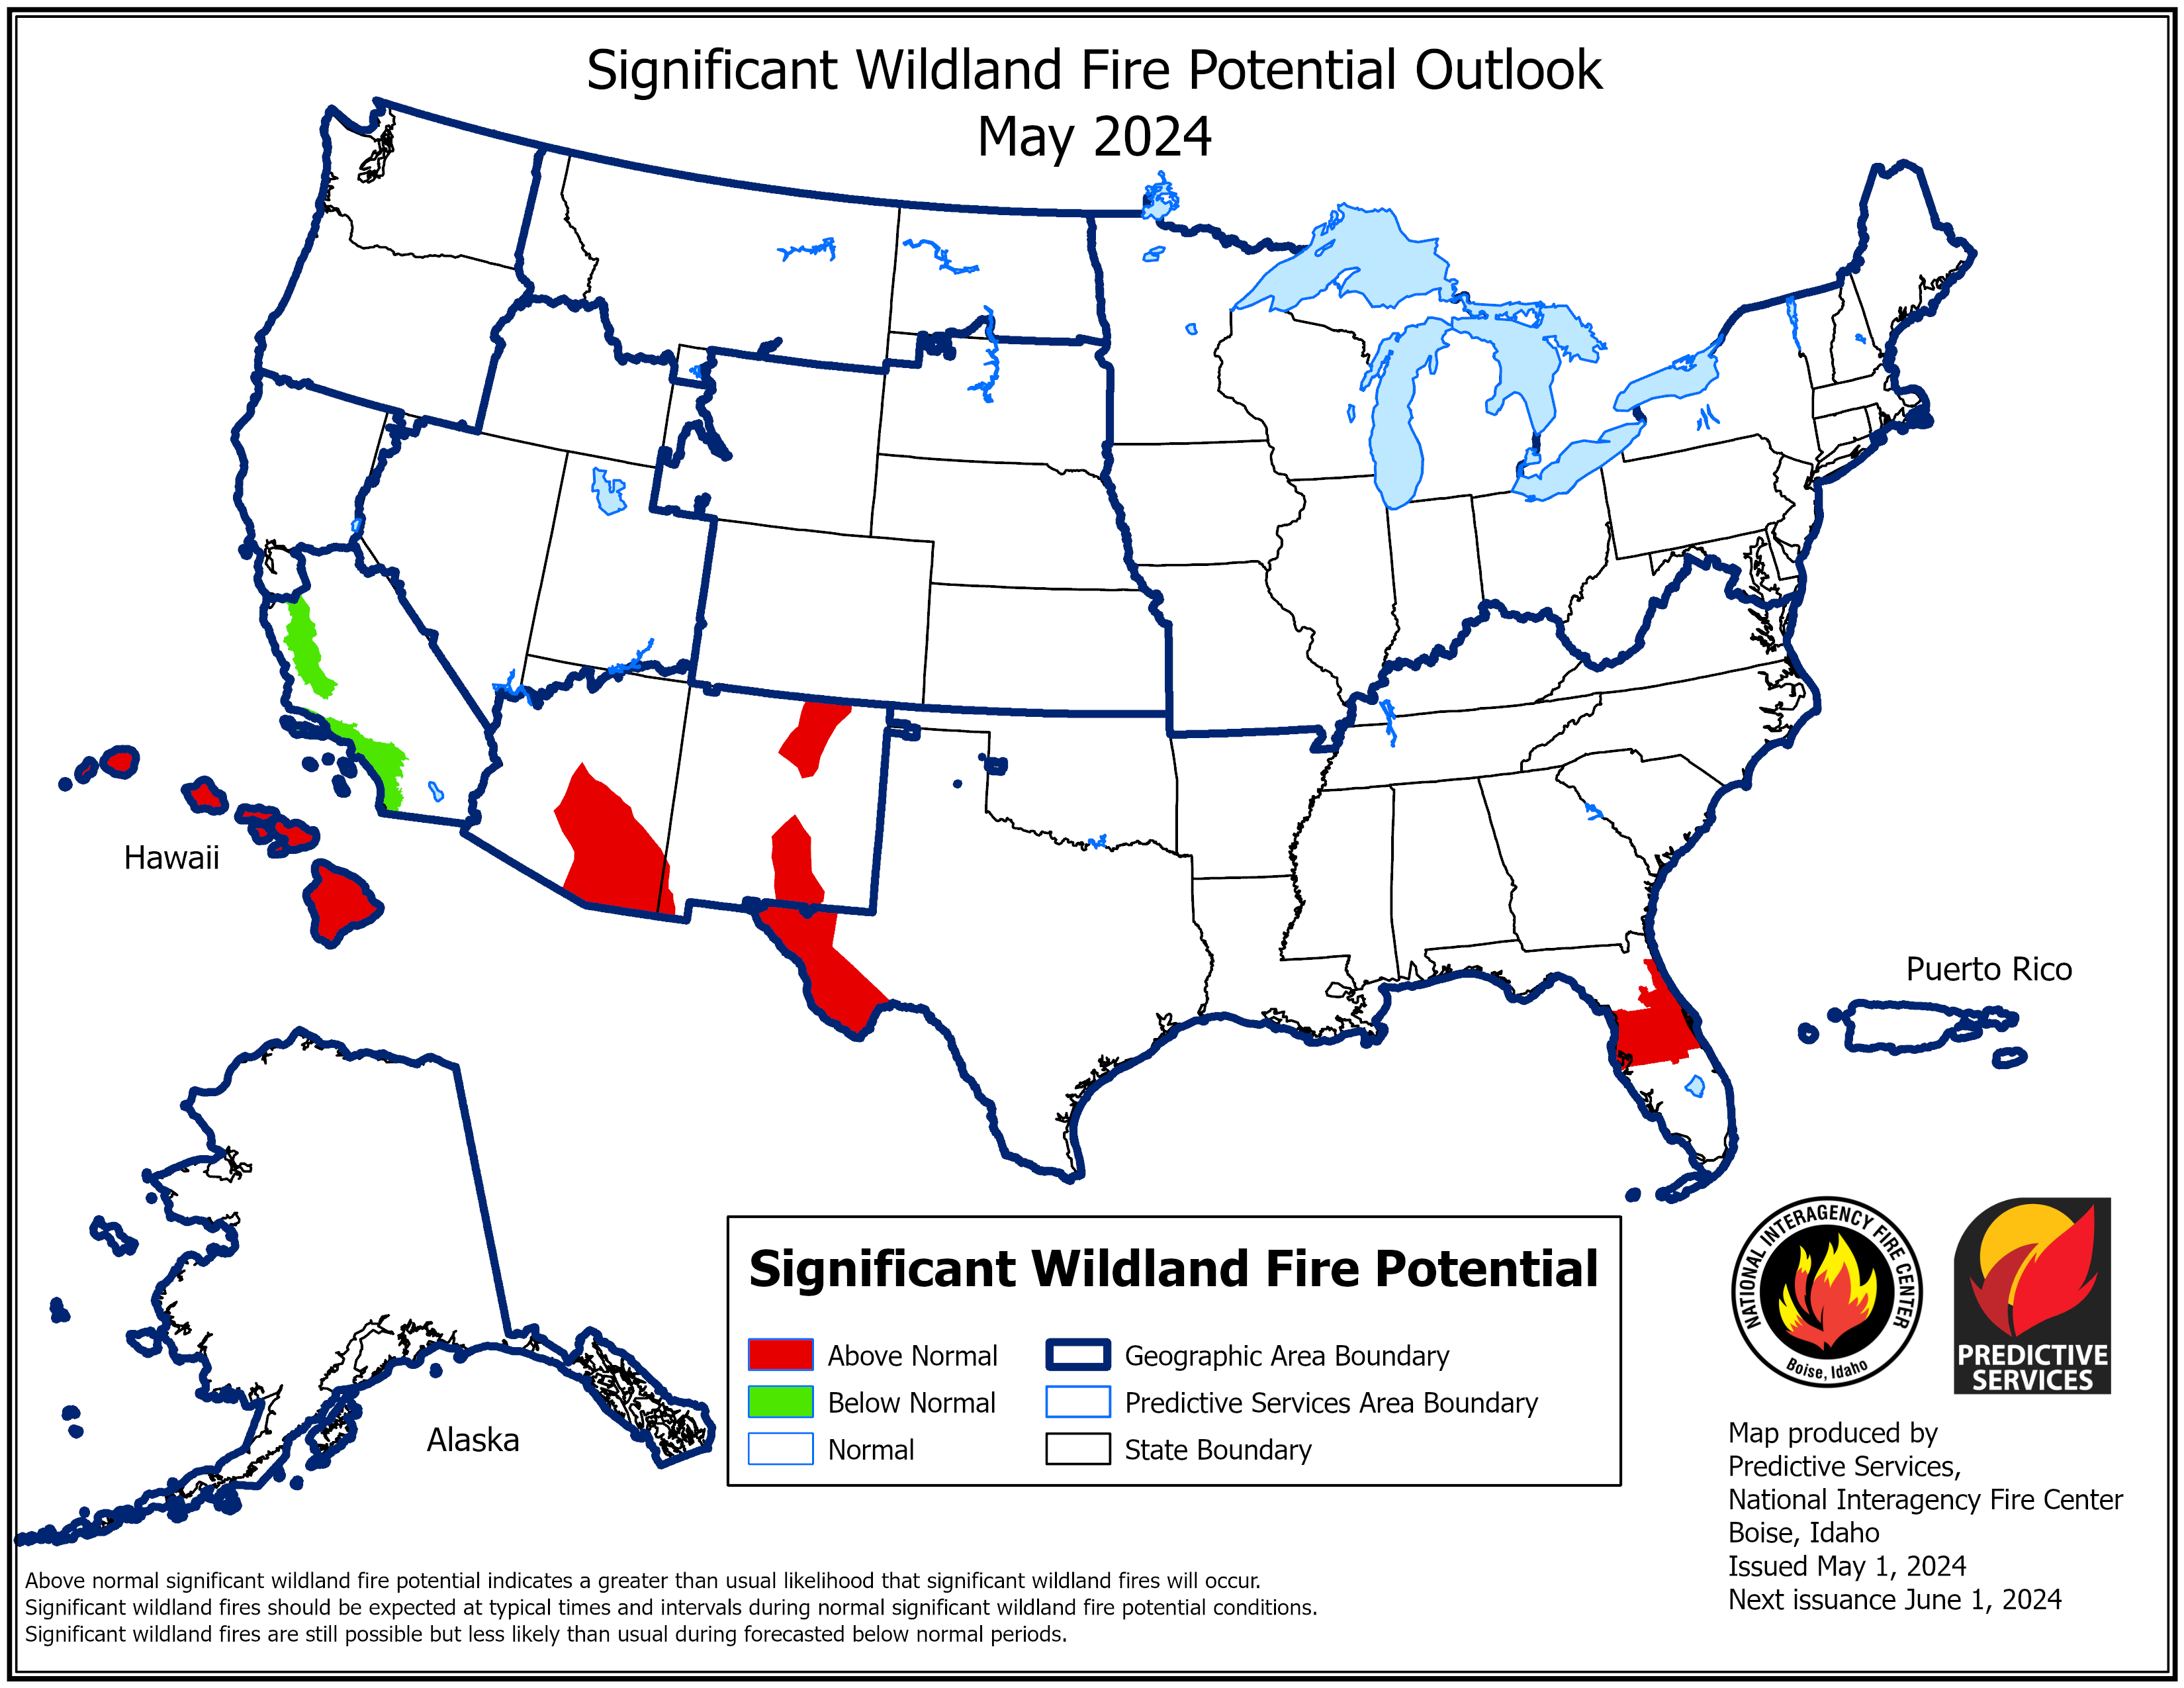
Significant wildland fire potential for June is above normal across portions of the Southwest and Florida Peninsula. For additional information on wildland fire potential, visit the National Interagency Fire Center’s One-Month Wildland Fire Outlook.
This monthly summary from NOAA’s National Centers for Environmental Information is part of the suite of climate services NOAA provides to government, business, academia and the public to support informed decision-making. For more detailed climate information, check out our comprehensive May 2024 U.S. Climate Report scheduled for release on June 13, 2024. For additional information on the statistics provided here, visit the Climate at a Glance and National Maps webpages.


