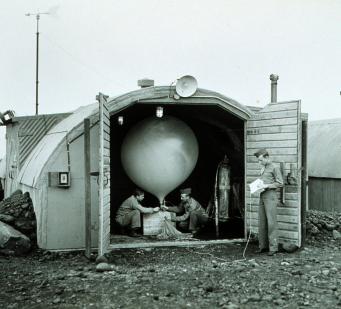
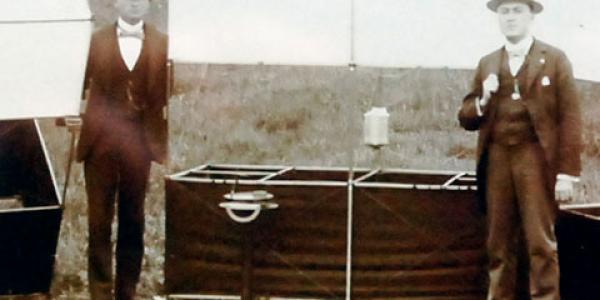
The Radiosonde Atmospheric Temperature Products for Assessing Climate (RATPAC) are a collection of radiosonde-based temperature anomaly time series for 1958–present. These products address the temporal inhomogeneities created by changes to instruments and observing practices, and reduce them as much as possible. RATPAC time series were developed in the early 2000s, and are based on data from 85 weather balloon stations distributed around global land areas. Data are available on 13 atmospheric pressure levels and for three atmospheric layers between the Earth's surface and lower stratosphere. This product is recommended for assessing long-term changes in tropospheric and lower stratospheric temperatures on large spatial scales. For other uses, please refer to the Integrated Global Radiosonde Archive (IGRA).

Product Components
Before downloading data, review the component descriptions to decide which one suits your needs. See the RATPAC-A and RATPAC-B tabs for more detailed information.
RATPAC-A
RATPAC-A contains adjusted global, hemispheric, tropical, and extratropical annual and seasonal mean temperature anomalies. Use RATPAC-A to analyze inter-annual and longer-term changes in temperature anomalies over these large regions.
RATPAC-B
RATPAC-B contains data for individual stations as well as large-scale arithmetic averages that correspond to the areas used for RATPAC-A. Use RATPAC-B to study long-term temperature changes in monthly data or regions smaller than those available in RATPAC-A. Note that inhomogeneities can influence trends in RATPAC-B data after 1997.
Access Methods
Please review the readme file, which describes the contents, format, and location of each RATPAC file, before downloading the data. Both RATPAC-A and RATPAC-B are available in ASCII format via HTTPS and FTP.
Note: Google and Mozilla recently deprecated support for FTP server access on Chrome and Firefox. Review the documentation to learn about FTP access options.
Current Version
The current version of RATPAC (Version 2) is derived from IGRA v2.
Data Updates
To receive RATPAC updates and news, subscribe to our email list.
Contact Information
Technical Questions
Customer Support
About
RATPAC-A contains adjusted global, hemispheric, tropical, and extratropical mean temperature anomalies. From 1958–1995, the spatial averages use Lanzante et al. 2003a and b (LKS) adjusted 87-station temperature data. After 1995, station data from the Integrated Global Radiosonde Archive (IGRA) form the basis of the RATPAC-A data. IGRA data was combined using the first difference method, which is intended to reduce the influence of inhomogeneities resulting from changes in instrumentation, observing practice, or station location. Use RATPAC-A for analyses of interannual and longer-term changes in global, hemispheric, and tropical means.
Data Sources
RATPAC-A time series are combinations of data from the following sources:
Lanzante et al. 2003 (LKS)
Data from 1958–1995 are based on spatial averages of Lanzante et al. (2003; hereafter LKS) adjusted station temperature data. Of the multiple versions of LKS data, we used the mean of the so-called “liberal” and “conservative” (LIBCON) version. While the LKS technique could be used to effectively remove inhomogeneities, it is a manual approach that is not practical for updating the time series on a regular basis.
Integrated Global Radiosonde Archive (IGRA)
From 1996–present, RATPAC-A time series are based on station data from the Integrated Global Radiosonde Archive (IGRA), which are combined to form area averages using a first difference method (Free et al. 2004).
The First Difference Method
The first difference (FD) method is a statistical analysis technique designed to reduce inhomogeneities in large-scale mean time series without adjusting individual time-series. The method involves calculating the difference in temperature between one time step and the next (the “first difference”), then computing large-scale means of the FD series, and finally reconstructing large-scale temperature series from the FD series.
More detailed information about the First Difference Method and its implementation is available in Free et al. (2004), Using First Differences to Reduce Inhomogeneity in Radiosonde Temperature Datasets.
The FD method helps reduce inhomogeneities in time series by omitting portions of the station time series that correlate with known changes in data measurement instruments or procedures. This process is intended to address and hopefully eliminate the artificial inhomogeneities that these changes create, but it also introduces a random error that increases with the number of gaps in the data. This error also becomes more prevalent in data with fewer stations, so the FD method can only be applied to large-scale means.
In RATPAC-A, the FD method is applied to IGRA data in order to extend the LKS series starting in 1996. Although the LKS dataset runs through 1997, substituting IGRA data for 1996 and 1997 appeared to be the best solution because the LKS adjustments are less reliable at the end of the time series than in previous years. The LKS method requires several years of data before and after an inhomogeneity to be effective.
Starting in 1995, the team removed six months of data from the IGRA monthly means before and after each metadata event for any station with a relevant event documented by a report from the country where the station was located. Some events were considered relevant only for certain stations and levels. For example, a change in reporting practices affecting temperatures below -90°C was considered relevant for stations and levels where temperatures near -90°C were reported. Data removal occurred at times in 1996 and 1997 where LKS made adjustments or removed data due to homogeneity concerns. Despite efforts by NCEI to update the station histories, useful metadata after 1995 was available for just 38 of the 85 stations. More detail about how the FD method is applied to RATPAC can be found in Free et al. (2005), Radiosonde Atmospheric Temperature Products for Assessing Climate (RATPAC): A new data set of large-area anomaly time series.
Spatial Averaging
In an effort to obtain spatially unbiased large-scale means, the team compensated for uneven longitudinal distribution of stations by creating regional means before averaging data into zonal bands. Hemispheric (0°–90°), tropical (30°S–30°N), and extratropical (30°–90°) means were calculated using a process that compensates for the uneven spatial distribution of stations.
First, each 30-degree zonal band was divided into three 120 degree longitudinal regions: 30°W to 90°E, 90°E to 150°W, and 150°W to 30°W. Arithmetic regional averages were calculated from the available stations within each 30-degree latitude by 120-degree longitude region. The three regional means within each band were then averaged to form one zonal mean for each 30-degree band. The hemispheric, tropical, and extratropical means then represent an average of the corresponding zonal means, each weighted by the cosine of the latitude of the midpoint of the respective band. The global mean is the average of the hemispheric means. To facilitate comparison with other datasets, NCEI also provides time series for the region from 20°N to 20°S.
References
- Free, M., J.K. Angel, I. Durre, J. Lanzante, T.C. Peterson and D.J. Seidel, 2004: Using first differences to reduce inhomogeneity in radiosonde temperature datasets. Journal of Climate, 17, 4171-4179, http://dx.doi.org/10.1175/JCLI3198.1.
- Free M., D.J. Seidel, J.K. Angel, J. Lanzante, I. Durre and T.C. Peterson, 2005: Radiosonde Atmospheric Temperature Products for Assessing Climate (RATPAC): A new dataset of large-area anomaly time series. Journal of Geophysical Research, 110, D22101, http://dx.doi.org/10.1029/2005JD006169.
- Lanzante, J.R., S.A. Klein, and D.J. Seidel, 2003: Temporal homogenization of monthly radiosonde temperature data. Part I: Methodology. Journal of Climate, 16, 224-240, http://dx.doi.org/10.1175/1520-0442(2003)016<0224:THOMRT>2.0.CO;2.
About
RATPAC-B contains data for individual stations, as well as large-scale arithmetic averages that correspond to the areas used for RATPAC-A. The station data consist of adjusted data produced by LKS for 1958–1997 and unadjusted data from IGRA after 1997. The regional mean time series in RATPAC-B represent arithmetic averages of these station data. Use RATPAC-B to study long-term temperature changes in monthly data, or over smaller regions that cannot be analyzed using RATPAC-A. Make sure to be aware of the potential influence of inhomogeneities on the analysis after 1997.
Methods
The first difference (FD) method used for RATPAC-A does not allow the production of individual station time series. To address this issue, scientists created a set of updated station time series that provide alternative large-scale mean time series to compare with the FD time series. This is done by appending monthly mean station data from IGRA for 1998–present to the corresponding adjusted LKS time series for 1958–1997. As in RATPAC-A, the mean of the liberal and conservative (LIBCON) version of the LKS data is used. Stations where LKS deleted data at the end of the time series or that closed during or before 1997 are not updated with IGRA data. After 1997, no adjustment is applied for inhomogeneities.
To minimize the discontinuity at 1997/1998, RATPAC-B adds a factor equal to the difference between the means of the IGRA and LKS data for 1996–1997 to the IGRA monthly means. This factor shifts the IGRA data so that the means of the two datasets for the last two years of the LKS time series are equal. If both time series are present for fewer than nine months in those two years, the LKS authors use the period 1990–1997 instead.
The result is a set of station time series for 1958 through the present with no adjustments after 1997. Hemispheric, global, tropical, and extratropical means created from these station time series are available for comparison with RATPAC-A.
More detail about how RATPAC-B is produced can be found in Free et al. (2005), Radiosonde Atmospheric Temperature Products for Assessing Climate (RATPAC): A new data set of large-area anomaly time series.
References
- Free M., D.J. Seidel, J.K. Angel, J. Lanzante, I. Durre and T.C. Peterson, 2005: Radiosonde Atmospheric Temperature Products for Assessing Climate (RATPAC): A new dataset of large-area anomaly time series. Journal of Geophysical Research, 110, D22101, http://dx.doi.org/10.1029/2005JD006169.
- Lanzante, J.R., S.A. Klein, and D.J. Seidel, 2003: Temporal homogenization of monthly radiosonde temperature data. Part I: Methodology. Journal of Climate, 16, 224-240, http://dx.doi.org/10.1175/1520-0442(2003)016<0224:THOMRT>2.0.CO;2.
Related Publications
For additional information about RATPAC, see the following references:
- Free, M., J. K. Angell, I. Durre, J. R. Lanzante, T. C. Peterson, and D. J. Seidel, 2004: Using first differences to reduce inhomogeneity in radiosonde temperature datasets. Journal of Climate, 17, 4171-4179 doi:10.1175/JCLI3198.1. Paper describing the application of the first difference method to radiosonde temperature anomalies.
- Free M., D.J. Seidel, J.K. Angel, J. Lanzante, I. Durre and T.C. Peterson, 2005: Radiosonde Atmospheric Temperature Products for Assessing Climate (RATPAC): A new dataset of large-area anomaly time series. Journal of Geophysical Research, 110, D22101, doi:10.1029/2005JD006169. A Comprehensive Overview of RATPAC.
- Lanzante, J. R., S. A. Klein, and D. J. Seidel, 2003a: Temporal homogenization of monthly radiosonde temperature data. Part I: Methodology. Journal of Climate, 16, 224-240. doi: 10.1175/1520-0442(2003)016<0224:THOMRT>2.0.CO;2. The first of two references describing the LKS time series.
- Lanzante, J. R., S. A. Klein, and D. J. Seidel, 2003b: Temporal homogenization of monthly radiosonde temperature data. Part II: Trends, sensitivities, and MSU comparison. Journal of Climate, 16, 241-262. doi:10.1175/1520-0442(2003)016<0241:THOMRT>2.0.CO;2. The Second of two references describing the LDS time series.


