
NOAA collects and uses active acoustic (or sonar) data for a variety of mapping requirements. Water column sonar data focus on the area from near the surface of the ocean to the seafloor. Primary uses of these specific sonar data include 3-D mapping of fish schools and other mid-water marine organisms; assessing biological abundance; species identification; and habitat characterization. Other uses include mapping underwater gas seeps and remotely monitoring undersea oil spills. NCEI archives water column sonar data collected by NOAA line offices, academia, industry, and international institutions. Use the CruisePack data packaging tool to submit water column sonar data to the archive.
Access Methods
Contact wcd.info@noaa.gov to download the full database or if you have additional questions.
Water Column Sonar Map Viewer
Use the Water Column Sonar Map Viewer to search, discover, and request archived data.
Marine Geophysical Data Search
Search for specific cruises from a listing of archive holdings.
Data Citation
Individual Datasets
Cruises have unique citations. See individual cruises for details.
Complete Archive
National Centers for Environmental Information: Water Column Sonar Data Collection. National Centers for Environmental Information, NOAA. http://doi.org/10.7289/V5HT2M7C. access date.
170 Terabytes and Growing
Water column sonar data help answer complex questions about our oceans. These data also help NOAA meet its mission and advance the field of marine acoustics. Because of their immense value, NCEI, in collaboration with NOAA Fisheries and the University of Colorado, established the Water Column Sonar Data Archive to preserve these data collected on NOAA, academic, industry, and international fleets. The archive provides free, global access to more than 170 terabytes of data to facilitate exploration beyond the data’s original collection purpose.
Contact Us
Partners
NCEI established the Water Column Sonar Data archive in partnership with NOAA Fisheries and the University of Colorado. NOAA NCEI, NOAA Fisheries, NOAA Ocean Exploration, NOAA National Ocean Service, Rolling Deck to Repository (R2R), and academia collaborate to grow this archive.
Data Submission
Use the CruisePack data packing tool to submit new data for the archive. NCEI developed CruisePack to simplify data submission preparation for cruise-based data.
Data Collection Methods
Data are collected using a variety of sonars. Kongsberg's EM122 (12 kHz) and EM302 (30 kHz), Simrad's EK60 (18-710 kHz), ME70 (70-120 kHz), and EK80 (18-710 kHz, split beam and broadband) are the most common sonar systems in the archive.
Data Processing
Echoview, Fledermaus, Python, MATLAB, and Caris are common data processing software. This project archives raw data from which acoustic backscattering volume (Sv), target strength (TS), biological abundance, trophic- and species-level identification, and fish school metrics could be extracted with proper calibration information.
Open Source Tools
- pyEcholab: An open-source, python-based toolkit for reading, processing, plotting, and exporting fisheries acoustic echosounder data by Rick Towler, Chuck Anderson, Veronica Martinez, Pamme Crandell
- NCEI Jupyter Notebook Tutorials: examples for accessing, reading, and plotting AWS-hosted archived echosounder data
- Echopype: an open-source, python-based toolkit that enables interoperability and scalability in ocean sonar data analysis
- The International Council for Exploration of the Sea (ICES) Working Group on Fisheries Acoustic, Science and Technology list of open-source efforts to store, read, process, analyze and interpret fisheries water column sonar data
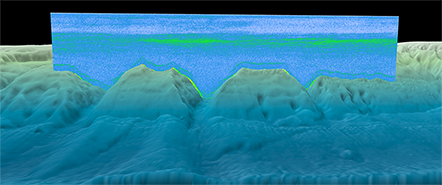
Examples of Single-Beam Echograms
Single Frequency Single-Beam Data File
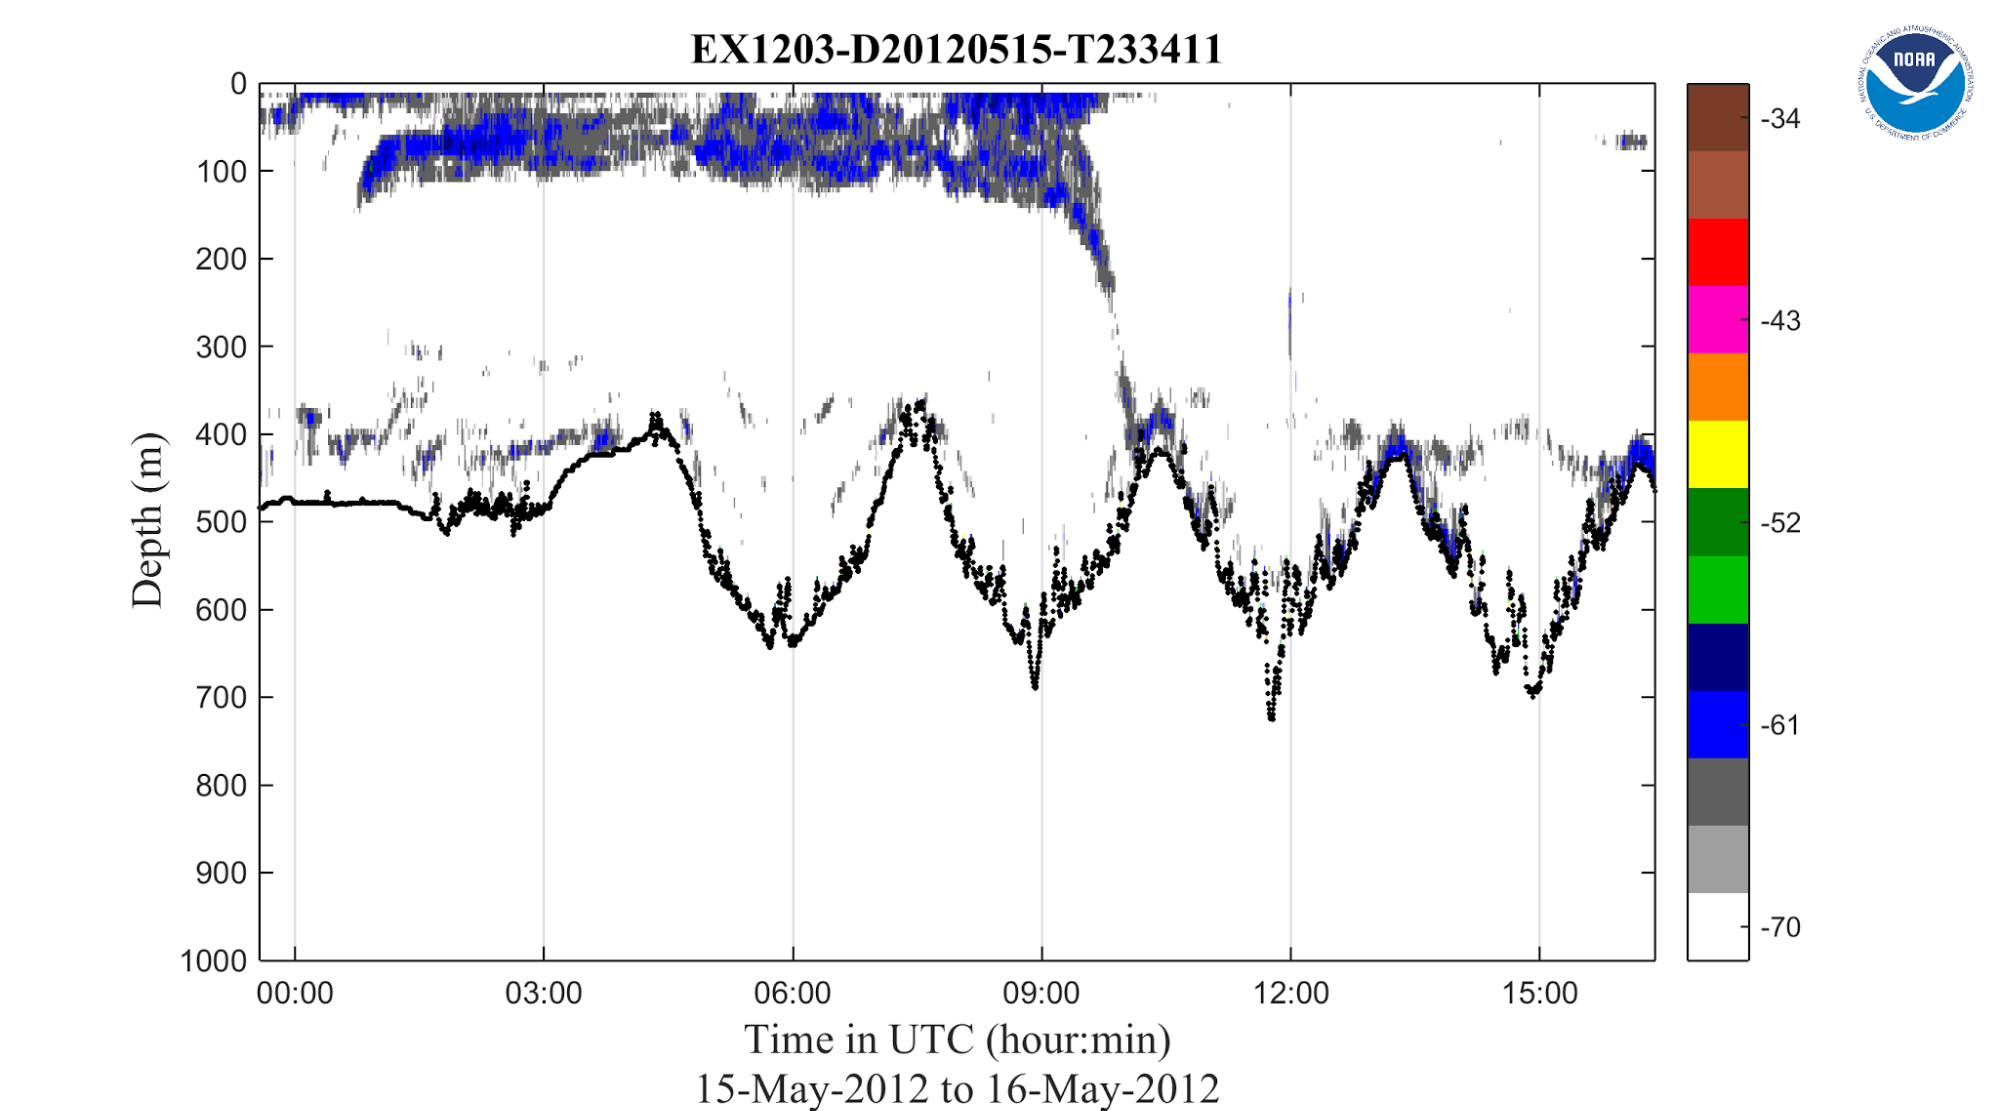
The file spans 15 hours and captures a day and night cycle. The file also captures daily up and down movement (or diel vertical migration) of large volumes of marine organisms (sound scattering layer). During the day, the sound scattering layer is observed at depth, approximately 300-500 meters depth. After sunset, the layer ascends the water column and spreads out to feed (1:00 to 9:30am UTC). Once the sun rises and visual predators become a great risk, the sound scattering layers descend and aggregate to avoid predation (beginning at 10:00am UTC). The black line is the calculated seafloor. In 2012, NOAA Office of Ocean Exploration and Research vessel Okeanos Explorer used a Simrad 18 kHz EK60 sonar system to collect this file off the East Coast of the United States.
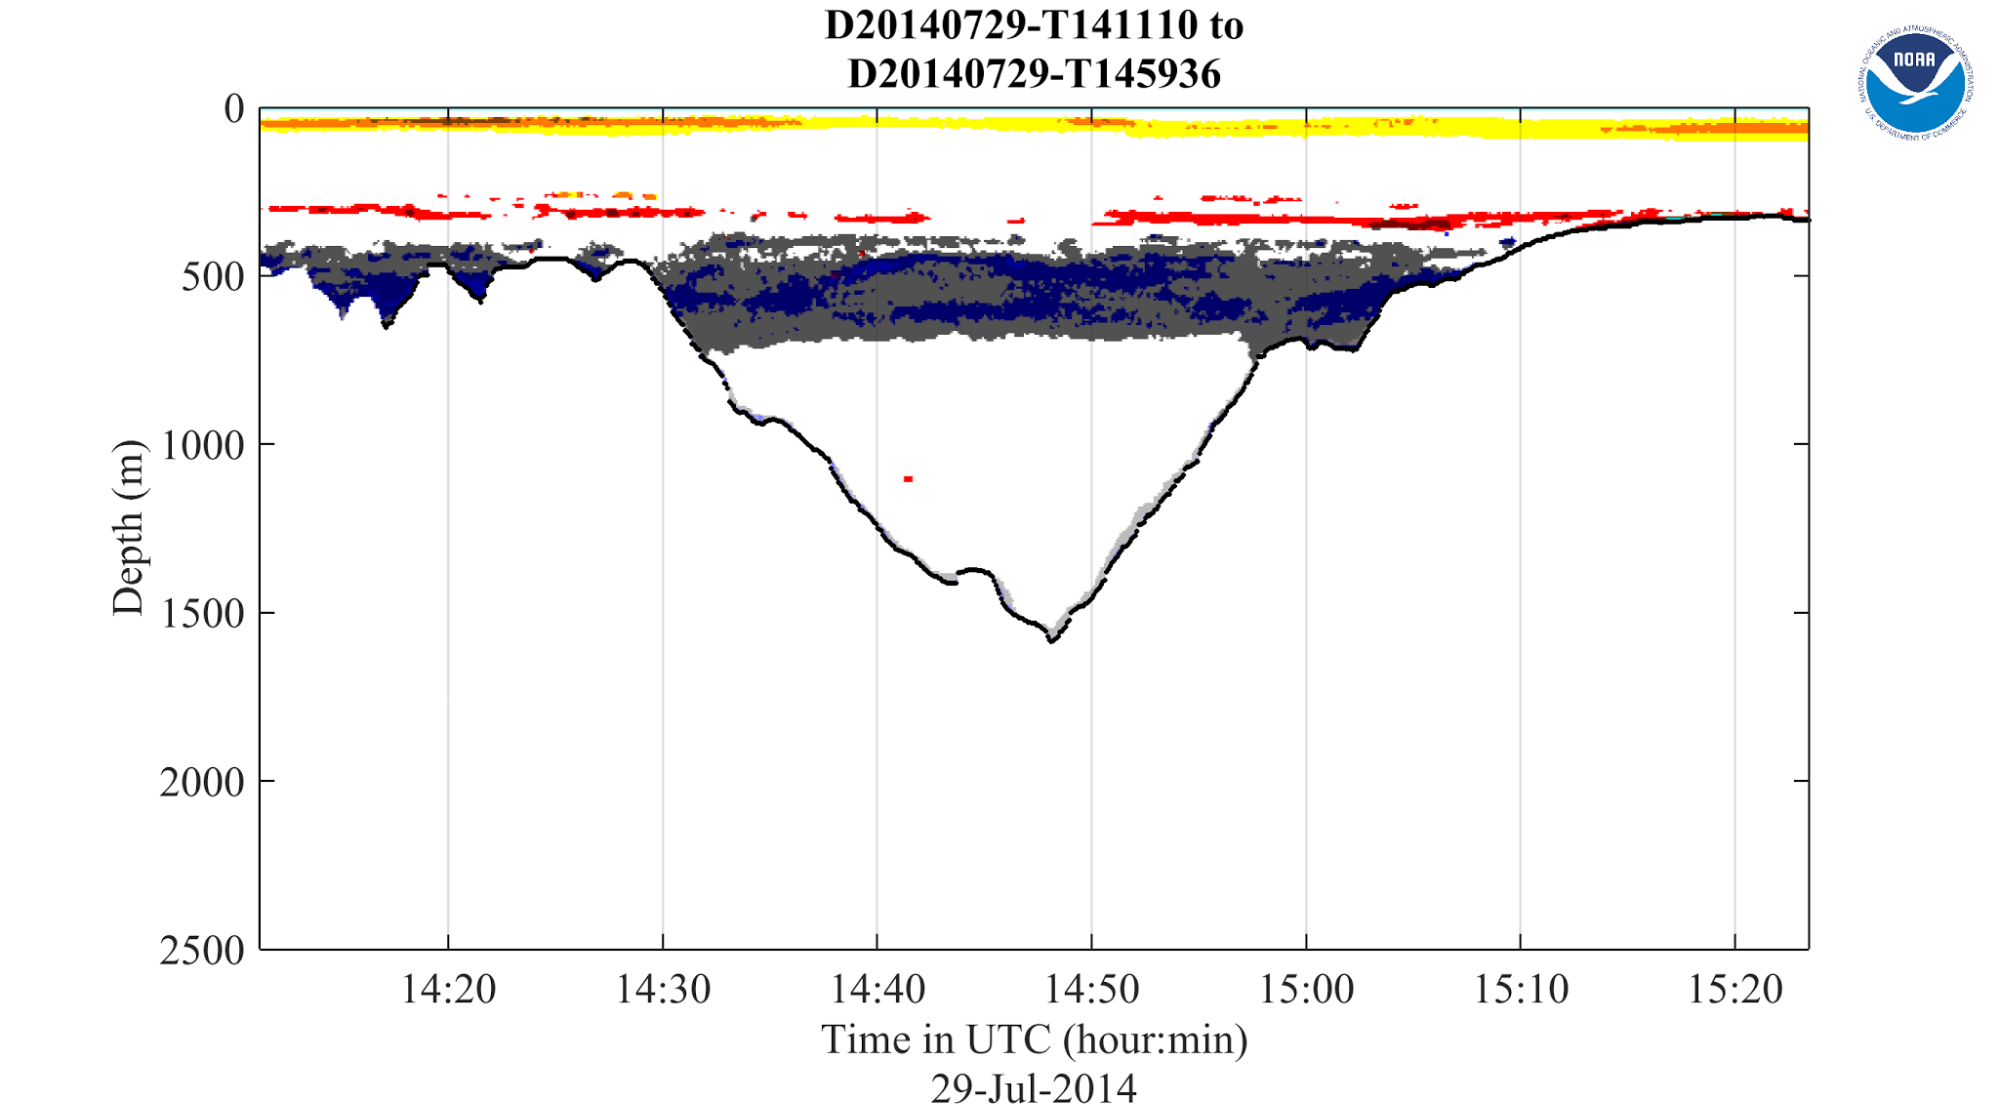
Five Frequency Single-Beam Data Files Processed With The Multiple Frequency Single-Beam Imagery (MFSBI) Algorithm
Swim-bladdered fish reflect strongest at the lower frequencies [18kHz (gray) and 38kHz (blue)]. Conversely, zooplankton reflect strongest at the higher frequencies [120kHz (red) and 200 kHz (yellow)], and assemblages of fish and zooplankton layers become immediately obvious. The assemblages of fish (dark grays and blues) appear to follow a depth range of about 450m to 800m depth regardless of bottom depth.
Zooplankton form two layers within the water column, one (yellow orange) at approximately 50m and another (red) near 300m depth. The black line is the calculated seafloor. In 2014, NOAA National Marine Fisheries Service vessel Henry Bigelow used a Simrad EK60 sonar system running 18kHz, 38kHz, 70 kHz, 120kHz, and 200kHz transducers to collect these files off the East Coast of the United States. The methods to create this image, including the colormap, are outlined in Wall et al., 2016, which were adopted from Jech and Michaels, 2006.
Additional Readings
- Wall, C. C. (2016). Building an accessible archive for water column sonar data, Eos, 97. doi:10.1029/2016EO057595
- Wall, Carrie C., J. Michael Jech, and Susan J. McLean (2016). Increasing the accessibility of acoustic data through global access and imagery, ICES Journal of Marine Science. doi:10.1093/icesjms/fsw014
- Simmonds E.J. and MacLennan, D.N. (2005). Fisheries Acoustics: Theory and practice. Blackwell Science, Oxford. 456pp
- Sonar Data and Fisheries Management: Preserving data for fisheries management and beyond. NCEI.


