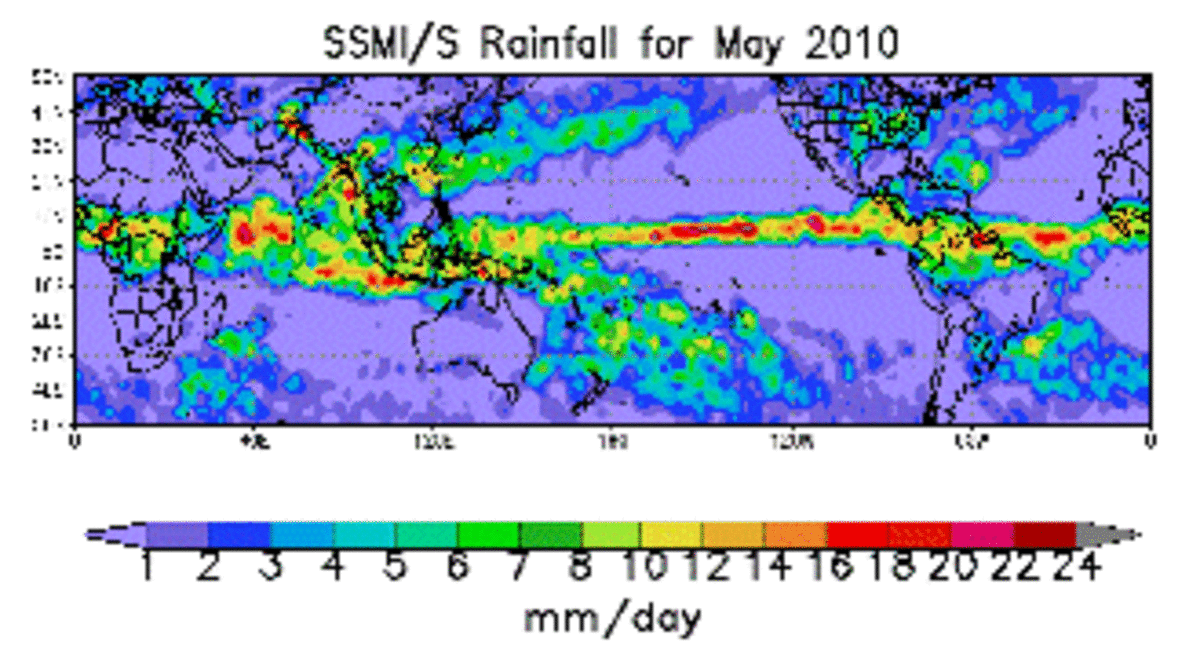
The Defense Meteorological Satellite Program (DMSP) Special Sensor Microwave/Imager (SSM/I) was a seven channel passive microwave radiometer which became operational in July 1987. The SSM/I series was replaced by an advanced sensor, the SSM/IS (Special Sensor Microwave Imager Sounder), which became operational in November of 2005.
Monthly averaged SSM/I and SSMIS products include precipitation, cloud liquid water, total precipitable water, snow cover, and sea-ice extent. These products can be used to evaluate the mean climate state and its interannual/seasonal variations, and to detect anomalies associated with large-scale (e.g. El Niño-Southern Oscillation (ENSO) and Arctic Oscillation) and regional climatic variations. A time series of the entire SSM/I and SSMIS archive includes data from July 1987–present.
Access Methods
SSMIS data is available through the NOAA Comprehensive Large Array-data Stewardship System (CLASS). There has been little impact on the suite of hydrological products, as the primary channels used are almost identical for both the SSM/I and SSMIS; the only exceptions are the dual-polarized 85 GHz channels (SSM/I), which were replaced with dual-polarized 91 GHz channels (SSMIS).

Partners
The following organizations provide quality control for input data through a jointly managed Satellite Climate Studies Branch:
Binary Format Dataset Description
Data Type
4-byte floating point (binary) data.
Data Origin
The input data originates from the DMSP SSM/I instrument. Researchers at STAR assembled a subsampled, 1/3 degree gridded daily archive of this data. The generation of the monthly products uses these daily fields.
Content Elements
File Naming Convention
ppp.yy
where ppp=product type and yy=year (e.g., 87 for 1987).
Period of Record
1989–present
File Contents
Each field is stored as a 1440 byte record of 4-byte real variables. Each record contains 360 values corresponding to each degree of longitude, with the first element corresponding to longitude 0.5° East, the second 1.5° East, etc., and the last 0.5° West. The first record contains data centered at latitude 89.5° South, the second record contains data centered at 88.5° South, etc., and the last 89.5° North. A value of -999.0 indicates missing data.
The first 180 records in the data set correspond to January of that year, the next 180 is February, etc. The total length of each annual data set is 180*1440*12=3,110,400 bytes. The following describes the content of the 1 degree gridded files:
- cfr.yy: Monthly mean cloud fraction (0–1.0)
- ice.yy: Monthly mean sea-ice cover (0–100 percent)
- lwp.yy: Monthly mean liquid water path (1000 * mm)
- pfr.yy: Monthly mean rain fraction (0–1.0)
- pre.yy: Monthly rainfall (mm)
- snw.yy: Monthly mean snow cover fraction (0: 1.0 percent)
- ssa.yy: Monthly mean sampling fraction (0: 1.0)
- win.yy: Monthly mean surface wind speed (m/sec)
- wvp.yy: Monthly mean total precipitable water (mm)
File Naming Convention
ppp.mon
where ppp=product type.
Period of Record
The dataset starts in 1987 and is continually updated with current data. The first valid month of data is July 1987. Due to F8 instrument failure, there is no valid data for December 1987. There is no valid data for cfr, lwp, pf1, and pr1 for July 1990–December 1991.
File Contents
Each field is stored as a 576 byte record of 4-byte real variables. Each record contains 144 values corresponding to each 2.5° of longitude, with the first element corresponding to longitude 1.25° East, the second 2.5° East, etc. and the last 1.25° West. The first record contains data centered at latitude 88.75° South; the second record contains data centered at 86.25° South, etc. and the last 88.75° North. A value of -999.0 indicates missing data. Negative values in the pr1 and pr2 rainfall products denote indeterminate rainfall due to snow and ice cover; the absolute value indicates the fraction of ice/snow cover for the month.
The first 72 records in the dataset correspond to January 1987 (72 is February 1987, etc.) and the last 72 records correspond to December of the current year. The total length of each dataset is 72*576*12*(# of years available....in 2002 # of years = 16) = total # of bytes. The following describes the content of the 2.5° gridded files:
- cfr.mon: Monthly mean cloud fraction (0–1.0)
- lwp.mon: Monthly mean liquid water path (1000*mm)
- pf1.mon: Monthly mean rain fraction (0–1.0) using 85 GHz scattering algorithm over land, scattering/emission over ocean (ALG#1)
- pr1.mon: Monthly rainfall (mm) using ALG#1
- pf2.mon: Monthly mean rain fraction (0–1.0) using 37 GHz scattering algorithm over land, emission over ocean (ALG#2)
- pr2.mon: Monthly rainfall (mm) using ALG#2
- ssa.mon: Monthly mean sampling fraction (0–1.0)
- ice.mon: Monthly mean sea-ice cover (0–100 percent)
- snw.mon: Monthly mean snow cover fraction (0–1.0 percent)
- wvp.mon: Monthly mean total precipitable water (mm)
File Naming Convention
pppyy-f13-2.5.pen
where ppp=product type and yy=year (e.g.,87 for 1987)..
Period of Record
The dataset starts in 1987 and is continually updated with the current data.
File Contents
Each field is stored as a 576 byte record of 4-byte real variables. Each record contains 144 values corresponding to each 2.5° of longitude, with the first element corresponding to longitude 1.25° East, the second 2.5° East, etc. and the last 1.25° West. The first record contains data centered at latitude 88.75° South; the second record contains data centered at 86.25° South, etc. and the last 88.75° North. A value of -999.0 indicates missing data. Negative values in the pr1 and pr2 rainfall products denote indeterminate rainfall due to snow and ice cover; the absolute value indicates the fraction of ice/snow cover for the month.
The first 72 records in the dataset correspond to the first pentad of the year, 72 to the second one, etc. and the last 72 records correspond to the last pentad of December of the given year. The total length of each data set is 72*576*73 (number of pentad in the year) = total # of bytes. The following describes the content of the pentad 2.5° gridded files:
- cfryy-f13-2.5.pen: Pentad mean cloud fraction (0–1.0)>
- lwpyy-f13-2.5.pen: Pentad mean liquid water path (1000*mm)
- pf1yy-f13-2.5.pen: Pentad mean rain fraction (0–1.0) using 85 GHz scattering algorithm over land, scattering/emission over ocean (ALG#1)
- pr1yy-f13-2.5.pen: Pentad rainfall (mm) using ALG#1
- pf2yy-f13-2.5.pen: Pentad mean rain fraction (0–1.0) using 37 GHz scattering algorithm over land, emission over ocean (ALG#2)
- pr2yy-f13-2.5.pen: Pentad rainfall (mm) using ALG#2
- ssayy-f13-2.5.pen: Pentad mean sampling fraction (0–1.0)
- iceyy-f13-2.5.pen: Pentad mean sea-ice cover (0–100 percent)
- snwyy-f13-2.5.pen: Pentad mean snow cover fraction (0–1.0 percent)
- winyy-f13-2.5.pen: Pentad mean surface wind speed (m/sec)
- wvpyy-f13-2.5.pen: Pentad mean total precipitable water (mm)
Period of Record
The data set begins in 1987 and is continually updated with current data. The first valid month of data is July 1987. Due to F8 instrumental failure, there is no valid data for December 1987. There is no valid data for cfr, lwp, pf1, and pr1 for July 1990–December 1991 for product 1 and 2. Products 3 to 6 begin in 1992 and are continually updated with current data.
File Contents
Each field is stored as a 576 byte record of 4-byte real variables. Each record contains 144 values corresponding to each 2.5° of longitude, with the first element corresponding to longitude 1.25° East, the second 2.5:deg; East, etc. and the last 1.25° West. The first record contains data centered at latitude 88.75° South; the second record contains data centered at 86.25° South, etc. and the last 88.75° North. A value of -999.0 indicates missing data. Negative values in the pr1 and pr2 rainfall products denote indeterminate rainfall due to snow and ice cover; the absolute value indicates the fraction of ice/snow cover for the month.
The following describes the content of the gpcp 2.5° gridded files:
- gpcp_nesdis_pr1: Monthly rainfall using 85 GHz scattering algorithm over land, scattering/emission over ocean (ALG#1) for the early morning constellation (F8-F11 and F13)
- gpcp_nesdis_pr2: Monthly rainfall using 37 GHz scattering algorithm over land, emission over ocean (ALG#2) for the early morning constellation (F8-F11 and F13)
- gpcp_nesdis_f10_pr1: Monthly rainfall using 85 GHz scattering algorithm over land, scattering/emission over ocean (ALG#1) for the mid-morning constellation (F10/14 and F15)
- gpcp_nesdis_f10_pr2: Monthly rainfall using 37 GHz scattering algorithm over land, emission over ocean (ALG#2) for the mid-morning constellation (F10/14 and F15)
- gpcp_nesdis_dual_pr1: Monthly rainfall using 85 GHz scattering algorithm over land, scattering/emission over ocean (ALG#1) for the combination of both constellations
- gpcp_nesdis_dual_pr2: Monthly rainfall using 37 GHz scattering algorithm over land, emission over ocean (ALG#2) for the combination of both constellations
For products 1 and 2, the first 72 records in the data set correspond to January 1987, 72 are February 1987, etc., and the last 72 records correspond to December of the current year. The total length of each data set is 72*576*12*(# of years available since 1987) = total # of bytes. For the rest of the products, the first 72 records in the data set correspond to January 1992, 72 are February 1987, etc., and the last 72 records correspond to December of the current year. The total length of each data set is 72*576*12*(# of years available since 1992) = total # of bytes.
Dataset Producer
Hilawe Semunegus
NOAA's National Centers for Environmental Information
Center for Weather and Climate
151 Patton Avenue
Asheville, NC 28801-5001
Hilawe.Semunegus@noaa.gov
References
- M. C. Colton and G. A. Poe, 1999: Intersensor calibration of DMSP SSM/I's: F-8 to F-14, 1987-1997. IEEE Transactions on Geoscience and Remote Sensing, 37, 418-439, doi:10.1109/36.739079.
- Ferraro, R., N. Grody, F. Weng, and A. Basist, 1996: An eight-year (1987–1994) time series of rainfall, clouds, water vapor, snow cover, and sea ice derived from SSM/I measurements. Bulletin of the American Meteorological Society, 77, 891–905, doi:10.1175/1520-0477(1996)077<0891:AEYTSO>2.0.CO;2.
- Vila, D., R. Ferraro, and H. Semunegus, 2010: Improved global rainfall retrieval using the Special Sensor Microwave Imager (SSM/I). Journal of Applied Meteorology and Climatology, 49, 1032–1043, doi:10.1175/2009JAMC2294.1. describes the details of a quality-controlled version of the SSM/I products.
- Vila, D., C. Hernandez, R. Ferraro, and H. Semunegus, 2013: The performance of hydrological monthly products using SSM/I–SSMI/S sensors. J. Hydrometeor., 14, 266–274, doi:10.1175/JHM-D-12-056.1.


