
The Deepwater Horizon Sea Turtle Early Restoration Project aims to restore sea turtle populations in the Gulf of America affected by the Deepwater Horizon oil spill. One component involves enhancing the Sea Turtle Stranding and Salvage Network (STSSN) in the Gulf of America and developing an emergency response program to improve the understanding of sea turtle mortality in the Gulf of America. “Stranding” refers to a sea turtle found floating or washed ashore that is either deceased or alive and impaired by injury, illness, or other condition. The ability to estimate the origination location of stranded turtles facilitates an understanding of how environmental conditions influence animal drift and dispersal. The Beaching Probability Index (BPI) is an analytical mapping tool developed to help understand the influence of environmental conditions on stranding patterns, trends, and probabilities to inform stranding surveillance efforts.

Beaching Probability Index (BPI) Data Archive
Daily BPI data files from January 1, 2017 to last month have been archived at NOAA’s NCEI. These historical data files, grouped annually into accessions, are accessible via the ‘Granule Search’ link in the ‘Access’ tab of the main BPI dataset archive landing page. Additionally, they are accessible along with the near real-time data in the BPI web application.
Beaching Probability Index (BPI) Web Application
The BPI web application provides daily sea turtle stranding probability factors in the coastal areas of the northern Gulf of America. BPI helps resource managers, scientists, and conservationists understand locations where floating deceased or debilitated sea turtles are most likely to wash ashore based on how current, wind and environmental conditions influence animal drift and dispersal.

Background Information on Stranded Sea Turtles in the Gulf of America
Five species (green, hawksbill, Kemp's ridley, leatherback, and loggerhead) of the world’s seven species of sea turtles are found within the Gulf of America and are subject to both natural and anthropogenic sources of mortality. “Stranding” refers to sea turtles that are washed ashore or floating, either dead or alive, but impaired due to injury, illness, or other condition. Hundreds of sea turtles strand each year in the northern Gulf of America. For more information, see NOAA Fisheries’ frequently asked questions about sea turtle stranding in the Northern Gulf of America.

Project History
BPI was developed as a collaborative research project between NOAA Fisheries’ Southeast Fisheries Science Center (SEFSC) and the Office of Protected Resources (OPR) from 2016-2019 under the Deepwater Horizon Sea Turtle Early Restoration Project. Personnel at the NCEI and the Northern Gulf Institute (NGI) worked together with SEFSC and OPR to convert BPI to an operational product with a web application from 2019-2021. BPI is now operated and maintained at NCEI and used by the STSSN for research and management.
Beaching Probability Index (BPI) Introduction
The BPI focuses on the fate of deceased or impaired sea turtles that are floating at the sea surface, where they are susceptible to drift and discovery. The BPI is used to predict how the current environmental conditions influence strandings by calculating the likelihood that floating sea turtles will wash ashore in the Gulf of America. The outputs help users understand environmental factors that influence stranding patterns and trends and can inform stranding surveillance efforts.
How does it work?
Data (NetCDF files) from the Americas Seas Region (AMSEAS) of the Regional Navy Coastal Ocean Model (NCOM) is used in conjunction with the probability of a carcass stranding based on oceanographic factors such as surface current and wind. AMSEAS gives a 3 hr, ~2.8 km resolution, 1000×1510 grid domain of the Gulf of America and the Caribbean Sea, and includes tidal, geostrophic, and atmospheric-driven water motion.
Within the BPI simulation, surface currents and winds from AMSEAS are used to push pseudo-floating objects (particles) for an 8 day lifespan. Each day, at 0 h Greenwich Mean Time (GMT), new particles are seeded onto the uniform starting grid of 84,044 points spaced 1 nm apart. This uniform grid extended from the coast to 60 nm offshore (Figure 1), which is the furthest distance sea turtle carcasses were likely to drift based on observations. The system maintains a running tally such that on any given day, all objects that are still in motion and less than 8 days old are pushed forward. Particles that encounter shallow water (<25 cm depth) stop moving and are counted as “beached.” The system is suitable for estimating the ocean and wind influence on the stranding of seaweed, sea turtles, or any other drifting object. The leeway value, the amount of “push” the wind gives a floating object, is set at 3.5% (Nero et al. 2013), a value roughly applicable to sea turtles or any other object floating at about 50% exposed at the sea surface.
 Start grid for the northern Gulf of America")
Because the system assumes a uniform grid from near the coast to outwards of 60 nm, the particle counts on any particular shoreline are somewhat arbitrary in that coast geometry, such as bays and islands, greatly influences particle availability to that shoreline. However, particle counts at one location or region over time reflect a true relative index of beaching likelihood for that region.
BPI output maps are a gridded summary of particle strandings showing the likelihood of beach strandings based on the accumulation of particles that impinge on the shoreline over the last 8 days from the date selected. For example, the BPI map from March 29, 2018 (Figure 2) shows the logistical likelihood of sea turtles (carcasses in this example) stranded in the northern Gulf of America between March 22-29, 2018. Areas likely to see more strandings (if they are occurring) are indicated by orange and red dots.
 for the northern Gulf of America on March 29, 2018")
The BPI for 9 different predefined regions in the Gulf of America has been calculated daily and archived since January 1, 2017.
Figure 3 shows a map of these regions including the Gulf of America (GOA), northern Gulf of America (NGOA), south Texas (TX_S), north Texas (TX_N), Louisiana (LA), Mississippi (MS), Alabama (AL), north Florida (FL_N), and south Florida (FL_S).
Users can also define new regions of interest for comparisons.
 Regions for Daily BPI Archive")
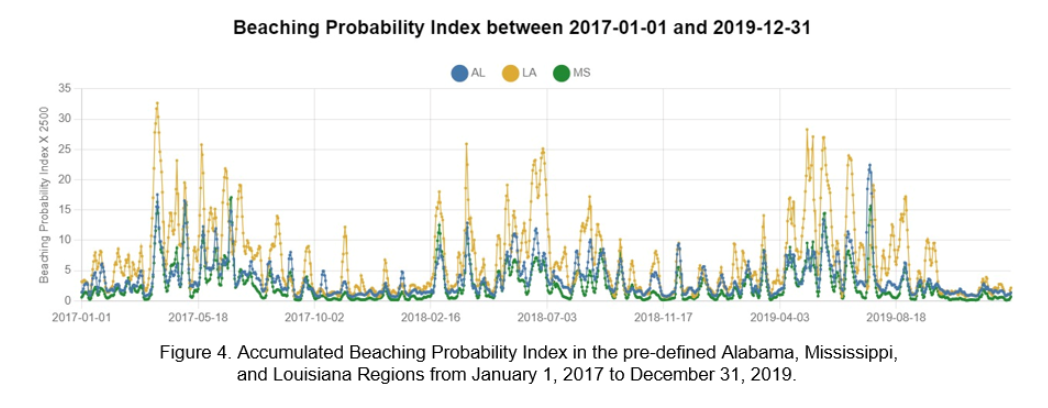
Inside the BPI web application, users can define new regions of interest for comparisons as well as draw time series to compare BPI over time using the daily data in the archive. Figure 4 shows the BPI accumulated in the pre-defined Alabama, Mississippi, and Louisiana regions between 2017 and 2019.
Application Manual
Resources
- Deepwater Horizon Oil Spill
- National Marine Fisheries Service (NMFS)
- Regional Navy Coastal Ocean Model (NCOM) Americas Seas (AMSEAS)
- Sea Turtle Stranding and Salvage Network (STSSN)
Publications
- Cook, M., Reneker, J.L., Nero, R.W., Stacy, B.A., Hanisko, D.S., Wang, Z., 2021. Use of Drift Studies to Understand Seasonal Variability in Sea Turtle Stranding Patterns in Mississippi. Frontiers in Marine Science, 8, p.447. doi: 10.3389/fmars.2021.659536
- Dannreuther, N.M., Cook, M., Wang, Z., Schultz, E. “Tracking Where, When and Why Sea Turtles Die.” Northern Gulf Institute, 28 October 2022, https://www.northerngulfinstitute.org/news/?d=1060. [Date Accessed].
- Howell, L.*, B. Stacy*, R. Hardy, E. Schultz, M. Cook, Z. Wang, J. Keene, M. Lawrence, M. Solangi, D. Moore, T. Morgan. 2021. Northern Gulf of Mexico sea turtle strandings: A summary of findings and analyses from 2015–2019. Department of Commerce, National Marine Fisheries Service, NOAA Technical Memorandum NMFS OPR-69, 110 p. PDF
- Nero, R.W., Cook, M., Coleman, A.T., Solangi, M. and Hardy, R., 2013. Using an ocean model to predict likely drift tracks of sea turtle carcasses in the north central Gulf of Mexico. Endangered Species Research, 21(3), pp.191-203. doi: 10.3354/esr00516
- Nero, R.W., Cook, M., Reneker, J.L., Wang, Z., Schultz, E.A., Stacy, B.A., 2022. Decomposition of Kemp’s Ridley (Lepidochelys kempii) and green (Chelonia mydas) sea turtle carcasses and its application to backtrack modeling of beach strandings. Endangered Species Research, 47, pp.29-47. doi: 10.3354/esr01164
- Schultz, E.A., Cook, M., Nero, R.W., Caillouet, R.J., Reneker, J.L., Barbour, J.E., Wang, Z., Stacy, B.A., 2022. Point of No Return: Determining Depth at Which Sea Turtle Carcasses Experience Constant Submergence. Chelonian Conservation and Biology 21 (1), 88-97. doi: 10.2744/CCB-1518.1
- Stacy, B., R. Hardy, D. Shaver, C. Purvin, L. Howell, H. Wilson, M, Devlin, A. Krauss, C. Macon, M. Cook, Z. Wang, L. Flewelling, J. Keene, A. Walker, P. Baker, T. Yaw. 2020. 2019 Sea Turtle Strandings in Texas: A Summary of Findings and Analyses. Department of Commerce, National Marine Fisheries Service, NOAA Technical Memorandum NMFS OPR-66, 64 p. PDF
Contact
Email: ncei.info@noaa.gov
Frequently Asked Questions
Why does the BPI use eight days of particle accumulation?
This length of time was based on a very rough estimate of how long carcasses last at sea as well as some test runs. Beyond 8 days, the ocean conditions and weather often change and the BPI becomes less meaningful for local coastal conditions. Also, to travel across the shelf in steady conditions, it usually takes 8 days or so to travel 60 nm.
Why are no BPI points mapped on a narrow strip of land?
If the strip of land is so narrow that its width is less than the model grid, then the model likely won't simulate these areas properly, which is a well-known problem with all numerical models. The particles seemingly can cross those barrier islands and won't accumulate on the offshore side of them. These need to be taken into account when comparing the BPI to stranding numbers.
Why does BPI legend show a single value (10, 100, 1000) and not ranges?
A color-coded scatter plot is used to display the distribution of BPI with bigger dots representing larger values. The BPI legend just shows the representative values (1, 10, 100, 1000, 10000) of the BPI. A base-10 log scale is used for BPI values and the log10 scale values determine the size and color of the dots. The actual values in the map are ranges, not a single value.
How can an area of interest be imported and saved for future use with the BPI web application?
If a user repeatedly wants the same regions defined, then a local file defining the regions can be imported. The format of this .csv or .txt file is as follows:
Header: region, minLon, maxLon, minLat, maxLat, numPts, lon1, lat1, lon2, lat2, ...,lonN, latN,
- Row 1: myRegion1,-90,-88,29,31,4,-90,29,-90,31,-88,31,-88,29,
- Row 2: myRegion2, -87, -85, 29, 31, 4, -87, 29, -87, 31, -85, 31, -85, 29,
- Row 3: where “region” is the name of the new region, “minLon” is the minimum longitude of the region, “maxLon” is the maximum longitude of the region, “minLat” is the minimum latitude of the region, “maxLat” is the maximum latitude of the region, “numPts” is the number of points of the region, “lon1, lat1, lon2, lat2, ..., lonN, latN,” are the longitude and latitude values of the points either in clockwise or counterclockwise direction.


