
NCEI, the World Data Service for Geophysics (including Tsunamis), and the UNESCO-IOC International Tsunami Information Center, collaborate to provide tsunami travel time maps. Tsunamis are categorized as long waves; therefore, tsunami travel times can be computed with water depth as the only variable (Murty, T.S., Seismic Sea Waves Tsunamis, Bulletin 198). Long waves occur when the distance between wave crests is much greater than the water depth through which the wave is traveling. Wave speed is computed from the square root of the quantity: water depth times the acceleration of gravity. So, tsunami travel times can be computed without any knowledge of the tsunami's height, wavelength, etc.
Coastal Locations Interactive Map
Coastal Locations Interactive Map provides estimated tsunami travel times from any point in the ocean to selected coastal locations.
Maps do not provide information on the height or the strength of the wave, they only provide record of the arrival times. There are several situations in which the estimated arrival times may not match observed arrival times of the tsunami waves, including but not limited to the following:
- Bathymetry is not accurate in the vicinity of the epicenter.
- Bathymetry is not accurate in the vicinity of the reporting station.
- Epicenter is not well located therefore the origin time is uncertain.
- Epicenter is on land and a pseudo-epicenter off the coast must be selected.
- Nonlinear propagation effects may be important in shallow water.
- Observed travel times do not represent the first wave but instead designate later arrivals.
Tsunami Sources Data Access
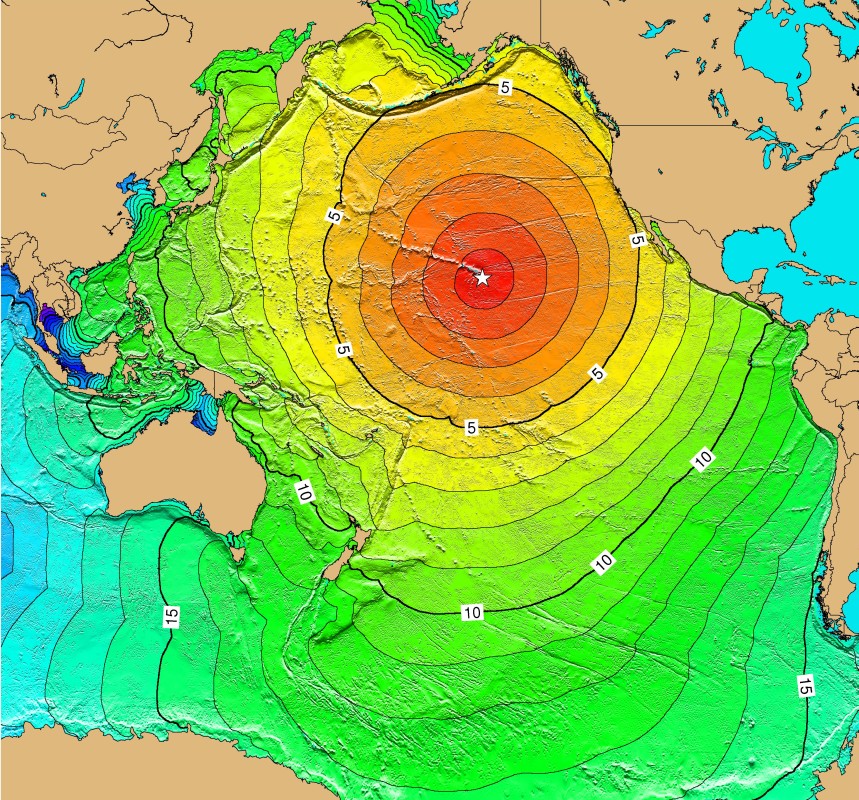
Maps generated using Tsunami Travel Time (TTT) software that calculates first-arrival travel times on a grid for a tsunami generated at an earthquake epicenter.
Map contours: 1-hour intervals
- Red: 1-4 hour arrival times
- Yellow: 5-6 hour arrival times
- Green: 7-14 hour arrival times
- Blue: 15-21 hour arrival times
Maps were generated from earthquake epicenters in the NCEI Global Historical Tsunami Database using NCEI 2-Minute Gridded Global Relief Data bathymetry.
NOTE: Maps do not provide the height or the strength of the wave, only the arrival times.
"Event Details," links to runups (observed wave locations). In some cases, runups have observed tsunami arrival times, which can be compared with the map calculated arrival times. Calculated times are usually within 1 hour of the observed travel times, but can differ by more than one hour, particularly when the location is across the Pacific Basin (why times may be different).
Atlantic
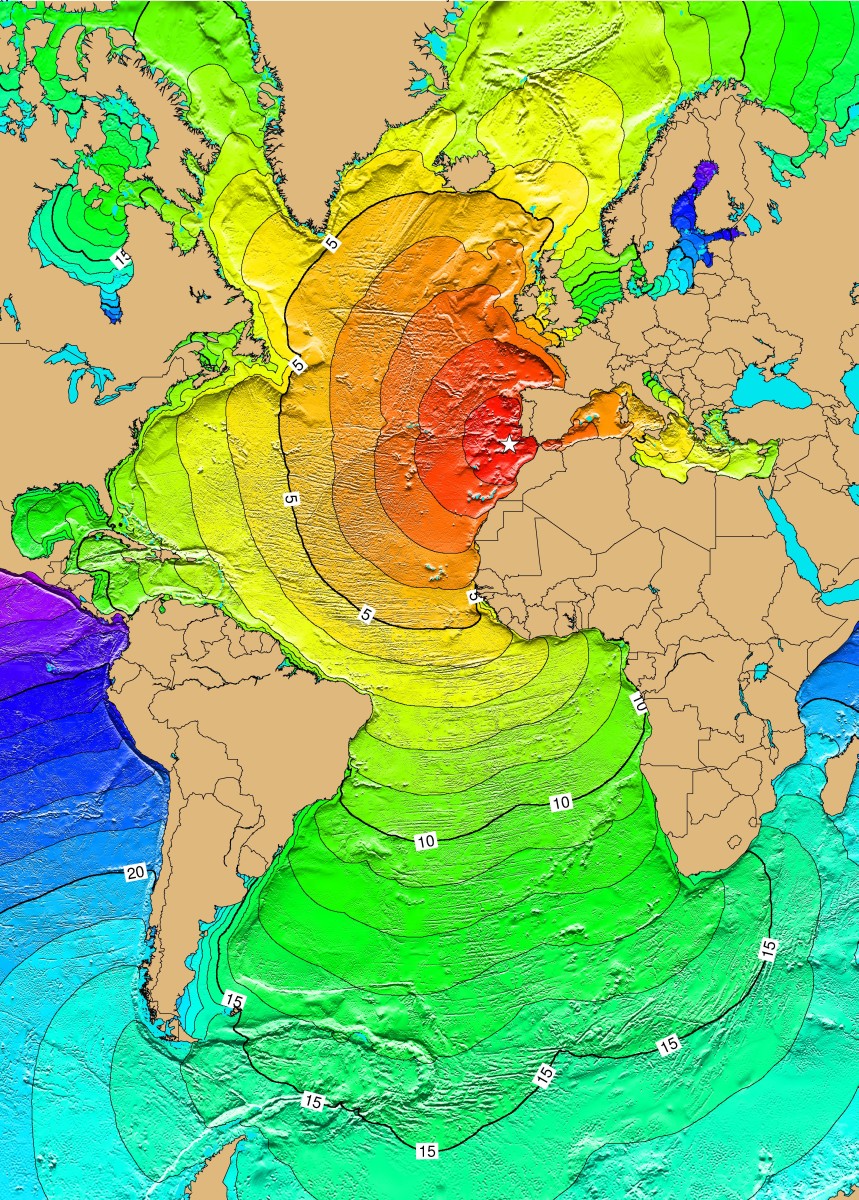
November 1, 1755 Lisbon, Portugal
A large earthquake, Modified Mercalli Intensity XI, in Lisbon, Portugal, caused damage to the north of Granada, Spain. The earthquake generated a tsunami that affected the coasts of Portugal, Spain, North Africa, and the Caribbean. The tsunami reached Lisbon about 20 minutes after the first destructive shock. It rose to 6 meters at many points along the Portuguese coast and reached 12 meters in some places. It also affected the coast of Morocco where the streets of Safi were flooded. The tsunami reached Antigua about 9.3 hours after the earthquake. Later waves, with estimated runup heights of 7 meters, were observed at Saba, Netherlands, Antilles. The earthquake and tsunami killed between 60,000 and 100,000 people.
Portugal Hazards Tsunami Event Details
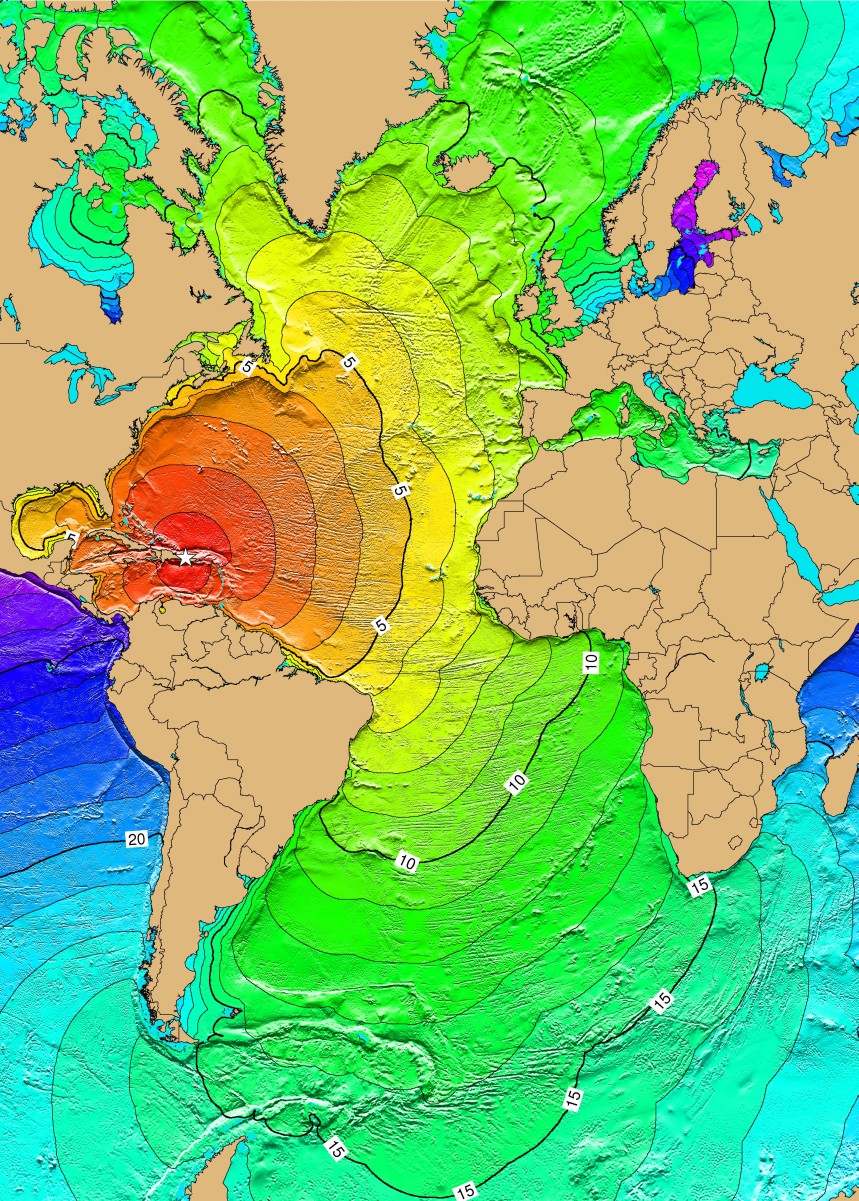
October 11, 1918 Puerto Rico
A magnitude 7.3 Mw earthquake on October 11, 1918, in the Mona Passage, west of Puerto Rico, was caused by displacement along four segments of a normal fault, oriented N-S in the Mona Canyon. The earthquake generated a tsunami with runup heights reaching 6 meters, causing extensive damage along the western and northern coasts of Puerto Rico. The earthquake and tsunami caused $29 million damage, 116 people were killed and 100 were reported missing.
Puerto Rico Hazards Tsunami Event Details
November 18, 1929 Grand Banks
On November 18, 1929 a magnitude 7.4 Mw earthquake occurred 250 km south of Newfoundland along the southern edge of the Grand Banks, Canada. The earthquake was felt as far away as New York and Montreal. It triggered a large submarine slump which ruptured 12 transatlantic cables in multiple places and generated a tsunami. The tsunami was recorded along the east coast of Canada and the U.S., as far south as Martinique in the Caribbean, and across the Atlantic Ocean in Portugal. The tsunami caused an estimated $1 million damage and 28 deaths in Newfoundland, Canada.
Grand Banks Hazards Tsunami Event Details

Indian
August 27, 1883 Krakatau
The explosion of the Krakatau Volcano in Indonesia on August 27, 1883, generated a 30 meter tsunami in the Sunda Strait which killed 36,000 people. It also caused an atmospheric pressure wave that was recorded on the tide gauges at remote locations including South Georgia Island, Panama, France, England, Alaska, Hawaii, and San Francisco. Due to the shadowing by continents and island groups, a direct tsunami could not have reached most of these locations. Atmospheric gravity waves occurred which may have excited water waves by transferring energy into the ocean. It was recorded with an amplitude of six inches at Sausalito, California.
Krakatau Hazards Tsunami Event Details
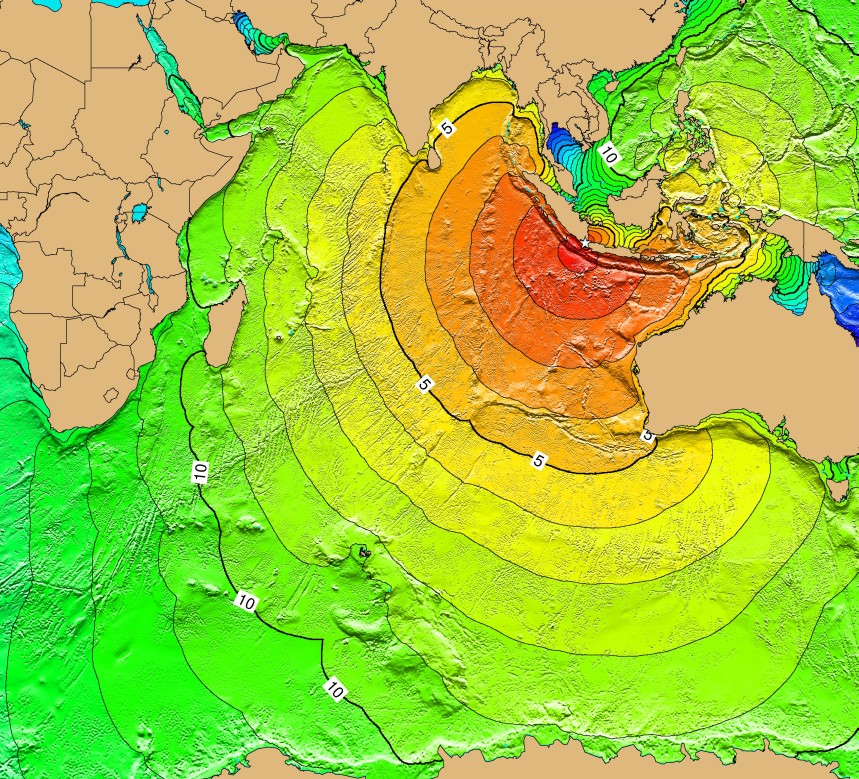
December 26, 2004 Sumatra, Indonesia
A magnitude 9.1 Mw earthquake occurred off the west coast of Sumatra, Indonesia, on December 26, 2004. It was the fourth largest earthquake in the world since 1900 and the largest since the 1964 Prince William Sound, Alaska, earthquake. The earthquake generated a tsunami that caused more casualties than any other in recorded history. The tsunami was recorded nearly world-wide on tide gauges in the Indian, Pacific and Atlantic Oceans. In total, more than 227,898 people were killed or missing and 1,126,900 were displaced by the earthquake and subsequent tsunami in 14 countries in South Asia and East Africa.
Sumatra, Indonesia Hazards Tsunami Event Details
Pacific
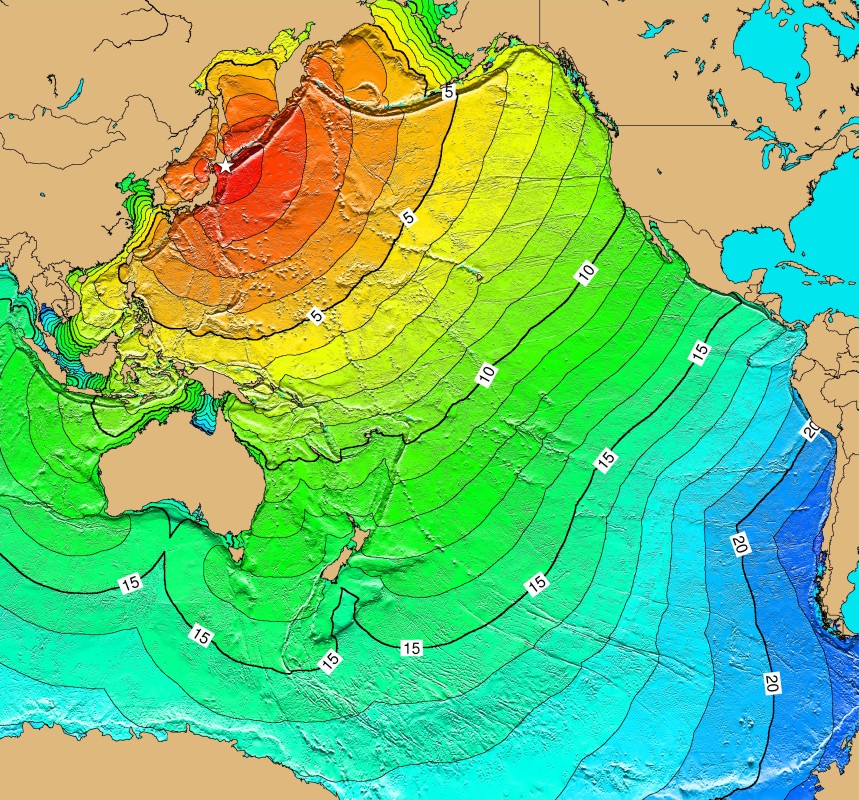
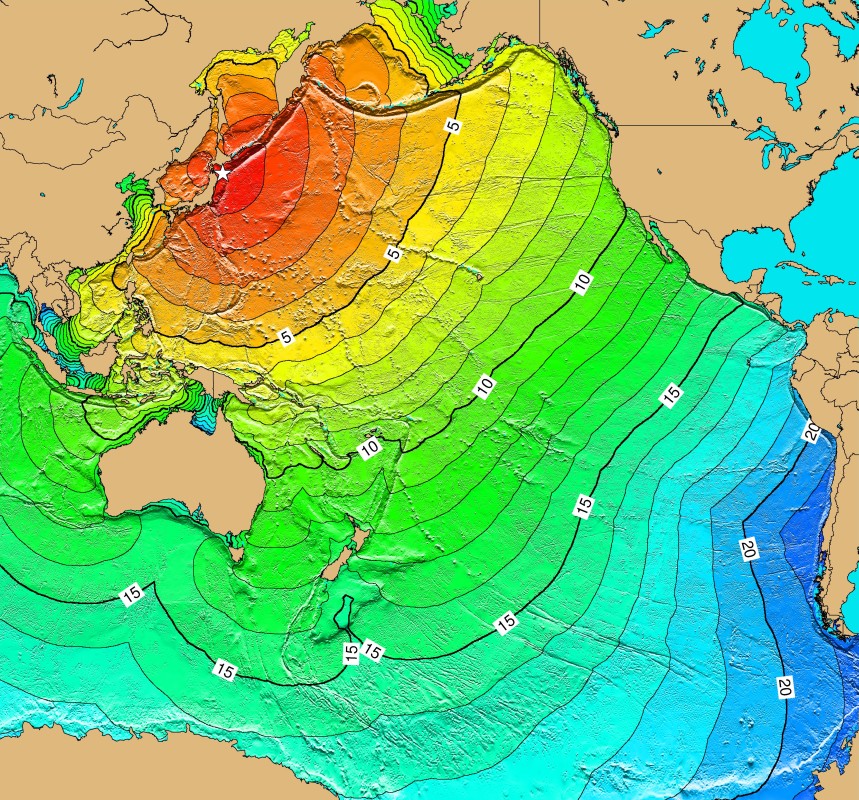
February 3, 1923 Kamchatka, Russia
The February 3, 1923 magnitude 8.3 Mw earthquake off the east coast of Kamchatka, Russia, generated an 8-meter tsunami that caused damage in Kamchatka and Hawaii. It was also observed in Japan and California.
Kamchatka, Russia Hazards Tsunami Event Details
December 7, 1944 Kii Peninsula, Japan
The 1944 Pacific-wide tsunami was caused by a magnitude 8.1 Mw earthquake that occurred off the southeast coast of Kii Peninsula, Japan. The earthquake and resulting tsunami caused great destruction and loss of life. About 998 people were killed, 2,135 people were seriously injured, 26,135 homes were totally destroyed, 46,950 homes were partially destroyed, and 3,059 homes were washed away. The tsunami was observed on tide gauges in the Hawaiian and Aleutian Islands.
Peninsula, Japan Hazards Tsunami Event Details
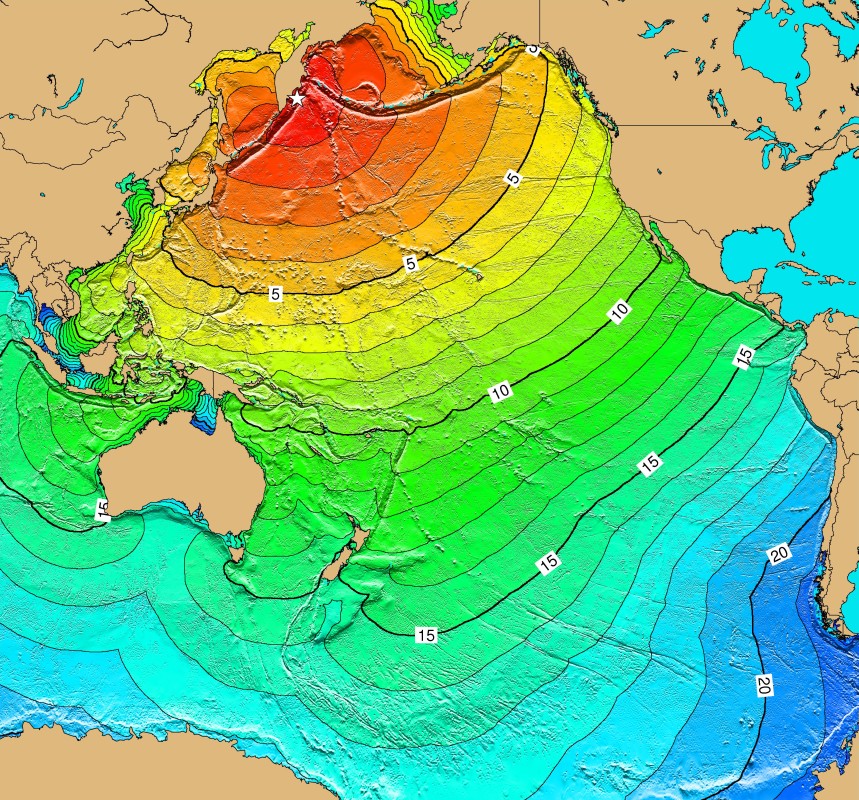
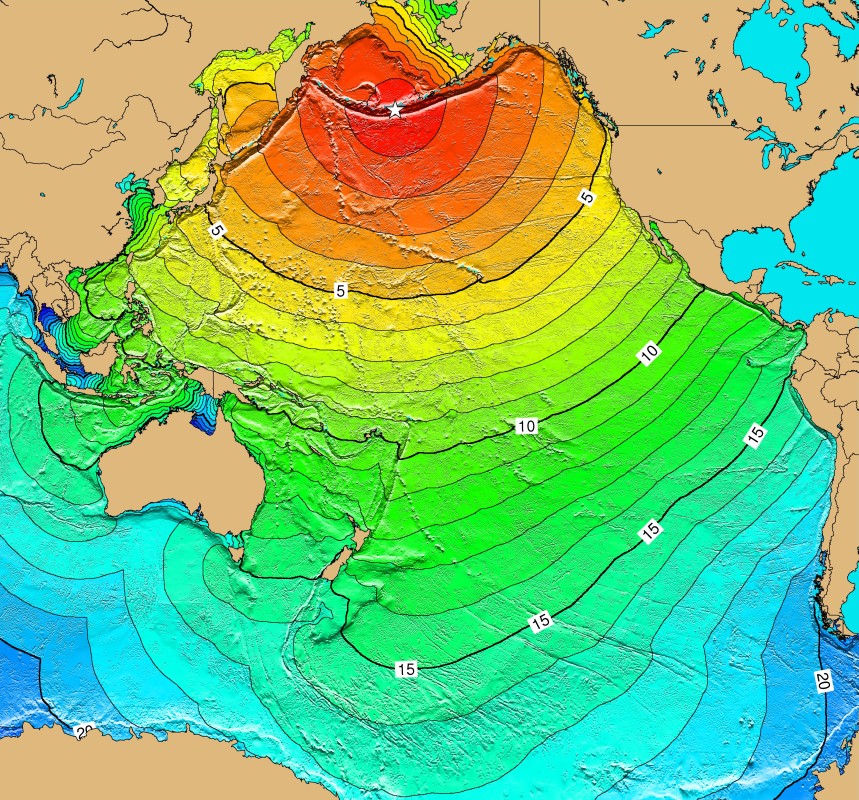
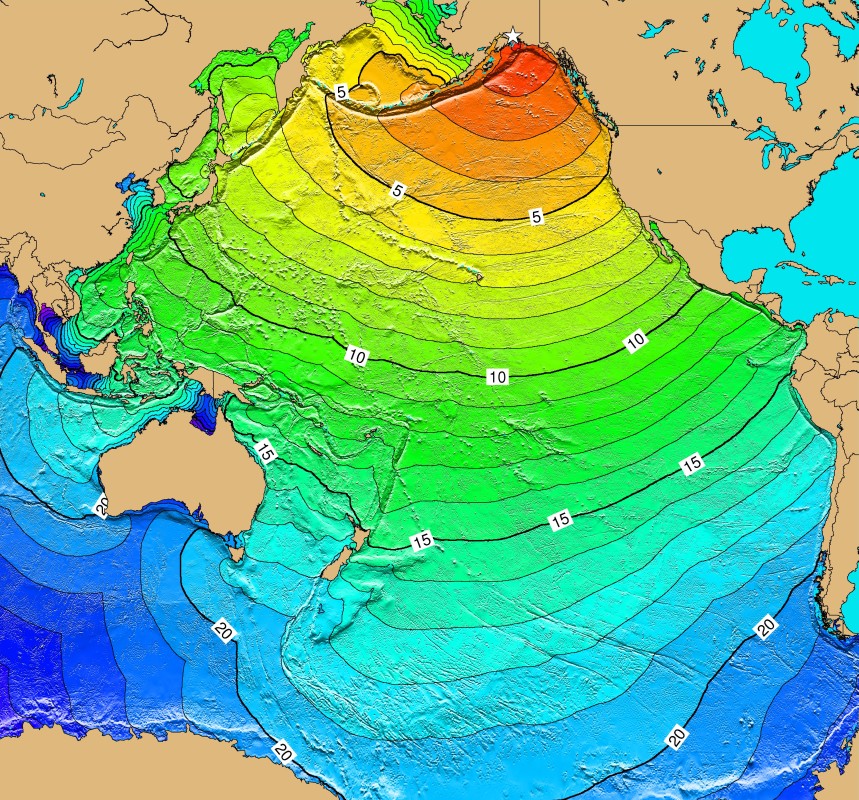
April 1, 1946 Unimak Island, Alaska
Tsunami travel time map for the April 1, 1946 Pacific-wide tsunami caused by an earthquake south of Unimak Island, Alaska.
The April 1, 1946 Pacific-wide tsunami was caused by a magnitude 7.3 Ms earthquake that occurred south of Unimak Island, Alaska. Hawaii experienced the worst damage, with 159 deaths (96 at Hilo) and $26 million in property loss. Total property damage in Alaska was $250,000 while California experienced one death and $10,000 damage from the tsunami. These events led to the development of tsunami travel time charts for the Pacific and the Pacific Tsunami Warning Service.
Unimak Island, Alaska Tsunami Event Details
December 20, 1946 Honshu, Japan
A catastrophic magnitude 8.1 Mw earthquake on December 20, 1946 on the south coast of Honshu, Japan was felt in the central and western parts of the country. The number of homes destroyed directly by the earthquake was 2,598; 1,443 people died. In addition, 1,451 homes were washed away by the ensuing tsunami waves. The tsunami was observed on tide gauges in California, Hawaii and Peru.
Honshu, Japan Tsunami Event Details
March 4, 1952 Hokkaido, Japan
The magnitude 8.1 Mw earthquake and tsunami on March 4, 1952 off the coast of Hokkaido, Japan, did major damage in Japan. 815 homes were completely destroyed, 1,324 were partially destroyed, 6,395 were slightly damaged, 14 were burned, 91 were washed away, 328 homes and 1,621 non-residential buildings were flooded. Many ships were destroyed, and roads and railway lines were damaged. Twenty-eight people died, 5 people were missing and 287 people were injured in Japan. The tsunami was observed on tide gauges in Hawaii, the west coast of the United States, Alaska, Peru, the Marshall Islands, and Palau.
Hokkaido, Japan Tsunami Event Details
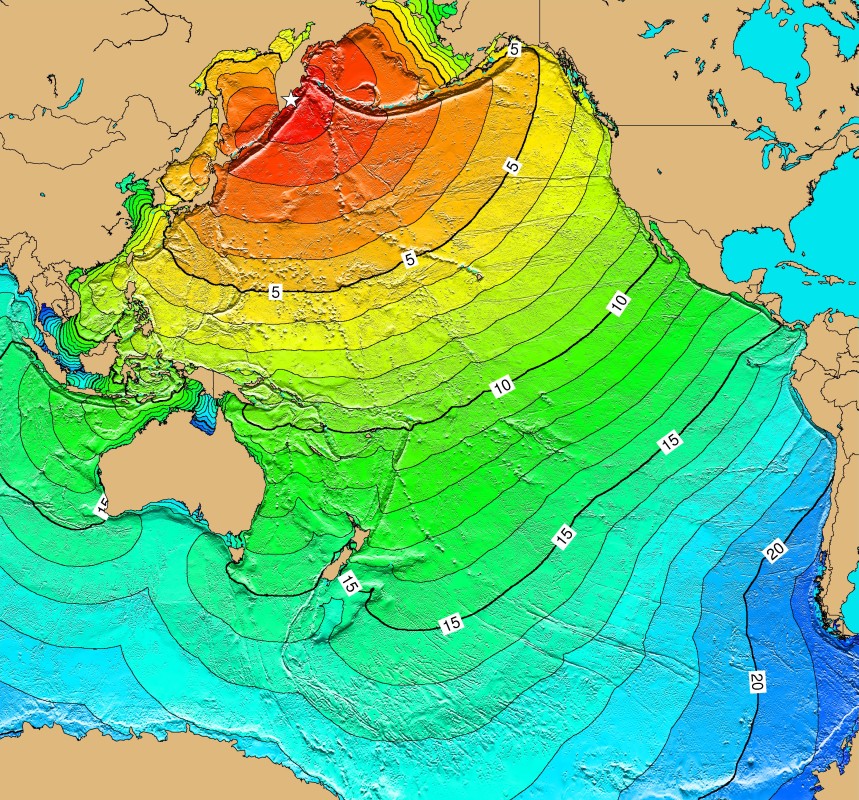
November 4, 1952 Kamchatka, Russia
The magnitude 9.0 Mw earthquake on November 4, 1952 off the east coast of Kamchatka generated a 13-meter wave locally. The waves struck the Hawaiian Islands at 1:00 pm. Property damage from these waves in the Hawaiian Islands was estimated at $800,000 to $1,000,000; however no lives were lost. It also caused damage on the west coast of the United States and was observed on tide gauges throughout the Pacific Basin.
Kamchatka, Russia Tsunami Event Details
March 9, 1957 Aleutian Islands, Alaska
The magnitude 9.1 Mw earthquake on March 9, 1957 south of the Andreanof and Aleutian Islands, generated a tsunami that did severe damage on Adak Island. However, the most damage, approximately $5 million, was in the Hawaiian Islands. There were two indirect fatalities, a reporter and a pilot, and injury to a photographer when their small chartered plane crashed in the ocean near Oahu.
Aleutian Islands, Alaska< Tsunami Event Details
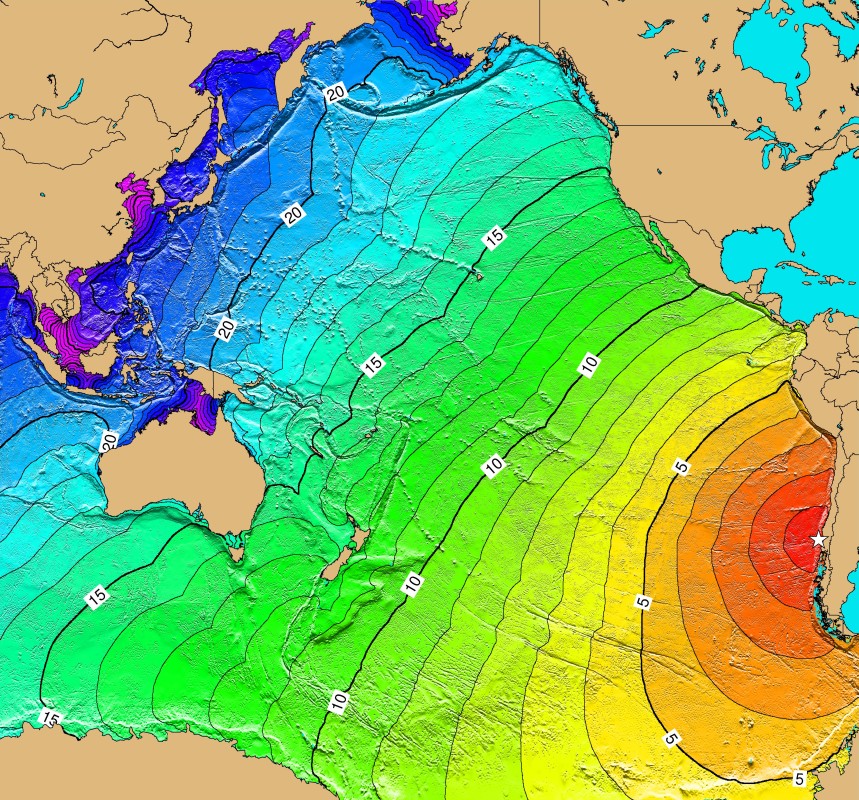
May 22, 1960 Southern Chile
On May 22, 1960 a Magnitude 9.5 Mw earthquake, the largest earthquake ever instrumentally recorded, occurred in southern Chile. The series of earthquakes that followed ravaged southern Chile. Over a period of days earthquakes ruptured a 1,000 km section of the fault. The number of fatalities associated with both the earthquake and tsunami was estimated to be between 490 and 5,700. Reportedly there were 3,000 injured and initially there were 717 missing in Chile. The main shock generated a tsunami that was not only destructive along the coast of Chile, but was noticed along shorelines throughout the Pacific Ocean area.
Southern Chile Tsunami Event Details
March 28, 1964 Prince William Sound, Alaska
This magnitude 9.2 Mw earthquake and ensuing tsunami caused 125 deaths and $311 million in property loss ($84 million and 106 deaths in Alaska). It was felt over a large area of Alaska and in parts of western Yukon Territory and British Columbia. Its effects were heaviest in south central Alaska. The duration of the shock was estimated at 3 minutes. Vertical displacement occurred over 525,000 sq km. An estimated 20 landslide tsunamis were generated. The tectonic tsunami devastated many towns along the Gulf of Alaska, left serious damage in British Columbia, Hawaii, and along the west coast of the U.S. (15 killed). It was recorded on tide gauges in Cuba and Puerto Rico.
Prince William Sound, Alaska Tsunami Event Details
May 16, 1968 Honshu, Japan
A magnitude 8.2 Mw earthquake on May 16, 1968 off the coast of Honshu Island caused destruction in Japan and generated a tsunami that was observed by tide gauges in Japan and throughout the Pacific Basin. As a result of the earthquake and tsunami, 52 people died and 329 people were injured; 676 homes were completely destroyed and 2,994 homes were partially destroyed; 13 homes burned down and 529 homes were flooded; 97 ships were washed away and 30 were sunk. In addition, roads, bridges and protective dikes were destroyed.
Honshu, Japan Tsunami Event Details
November 29, 1975 Hawaii
On November 29, 1975 a magnitude 7.2 Ms earthquake on the southern coast of the Island of Hawaii generated a locally damaging submarine landslide tsunami that was recorded at tide gauge stations in Alaska, California, Hawaii, Japan, Galapagos Islands, Peru, and Chile. The tsunami caused $1.5 million damage in Hawaii, 2 deaths, and 19 injuries.
1975 Hawaii Tsunami Event Details
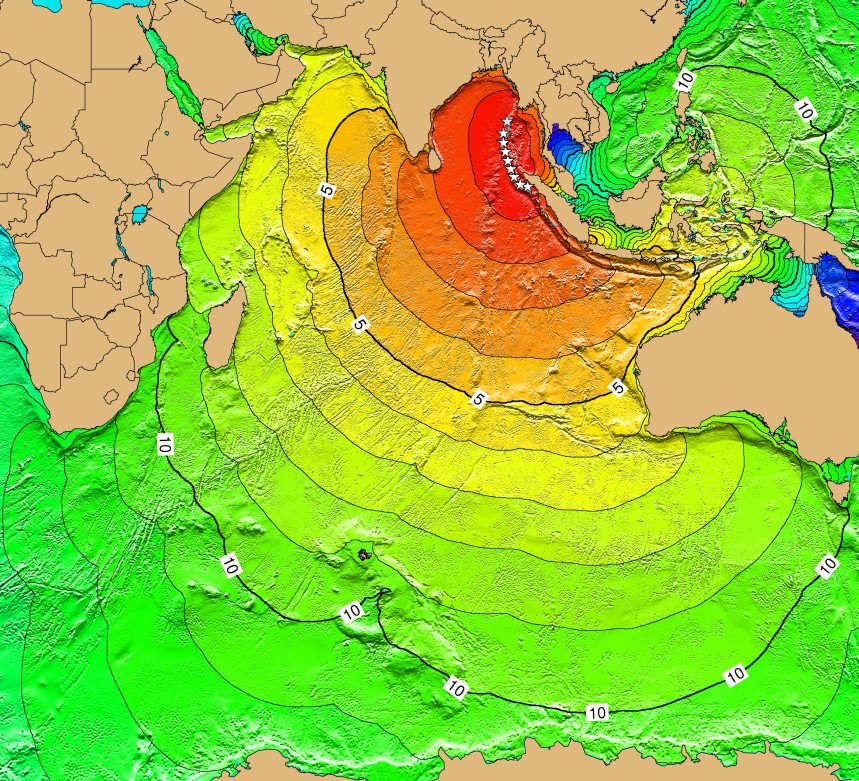
One-hour Tsunami Travel Times for Simulated Seismic Zones in the Indian Ocean
1 hour Tsunami travel time map for the Indian Ocean seismic zones; 1 hour Tsunami travel time map for the Makran Coast seismic zone; 1 hour Tsunami travel time map for the Sumatra-Andaman coast seismic zone
These maps were generated by the Pacific Warning Center using Paul Wessel's TTT software. The first image shows one-hour travel times from simulated seismic zones off the Makran and Sumatra-Andaman coasts, Indian Ocean. A 100-kilometer distance around the seismic zones is shown on the map as a dashed line. The other two images show details of the two areas.


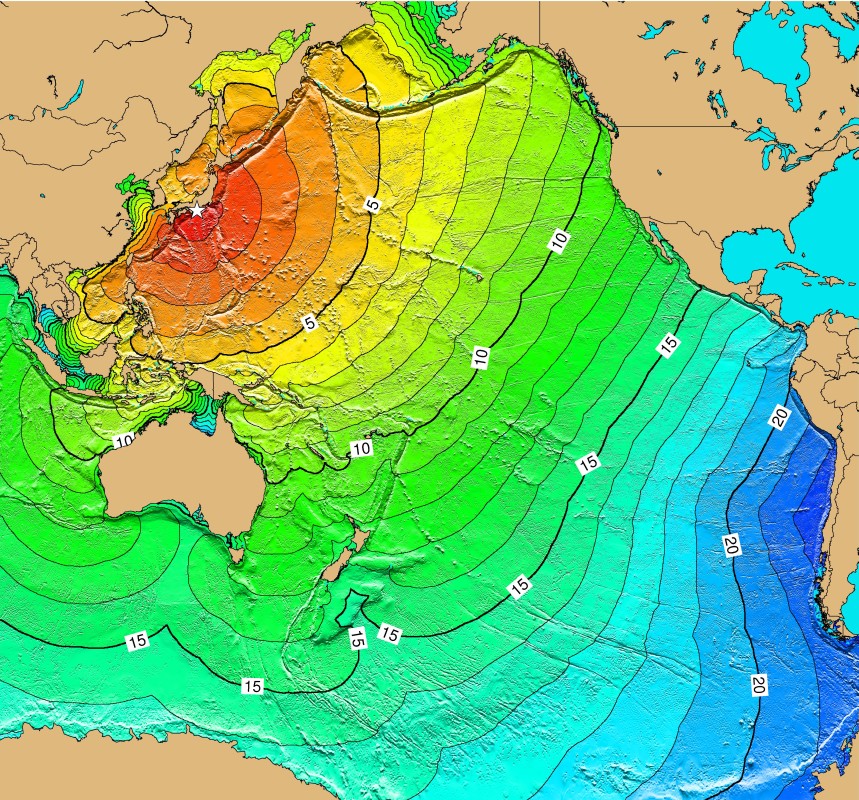
Off the coast of central Chile
Tsunami travel time map for a hypothetical earthquake off the coast of central Chile
Travel time map for a hypothetical magnitude 9.2 earthquake off the coast of central Chile at 30oS, 72oW. This scenario was used for the Pacific-wide Tsunami Drill Exercise Pacific Wave that took place May 16-17 2006.

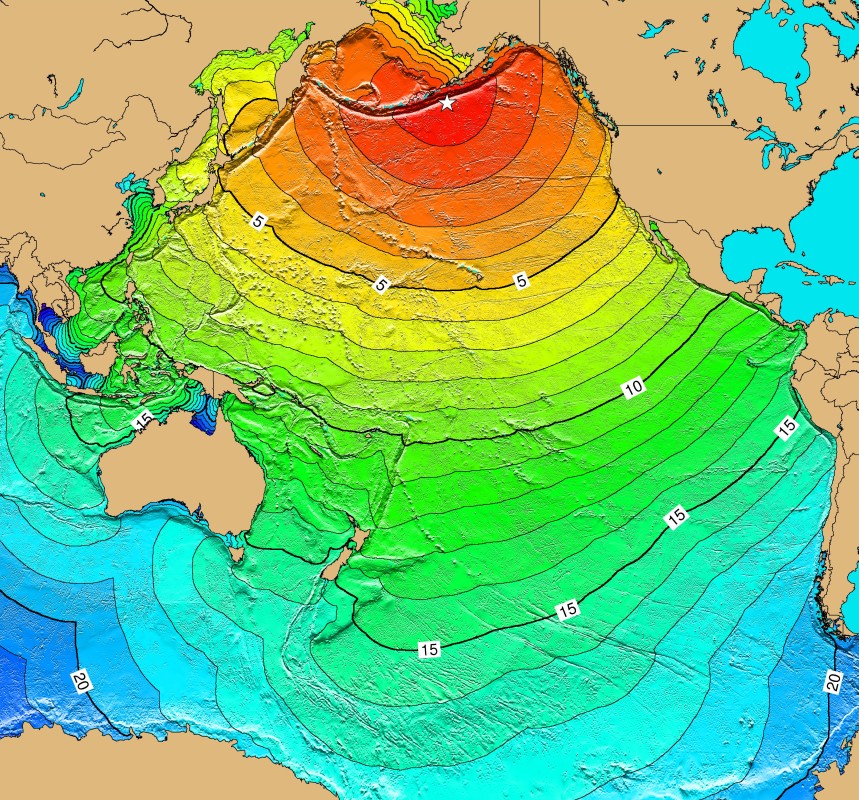
North of the Philippines
Tsunami travel time map for a hypothetical earthquake north of the Philippines
Travel time map for a hypothetical magnitude 8.8 earthquake north of the Philippines at 20oN, 120oE. This scenario was used for the Pacific-wide Tsunami Drill Exercise Pacific Wave '06 that took place 16-17 May 2006.

Tsunami Travel Time Software
Maps were generated using Tsunami Travel Times (TTT) software developed by Paul Wessel, Geoware. TTT software calculates first-arrival travel times on a grid for a tsunami generated at a given earthquake epicenter or coastal location. The technique to compute travel times is an application of Huygen's Principle. It states that all points on a wavefront are point sources for secondary spherical waves. Minimum travel times are computed over the grid starting at the point of interest (e.g. earthquake epicenter). From the starting point, times are computed to all surrounding points. The grid point with minimum time is then taken as the next starting point, and times are computed from there to all surrounding points. The starting point is continually moved to the point with minimum total travel time until all grid points have been evaluated. This technique is explained in Shokin, et al., 1987, Calculations of tsunami travel time charts in the Pacific Ocean, Science of Tsunami Hazards, vol. 5, p. 85-113.
Caveat
Maps do not provide information on the height or the strength of the wave, only the arrival times. There are several situations in which the estimated arrival times may not match observed arrival times of the tsunami waves, including but not limited to the following:
- Bathymetry is not accurate in the vicinity of the epicenter.
- Epicenter is not well located, or the origin time is uncertain.
- Epicenter is on land and a pseudo-epicenter off the coast must be selected.
- Bathymetry is not accurate in the vicinity of the reporting station.
- Nonlinear propagation effects may be important in shallow water.
- Observed travel times do not represent the first wave but instead are later arrivals.


