
NCEI is the long-term archive for all NOAA coastal tide gauge data: 1-minute water level data from the NOAA/National Ocean Service (NOS) Center for Operational Oceanographic Products and Services (CO-OPS) and high-resolution (10-second or 15-second) water level data from the Pacific Tsunami Warning Center (PTWC) and the National Tsunami Warning Center (NTWC). Coastal tide gauge data also undergo quality control and harmonic analysis at NCEI. The raw data and products are discoverable via the Map, Timelines, and THREDDS Data Server links. Data are provided as netCDF and as gzipped comma-separated-values (CSV).
Please contact haz.info@noaa.gov if you have questions.

Access Methods
- Search Analog Data by FORM
- Search Analog Data by MAP
- Search Digital Data by MAP
- Search Digital Data by TIMELINE
- Access Data via THREDDS Data Server
- Tsunami Warning Center Water Level Data Extract Service
- Recent Event-Specific Tide Gauge Data
Citations
CO-OPS 1-minute Water Level Data
Cite as: Center for Operational Oceanographic Products and Services (CO-OPS) (2007): CO-OPS 1-minute Tsunami Water Level Data. NOAA National Centers for Environmental Information. CO-OPS 1-minute Tsunami Water Level Data [access date].
NTWC 15-second Water Level Data
Cite as: National Tsunami Warning Center (NTWC). 2016. Water Level Data from National Tsunami Warning Center Tide Gauges in Alaska and California. NOAA National Centers for Environmental Information. Water Level Data from National Tsunami Warning Center Tide Gauges in Alaska and California. Accessed [date].
PTWC 10-second Water Level Data
Cite as: Pacific Tsunami Warning Center (PTWC). 2018. Water Level Data from Pacific Tsunami Warning Center Tide Gauges in Hawaii. NOAA National Centers for Environmental Information. Water Level Data from Pacific Tsunami Warning Center Tide Gauges in Hawaii4. Accessed [date].
NOAA Real Time Data And Operators
- U.S. Tsunami Warning Centers (NTWC and PTWC)
- NOS/CO-OPS Tsunami Capable Tide Stations
- NWS/NDBC DART® Ocean Bottom Pressure Data
Joint Archive for Sea Level Real Time Data And Operators
Non-NOAA Real Time Data And Operators
Water Level Data in Support of Tsunami Research
In 2007, CO-OPS completed upgrades on tide stations in Alaska, the Pacific Islands, the West Coast, and the Caribbean. The upgraded tide stations are equipped with hardware and software to enable the collection and dissemination of 1-minute water level data. Access 1-minute data from the CO-OPS site.
Tide gauge data undergo quality control and harmonic analysis at NCEI. The raw data and products are discoverable via the Map, Timelines, and THREDDS Data Server links. Data are provided as netCDF and as gzipped comma-separated-values (CSV). Please contact haz.info@noaa.gov if you have questions.
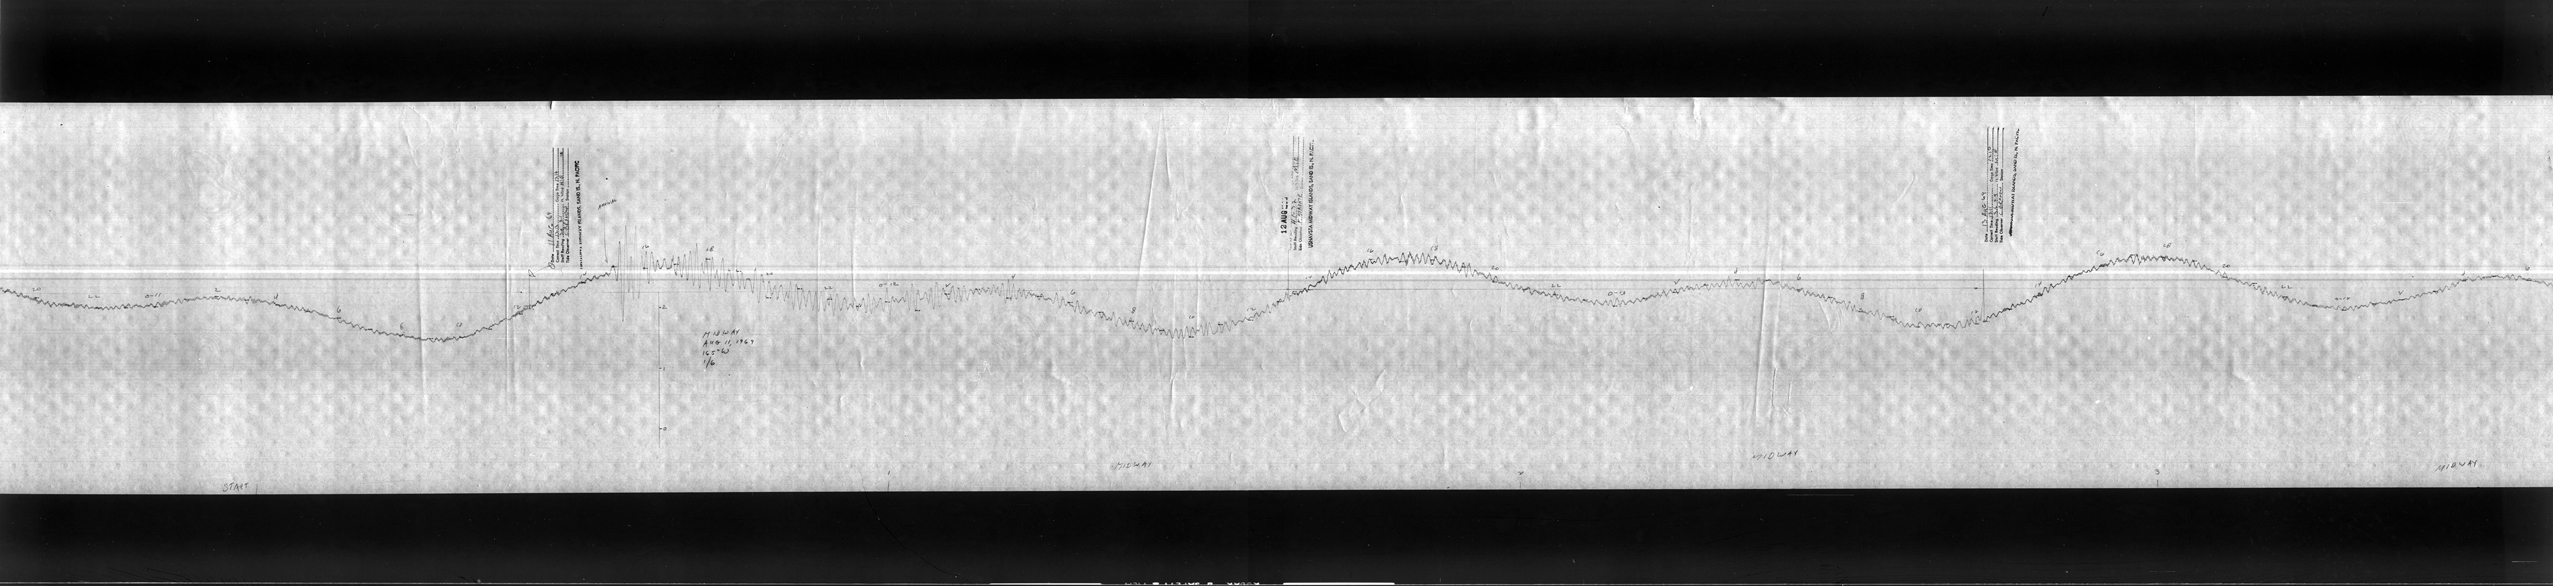
Analog Tide Gauge Records (Marigrams)
The analog marigram (tide gauge record) collection contains more than 3,000 tsunami marigram records in both image and paper format, capturing worldwide observations of more than 390 tsunami events from 1854 to 1994. The majority of these tsunami marigram records were scanned from microfiche to high-resolution digital TIFF images during the NOAA Climate Data Modernization Program (CDMP). For many tsunami events prior to 1994, data resides only on the marigram records, making them of great historical significance. The Big Earth Data Initiative (BEDI) supplied funding in 2017 and 2018 to digitize marigrams (produce digital time-series in netCDF and CSV formats) from nine tsunami events.
An example of a scanned marigram image (Low resolution) shows a run-up detected at a Midway Island station from the magnitude 8.2 earthquake that occurred 90 km southeast of Shikotan Island on October 1, 1969. For many of the marigrams, digital data points will not be possible due to the quality of the analog data.


