
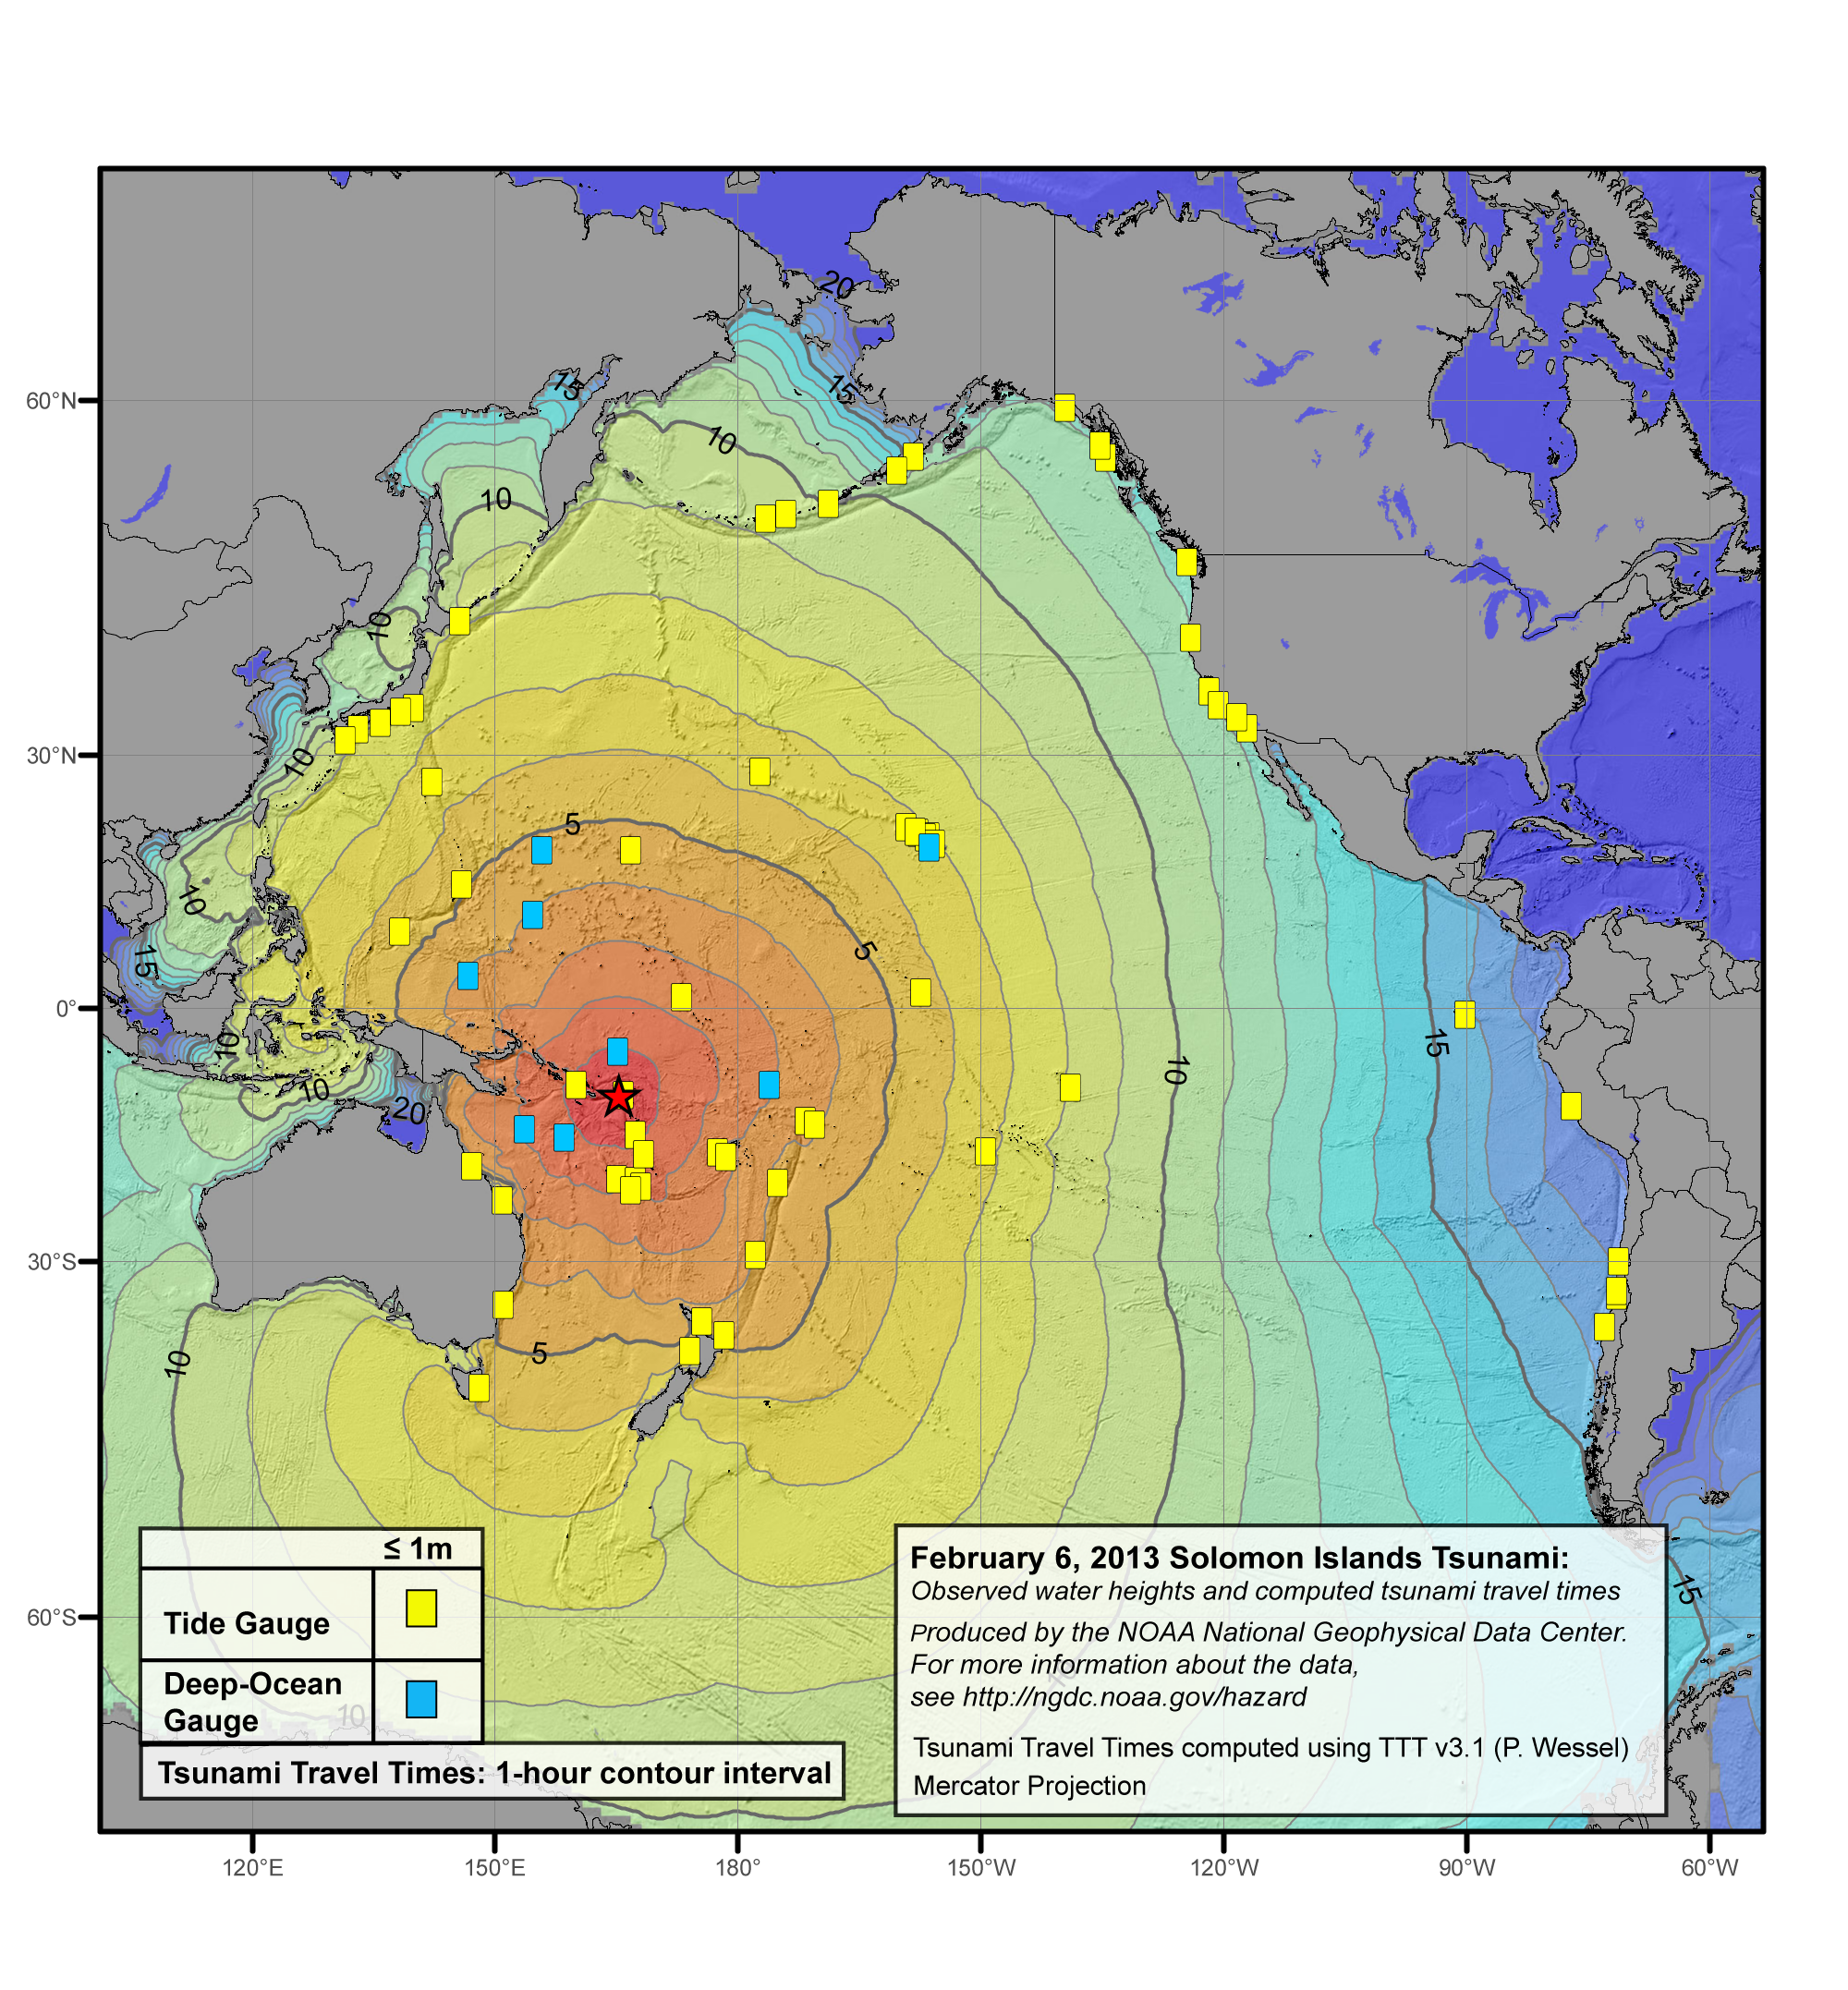
On 2013/02/06 near Santa Cruz Island, Solomon Islands group (10.738°S, 165.138°E) at 01:12:27 (UTC), a magnitude 8.0 earthquake occurred.
This page provides data from the Deep-ocean Assessment and Reporting of Tsunami (DART®) buoys and processed NOAA/NOS/CO-OPS coastal tide-gauge stations. Files contain raw observations, fitted tidal components, and residual tide values. There are 2 types of DART® data:
- 15-sec values as recorded by the Bottom Pressure Recorder (BPR)
- Real-time water level data as recorded by the Bottom Pressure Recorder (BPR) in extended-reporting mode containing measurement types of 15 minutes, 1 minute, and 15 seconds. Real-time data were extracted from the National Data Buoy Center.
In support of national tsunami warning and mitigation efforts NOAA/NOS/CO-OPS upgraded selected stations from the National Water Level Observation Network (NWLON) to enable collection and dissemination of 1-minute water level sample data. These data are archived and processed at NCEI. We also provide the computed tides and details on the harmonic tidal analysis results.
DART® source 15-sec data are in pounds per square inch absolute [psia], the tidal analysis is performed on those data. DART® real-time data are processed in PSIA to be compatible with the data from previous deployments. All DART® tsunami event data as observations, fitted tides and residuals are provided here in meters water column using conversion factor of 670.0 mm of water/PSIA. All coastal tide-gauge data are provided in meters.
Data Access
More Information
Data Tables
The dropdown sections below contain data tables for different DART and Tide Gauge individual data files under "Data" column. The columns in those files are as follows: Time is in Julian days from the beginning of the year, Year, Month, Day, Hours, Minutes, Seconds, Raw Observations, Fitted tidal component, and computed residuals in meters water column. We also provide details on the harmonic analysis results under column Tide.
| Station number | Station name and location | Latitude [deg] | Longitud [deg] | Data [m] | Tides |
|---|---|---|---|---|---|
| 51407 | SE of Honolulu | 19.6169 | -156.5106 | * | * |
| 51425 | American Samoa | -9.5044 | -176.2297 | * | * |
| 52401 | NE of Saipan | 19.2547 | 155.7619 | * | * |
| 52402 | NE of Kwajalein | 11.883 | 154.11 | * | * |
| 52403 | SW of Turk Lagoon | 5.0000 | 145.5970 | * | * |
| 52406 | NE of Guadalcanal | -5.2950 | 165.0120 | * | * |
| 55012 | Coral Sea | -15.7990 | 158.4000 | * | * |
| 55013 | Tasman Sea | -46.6650 | 161.0100 | * | * |
| 55023 | Coral Sea | -14.8000 | 153.5800 | * | * |
| Station number | Station name and location | Latitude [deg] | Longitud [deg] | Data [m] | Tides |
|---|---|---|---|---|---|
| 1612340 | Nawiliwili, Hi | 21.9544 | -159.3561 | * | * |
| 1612340 | Honolulu, Hi | 21.3067 | -157.8670 | * | * |
| 1612480 | Makuoloe, Hi | 21.4331 | -157.7900 | * | * |
| 1615680 | Kahului Harbor | 20.8950 | --156.4767 | * | * |
| 1617433 | Kawaihae, Hi | 20.0366 | -155.8294 | * | * |
| 1619910 | Sand I., Midway | 28.2117 | -177.3600 | * | * |
| 1630000 | Apra, Guam | 13.4387 | 144.6539 | * | * |
| 1770000 | PagoPago, A. Samoa | -14.2800 | -170.6900 | * | * |
| 1820000 | Kwajalein, Marshalls | 8.7316 | 167.7362 | * | * |
| 1890000 | Wake Island | 19.2900 | 166.6180 | * | * |
| Station number | Station name and location | Latitude [deg] | Longitud [deg] | Data [m] | Tides |
|---|---|---|---|---|---|
| 9451600 | Sitka | 57.0517 | -135.3420 | * | * |
| 9453220 | Yakutat | 59.5485 | -139.7334 | * | * |
| 9455090 | Seaward | 60.1200 | -149.4267 | * | * |
| 9457292 | Kodiak | 57.7317 | -152.5120 | * | * |
| 9457804 | Alitak | 56.8983 | -154.2470 | * | * |
| 9459450 | Sand Point | 55.3367 | -160.5020 | * | * |
| 9459881 | King Cove | 55.0617 | -162.3270 | * | * |
| 9461380 | Adak Island | 51.8633 | -176.6320 | * | * |
| 9461710 | Atka | 52.2317 | -174.1730 | * | * |
| 9462450 | Nokolski | 52.9406 | -168.8713 | * | * |