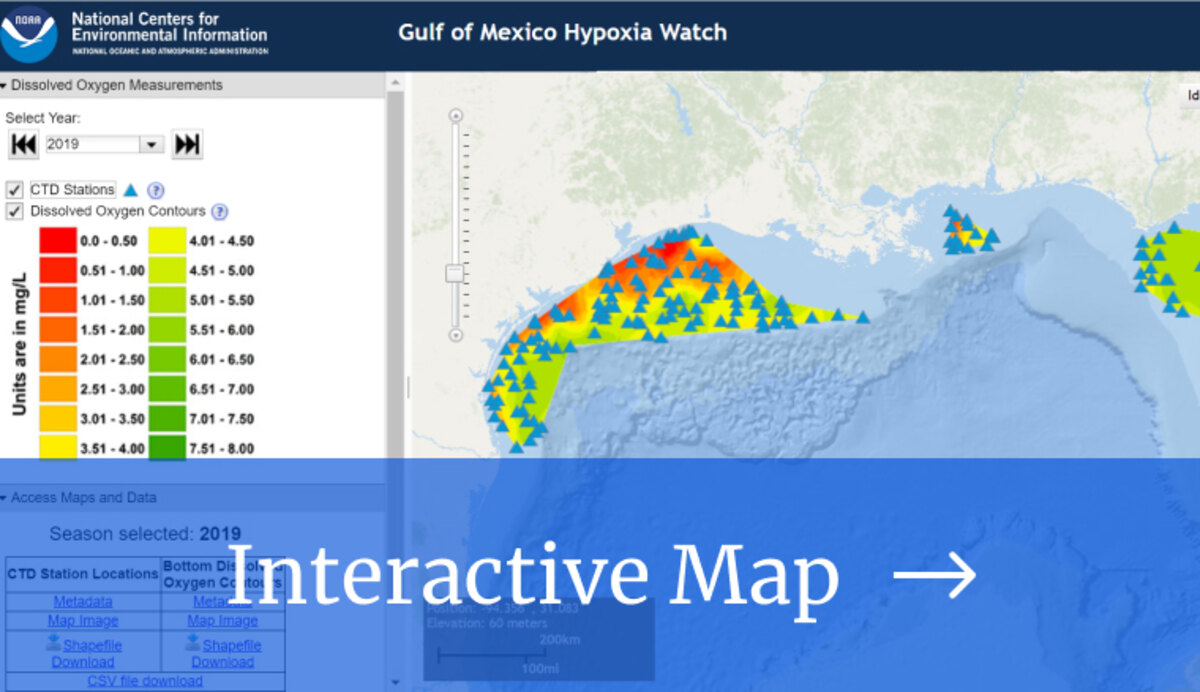
The Gulf of Mexico Hypoxia Watch maps near real-time bottom dissolved oxygen data to monitor hypoxic conditions in the Gulf of Mexico. Data is collected during the NOAA Fisheries annual Summer Groundfish Survey, which evaluates the population and health of commercially important shrimp, fish, and other marine organisms relative to environmental conditions in the Gulf as part of the Southeast Area Monitoring and Assessment Program (SEAMAP), a federal, state, and university cooperative. Oxygen data from the survey are used to generate products that provide updates on hypoxic conditions in the Gulf.
Resources
Archived Data
What is Hypoxia?
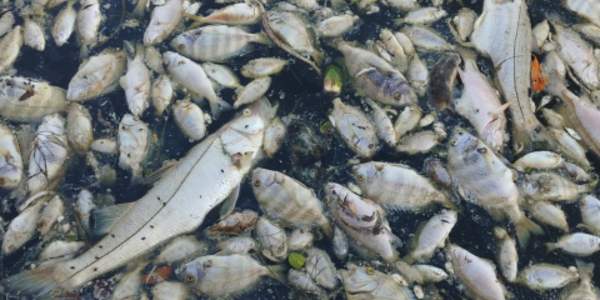
Hypoxia occurs when oxygen levels in a body of water become too low to support marine life. It is typically associated with high levels of nutrient runoff that stimulate an overgrowth of algae that, when they die, sink to the bottom and decompose and lead to oxygen depletion in bottom waters. Hypoxia can devastate aquatic ecosystems by driving away fish, invertebrates, and mammals, and killing or weakening organisms that can’t relocate quickly.
How frequent is Hypoxia?
The largest hypoxic zone in U.S. coastal waters—and second largest in the world—is located in the northern Gulf of Mexico on the Louisiana/Mississippi continental shelf, impacting an area about the size of the state of New Jersey. While hypoxia can occur naturally, there is strong evidence that nutrient pollution caused by runoff from industry and agriculture within the Mississippi River watershed significantly contribute to its presence in the Gulf.
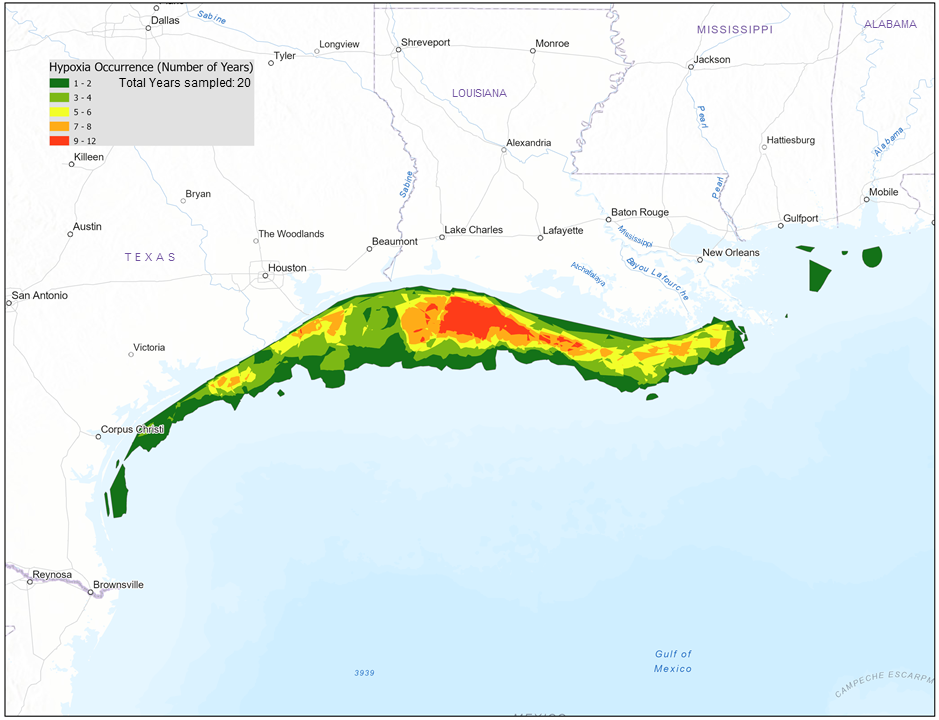
The westward moving currents in the Gulf of Mexico cause the hypoxic zone to occur more frequently west of the Mississippi River outflow, commonly referred to as the “Dead Zone”, as shown below. While hypoxic waters can develop anywhere under the right conditions (i.e. green areas of the map), monitoring efforts are focused to the west of the Mississippi/Atchafalaya River outflows as they more frequently experience hypoxia (i.e. red areas of the map). Hypoxic waters do occur to the east of the Mississippi though and are dominated by other freshwater inputs to the Gulf (i.e. Mobile Bay).
Resources
- The Problem of Hypoxia in the Northern Gulf of Mexico
- The Causes of Hypoxia in the Northern Gulf of Mexico
- Hypoxia Watch Handout
- Gulf of Mexico Hypoxia Monitoring Implementation Plan
- Hypoxia Task Force 2019 Report to Congress
- NOAA's National Ocean Service: Hypoxia in the Gulf of Mexico
- Louisiana Universities Marine Consortium (LUMCON) Hypoxia Research
- Texas Automated Buoy System (TABS) Hourly 3-day Dissolved Oxygen Forecast
Organizations
About the Survey
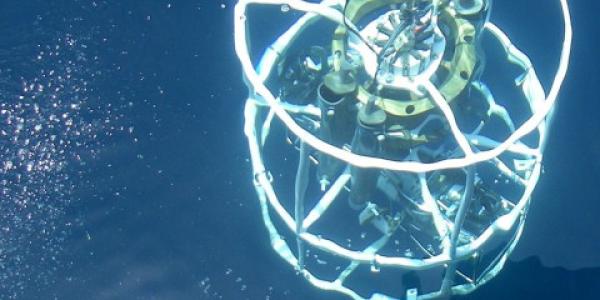
This predetermined, stratified random survey samples fish and invertebrates using trawls or bongo and neuston nets, and deploys an environmental profiler to measure water temperature, conductivity, dissolved oxygen, fluorescence, and transmittance continuously from the surface to the sea floor. Samples and data are collected from stations located east of the Mississippi River and in the area between the 10 and 200 m isobaths from Brownsville, Texas eastward to the Florida Panhandle.
Due to COVID-19 restrictions, the Summer Groundfish Cruise did not sail in 2020. In 2022, the Oregon II was not in operation.
Current Cruise Details
Last Update: April 30, 2024
CRUISE SCHEDULE UPDATE
| Leg 1: Pascagoula, MS to Galveston, TX | |
|---|---|
| CTD Data Acquisition | Planned Map Release |
| June 1 - 5 | June 7 |
| June 6 - 10 | June 12 |
| June 11 - 15 | June 17 |
| Leg 2: Galveston, TX to Pascagoula, MS | |
|---|---|
| CTD Data Acquisition | Planned Map Release |
| June 18 - 20 | June 21 |
| June 21 - 24 | June 25 |
| June 25 - 28 | July 1 |
| June 29 – July 2 | July 4 |
| Leg 3: Pascagoula, MS to Pascagoula, MS | |
|---|---|
| CTD Data Acquisition | Planned Map Release |
| July 6 - 9 | July 10 |
| July 10 - 13 | July 15 |
| July 14 - 16 | July 18 |

