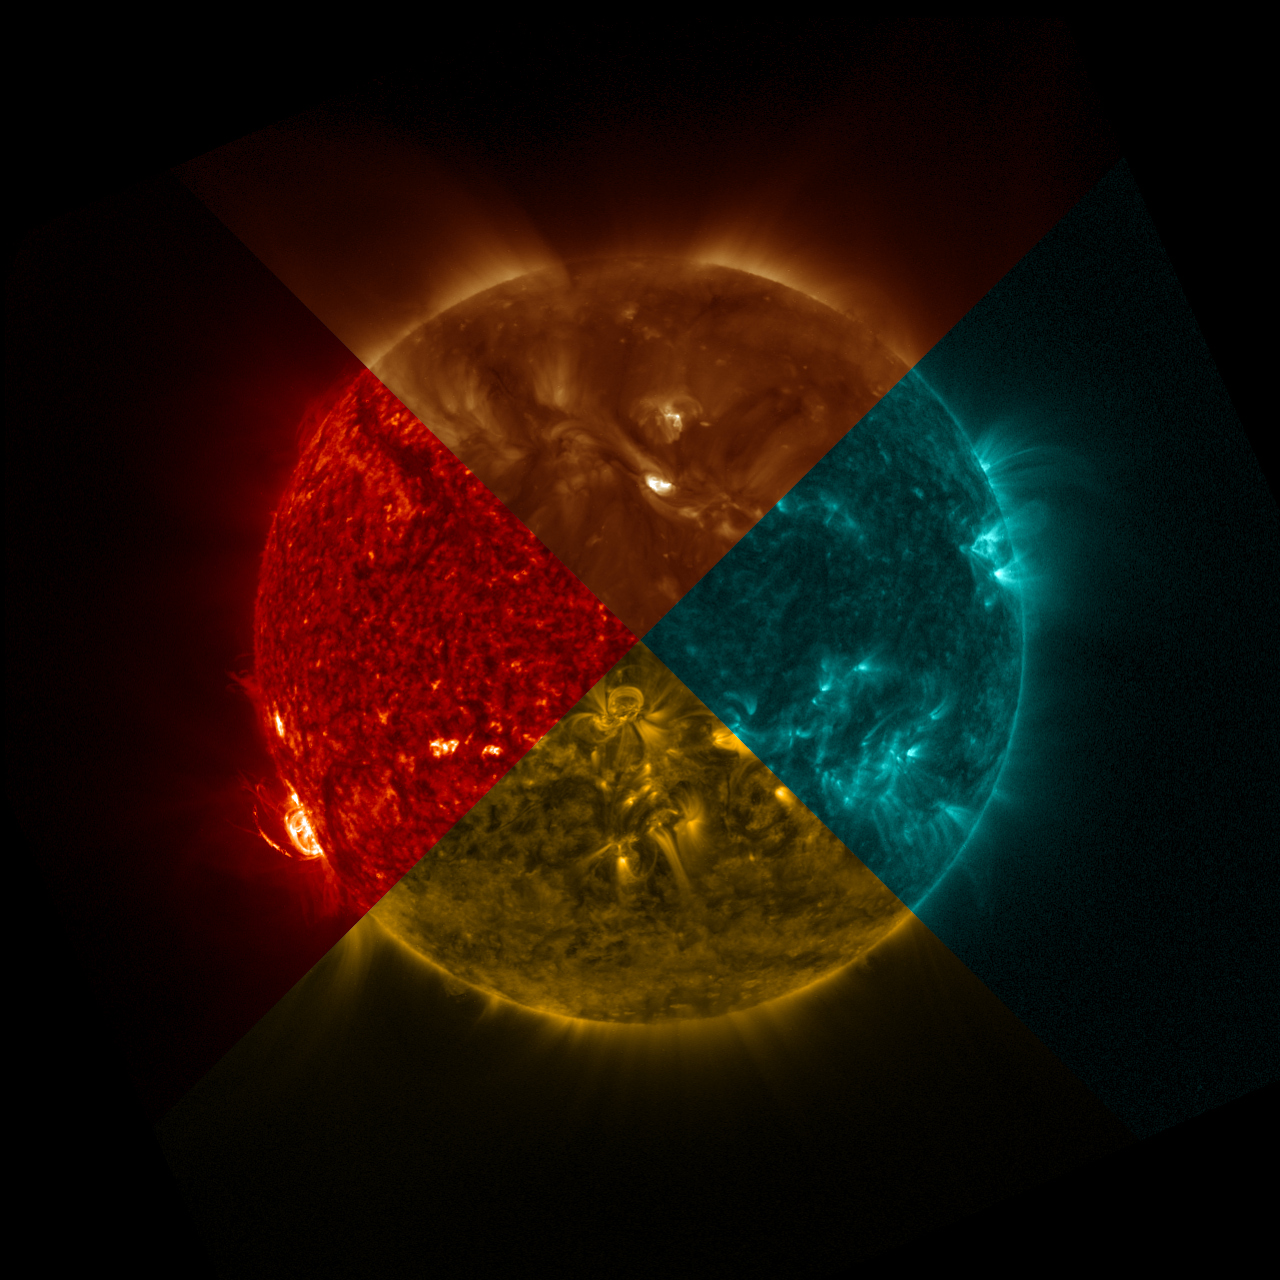
The GOES-R Solar Ultraviolet Imagers (SUVI) creates images of the solar corona at six different extreme ultraviolet wavelengths: 94 A, 131 A, 171 A, 195 A, 284 A, and 304 A. Each SUVI image channel is selected to observe different plasma conditions within the solar corona. When combined, SUVI imagery can provide space weather forecasters with advanced warning for high-speed solar winds or the potential for energetic solar flares or coronal mass ejections.
Learn more about the GOES-R SUVI instrument and

Product Details
The Level-1b data are fully calibrated, full resolution data in physical units. Level-2 data are higher order data products that vary by instrument. Python Example codes provide syntax to download multiple files and to some of the data products in Python.
| Product | SUVI L1b Satellite Data | Observation Interval | Product Description | |
|---|---|---|---|---|
| SUVI L1b Solar Imagery: EUV | 10 Seconds |
Solar images at six wavelengths and multiple radiance level ranges in support of viewing the sun during different types of solar activity. Image exposures are 10 msec or 1 sec. |
||
| Product Name | SUVI L2 Satellite Data | Product Description | |
|---|---|---|---|
| High Dynamic Range (HDR) Images | HDR images of the solar disk assembled from six different SUVI wavelengths | ||
| Thematic Maps | Color-coded images that identify flares, bright regions, coronal holes, and other solar features | ||
|
Bright Regions
|
Reports on bright/active regions | ||
| Flare Locations | Reports on solar flares | ||
| Coronal Hole Boundaries | Shape files for coronal hole boundaries |
Special Event Data
SUVI Extended Coronal Imaging Data
Mosaic images of the extended solar corona from GOES-17 SUVI special observing campaigns are available for August-September 2018, August-December 2019, and April 2021. GOES-18 data is now also available for July-September 2022.
September 2017 Solar Flares
The GOES-16 Solar Ultraviolet Imager (SUVI) captured images of a series of flares in Sept. 2017. At this time, the instrument was still in Beta status. NCEI reprocessed Level 0 data to create Level 1b images. These files are organized by SUVI wavelength, for instance, Fe195 images (see this solar flare movie here). L2 composites were also generated for this solar flare event. These L2 data are provisional and will be replaced in the future.
SUVI Documentation
L1b Read Me
L2 Read Me
- GOES-16 SUVI L2 Composite Images ReadMe
- GOES-18 SUVI L2 Composite Images ReadMe
- GOES-16 SUVI L2 Thematic Maps ReadMe
- GOES-18 SUVI L2 Thematic Maps ReadMe
- GOES-16 SUVI L2 Bright Regions ReadMe
- GOES-18 SUVI L2 Bright Regions ReadMe
- GOES-16 SUVI L2 Flare Locations ReadMe
- GOES-18 SUVI L2 Flare Locations ReadMe
- GOES-16 SUVI L2 Coronal Hole Boundaries ReadMe
- GOES-18 SUVI L2 Coronal Hole Boundaries ReadMe


