
There are numerous indices of magnetic activity. The International Association of Geomagnetism and Aeronomy (IAGA) officially recognizes magnetic indices aa, Am, Kp, Dst, and AE. More information about the IAGA indices is available from the International Services for Geomagnetic Indices (ISGI).
Data Access
About
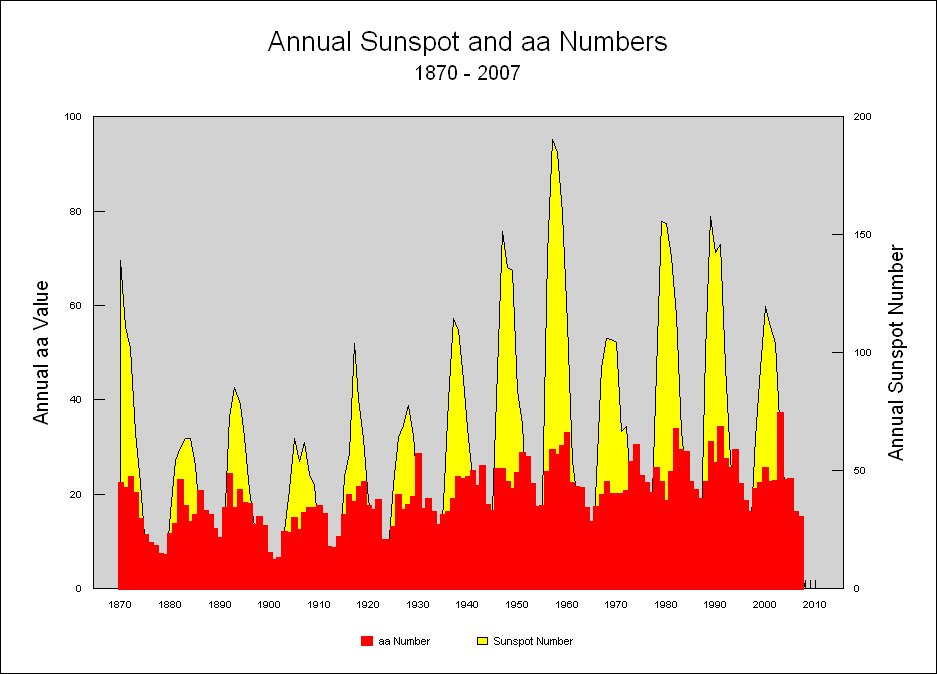
A simple global index of magnetic activity is produced in France from the K indices of two nearly antipodal magnetic observatories in England and Australia. This index aa, is the 3-hourly equivalent amplitude antipodal index. Daily average AA may be derived similarly to Ap. An historical advantage to using aa rather than ap is that these indices have been extended back in time through scaling of magnetic activity from magnetograms of earlier observations. The aa indices are derived from 1868 to 2010. An AA* index has been derived that is the counterpart of Ap* but is available for a longer span of years. However, the AA* is derived from indices from only two magnetic observatories whereas Ap* incorporates indices from more observatories.
Because of the difference in units of presentation, the values of AA* and Ap* are not the same so that different major magnetic storm onset and end threshold values are used for the two series. However their comparison for the years of overlapping coverage show that relative frequency of occurrence of major storms per year are similar. Another reason for differences is that an index derived from magnetic perturbation values at only two observatories easily experiences larger extreme values if either input site is well situated to the overhead ionospheric and.or field aligned current systems producing the magnetic storm effects. Although not documented here, it is interesting to note that the overall level of magnetic disturbance from year to year has increased substantially from a low around 1900 Also, the level of mean yearly aa is now much higher so that a year of minimum magnetic disturbances now is typically more disturbed than years at maximum disturbance levels before 1900.
The Auroral Electrojet Index, AE, is designed to provide a global, quantitative measure of auroral zone magnetic activity produced by enhanced Ionospheric currents flowing below and within the auroral oval. Ideally, It is the total range of deviation at an instant of time from quiet day values of the horizontal magnetic field (h) around the auroral oval. Defined and developed by Davis and Sugiura [1966], AE has been usefully employed both qualitatively and quantitatively as a correlative index in studies of substorm morphology, the behavior of communication satellites, radio propagation, radio scintillation, and the coupling between the interplanetary magnetic field and the earth's magnetosphere. For these varied uses, AE possesses advantages over other geomagnetic indices or at least shares their advantageous properties:
- It can be derived on an instantaneous basis or from averages of variations computed over any selected interval
- It is a quantitative index which, in general, is directly related to the processes producing the observed magnetic variations
- Its method of derivation is relatively simple, digital, and objective and is well suited to present computer processing techniques
- It may be used to study either individual events of statistical aggregates
These indices were and are derived in response to indications of need as voiced by the scientific user community in journal articles, at meetings in resolutions of national and international groups, and in personal communications.
Data Access
About
Ap* is defined as the earliest occurring maximum 24-hour value obtained by computing an 8-point running average of successive 3-hour ap indices during a geomagnetic storm event without regard to the starting and ending times of the UT-day. It is uniquely associated with the storm event. Over many years, values of Ap* provide a maximum disturbance measure useful to identify major geomagnetic storms chronologically (by date and start time) and by amplitude from largest to the smallest. The earliest possible values are for 1932, because that is the first year for which the standard Kp and ap indices were produced. As NGDC staff or others have time to update Ap*, tables of values are available from 1932 to recent times.
Data Access
- Geomagnetic Data Indices DST Index (FTP)
- DOS Geomagnetic Utility Programs
- Dst Index Data at the World Data System (DST) For Geomagnetism, Kyoto Observatory
About
The DST index is an index of magnetic activity derived from a network of near-equatorial geomagnetic observatories that measures the intensity of the globally symmetrical equatorial electrojet (the "ring current").
DST (Disturbance Storm Time) equivalent equatorial magnetic disturbance indices are derived from hourly scaling's of low-latitude horizontal magnetic variation. They show the effect of the globally symmetrical westward flowing high altitude equatorial ring current, which causes the "main phase" depression worldwide in the H-component field during large magnetic storms. This diskette contains the hourly indices for the period 1 Jan 1957 through 30 Sep 1992, as derived by M. Sugiura and T. Kamei, WDC-C2 for Geomagnetism, Faculty of Science, Kyoto University, Kyoto 606, Japan.
Hourly H-component magnetic variations are analyzed to remove annual secular change trends from records of a worldwide array of low-latitude observatories. A cosine factor of the site latitude transforms residual variations to their equatorial equivalents and harmonic analysis isolates the term used as the DST index. Sugiura described DST derivation in ANNALS OF THE IGY.
Data Access
About
Partial and symmetric magnetospheric ring currents, magnetopause, neutral sheet and tail currents generate a magnetic disturbance field which is monitored by the global network of magnetic observatories. The dominant axi-symmetric part of this disturbance field is estimated from the recordings at four low-latitude observatories and is distributed by the World Data Centers as the Dst index.
Further separating the disturbance magnetic field into external and induced contributions provides the Est index for the external source field and the Ist index for the internal induced field. (Ref: Maus, Stefan; Weidelt, Peter; Separating the magnetospheric disturbance magnetic field into external and transient internal contributions using a 1D conductivity model of the Earth; Geophys. Res. Lett., Vol. 31, No. 12, L12614)
The physical motivation for this separation is that the time varying magnetospheric fields induce electric currents in the Earth which in turn give rise to a secondary internal field whose strength is roughly one third of the external field. Hence, the disturbance field observed at the Earth's surface is the sum of the external source field and its induced counterpart. If the Earth were an ideal conductor then the two fields would be exactly in phase because currents would be induced in such a way as to prevent any external field from entering into the conductor.
Furthermore, for an ideal conductor the strength of the induced field would be such that its radial component would cancel the radial component of the inducing field everywhere on its surface. For the real Earth, however, the phase lag and amplitude relation between the induced internal and inducing external field depends on the frequency content of the external source field.
Data Access
About
Daily regular magnetic field variation arise from current systems caused by regular solar radiation changes. Other irregular current systems produce magnetic field changes caused by the interaction of the solar wind with the magnetosphere, by the magnetosphere itself, by the interactions between the magnetosphere and ionosphere, and by the ionosphere itself.
Magnetic activity indices were designed to describe variation in the geomagnetic field caused by these irregular current systems.
K, Kp, and ap Indices
The K-index is quasi-logarithmic local index of the 3-hourly range in magnetic activity relative to an assumed quiet-day curve for a single geomagnetic observatory site. First introduced by J. Bartels in 1938, it consists of a single-digit 0 thru 9 for each 3-hour interval of the universal time day (UT).
The planetary 3-hour-range index Kp is the mean standardized K-index from 13 geomagnetic observatories between 44 degrees and 60 degrees northern or southern geomagnetic latitude. The scale is O to 9 expressed in thirds of a unit, e.g. 5- is 4 2/3, 5 is 5 and 5+ is 5 1/3. This planetary index is designed to measure solar particle radiation by its magnetic effects. The 3-hourly ap (equivalent range) index is derived from the Kp index as follows:
Kp = 0o 0+ 1- 1o 1+ 2- 2o 2+ 3- 3o 3+ 4- 4o 4+
ap = 0 2 3 4 5 6 7 9 12 15 18 22 27 32
Kp = 5- 5o 5+ 6- 6o 6+ 7- 7o 7+ 8- 8o 8+ 9- 9o
ap = 39 48 56 67 80 94 111 132 154 179 207 236 300 400
Other planetary indices include the Ap* and AA*. The Ap* index is defined as the earliest occurring maximum 24-hour value obtained by computing an 8-point running average of successive 3-hour ap indices during a geomagnetic storm event and is uniquely associated with the storm event. The AA* index is similar to the Ap* index, but has a longer history and is based on reports from only two stations.
More information about magnetic indices is available from:


