Earth had its warmest year on record; Upper-ocean heat content was record high while Antarctic sea ice was record low

Highlights:
- NOAA ranks 2023 as the warmest year in its global temperature record, which dates back to 1850.
- There is a one-in-three chance that 2024 will be warmer than 2023 and a 99% chance that 2024 will rank among the five warmest years on record.
- Upper ocean heat content—the amount of heat stored in the top 2000 meters of the ocean—was record high in 2023.
- Average annual Arctic sea ice extent was among the 10 lowest since 1979, and Antarctic sea ice extent was the lowest on record.
- There were 78 named tropical storms across the globe in 2023, which was below average, and 20 in the North Atlantic, which was well above average.
Surface Temperature

In 2023, global surface temperature was 2.12°F (1.18°C) above the 20th-century average. This ranks as the highest global temperature in the period 1850–2023, beating the next warmest year (2016) by a record-setting margin of 0.27°F (0.15°C). The 10 warmest years since 1850 have all occurred in the past decade. In 2023, global temperature exceeded the pre-industrial (1850–1900) average by 2.43°F (1.35°C).

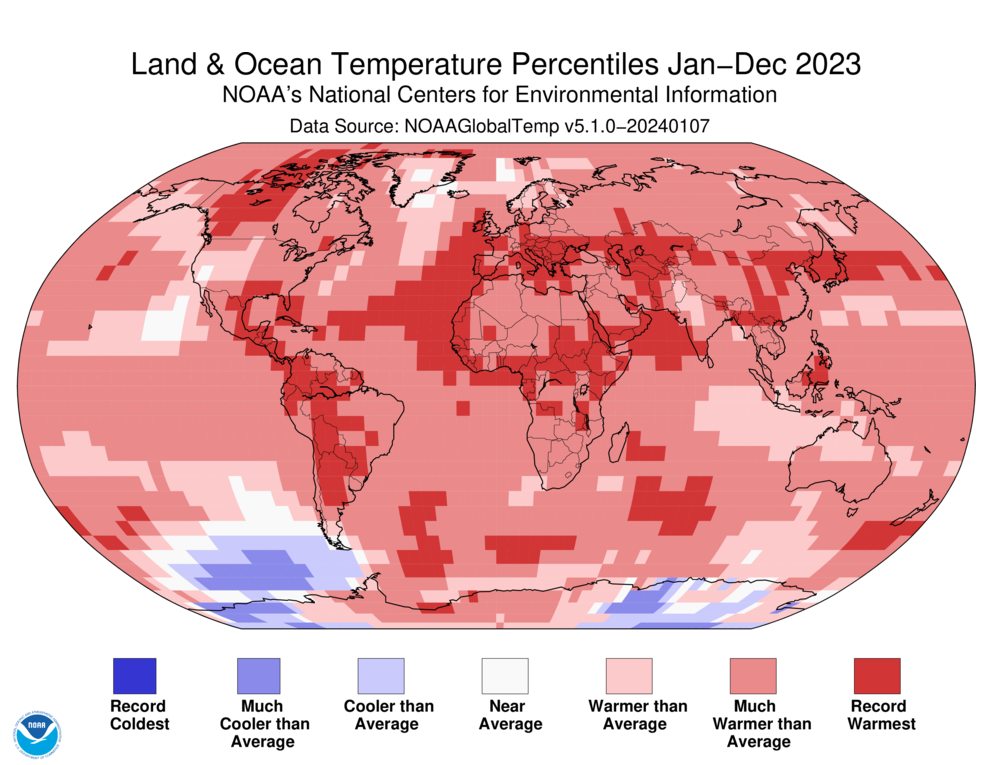
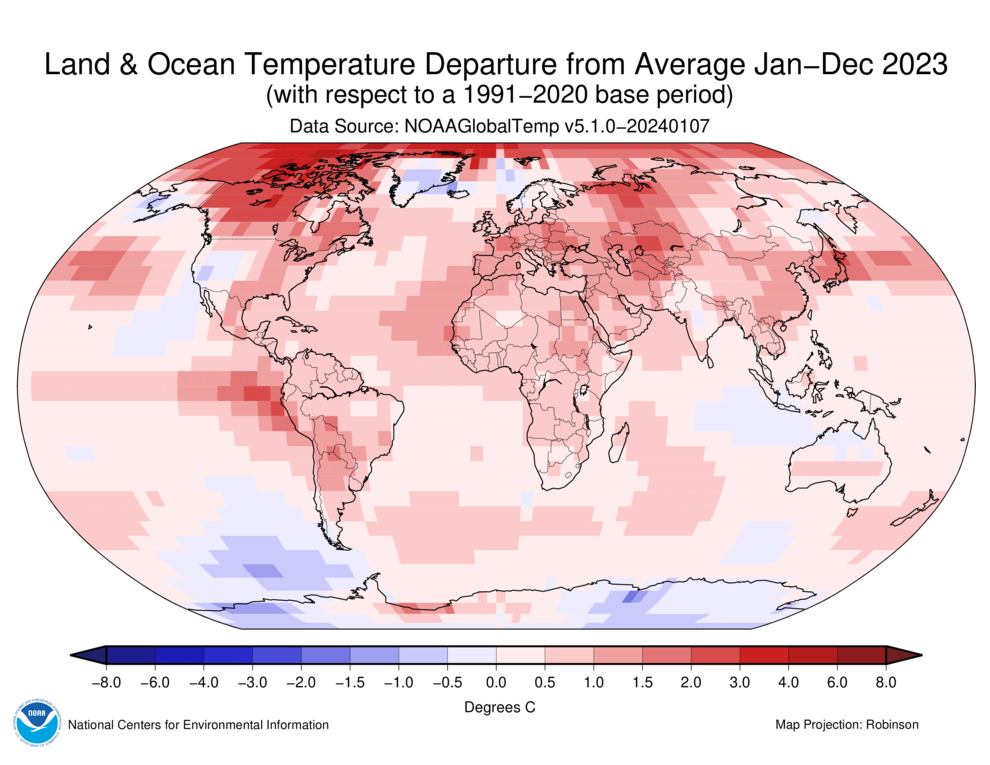
Temperatures were warmer than average over the vast majority of the Earth’s surface in 2023. Areas of notable warmth include the Arctic, northern North America, central Asia, the North Atlantic and the eastern tropical Pacific. Temperatures were cooler than average over relatively smaller areas, such as eastern and western Antarctica, the Southern Ocean near western Antarctica and southern Greenland.
Looking ahead, there is a one-in-three chance that 2024 will be warmer than 2023 and a 99% chance that 2024 will rank among the top five warmest years.
Ocean Heat Content
Upper ocean heat content—the amount of heat stored in the top 2000 meters of the ocean—was record high in 2023. Ocean heat content is a key climate indicator because the oceans store 90% of the excess heat in the Earth system. The indicator has been tracked globally since 1958, and there has been a steady upward trend since about 1970. The five highest values have all occurred in the last five years.
Snow Cover
Northern Hemisphere snow cover extent averaged 9.4 million square miles in 2023, which was slightly below average. Monthly extent ranged from 17.8 million square miles in January to just under 1.0 million square miles in August, both of which were below average. Snow cover extent records began in 1967.
Sea Ice Extent
Arctic sea ice extent averaged 4.05 million square miles in 2023, ranking among the 10 lowest years on record. The maximum extent in March was 5.64 million square miles, which ranked fifth lowest, while the minimum extent in September was 1.63 million square miles, which ranked sixth lowest. Sea ice extent records begin in 1979.
Antarctic sea ice extent averaged 3.79 million square miles in 2023, the lowest on record. The maximum extent in September was 6.55 million square miles, which was the lowest by a record margin. The minimum extent in February was 690,000 square miles, which set a record low for the second consecutive year.
Tropical Cyclones
Seventy-eight named storms occurred across the globe in 2023, which was below the 1991–2020 average of 87.5. Forty-five of those reached tropical cyclone strength (≥74 mph), and 30 reached major tropical cyclone strength (≥111 mph). These also included seven storms that reached Category 5 (≥157 mph) on the Saffir-Simpson hurricane wind scale. The global accumulated cyclone energy (ACE) was about 8% above the 1991–2020 average.
The North Atlantic had 20 named storms, which was much above the 1991–2020 average of 14.4. Seven of those were hurricanes, including three major hurricanes. The ACE was about 18% above normal. Idalia was the only billion-dollar hurricane to impact the continental United States in 2023. Hurricane Lee was the strongest storm in the Atlantic in 2023 and the only Category 5 storm.
December 2023
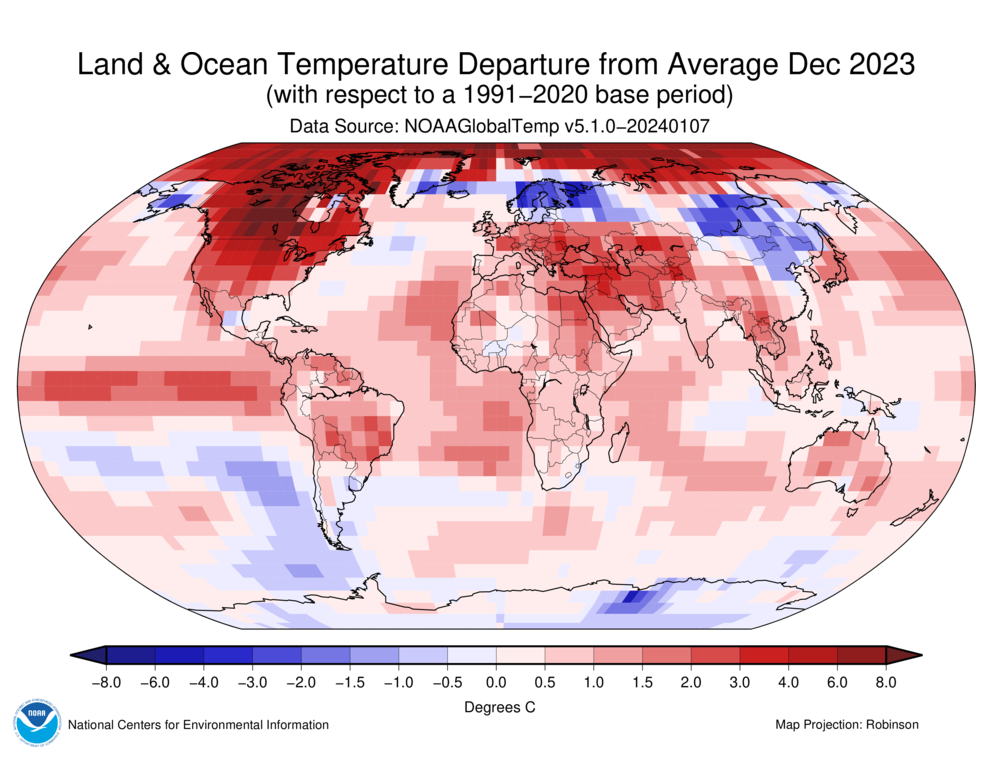
Global surface temperature in December 2023 was 2.57°F (1.43°C) above the 20th-century average—the warmest December on record. For the ninth consecutive month, the global ocean surface was record warm. Regionally, North America and South America each had their warmest December on record.

Northern Hemisphere snow cover extent in December ranked as the 11th-lowest December extent in the 58-year record. North America and Greenland’s combined extent was well below average, ranking as the third-smallest December on record. Eurasian snow cover extent for December was slightly above average.

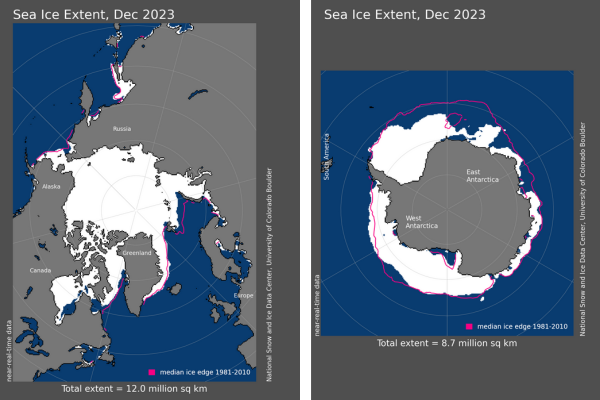
Global average sea ice extent in December ranked as the second-lowest December extent in the 44-year record (after 2016). Arctic sea ice extent was 4.63 million square miles, the ninth-lowest December on record. Antarctic sea ice extent was 3.35 million square miles—16% below average and the second lowest for December on record.
Three named tropical storms occurred across the globe in December, which is half of the long-term average. Jasper reached major tropical cyclone strength (≥111 mph). The global accumulated cyclone energy was less than 50% of the long-term average for December.
This monthly summary, developed by scientists at NOAA’s National Centers for Environmental Information, is part of the suite of climate services NOAA provides to government, business, academia and the public to support informed decision-making. See our full report for a more complete summary of 2023.


