A Collection of Success Stories

In honor of the 40th anniversary of the Regional Climate Center (RCC) Program, we have produced a series of articles highlighting its history and success. In this fourth, and final, installment, we provide examples of how climate services provided by the RCCs impact and inform real world decision-making.
Regional Climate Services
Climate services are the cornerstone of the RCCs. Generally speaking, climate services are intended to improve decision-making through the provision of climate information that is useful, usable, and used. Climate services, as defined by the American Meteorological Society, can include, but are not limited to, 1) past climate data stewardship, rescue (e.g., digitization of data from paper, books, microfilm, etc.), analysis, and communication, 2) present climate data monitoring, observations, summaries, and analysis, and 3) future climate forecasts and projections for use in planning, mitigation, and adaptation efforts. There is no limit to the ways in which climate services can be provided, but many routine examples range from the distribution of individual weather and climate observations to the synthesis of data into maps, graphs, and summaries to the development of interactive decision tools.
In the United States, climate services providers work on multiple scales and comprise various entities in both the public and private sectors. Regional climate services are often sector-based, reflecting the unique environmental features of the region (e.g., coastal, plains, mountains), while addressing the unique needs related to agriculture, health, transportation, water resources, etc.
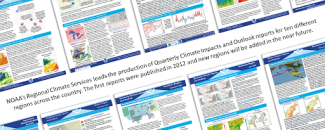
The RCC Program was the first regional climate services program to be created, but today, multiple providers exist. One such group, NOAA’s Regional Climate Services Directors, works closely with the RCCs to share information with stakeholders and provide platforms for communicating current climate issues. Among these are Quarterly Climate Impacts and Outlook reports, which summarize the previous seasonal climate data as well as detailed climate outlooks for each region. These reports promote cross-boundary collaboration by breaking out of the traditional RCC and RCSD regions and focusing on other geographic areas, e.g., Great Lakes and Pacific Regions. Some regions also produce monthly webinars to inform stakeholders about observed weather and climate-related impacts. Resources like these are used to make a wide variety of decisions related to drought declarations, emergency response planning, construction project management, and more.
RCC staff and RCSDs have unique expertise relevant to their region’s focus areas. Working closely together, they comprise NCEI’s Regional Climate Services.
Climate Services in Action
Throughout this series, many RCC climate services have been highlighted. Now, it’s time to explore some real-world examples showing how the RCCs help put climate services into action.
Wind Rose for Search and Rescue Operations
The Midwestern Regional Climate Center’s (MRCC) cli-MATE data portal allows users to plot wind rose diagrams, which show distribution of wind speed and direction (direction the wind is “blowing from”) for a user-identified period of time and location.
Ken Anderson, an emergency services manager with Emergency Support Services LLC who coordinates emergency search, rescue, and recovery operations in Minnesota, contacted the MRCC about incorporating an option that would invert wind roses to show the direction the wind was “blowing to.” This would allow him to better coordinate locations to send K9 officers for scent tracking. Ken said that “time is always against them during search and rescue operations and the improvement would allow better use and quicker guidance.” Shortly after the recommendation, the MRCC added the inverse wind rose option to cli-MATE. Anderson now uses the tool to overlay the inverted wind rose on maps for personnel involved in search and rescue operations and other related operations. He stated, “These changes have allowed many search and rescue organizations to have access to data in an easier-to-understand methodology. The solution was visually simple and effective.” In this case, the tool could save lives. To access the tool, visit cli-MATE, create a free account, login, select an hourly station, and navigate to the Wind Rose Tool.
Historical Precipitation Data and Projections of Future Extreme Precipitation Events
Heavy precipitation events have been increasing in intensity and duration for much of the United States, especially in the Northeast, where the largest increases have occurred. As such, the Northeast Regional Climate Center (NRCC) has a long history of providing data and resources to help address issues related to extreme precipitation events.
One recent example comes from New Jersey, where the NRCC partnered with the New Jersey Department of Environmental Protection (NJ DEP). In 2019 and 2020, New Jersey Governor Phil Murphy signed executive orders establishing new requirements aimed at building a statewide climate change resilience strategy. Climatologists saw an indication that regional extreme precipitation events were increasing in frequency, but a 20-year gap in the data made it impossible to confirm this impression and plan accordingly for the future. The NRCC’s partnership with NJ DEP helped address this issue by providing historical precipitation data for the period 2000-2020 from NCEI’s GHCN-D dataset, as well as future projections of precipitation rates for New Jersey.
“Adding that 20 years’ worth of data shows that we've seen an increase in storm intensity, then as we project out, we can get an idea of what future storm intensity is going to look like which becomes important for updating regulations related to climate change like flood hazard or stormwater rules,” says Nick Procopio, a bureau chief in the Division of Science and Research at NJ DEP. These data are extremely valuable for addressing climate change in New Jersey because they help inform and enable policymakers to make scientifically-based decisions about regulations that will affect the state and its residents for years to come.
Media Uses of the Climate Perspectives Tool
Launched in 2010, the Southeast Regional Climate Center’s (SERCC) Climate Perspectives tool (CLIMPER) has been providing both regional and national views of current and past weather data as well as gridded National Weather Service forecasts to provide a synopsis of recent and emerging temperature and precipitation patterns across the country. It is frequently used by a wide variety of weather news media, including The Weather Channel, Capital Weather Gang, and Fox Weather.
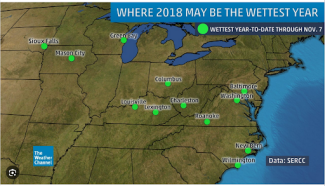
One of the features of CLIMPER is an ability to export text files containing the perspectives information, which allows media stakeholders to use that information to make their own value-added maps. The Weather Channel, and their digital partners, utilize this feature to generate value-added maps for all their 4.5 million Twitter followers, like the one below from 2023. Jonathan Erdman, Senior Digital Meteorologist, said, “We’ve been using SERCC’s CLIMPER at The Weather Channel for over 10 years. This simple, yet powerful tool helps put weather stories into a broader perspective.” Another stakeholder, Jason Samenow, the Chief Meteorologist and Weather Editor at the Capital Weather Gang, said of CLIMPER, “Climate Perspectives is an indispensable tool for news-gathering when reporting on extreme weather. Its data and information enable us to inform readers how unusual their weather is and educate them about the increasing role of climate change.”
Providing Resources to Tribal Communities
The High Plains Regional Climate Center (HPRCC) has been working with Tribal Nations across the Missouri River Basin since at least 2011. Small meetings and workshops gradually grew into more formal projects, the first of which was with the Eastern Shoshone and Northern Arapaho Tribes of the Wind River Indian Reservation. This early work, focused on building resilience to drought, led to the co-production of climate summaries, the development of a tribal decision dashboard, and a hands-on training session. Since then, the HPRCC has worked with a number of other Tribal Nations on building out similar reservation-specific resources to help with climate monitoring and decision-making.
Several training sessions have been held over the years, with a focus on leveraging climate and drought tools for use in monitoring and decision-making. Having discovered ACIS and its capabilities from one such session, Mark Junker, who is the Tribal Response Coordinator for the Sac and Fox Nation of Missouri in Kansas and Nebraska said, “It is a powerful tool that allows access to data whenever we need it for decision-making. We recommend it to as many people as possible and can help others use its full capabilities because of our training.”
Pedestrian Crash Data and Climate Information
According to the National Highway Traffic Safety Administration (NHTSA), more than 7,300 pedestrians died in traffic crashes in 2021 in the United States. An increasing trend in pedestrian crashes, especially those involving injuries and fatalities, has proven challenging for transportation professionals to address.
The Southern Regional Climate Center (SRCC) combined pedestrian crash data from Dallas, San Antonio, and Austin, Texas with weather and climate data. SRCC researchers found that basic weather conditions, such as cloud coverage and presence of rain, were similarly represented in pedestrian crash data reports, but that sun glare was underrepresented. Using analyses from this study, along with a newly created database, the SRCC hopes to train AI-based machine learning technologies for smart vehicles that can preemptively warn drivers during times and at locations where the risk of sun glare and weather-induced pedestrian crashes are high. So far, public reaction from stakeholders has been positive, and interactions have provided fruitful thoughts and discussions on future applications and development of this research. Similar studies can be performed for other locations throughout the country.
Michael Manser, Ph.D., Director, Center for Transportation Safety, said, “The SRCC Team provided the tool to interpolate climate data and sun glare for over 4000 pedestrian crash records. This linkage of climate and transportation safety data is a key factor in our efforts to reduce the growing trend in pedestrian crashes."
Monitoring Drought Conditions
The western U.S. consists of extensive areas of arid and semiarid lands that are prone to water shortages. Stakeholders from a wide variety of sectors across the region have expressed the need for local-to-regional drought information. Sparseness of long-term climate observations across the region requires a more spatially complete approach to providing drought metrics. The WestWide Drought Tracker (WWDT) is a tool hosted at the Western Region Climate Center (WRCC) since 2010 that provides easy access to fine-scale drought monitoring and climate products that can be utilized by a variety of users. The tool has recently been updated and modernized.
The WWDT web application mapping tool allows users to interact with the data and select different regions. Clicking anywhere on the map allows users to see the actual data value at that geographic location. Drought indices include the Palmer Drought Severity Index (PDSI), Self-Calibrated Palmer Drought Severity Index (sc-PDSI), Palmer Z-Index, Standardized Precipitation Index (SPI), and Standardized Precipitation Evapotranspiration Index (SPEI). Climate data include temperature and precipitation values, anomalies (based on 1991-2020 normals), and percentiles (from 1895-present distribution). User feedback has been positive, and the tool has attracted long-term users. Greg Jones, a climatologist and CEO of Abacela Winery, remarked, “I have used this product for years for reports and outreach to the grape and wine industry in the western U.S.”
Looking to the Future
In the 40 years that the RCC Program has been in operation, the landscape of climate services has changed tremendously. With climate affecting nearly every sector imaginable, the needs for tailored climate services will continue, but how those needs are addressed in the coming years, especially as computing and technological resources advance, remains to be seen. The experience, nimbleness, and flexibility of the RCC Program makes it well-positioned to continue to provide regional climate services now and into the future. Contact the RCCs today for help with your regional climate needs.
Learn More About Your Regional Climate Center
- High Plains Regional Climate Center, University of Nebraska-Lincoln, Lincoln, NE
- Midwestern Regional Climate Center, Purdue University, West Lafayette, IN
- Northeast Regional Climate Center, Cornell University, Ithaca, NY
- Southeast Regional Climate Center, University of North Carolina at Chapel Hill, Chapel Hill, NC
- Southern Regional Climate Center, Texas A&M University, College Station, TX
- Western Regional Climate Center, Desert Research Institute, Reno, NV
NCEI’s Regional Climate Services
The RCCs are supported by the National Centers for Environmental Information (NCEI) as part of a three-tiered approach to climate services, which includes state, regional, and national partners. The RCCs work alongside six Regional Climate Services Directors that, together, comprise NCEI’s Regional Climate Services.


