
Warmest June on record for the contiguous U.S.; eight U.S. weather and climate disasters exceed a billion dollars each in first half of 2021

The June contiguous U.S. temperature was 72.6°F, 4.2°F above the 20th-century average, ranking warmest in the 127-year record and surpassing the previous record for June set in 2016 by 0.9°F. The year-to-date average temperature for the contiguous U.S. was 49.3°F, 1.7°F above the 20th-century average, ranking in the warmest third of the January-June record.
The June precipitation total for the contiguous U.S. was 2.93 inches, exactly average. Averaged over the first six months of the year, the precipitation total for January-June was 14.64 inches, 0.67 inch below average, ranking in the driest third of the record.
There were eight billion-dollar weather and climate disasters identified during January-June. These disasters were due to four severe storm events, two flooding events, one winter storm/cold wave event and one drought/heat wave event.

This monthly summary from NOAA National Centers for Environmental Information is part of the suite of climate services NOAA provides to government, business, academia and the public to support informed decision-making.
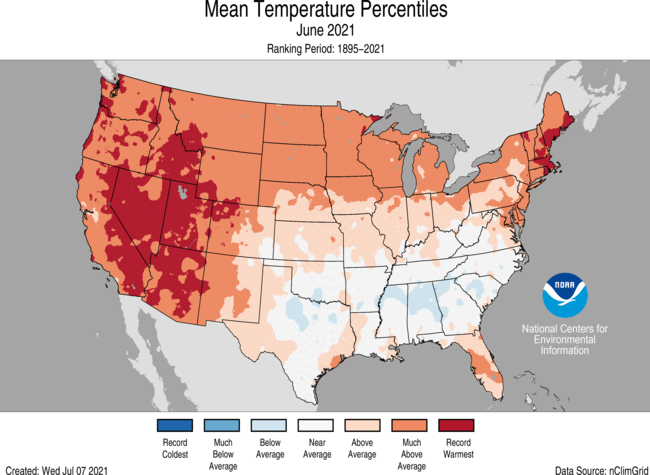
June Temperature

- For the month, temperatures were above average to record warm across the West and Northeast and were also above average across the northern and central Plains and parts of Florida and the Gulf Coast. Eight states — California, Nevada, Utah, Idaho, Arizona, New Hampshire, Massachusetts and Rhode Island — ranked warmest on record for the month with six additional states ranking second warmest.
- Approximately 15.2 percent of the contiguous U.S. observed its warmest June on record. This is the largest extent of record warm temperatures on record for the U.S.
- New all-time maximum temperature records were set for a number of locations across the Northwest on June 27 and 28. In addition, potential new all-time state temperature records were set for Oregon and Washington.
- An amplified ridge of high pressure across the Pacific Northwest contributed to the record warm temperatures seen across the region in late June. Much of the heat across the West during June was influenced by a persistent ridge situated across the region for a majority of the month.
- Temperatures were near to below average across portions of the Deep South and Southeast.
- The Alaska average June temperature was 51.0°F, 1.8°F above the long-term mean, ranking in the warmest third of the historical record for the state. Overall, the Aleutians, Panhandle and Northeast Interior regions experienced the warmest departures during June while the North Slope and Bristol Bay regions had near-average temperatures.
- Sea ice melt in the Chukchi Sea was close to the 30-year average. June sea ice extent was 103% of the 1991-2020 median value.

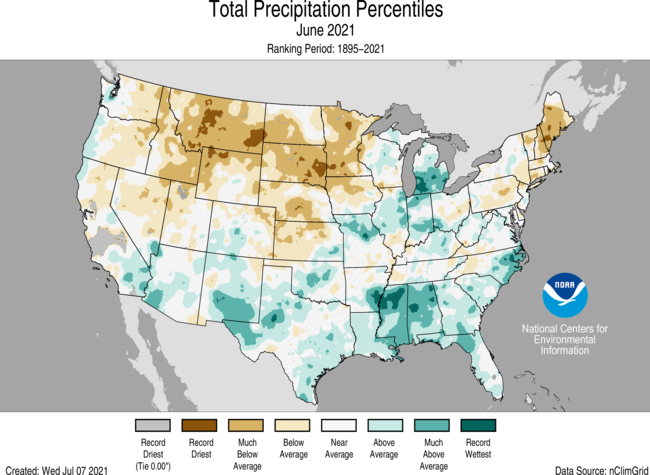
June Precipitation

- Precipitation was above average across parts of the Southwest, Deep South, Midwest, Great Lakes, Gulf Coast and Southeast. Mississippi ranked second wettest while Alabama ranked fifth wettest on record.
- Tropical Storm Claudette formed on June 19, made landfall along the Louisiana coast, traversed the Southeast and brought significant rain and flash flooding to the region. Tornadoes damaged homes and at least 13 deaths were associated with this storm.
- Precipitation was below average across much of the interior West, northern Rockies, northern and central Plains and the Northeast. South Dakota ranked driest on record with five additional states across the northern Rockies, northern Plains and Northeast ranking among their top-10 driest Junes on record.
- Alaska received 2.74 inches of precipitation during June, which is 0.40 inch above average, ranking in the wettest third of the record. The Panhandle received above-average precipitation with Juneau reporting its fourth-wettest June on record. Precipitation received across northwest Alaska was also above average due to a series of fast-moving low pressure systems tracking from eastern Siberia into Alaska at the end of June.
- According to the June 29 U.S. Drought Monitor report, approximately 47.2 percent of the contiguous U.S. was in drought, up from nearly 44 percent at the beginning of June. Drought intensified and/or expanded across portions of the West, northern and central Plains, Midwest, New England and Hawaii. Drought severity lessened across the southern High Plains, Carolinas and Virginia as well as Puerto Rico.

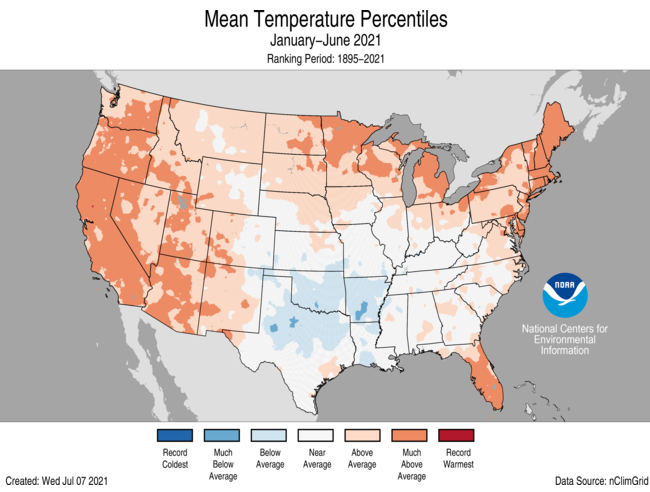
Year-to-date (January-June) Temperature

- January-June temperatures were above average across the vast majority of the West, northern Plains, Great Lakes, Northeast, mid-Atlantic and parts of the Southeast. Maine ranked third warmest and both California and New Hampshire ranked fifth warmest on record for this six-month period.
- Temperatures were below average across much of the southern Plains.
- The Alaska statewide average temperature for the year-to-date period was 22.6°F, 1.3°F above average, and ranked in the middle third of the record. Above-average temperatures were present across the Aleutians and Bristol Bay regions with near-average temperatures dominating the rest of the state.

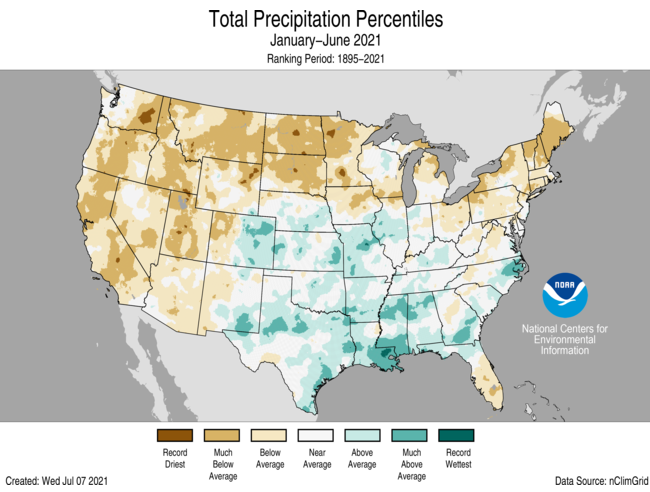
Year-to-Date (January-June) Precipitation

- Precipitation was above average from the central and southern Plains to the Midwest and from the Deep South to the Southeast. Louisiana ranked eighth wettest on record for this year-to-date period.
- Precipitation was below average across much of the West, northern Plains, Great Lakes, Northeast and Florida. Nine states across the interior West, northern Plains and New England ranked among their top-10 driest January-June periods on record.
- For Alaska as a whole, precipitation was above average during the first half of 2021. In the Panhandle, Juneau ranked second wettest on record for this period.

Billion-dollar Weather and Climate Disasters

- The eight individual billion-dollar events of 2021 include: two flood events focused in California (January 24-29) and Louisiana (May 14-19); the historic mid-February winter storm and cold wave with impacts focused in Texas; two severe storm events in late-March (24-25 and 27-28) across many southeastern and eastern states, respectively; two severe storm events focused across Texas and Oklahoma in mid-to-late April (12-15 and 27-28); and the expanding Western drought and heatwave that has amplified throughout 2021.
- In addition to significant economic impacts, the eight events identified during the first half of 2021 resulted in at least 331 fatalities.
- The most costly U.S. event so far in 2021 was the February 10-19 Winter Storm and Cold Wave with total, direct losses of approximately $20 billion. This is now the most costly U.S. winter storm event on record surpassing (nearly doubling the inflation-adjusted cost of) Superstorm 1993.
- The January-June 2021 inflation-adjusted costs are at a near-record pace for the first six months, at nearly $30 billion — trailing only 2011.
- Since these billion-dollar disaster records began in 1980, the U.S. has sustained 298 separate weather and climate disasters where overall damages/costs reached or exceeded $1 billion (based on the CPI adjustment to 2021) per event. The total cost of these 298 events exceeds $1.975 trillion.


