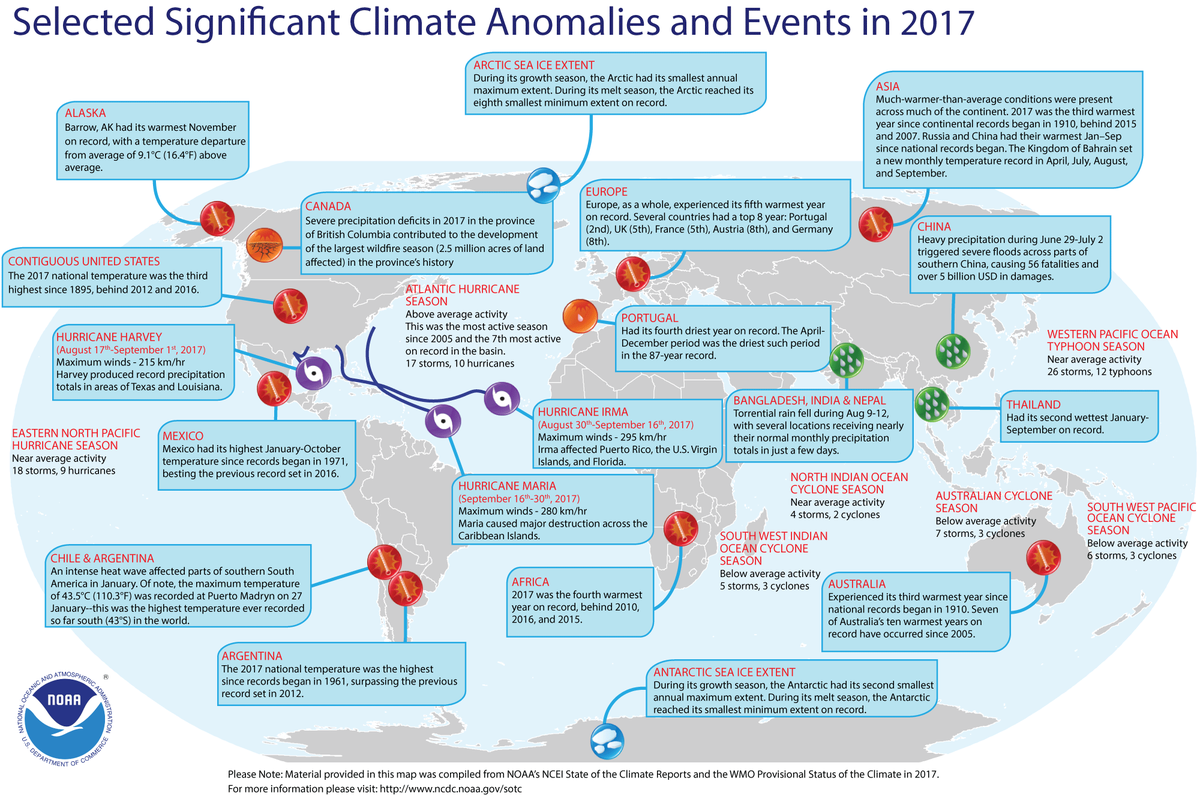
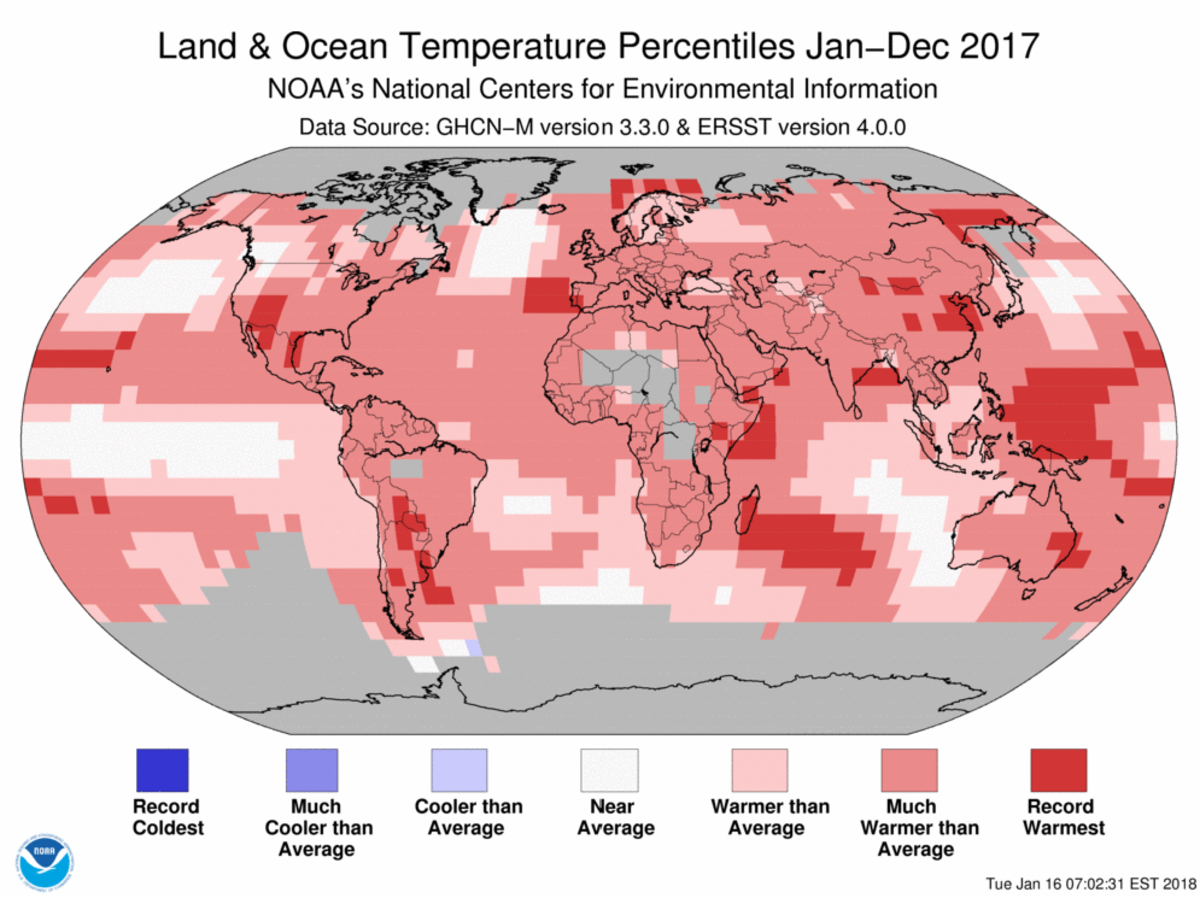
For the globe, 2017 was the third warmest year on record and the warmest year without an El Niño present

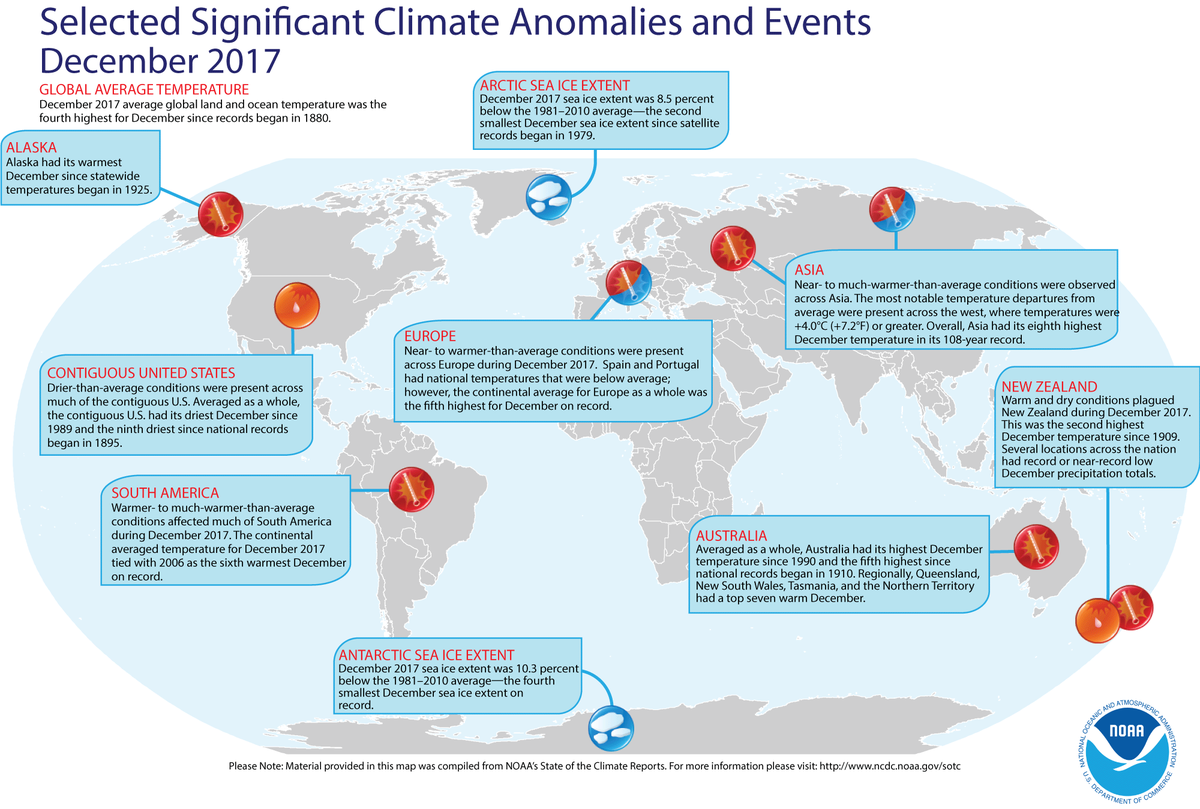
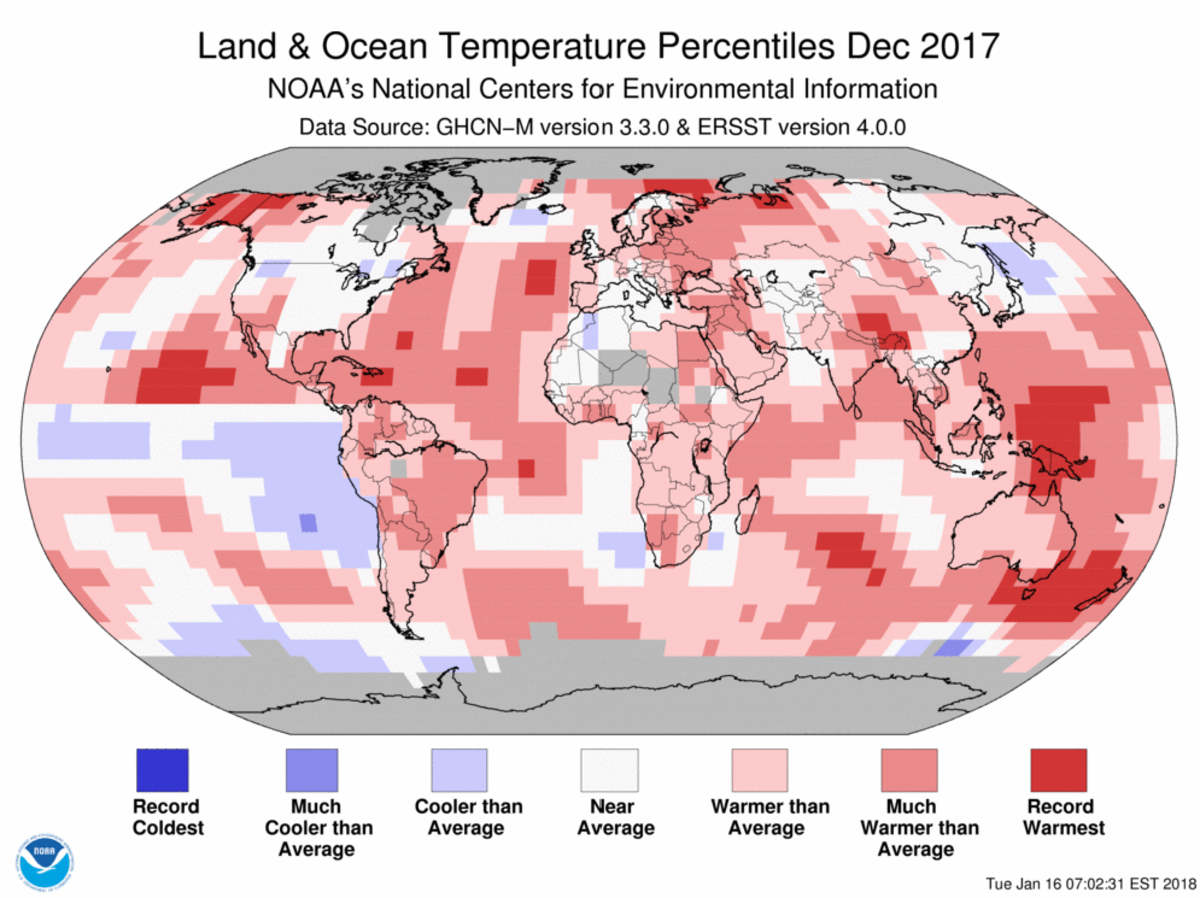
The globally averaged temperature over land and ocean surfaces for 2017 was the third highest since record keeping began in 1880, according to NOAA scientists. December’s combined global land and ocean average surface temperature departure from average was the fourth warmest December in the 138-year record.
This summary from NOAA's National Centers for Environmental Information is part of the suite of climate services NOAA provides to government, business, academia and the public to support informed decision-making.
In a separate analysis of global temperature data, released today, NASA scientists ranked 2017 to be the second warmest on record, behind the record year 2016. The minor difference in rankings is due to the different methods used by the two agencies to analyze global temperatures, although over the long-term the agencies' records remain in strong agreement. Both analyses show that the five warmest years on record all have taken place since 2010. Analyses from the United Kingdom Met Office and the World Meteorological Organization also ranked 2017 among the top three warmest years on record.
Global Climate Highlights: 2017
Global land and ocean surface temperature: During 2017, the average temperature across global land and ocean surfaces was 1.51°F (0.84°C) above the 20th century average. This was the third highest among all years in the 1880-2017 record, behind 2016 (warmest) and 2015 (second warmest).
The monthly global land and ocean temperatures at the start of 2017 were extremely warm, with the first four months each ranking as the second warmest for their respective months, behind the record year 2016.
Of particular note, the global land and ocean temperature for the month of March 2017 was 1.9°F (1.03°C) above the 20th century average – this marked the first time the monthly temperature departure from average surpassed 1.8°F (1.0°C) in the absence of an El Niño episode in the tropical Pacific Ocean. After reaching a peak monthly temperature departure in March, temperatures began to slowly decrease in magnitude, ranging between +1.31°F to +1.58°F (+0.73°C to +0.88°C).
2017 marks the 41st consecutive year (since 1977) with global land and ocean temperatures at least nominally above the 20th century average, with the six warmest years on record occurring since 2010. Since the start of the 21st century, the annual global land and ocean surface temperature has been broken five times, three of those being set back-to-back (2014-2016). From 1880 to 1980, a new temperature record was set on average every 13 years; however, for the period 1981-2017, the frequency of a new record has increased to once every three years.
The yearly global land and ocean temperature has increased at an average rate of 0.13°F (0.07°C) per decade since 1880; however, the average rate of increase is more than twice as great since 1980.
Global land surface temperature: During 2017, the globally averaged land surface temperature was 2.36°F (1.31°C) above the 20th century average. This was also the third highest among all years in the 1880-2017 record, behind 2016 (warmest) and 2015 (second warmest).
Record high temperatures over land surfaces were measured across central North America, southern South America and scattered across parts of Africa, the Middle East and eastern Asia. No land areas were record cold for the year.
The year ranked among the sixth warmest on record for each of the six continents analyzed, with South America having its second warmest year since continental records began in 1910, behind 2015.
Global ocean surface temperature: The 2017 globally averaged sea surface temperature was 1.21°F (0.67°C) above the 20th century average. This was also the third highest among all years in the 1880-2017 record, behind 2016 (warmest) and 2015 (second warmest).
Record high sea surface temperatures were observed across parts of the western and central Pacific Ocean, western and northern Indian Ocean, and northern and southern parts of the Atlantic Ocean. No ocean areas were record cold for the year.
2017 Snow and Sea Ice
Northern Hemisphere snow cover: According to NOAA data analyzed by the Rutgers Global Snow Lab, the average annual Northern Hemisphere snow cover extent during 2017 was 9.96 million square miles. This was about 360,000 square miles above the 1981-2010 average, the largest since 1985 and the eighth largest in the 1968-2017 record.
Arctic sea ice extent: Recent trends in the decline of Arctic sea ice extent continued in 2017. When averaging monthly data from the National Snow and Ice Data Center, the average annual sea ice extent in the Arctic was approximately 4.01 million square miles. This was the second smallest annual average in the 1979-2017 record, about 90,000 square miles larger than the record small extent that was set in 2016. Record-low Arctic sea ice was observed during the first three months of 2017.
Antarctic sea ice extent: The annual Antarctic sea ice extent was record small for the year at 4.11 million square miles. This was about 154,000 square miles smaller than the previous record set in 1986. The Antarctic sea ice extent was record low for five months of the year and reached its smallest minimum extent on record in early March.
Global Climate Highlights: December 2017
Global land and ocean surface temperature: During December, the average temperature across global land and ocean surfaces was 1.44°F (0.80°C) above the 20th century average. This value was the fourth highest departure from average for December in the 1880-2017 record. Only the Decembers of 2015 (warmest), 2014 (second warmest), and 2016 (third warmest) were warmer.
Global land surface temperature: During December, the globally averaged land surface temperature was 2.61°F (1.45°C) above the 20th century average. This was the second highest for December in the 1880-2017 record, behind 2015 by 0.77°F (0.43°C).
Global ocean surface temperature: During December, the globally averaged sea surface temperature was 1.01°F (0.56°C) above the 20th century average. This was the sixth highest for December in the 1880-2017 record.
December 2017 Snow and Sea Ice
Northern Hemisphere snow cover: According to data from NOAA analyzed by the Rutgers Global Snow Lab, the Northern Hemisphere snow cover extent during December was 16.82 million square miles, which is 160,000 square miles below the 1981-2010 average. This ranked near the median value in the 52-year period of record.
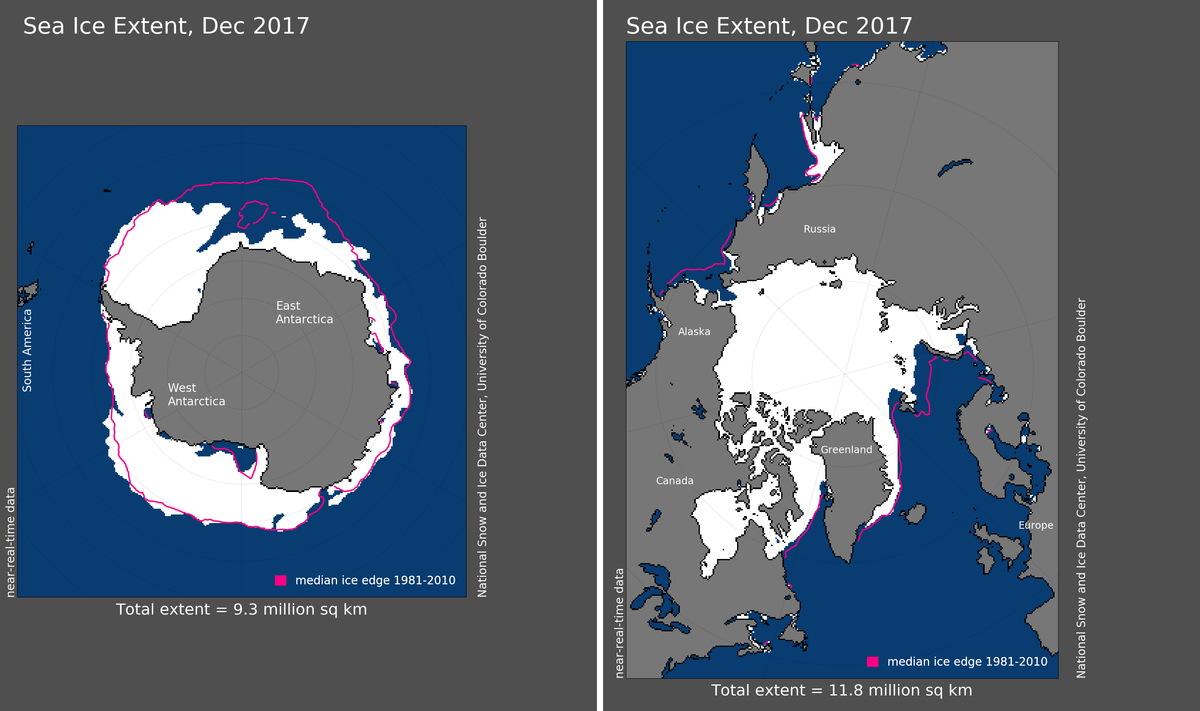
Arctic sea ice extent: The average Arctic sea ice extent for December was 4.54 million square miles, according to analysis by the National Snow and Ice Data Center based on data from NOAA and NASA. This value was 421,000 square miles (8.5 percent) below the 1981-2010 average and the second smallest December extent since records began in 1979.
Antarctic sea ice extent: Antarctic sea ice during December was 3.61 million square miles, according to analysis by the National Snow and Ice Data Center. This value is 510,000 square miles (10.3 percent) below the 1981-2010 average and the fourth smallest December extent on record.
For a more complete summary of climate conditions and events, see our 2017 Annual Global Climate Report.

