Pacific TA Crossovers
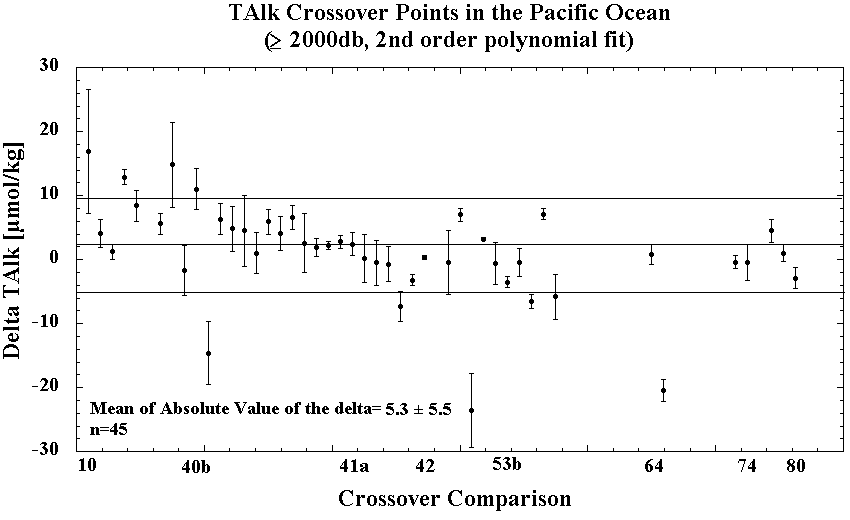
The purpose of this analysis was to determine if any significant systematic offset existed between the various legs of the WOCE/NOAA/JGOFS Pacific Ocean total Alkalinity (TA or TALK) measurements. The stations selected for each crossover were those with carbon data which were close to the crossover point. The number of stations selected was somewhat subjective, but was such that sufficient measurements were present for the analysis without getting too far away from the crossover location. In all cases the stations were within approximately 1° of latitude or longitude of the crossover point. Data from deep water (>2000 m) at each of the crossover locations were plotted against the density anomaly referenced to 3000 dB (σ-3) and fit with a second-order polynomial. The difference and standard deviation between the two curves was then calculated from 10 evenly spaced intervals over the density range common to both sets of crossovers.
Click here for a summary Table of crossover results. Click on a point in the figure below to see a graph of the TALK information.

Secondary Checks
A secondary check was performed on crossovers with large deltas or large standard deviations from the crossover analysis. A multiparameter liner least square regression method is used to examine the offsets at selected crossover locations. Data from Cruise 1 are used as a reference to derive a best fit equation:
TA = a + bSal + cT + dOxy
where a, b, c, and d are constants; Sal is salinity; T is temperature; and Oxy is Oxygen concentration. Once the equation is derived, TALK is calculated from the Cruise 2 Sal, T, and Oxy. The difference between this predicted TALK and the observed TALK at the Cruise 2 stations is defined as ΔTALK. Results from the multiple-parameter regression method are listed below:
| Crossing no. | Cruise 1 - station | Cruise 2 - station | ΔTALK (µmol/kg) | St.dev |
|---|---|---|---|---|
| 10 | P10-74, 77 | P2-37 | 27.0 | 3.5 |
| 23 | P13-54,55 | P2-48 | 28.5 | 5.7 |
| 28 | P14N-63 | P2-58 | 9.3 | 2.8 |
| 34 | P14S15S-32 | S4P-783, 787 | 6.0 | 1.9 |
| 36 | P15N-52, 54 | P2-65 | 10.4 | 2.1 |
| 40b | P14S15S-174 | P15N-112 | 6.6 | 4.2 |
| 40c | P15N-112 | EQS92-56 | -8.2 | 7.8 |
| 40d | P14S15S-173 | P15N-114 | 3.4 | 5.3 |
| 40f | P14S15S-171 | P15N-118 | 5.0 | 4.7 |
| 40i | P14S15S-169 | EQS92-63 | 12.2 | 8.0 |
| 40k | P15N-122 | EQS92-63 | 14.0 | 7.9 |
| 44 | P14S15S/1-93 | P14S15S/2-94 | -7.5 | 6.6 |
| 45 | P14S15S-33 | S4P-755 | 6.6 | 3.4 |
| 47 | P16N-58,59,66 | P17N-78 | -10.0 | 3.4 |
| 53d | P16S17S-220 | P31-2, 5 | -11.3 | 7.1 |
| 53e | P16S17S-220 | P21-157, 160 | 2.3 | 7.4 |
| 53f | P21-157, 160 | P31-2, 5 | -11.8 | 4.0 |
| 65 | P16S17S-148 | P21-131 | -18.5 | 3.1 |
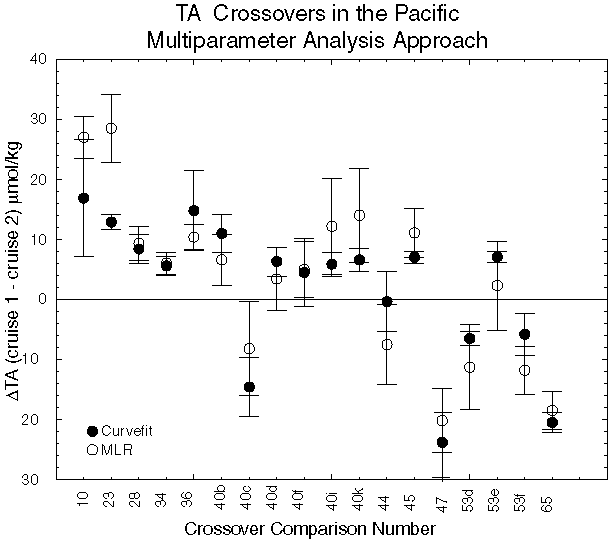
These results are compared with the deltas derived from curve fitting method as shown in the following figure. The multiparameter method generally had smaller delta values, suggesting that some of the differences in the crossovers with large deltas could actually be due to real changes in the water mass properties.

Optimizing the Crossover Results
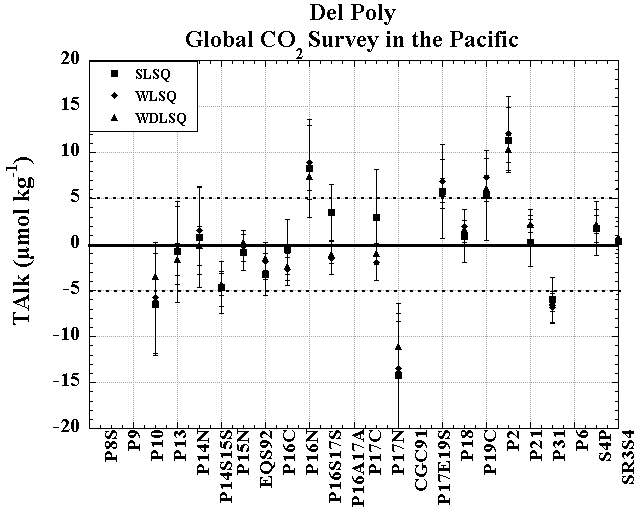
Optimum cruise adjustments, based on the crossover results, were evaluated using the three approaches. The first approach was a simple least-squares minimization (SLSQ). The optimized cruise adjustments based on an equal weighting of the crossover data are shown in the figures below. The second set of adjustments were calculated using weighted least-squares (WLSQ); the weighting used the error estimates from the polynomial fits, and so focused on making adjustments to minimize offsets at crossovers where they were better determined. The more crossovers used to determine the adjustments, and the smaller the offset uncertainties at those crossovers and the smaller the adjustment uncertainties. The third set of adjustments were calculated using weighted, damped least-squares (WDLSQ), formally equivalent to a Gauss-Markov model (Wunsch, 1996). The damping used was a prior guess of the variance at crossovers, estimated to be a constant 52 µmol/kg for TALK, hopefully what one might have guessed this RMS value of crossover differences to be before the survey was started. One could also choose to vary the damping on a cruise-by-cruise basis to reflect prior information on the accuracy of individual cruises (e.g. whether or not CRMs were used when determining TALK concentrations, or when the measurements were made, or even who made the measurements), but for this study a constant damping was used. A summary of the proposed adjustments based on the three different models is given below.

In an effort to ensure that sparse sampling combined with either noisy data or variability resulting from water mass variations was not significantly biasing the estimates of the offsets, a second approach to the polynomial fit was examined. In the approach previously described, the data from each cruise were fit with two independent curves. We will call this approach the Del Poly model. For the second approach (termed the Same Shape model) we fitted a 2nd order polynomial function to data from both Cruise 1 and Cruise 2 that allowed a constant offset for the two cruises but identical slope and curvature terms. The assumption was made that for any given crossover, the differences between the data from the two cruises could be expressed in the Same Shape model as a constant offset for TALK. The assumption of a constant offset was made partly because an offset was the simplest adjustment; however, with the relatively uniform oceanic values for TALK, additive or multiplicative adjustments would give similar end results. A summary of the proposed adjustments from the same shape fits, based on the three different models is given below. The proposed adjustments from the three different least squares models were similar to the adjustments from the Del Poly analysis.
Summary
Using the crossover differences estimated from the polynomial fits, the 45 crossovers for TALK had an average and standard deviation of 2.2±7.4 µmol/kg. The average and of the absolute values of the differences was 5.1±5.7 µmolkg. Eighteen TALK crossovers with differences from the polynomial fits of >5 µmol/kg were further examined using the MLR crossover analysis. Unlike the polynomial fit approach, the MLR method does not assume that the waters are identical, only that the relationships between TALK and the other properties do not change, and that the effects of measurement errors in the independent variables can be neglected. In most cases, the offsets implied from the original crossover analysis were the same or larger with the MLR analysis. This suggests that the differences observed in the initial polynomial fits can not be explained by changes in the distribution of water masses.
Both the Del Poly and Same Shape models give very similar differences, but the uncertainties are generally larger for the Same Shape model. It is difficult to say which approach is more appropriate for these data, since the answer depends somewhat on the nature of the errors. If we assume a priori that the primary difference between the data sets results from a constant offset, then the same shape model is most appropriate. Of the three least squares models examined, the WDLSQ adjustments and errors make use of the most information (error estimates and prior guesses on crossover differences) to determine adjustments and their uncertainties. The results from the WDLSQ show that most of the cruises during the Pacific Ocean CO2 survey are within ~ 5 µmol/kg for TALK. A few cruises lie outside this cutoff. The crossovers suggest that P17N and P31 should be lowered by 4-11 and 6 µmol/kg, respectively, and P2 should be increased by 8-10 µmol/kg.
All of these results must be considered in concert with the other lines of evidence on the quality of the TALK measurements from the various cruises. The TALK data were also examined using a basin-wide MLR approach, with internal consistency calculations, and using an isopycnal analysis. Here is a summary tablea> of analytical techniques, PIs, sample volumes, and shorebased analysis for TALK, or see an Adjustments Page for a synopsis of the adjustments we propose for the Pacific dataset.
