Note: This Synoptic Discussion describes recent weather events and climate anomalies in relation to the phenomena that cause the weather. These phenomena include the jet stream, fronts and low pressure systems that bring precipitation, high pressure systems that bring dry weather, and the mechanisms which control these features — such as El Niño, La Niña, and other oceanic and atmospheric drivers (PNA, NAO, AO, and others). The report may contain more technical language than other components of the State of the Climate series.
Summary
The Earth's ocean-atmosphere system continued in a weak La Niña state during November 2017. The upper-level circulation pattern underwent a shift over the contiguous United States (CONUS) at mid-month, changing from a mostly zonal pattern during the first half of the month to a predominantly ridge-West/trough-East pattern for the last half of the month. The temperature anomaly pattern was predominantly colder than normal in the northern states and warmer than normal in the southern states during the first half of the month, then colder than normal in the East and warmer than normal in the West for the last half, with the monthly pattern being a mixture of the two. Fronts and low pressure systems brought above-normal precipitation to the Pacific Northwest, northern Rockies, and parts of the Midwest. But the western ridge deflected weather systems away from the rest of the West, and a northwesterly flow blocked Gulf of Mexico moisture from most of the Plains to East Coast, so these regions ended the month drier than normal. The precipitation helped contract drought and abnormal dryness in the Northwest, northern Rockies, and parts of the Midwest, but drought and abnormal dryness expanded or intensified in the Southwest, southern Plains, Lower Mississippi Valley, and Southeast where it was dry. The upper-level circulation, temperature, and precipitation anomaly patterns suggested that the atmospheric drivers originating in the equatorial Pacific (i.e., La Niña) likely had a controlling influence on the month's weather, but drivers originating in other regions may also have had an influence. See below for details.
Synoptic Discussion
 Animation of daily upper-level circulation for the month.
|
 Animation of daily surface fronts and pressure systems for the month.
|
In the Northern Hemisphere, November marks the end of climatological fall (autumn) which is the time of year when solar heating decreases as the sun angle decreases, and an expanding circumpolar vortex forces the jet stream to migrate southward. Polar air masses influence the weather over the contiguous U.S. (CONUS) more, and the warm, dry subtropical high pressure belts influence the weather less.
 500-mb mean circulation for the CONUS for November 1-14, 2017, showing a zonal flow.
|
 500-mb mean circulation for the CONUS for November 14-27, 2017, showing a long-wave ridge in the West and trough in the East.
|
The upper-level circulation was very active during November 2017 with several short-wave troughs migrating across the CONUS in the jet stream flow. Two general circulation regimes dominated this month. A zonal circulation pattern held sway during the first half of the month. A zonal circulation is generally a west-to-east flow that keeps cold air masses bottled up to the north and warmer air masses concentrated to the south. It reduces north-south movement of air masses and inhibits the atmosphere's efforts to transfer heat from the tropics towards the poles to balance out the distribution of heat across the Earth. The circulation pattern shifted to a highly meridional state during the second half of the month. A meridional circulation consists of large undulations of the jet stream to the north and south, frequently resulting in stable long-wave troughs and ridges. Troughs transport colder air masses from the poles southward, and ridges transfer heat from the low latitudes to higher latitudes, thus balancing out the Earth's surface heat in the long run. Each of these patterns was characterized by specific weather phenomena, temperature anomalies, precipitation anomalies, and impacts.
 500-mb circulation anomalies for the CONUS for November 1-14, 2017.
|
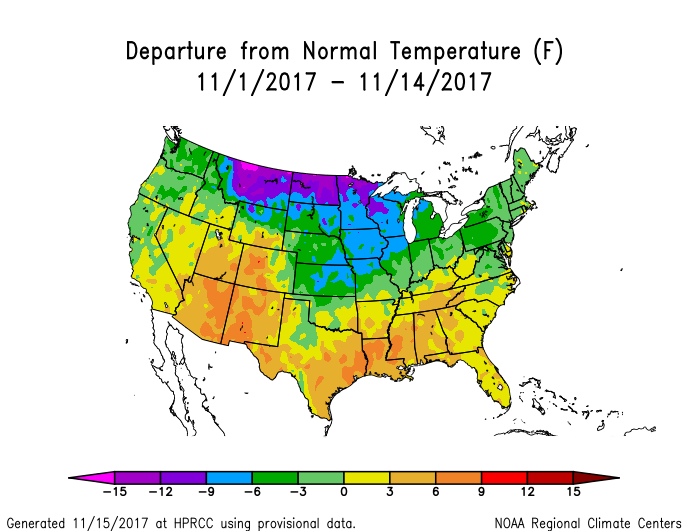 Temperature anomalies (departure from normal) for the CONUS for November 1-14, 2017.
|
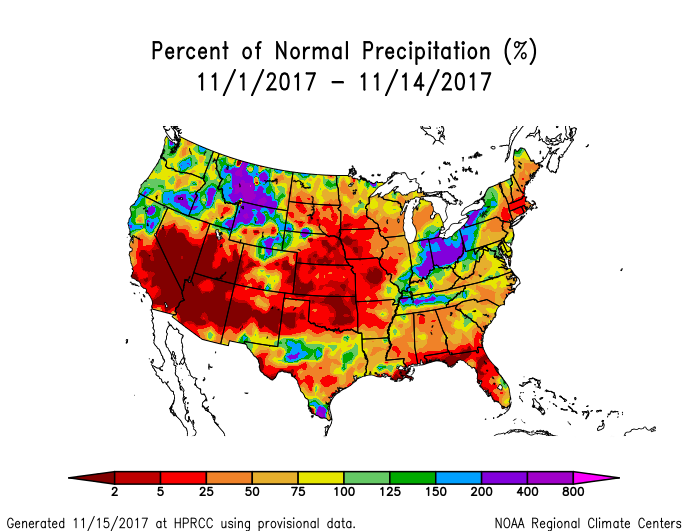 Precipitation anomalies (percent of normal) for the CONUS for November 1-14, 2017.
|
A generally westerly flow in the jet stream held sway during the first half of the month, with the short-wave troughs and storm track staying mostly across the northern states. Pacific low pressure systems brought above-normal precipitation to the Pacific Northwest and northern Rockies, but dried out by the time they reached the Plains and Upper Midwest. Enough Gulf of Mexico moisture was drawn into the low pressure systems to produce above-normal precipitation in the Ohio Valley to southern Great Lakes, but otherwise the air masses remained mostly dry. Cold Canadian air masses were pulled in behind the surface low pressure systems, but the westerly flow kept the coldest air across the northern states to central Plains, where temperatures averaged below normal for the period. Some cold fronts managed to reach the Gulf of Mexico coast, but they were greatly modified and generally diffuse by the time they reached the coast. The westerly jet stream flow kept temperatures warmer than normal and precipitation mostly drier than normal across the southern states.
 500-mb circulation anomalies for the CONUS for November 14-27, 2017.
|
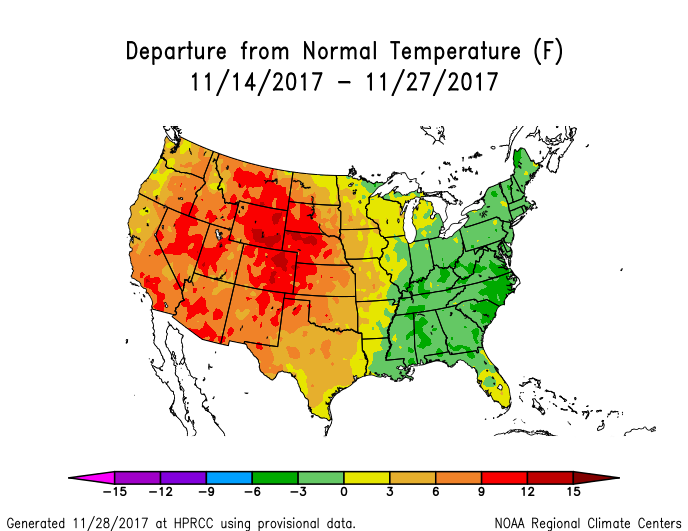 Temperature anomalies (departure from normal) for the CONUS for November 14-27, 2017.
|
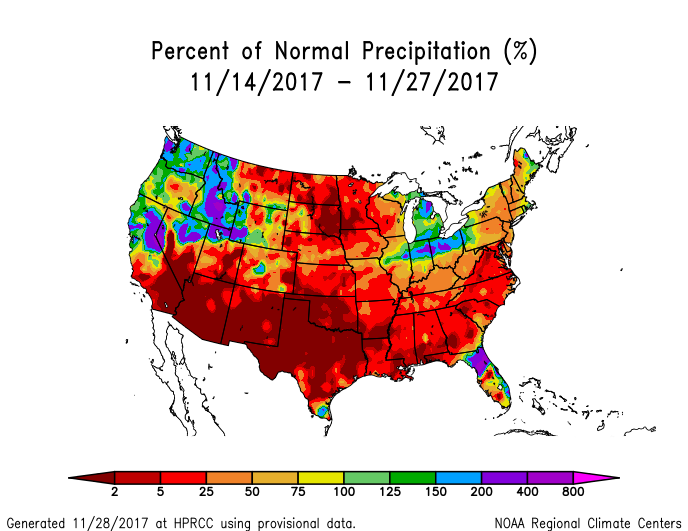 Precipitation anomalies (percent of normal) for the CONUS for November 14-27, 2017.
|
During the second half of the month, the circulation pattern shifted into a mostly upper-level ridge over the West with an enhanced trough over the eastern CONUS. Canadian cold fronts beneath the trough routinely plunged south to the Gulf of Mexico coast and beyond, resulting in below-normal temperatures for most of the CONUS east of the Mississippi River. Descending air (subsidence) beneath the upper-level ridge over the West kept skies sunny; this coupled with an associated southerly flow to bring well above-normal temperatures to the western and central CONUS. Pacific weather systems slammed into the western branch of the ridge, bringing above-normal precipitation to the Pacific Northwest, northern Rockies, and northern California. But the storms were directed to the north into Canada, leaving the Southwest and most of the Great Plains drier than normal. With a northwesterly flow over the central part of the country blocking Gulf of Mexico moisture, most of the CONUS from the Plains to East Coast was drier than normal. The exception, once again, was the southern Great Lakes, where enough moisture was squeezed out of the atmosphere by the low pressure weather systems to result in above-normal precipitation.
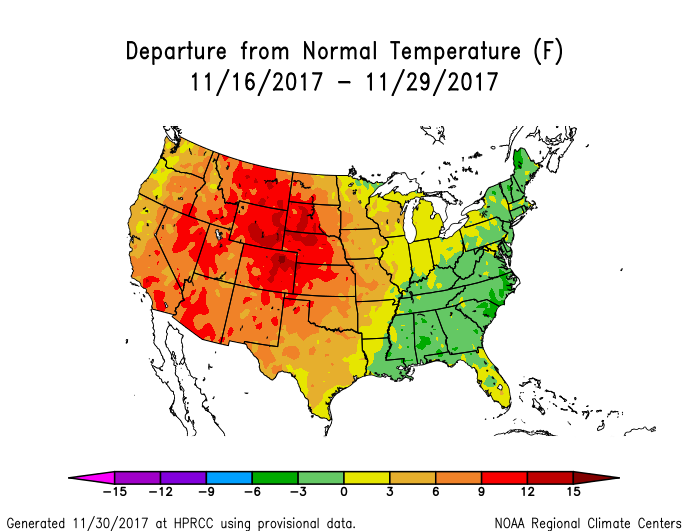
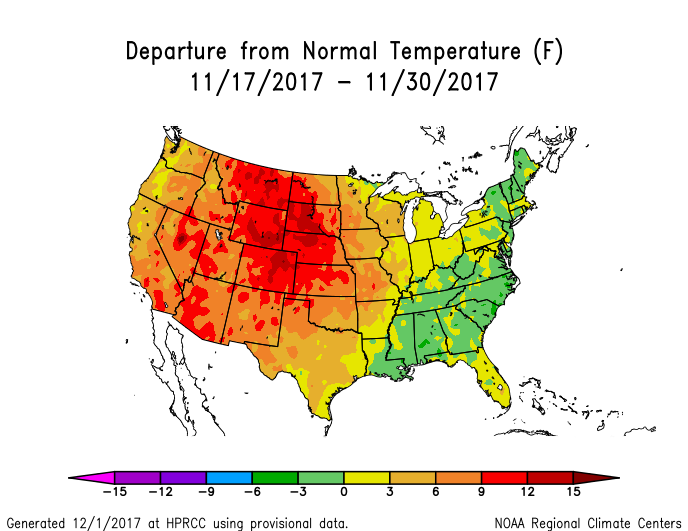
During the last three days of the month, the long-wave ridge/trough pattern broke down, but warmer-than-normal temperatures continued to dominate and slowly push the cold anomalies further to the east (2-week temperature anomaly maps for November 14-27, 15-28, 16-29, 17-30).
 500-mb mean circulation for the CONUS for November 2017.
|
 500-mb circulation anomalies for the CONUS for November 2017.
|
 Temperature anomalies (departure from normal) for the CONUS for November 2017.
|
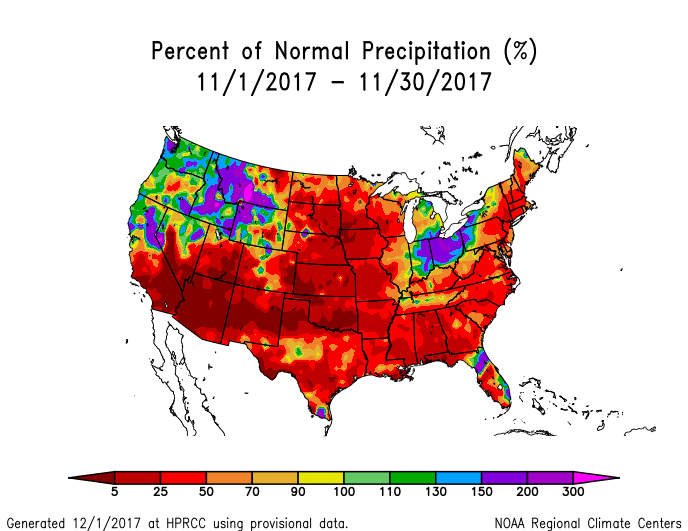 Precipitation anomalies (percent of normal) for the CONUS for November 2017.
|
When conditions are averaged across the entire month, the circulation anomalies associated with the western ridge tended to dominate the monthly pattern, while the monthly temperature anomaly pattern reflected a merging of the anomaly patterns of the two halves of the month. The precipitation anomaly patterns for the two halves were similar and tended to reinforce each other in the monthly precipitation anomaly pattern. The circulation during this month was also reflected in snow, drought, and regional records.
- Monthly temperatures were unusually warm across the southwestern third of the country. Nine states in the West and southern Plains had the tenth warmest, or warmer, November in the 1895-2017 record, including Arizona, Colorado, New Mexico, and Utah which were record warm.
- When daily temperature records are examined, the extreme warmth was more extreme, persistent, and/or widespread than the extreme cold. When integrated across the month, there were 7,319 record warm daily high (3,728) and low (3,591) temperature records. This was more than four times the 1,676 record cold daily high (931) and low (745) temperature records.
- As noted earlier, November marks the end of the Northern Hemisphere climatological autumn, which is the transition period between summer and winter when heating demand in the northern states increases while cooling demand in the southern states can still be significant. The atmospheric circulation this month began with a zonal pattern then shifted to a strong ridge over much of the country with above-normal temperatures, which resulted in the seventh warmest November nationwide. But the month ended with near- to below-normal temperatures in the high population centers of the Great Lakes, Northeast, and Mid-Atlantic regions, which kept heating demand near to above normal. The aggregate effect was a REDTI (Residential Energy Demand Temperature Index) value for November 2017 which ranked only 23rd lowest in the 123-year historical record for November.
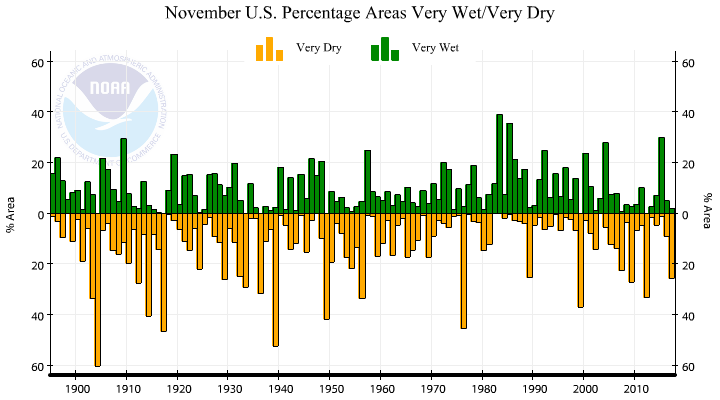
- With only the Pacific Northwest, northern Rockies, and part of the Midwest wetter than normal this month, most of the country was drier than normal. Thirty-five states ranked in the driest third of the historical record for November, including five states in the top ten driest category — Mississippi (third driest), Alabama (fourth driest), Arkansas (fourth driest), Oklahoma (fifth driest), and Louisiana (tenth driest). Parts of the southern Plains (in southeast Oklahoma) were record dry. A fourth (25.9 percent) of the country was very dry (had November precipitation in the driest tenth of the historical record). When averaged across the CONUS, November 2017 ranked as the 19th driest November in the 1895-2017 record.
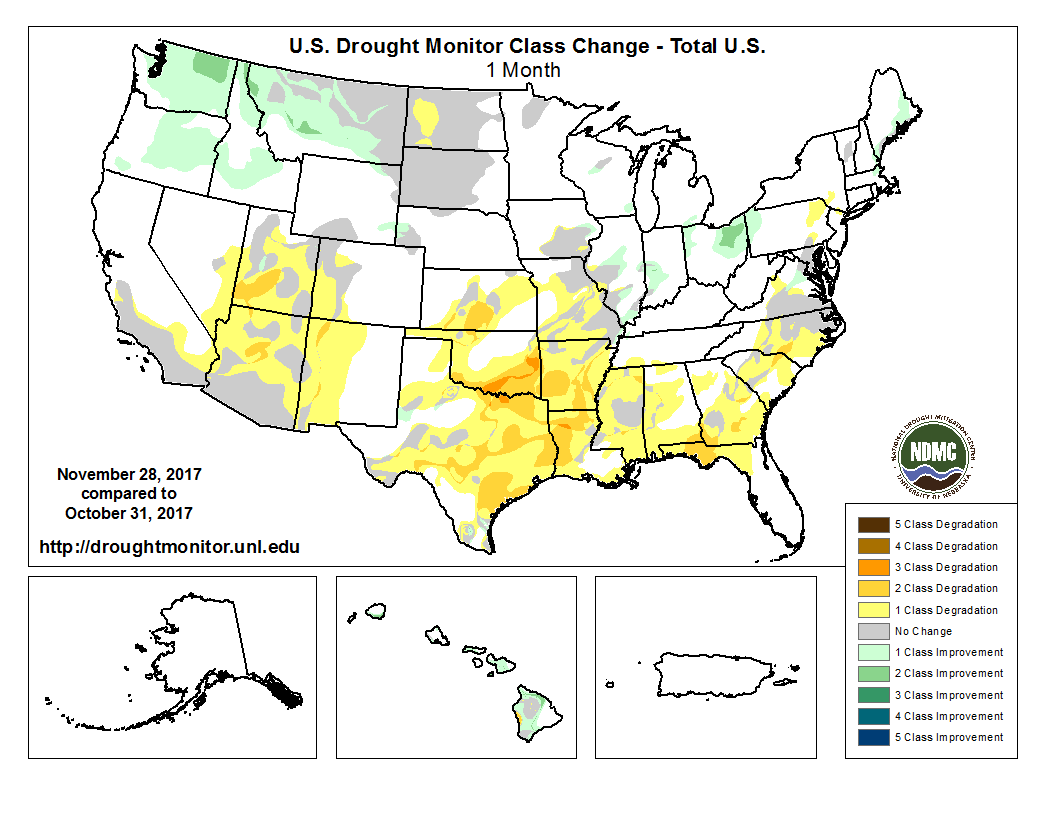
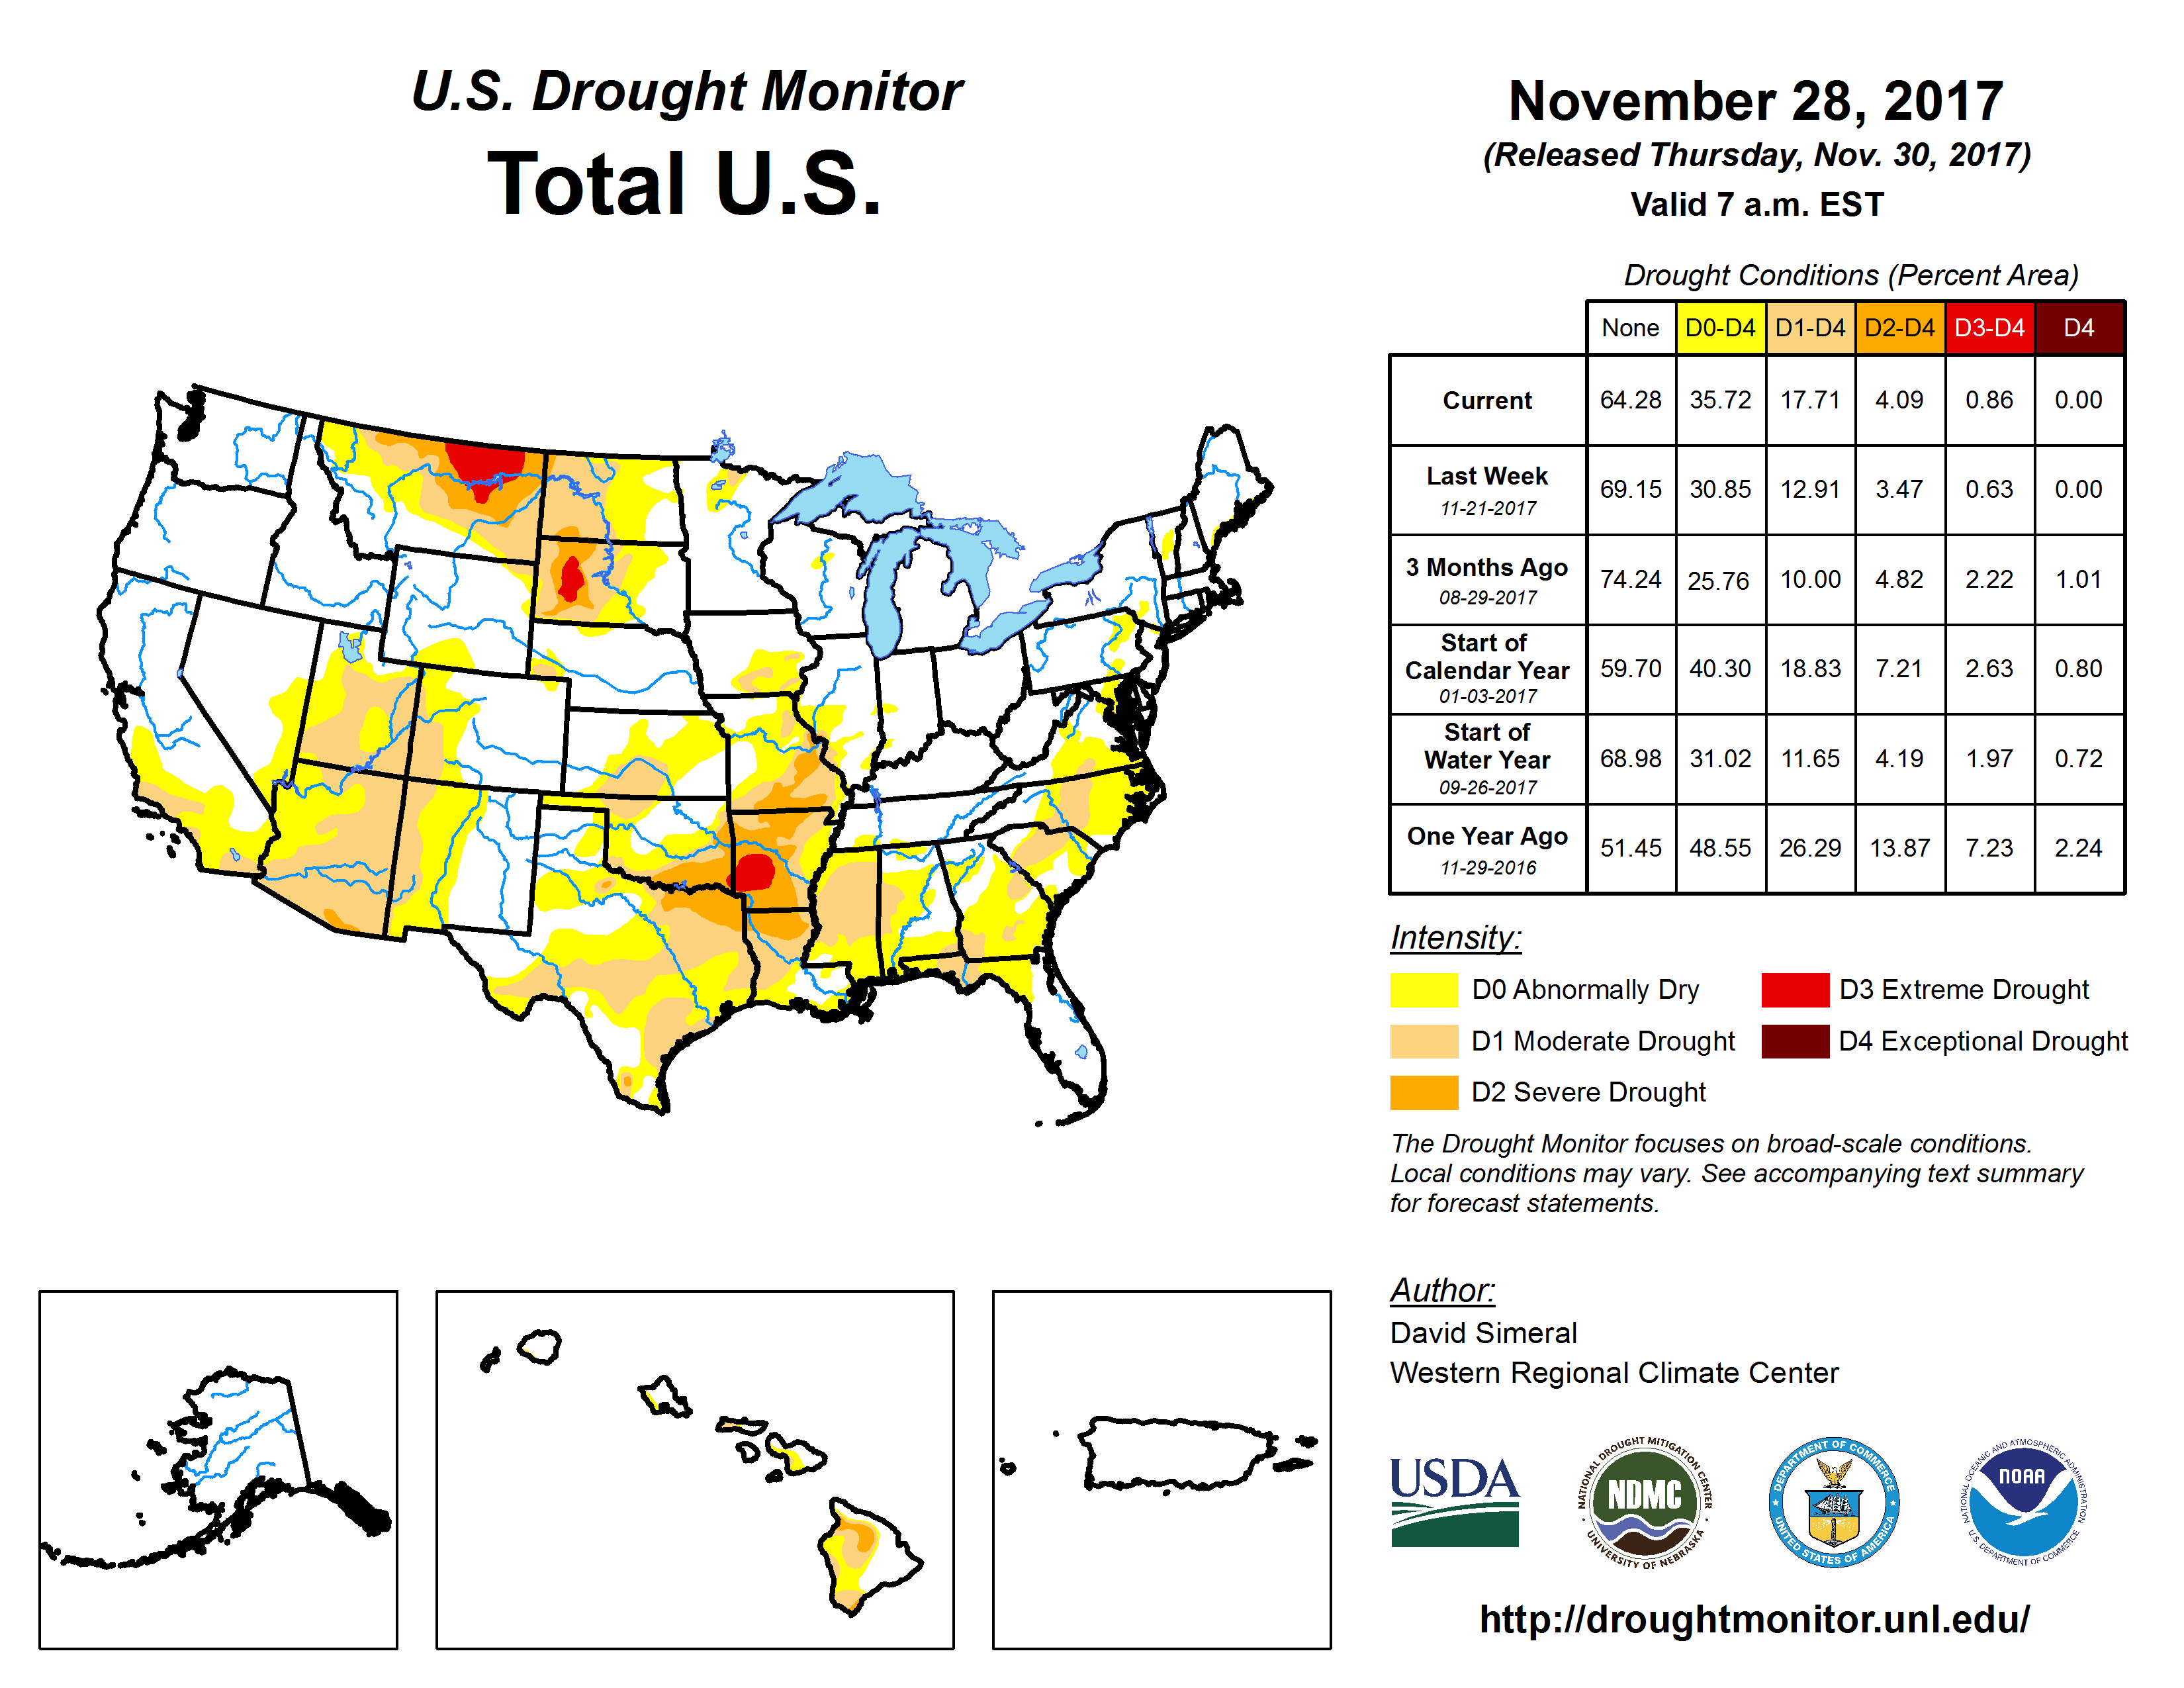
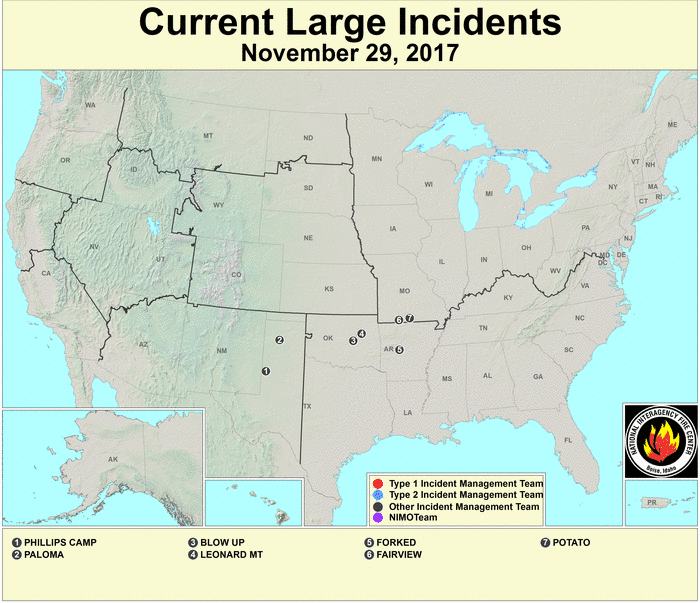
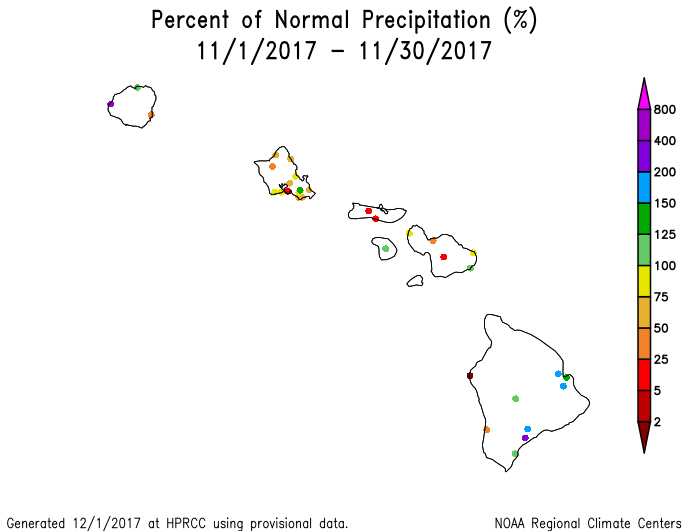
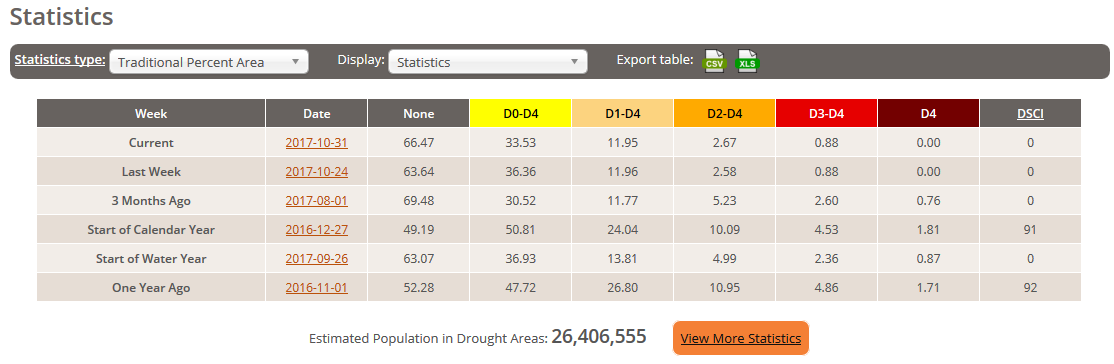
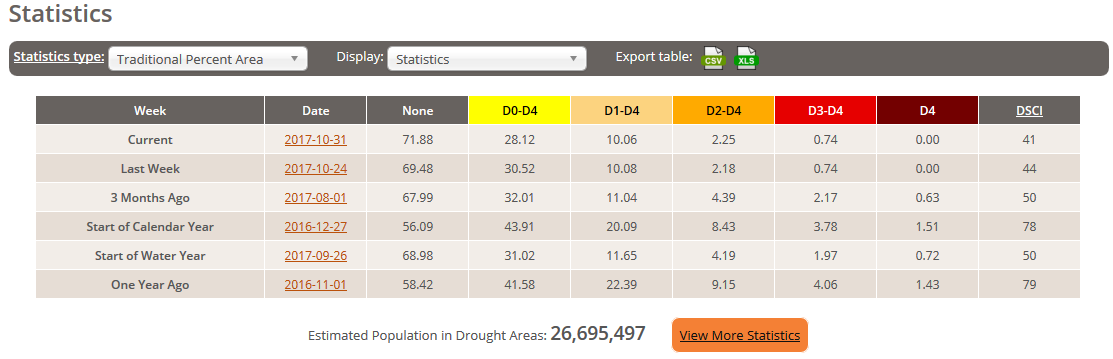
- The excessive warmth in the Southwest to southern Plains and Lower Mississippi Valley increased evapotranspiration which exacerbated the dry conditions, resulting in expansion of abnormal dryness and drought in these regions on the U.S. Drought Monitor (USDM) map. Abnormal dryness and drought also expanded in the Southeast to parts of the Northeast, where the month was dry. The hot and dry conditions in the southern Plains contributed to the development of several large wildfires near the end of the month. The above-normal precipitation in the Pacific Northwest, northern Rockies, and parts of the Midwest, and wet conditions over parts of Hawaii, helped to contract drought and abnormal dryness in those regions. But expansion outweighed contraction, so at the national level drought expanded from 12.0 percent of the CONUS at the end of October to 21.1 percent of the CONUS at the end of November (from 10.1 percent to 17.7 percent for all of the U.S.).
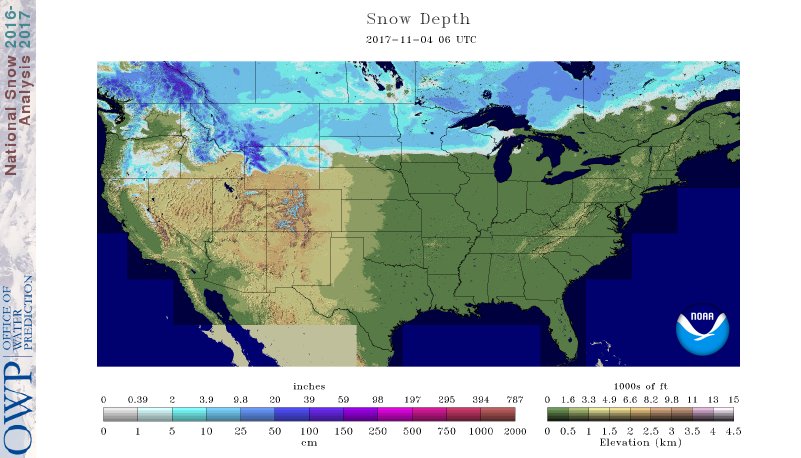
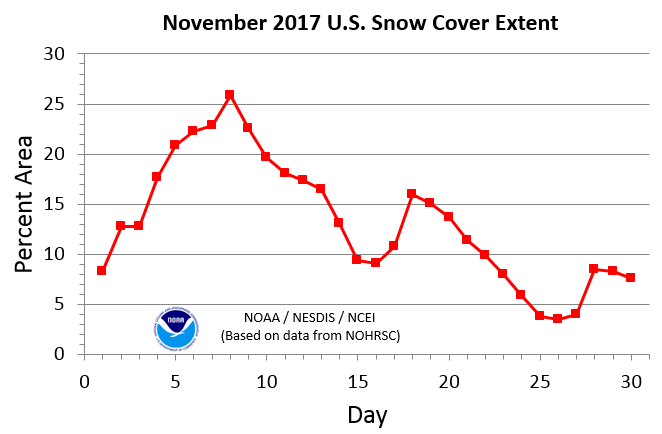
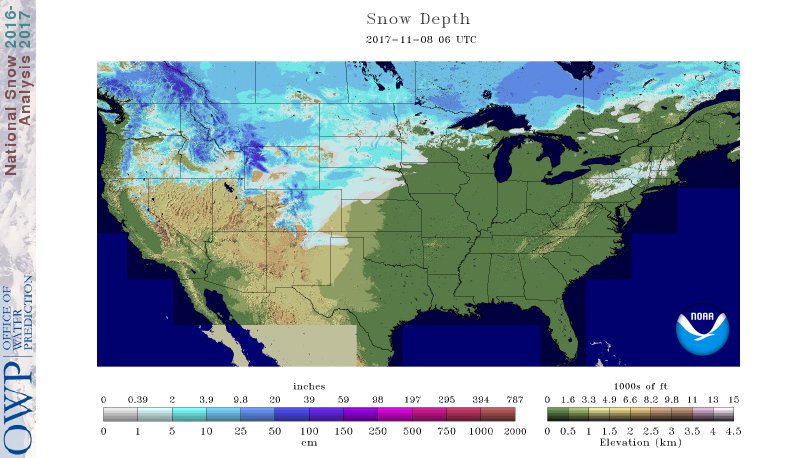
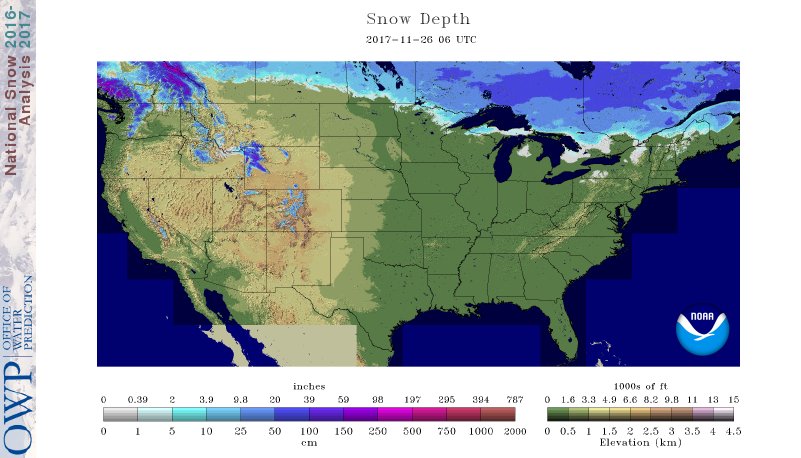
- As noted earlier, weather systems moving in the jet stream flow at the beginning of November brought Pacific moisture to the Pacific Northwest and northern Rockies. The zonal circulation pattern acted as a barrier between the warm air masses, which kept to the south, and cold air masses, which were bottled up over Canada. The Canadian air masses occasionally moved south with each weather system, bringing their below-freezing air in contact with the moisture and producing snow storms. These storms laid down a snow cover which mostly kept to the northern states. Snow cover area reached a maximum extent of 25.9 percent of the CONUS on the 8th when an upper-level short-wave trough combined with a surface low to expand the snow cover into the central Rockies and central Plains states. When the circulation shifted at mid-month to a pattern dominated by a western ridge, warmer air masses dominated, eroding the snow cover that had been established earlier and keeping the national coverage low. The minimum snow coverage of 3.5 percent of the CONUS occurred on November 26th. Snow cover, averaged across the month, was below normal across much of the CONUS, with above-normal areas keeping to the northern Rockies.
Typically tropical cyclone activity is enhanced in the Eastern North Pacific and inhibited in the North Atlantic during El Niños, and inhibited in the Eastern North Pacific and enhanced in the North Atlantic during La Niñas, due mostly to changes in vertical wind shear during the two extreme events. The relationship is unclear during ENSO-neutral events. The tropical Pacific Ocean continued in a weak La Niña state during November 2017. Both the Atlantic and East Pacific basins saw about average tropical cyclone activity. But this is late in the season for both of these basins when average activity is low.
- The Atlantic hurricane season runs from June 1st through November 30th and one tropical system (Tropical Storm Rina) was active in the North Atlantic during November. Rina stayed well out to sea, moving north and eventually becoming an extra-tropical storm.
- The Eastern North Pacific hurricane season runs from May 15th through November 30th. No tropical storms or hurricanes developed during November; however, far out in the Pacific west of Mexico, tropical disturbance 94E showed potential for a couple days at mid-month but never developed further.
- No tropical cyclones formed in, or moved into, the Central North Pacific.
- Three named tropical systems (Typhoon Damrey and Tropical Storms Haikui and Kirogi) and one tropical disturbance were active in the western Tropical Pacific near the U.S.-Affiliated Pacific Islands (USAPI) in Micronesia, but none of them had any significant effect on the USAPI. Damrey, Haikui, and Kirogi all developed west of the USAPI near the Philippines, then moved west to eventually make landfall on or near Vietnam. The tropical disturbance, 91W, developed within USAPI waters near Pohnpei at mid-month, but quickly dissipated.
The Climate Extremes Index (CEI) aggregates temperature and precipitation extremes across space and time. Although temperature and precipitation extremes occurred on a regional basis, they were not widespread enough to rank the national CEI in a top ten category for November. Even with the 12th most extreme warm minimum temperature component and 13th most extreme warm maximum temperature component, the national CEI ranked only 53rd most extreme for November. Of the nine CEI regions, only the Southwest region — with its most extreme warm minimum temperature component, third most extreme warm maximum temperature component, and 19th most extreme days without precipitation component — ranked in the top ten category regionally, having the second most extreme November CEI in the 1910-2017 record. The West region had the second most extreme warm minimum temperature component and 12th most extreme warm maximum temperature component; the East North Central region had the fifth most extreme wet spell component; and the Northeast region had the tenth most extreme 1-day precipitation component — but none of these regions had a regional CEI that was in the top ten category.
 North America monthly upper-level circulation pattern and anomalies. The upper-level circulation pattern during November, when averaged for the month, consisted of a ridge over the western CONUS and trough over the eastern CONUS. The ridge was the most significantly stronger than normal over the Southwest where the 500-mb height anomalies were largest. A deeper-than-normal trough was located over central to eastern Canada. |
|
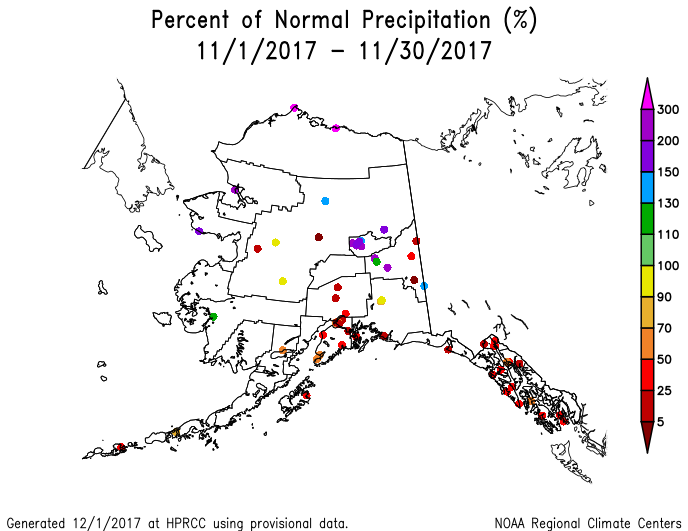
Map of monthly precipitation anomalies. November was wetter than normal across most of the Pacific Northwest to northern Rockies and parts of northern California, Florida, and the Midwest. But drier-than-normal weather dominated the rest of the CONUS. Alaska was wetter than normal in the west and north, but drier than normal in the south to southeast. In Hawaii, much of the Big Island was wetter than normal, but drier-than-normal weather dominated the stations on the rest of the islands. In Puerto Rico, November was wetter than normal at San Juan. |
|
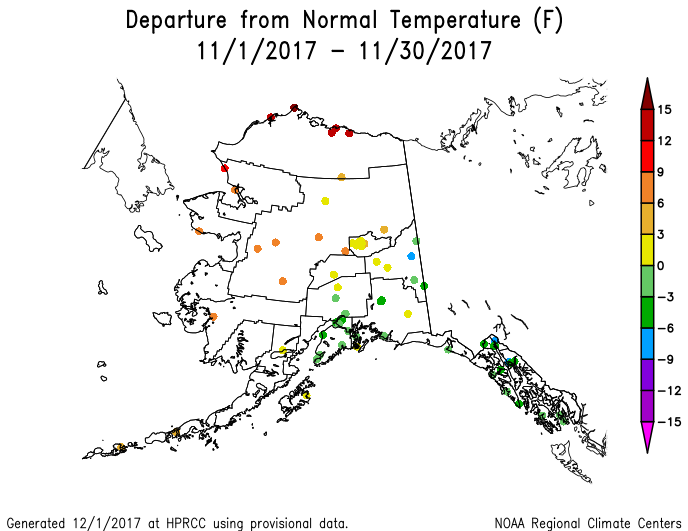
Map of monthly temperature anomalies. Monthly temperatures were warmer than normal across much of the West and Great Plains, and cooler than normal in the Northeast, Great Lakes, extreme northern Plains, and Mid-Atlantic coast. Alaska was warmer than normal in the north and west, and cooler than normal in the southeast. |
 Northern Hemisphere monthly upper-level circulation pattern and anomalies. Global Linkages: The upper-level (500-mb) circulation anomaly pattern over North America was part of a complex long-wave pattern that stretched across the Northern Hemisphere. East-west trough/ridge pairs (or couplets) and anomaly couplets could be found in the monthly maps, especially over Eurasia, North America/North Pacific, North America/North Atlantic/Europe, and Siberia/North Pacific; and latitudinally across North America (CONUS/Canada/Arctic). The above-normal 500-mb heights were associated with upper-level ridging at the mid-latitudes; below-normal precipitation (over southern CONUS and western Russia); below-normal snow cover (over the CONUS); above-normal surface temperatures over the southwestern CONUS, western Russia, and extreme eastern Siberia; and warm SST anomalies in the northern North Atlantic and north central North Pacific. The areas of below-normal 500-mb heights were associated with upper-level troughing; near- to below-normal surface temperatures over Canada and central to southeastern Siberia; cool SST anomalies in parts of the western North Pacific (Sea of Okhotsk); above-normal precipitation over Canada, northwest CONUS, and western Europe; and above-normal snow cover over much of Canada, Scandinavia, and northeast China. Large parts of Canada and Russia were near to cooler than normal. But with large parts of the continents still having warmer-than-normal temperatures, and large portions of the Atlantic, Pacific, and Indian Oceans having warmer-than-normal sea surface temperatures, the November 2017 global temperature was still above normal. |
Atmospheric Drivers
Subtropical highs, and fronts and low pressure systems moving in the mid-latitude storm track flow, are influenced by the broadscale atmospheric circulation. The circulation of the atmosphere can be analyzed and categorized into specific patterns. The Tropics, especially the equatorial Pacific Ocean, provides abundant heat energy which largely drives the world's atmospheric and oceanic circulation. The following describes several of these modes or patterns of the atmospheric circulation, their drivers, the temperature and precipitation patterns (or teleconnections) associated with them, and their index values this month:
-
El Niño Southern Oscillation (ENSO)
- Description: Oceanic and atmospheric conditions in the tropical Pacific Ocean can influence weather across the globe. ENSO is characterized by two extreme modes: El Niño (warmer-than-normal sea surface temperature [SST] anomalies in the tropical Pacific) and La Niña (cooler-than-normal SST anomalies), with the absence of either of these modes termed "ENSO-neutral" conditions.
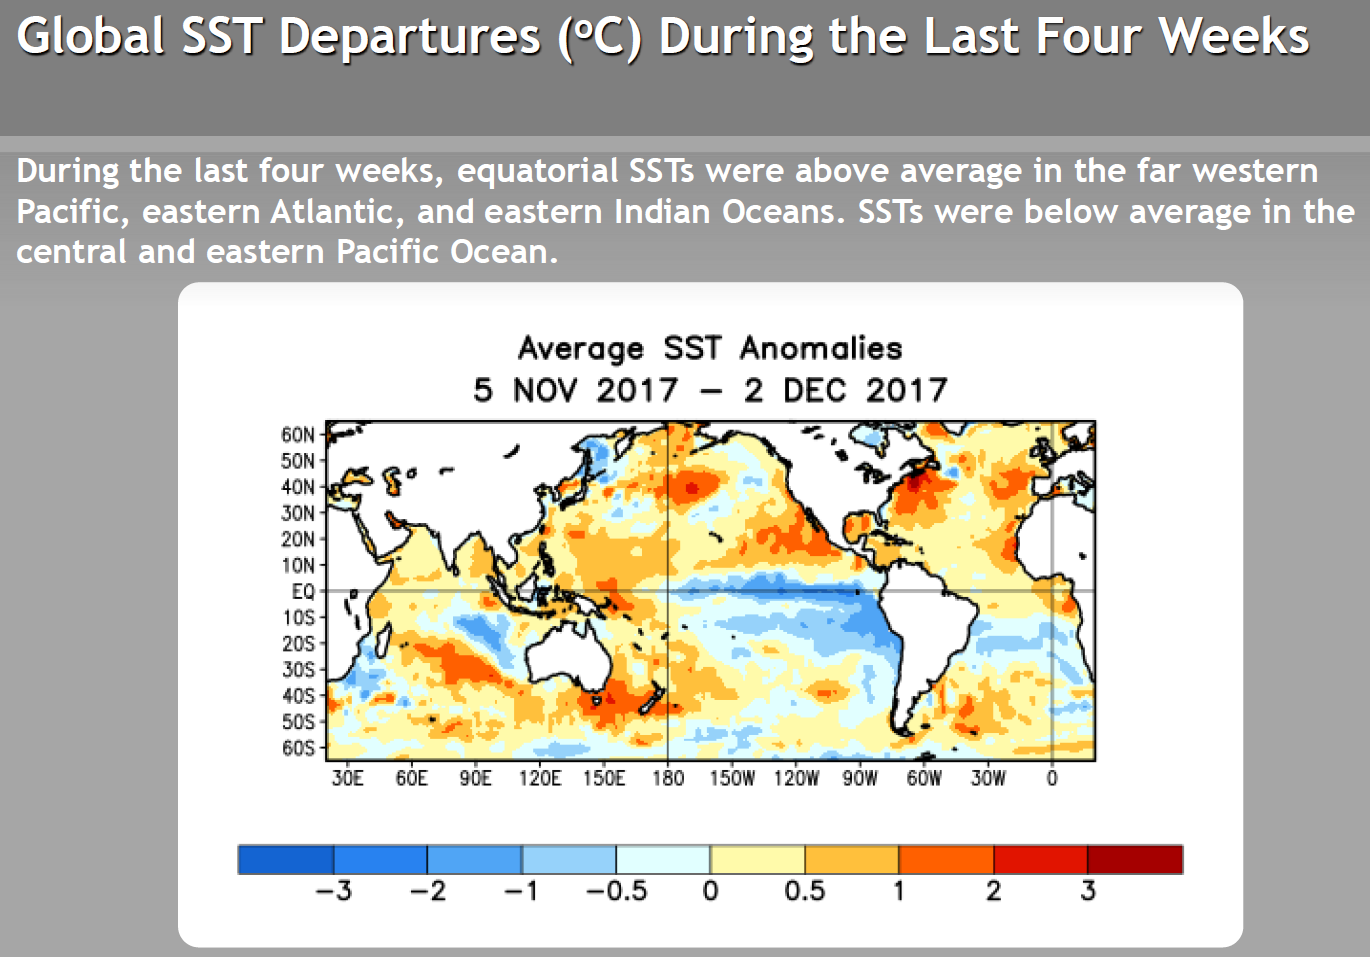
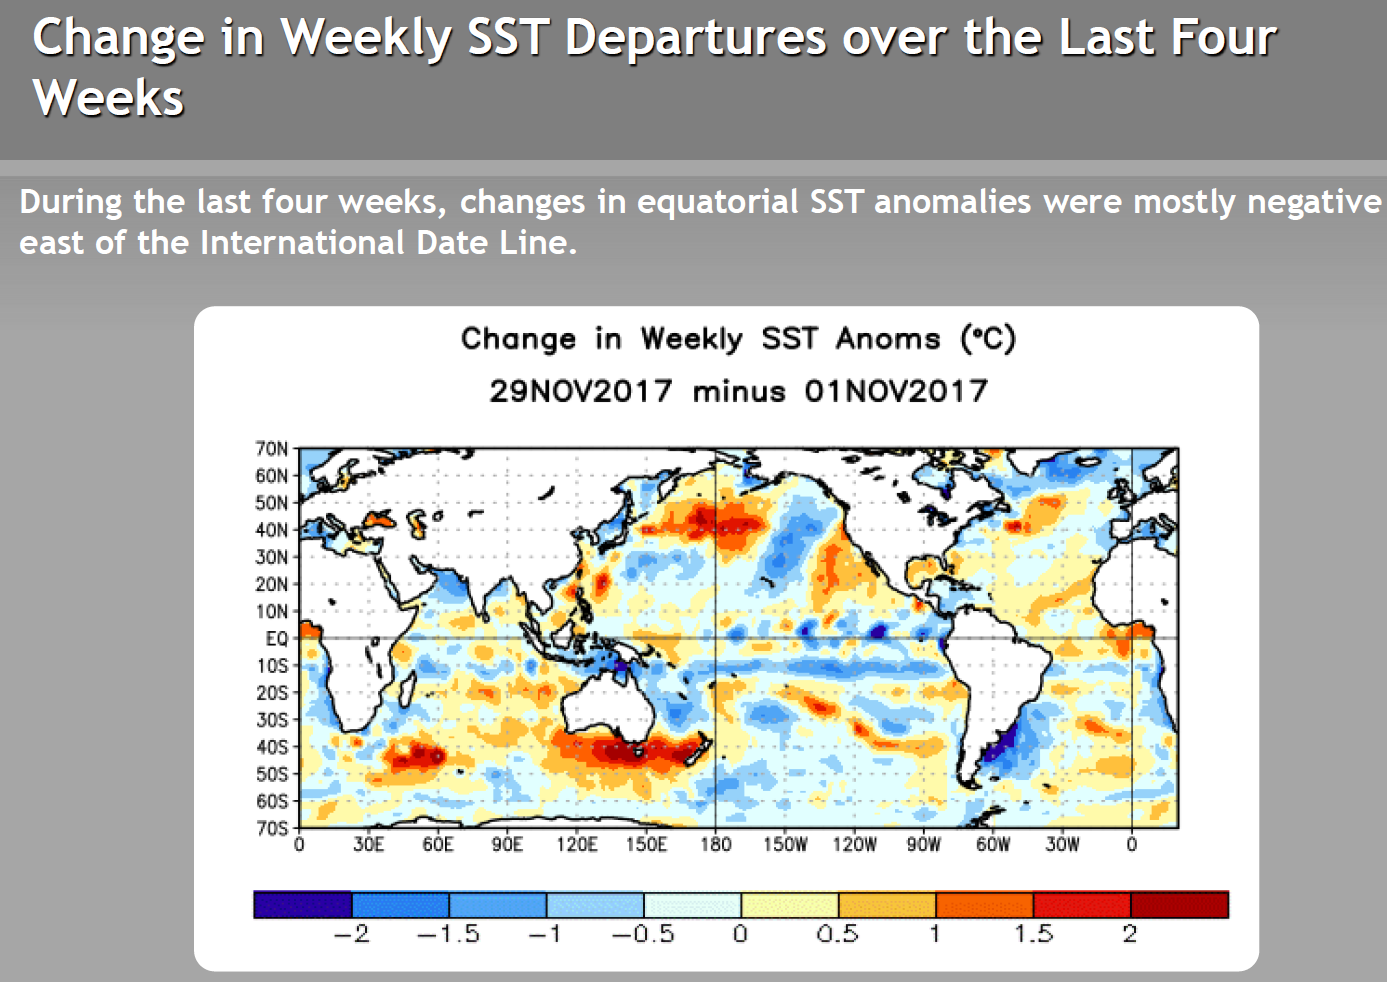
- Status: Weak La Niña conditions were present during November 2017 with below-average SSTs across the central and eastern equatorial Pacific Ocean.
- Teleconnections (influence on weather): To the extent teleconnections are known, the typical temperature and precipitation patterns associated with La Niña during November include above-normal temperatures across the Great Plains and into the adjoining Midwest and parts of the West, with near-normal temperatures to the west and east in the CONUS; above-normal precipitation in the Pacific Northwest to northern Rockies and northern California, and in parts of the Upper Mississippi Valley and eastern Great Lakes; and below-normal precipitation most everywhere else in the CONUS.
- Comparison to Observed: The November 2017 precipitation anomaly pattern is an almost perfect match to the teleconnections for La Niña. The November 2017 temperature anomaly pattern is a good match for the warm anomalies.
-
Madden-Julian Oscillation (MJO)
- Description: The MJO is a tropical disturbance or "wave" that propagates eastward around the global tropics with a cycle on the order of 30-60 days. It is characterized by regions of enhanced and suppressed tropical rainfall. One of its indices is a phase diagram which illustrates the phase (1-8) and amplitude of the MJO on a daily basis. The MJO is categorized into eight "phases" depending on the pattern of the location and intensity of the regions of enhanced and suppressed tropical rainfall. The MJO can enter periods of little or no activity, when it becomes neutral or incoherent and has little influence on the weather. Overall, the MJO tends to be most active during ENSO-neutral years, and is often absent during moderate-to-strong El Niño and La Niña episodes.
- Status: The MJO Wheeler-Hendon index spent most of the month inside the unit circle (i.e., was an incoherent signal), then moved into phase 4 during the last week of the month. Other aspects of the tropical ocean-atmosphere system (referred to in the CPC reports as the background or low frequency [i.e., La Niña] state, Kelvin and Rossby waves, and tropical cyclone activity) appeared to play a role in influencing the month's climate (especially Rossby waves and the base state, as well as Kelvin waves) (MJO updates for November 6, 13, 20, and 27).
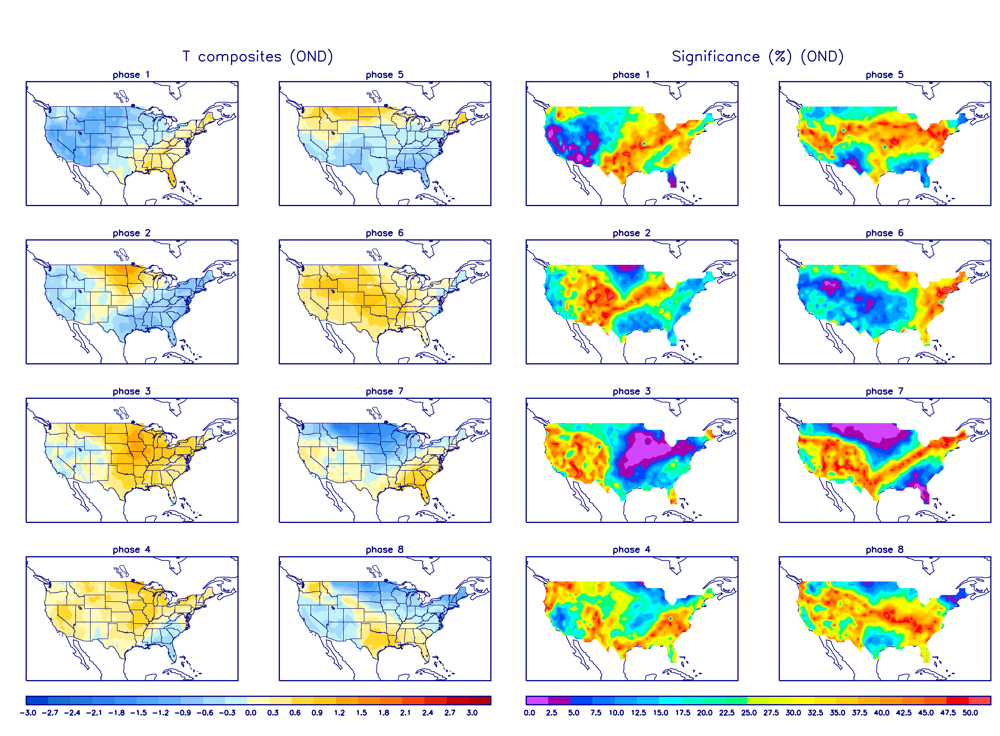
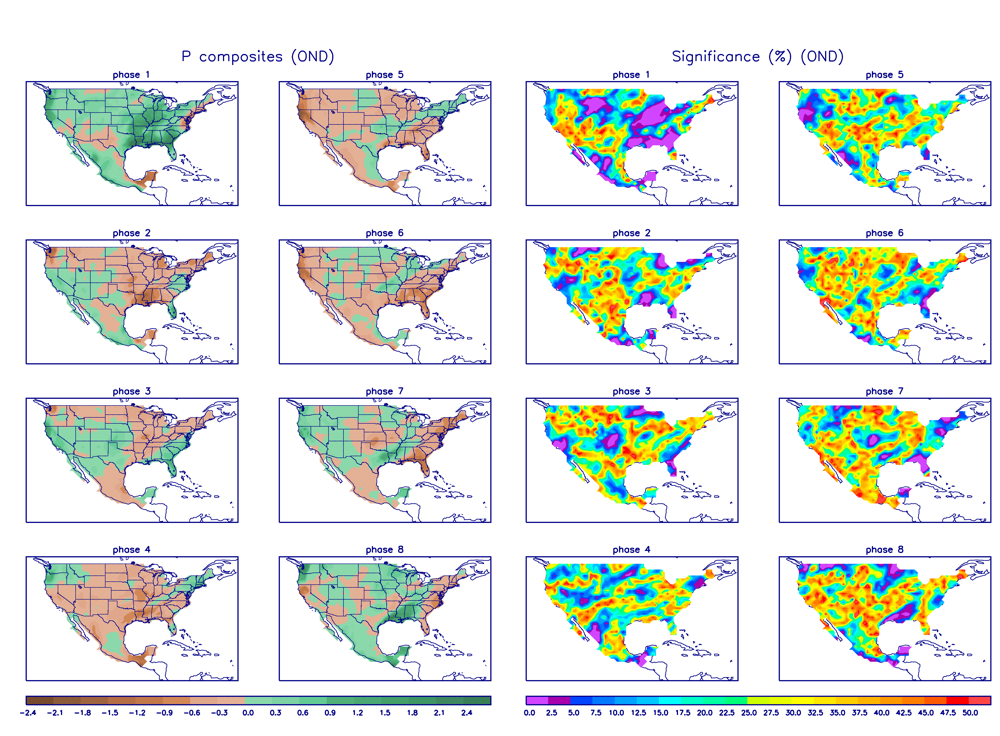
- Teleconnections (influence on weather): The MJO's temperature and precipitation teleconnections to U.S. weather depend on time of year and MJO phase. To the extent teleconnections are known, the November (October-December) teleconnections for temperature are shown here and for precipitation are shown here.
- Comparison to Observed: The MJO is transitory and can change phases (modes) within a month, so it is usually more closely related to weekly weather patterns than monthly. In the case of November 2017, the monthly temperature anomaly pattern bears some resemblance to the temperature teleconnection pattern for phase 4, while the last week of the month, when the MJO was in phase 4, is a very good match. Both the monthly precipitation anomaly pattern and the precipitation anomaly pattern for the last week of the month are a very good match to the precipitation teleconnection pattern for phase 4. It should be noted that the teleconnection patterns for La Niña and a phase 4 MJO this time of year are very similar; this suggests that they were in phase and reinforced one another or, as noted by CPC, the MJO phase 4 may have been a reflection of the La Niña, Rossby wave, and Kelvin wave drivers.
- The Pacific/North American (PNA) pattern
- Description: The PNA teleconnection pattern is associated with strong fluctuations in the strength and location of the East Asian jet stream. PNA-related blocking of the jet stream flow in the Pacific can affect weather downstream over North America, especially the West and especially in the winter half of the year.
- Status: The daily PNA index was negative for most of the month and near zero at the end of the month, averaging negative for the month as a whole. The 3-month-averaged index was negative.
- Teleconnections (influence on weather): To the extent teleconnections are known, a negative PNA for this time of year (October on the quarterly teleconnection maps) is associated with below-normal temperatures across Alaska, the West Coast, and western Canada; above-normal temperatures across the southern Plains and Southeast; below-normal upper-level circulation anomalies over western North America; above-normal upper-level circulation anomalies from Texas to the East Coast; and above-normal precipitation in the Midwest (although the precipitation teleconnections are weak).
- Comparison to Observed: The November 2017 upper-level circulation anomaly pattern is similar to the teleconnections for a negative PNA, except they are shifted to the west over North America. The precipitation anomaly pattern matches where there are teleconnections (Midwest), but the teleconnections are weak. The temperature anomaly pattern mostly doesn't match.
- The Arctic Oscillation (AO) pattern
- Description: The AO teleconnection pattern relates upper-level circulation over the Arctic to circulation features over the Northern Hemisphere mid-latitudes and is most active during the cold season.
- Status: The daily AO index was positive for the first half of the month and negative the last half, averaging near zero for the month. The 3-month-averaged index was slightly positive.
- Teleconnections (influence on weather): To the extent teleconnections are known, a near-zero AO in November (October-December in the AO Composites table) is typically associated with drier-than-normal conditions in the southern and central Plains to Mid-Atlantic Coast; near-normal moisture conditions elsewhere in the CONUS; above-normal temperatures in the northern Plains; near-normal temperatures elsewhere across the CONUS; and near-normal upper-level circulation anomalies over North America and the adjacent oceans (Arctic, North Pacific, North Atlantic).
- Comparison to Observed: The November 2017 monthly upper-level circulation and temperature anomaly patterns show little agreement with the teleconnections for a near-zero (neutral) AO. The precipitation anomaly pattern matches in most areas where the teleconnections show dryness, but not elsewhere.
- The North Atlantic Oscillation (NAO) pattern
- Description: The NAO teleconnection pattern relates upper-level circulation over the North Atlantic Ocean to circulation features over the Northern Hemisphere mid-latitudes.
- Status: The daily NAO index was positive during the first half of the month, negative during the last half of the month, and averaged near zero for the month. The 3-month-averaged index was slightly negative.
- Teleconnections (influence on weather): There are no teleconnections for a neutral (zero) NAO.
- The West Pacific (WP) pattern
- Description: The WP teleconnection pattern is a primary mode of low-frequency variability over the North Pacific and reflects zonal and meridional variations in the location and intensity of the (East Asian) jet stream in the western Pacific.
- Status: The monthly WP index was positive, as was the three-month average WP index.
- Teleconnections (influence on weather): To the extent teleconnections are known, a positive WP during this time of year (October on the quarterly teleconnection maps) is typically associated with above-normal temperatures from Alaska, across Canada, to the central Plains and Great Lakes; above-normal circulation anomalies over the north central CONUS to central Canada; below-normal circulation anomalies over the eastern North Pacific; above-normal circulation anomalies over the western North Pacific; below-normal circulation anomalies over eastern Siberia; and below-normal precipitation in the Pacific Northwest, western to south central Canada, the Great Lakes, and the Southeast.
- Comparison to Observed: The November 2017 monthly upper-level circulation anomaly pattern is a reasonable match over Siberia and the North Pacific, but not over North America where it seems shifted to the south. The precipitation anomaly pattern agrees in the southeastern CONUS but not the Pacific Northwest. The temperature anomaly pattern seems opposite to the teleconnections over most of North America.
- The East Pacific-North Pacific (EP-NP) pattern
- Description: The EP-NP teleconnection pattern relates SST and upper-level circulation patterns (geopotential height anomalies) over the eastern and northern Pacific to temperature, precipitation, and circulation anomalies downstream over North America. Its influence during the winter is not as strong as during the other three seasons.
- Status: North Pacific SSTs warmed during November in the northern North Pacific across the International Date Line and off the southern U.S. coast, but continued to cool in between those warming areas. The also continued cooling along the equatorial Pacific. The warming trend expanded the warmer-than-normal SSTs off the U.S. and Mexican coast, while the equatorial cooling was in line with the occurrence of La Niña. The average sea level pressure (SLP) field map and SLP anomaly field map indicated that the North Pacific's Aleutian Low was weaker than normal and shifted (split) to the west and east, and the North Atlantic's Icelandic Low was also weaker and shifted. The November 2017 monthly EP-NP index was positive, with the 3-month running mean near zero.
- Teleconnections (influence on weather): To the extent teleconnections are known, a positive EP-NP index this time of year (October on the quarterly teleconnection maps) is typically associated with cooler-than-normal temperatures across the CONUS from the Great Plains to East Coast (except the Southeast) and across central to eastern Canada; above-normal temperatures over Alaska; above-normal upper-level circulation anomalies (stronger upper-level ridge) over Alaska and western Canada; and below-normal upper-level circulation anomalies across central to eastern North America (stronger upper-level trough) and over the central North Pacific. The precipitation teleconnections are weak but suggest drier-than-normal conditions over the Pacific Northwest.
- Comparison to Observed: The November 2017 upper-level circulation anomaly pattern shows little agreement with the teleconnections for a positive EP-NP. The monthly temperature anomaly pattern mostly agrees but is shifted, while the precipitation anomaly pattern is opposite where the few teleconnections exist. However, there is better agreement over the CONUS when the last half of the month is considered for temperature and upper-level circulation.
Examination of the available circulation indices and their teleconnection patterns, and comparison to observed November 2017 monthly temperature, precipitation, and circulation anomaly patterns, suggest that La Niña had a strong influence on the weather over the CONUS in November, but that other drivers may have had some limited influence. Both the AO and NAO were positive during the first half of the month and negative during the second half, with the NAO averaging zero (neutral) for the month. The global monthly upper-level circulation anomaly pattern did not match the teleconnections for the AO and NAO, but the upper-level circulation anomaly pattern for the first half of the month was a reasonable match for the teleconnections for the positive phase of the AO and NAO, and the upper-level circulation anomaly pattern for the second half of the month was a reasonable match for the teleconnections for the negative phase of the AO and NAO. So the Arctic and North Atlantic drivers may have had some influence on the circulation on the short (weekly) time scales. But, since the temperature and precipitation anomaly patterns didn't match the AO and NAO teleconnections, other drivers must have been controlling those. The monthly circulation anomaly pattern showed some similarity to the teleconnections for the PNA and WP. The circulation and temperature anomaly patterns for the EP-NP have some similarity to the observed anomaly patterns for the last half of the month. But in each of these cases, the patterns were somewhat shifted. This suggests the North Pacific drivers may have had some broader-scale influence but that their influence was not ironclad. The temperature and precipitation anomaly patterns matched the teleconnections for La Niña very well, but they also matched the teleconnections for the MJO near the end of the month when the MJO was in phase 4. It is possible that the MJO and La Niña were in phase at that time and reinforced each other.
This month illustrates several things. First, it illustrates how the weather and climate anomaly patterns can be influenced by atmospheric drivers (or modes of atmospheric variability) originating in the equatorial Pacific Ocean. Second, it demonstrates how the circulation anomaly patterns can result from a complex interaction of many drivers operating at different time scales. Third, it shows the importance of selecting an appropriate time scale to examine and how signals can be masked when averaging over a monthly time scale.