 Hurricane Rita |
September 2005 Hurricane Rita raked the Florida Keys on the 20th and strengthened into a powerful category-5 on the Saffir-Simpson intensity scale in the open waters of the Gulf of Mexico by late on the 21st. Landfall as a category-3 hurricane occurred on the 24th at Sabine Pass, along the Texas-Louisiana border. Additional information can be found below. |

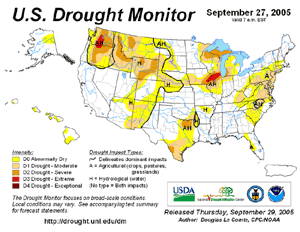
Across the United States, moderate to severe long-term drought persisted throughout parts of the Pacific Northwest eastward into the northern Rockies. Meanwhile, severe to extreme drought affected areas of the Mississippi Valley, where some of the worst conditions were observed in northwestern Illinois. |
 U.S. Drought Monitor |
For comprehensive drought analysis, please see the current U.S. drought report. Additional information on the western wildfires can be obtained from the 2005 wildfire season page. |
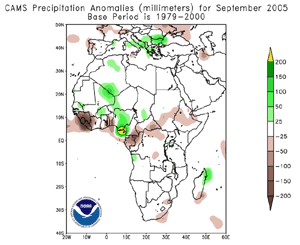
 African Rainfall Anomalies |
Long-term drought continued in parts of the Greater Horn and southern Africa, including southern Somalia southward into Mozambique, southern Malawi and eastern Zimbabwe. Water levels on Lake Victoria were 88 cm (~3 feet) below normal as of mid-September (near 45-year lows), due to below normal rainfall during the past year. For the latest African analysis and forecast, see the Famine Early Warning System Network. |
A multi-month drought continued into September in much of western Europe. Since the beginning of October 2004, rainfall has been less than half of normal in areas of the United Kingdom, France, Spain and Portugal. |
 Western Europe Drought |
 Australia Temperature Anomalies |
In Australia, mean temperatures during the month of September were 1.13°C (2.03°F) above the 1961-1990 normal, making it the tenth warmest September in the 1950-2005 record. (Australian Bureau of Meteorology) |


 Indonesia Landslides |
In West Sumatra, Indonesia, heavy rainfall produced landslides near Padang on the 2nd. There were 16 fatalities and at least 10 injuries. Over 200 people were evacuated from their homes (OCHA). |
Days of heavy rainfall during mid-September from a storm system in the Bay of Bengal caused extensive flooding along the east coast of India northeastward into Bangladesh. There were at least 66 fatalities in the Indian state of Andhra Pradesh (Reuters). |
 Flooding In India |
In Burma, heavy monsoon-related rainfall affected the southern coastal areas during the second week of September. Flooding and landslides affected the Thanintaryi division during the 14th-15th, resulting in at least 27 deaths (IFRC). |
 Costa Rica Flooding |
In Costa Rica, heavy rains in the latter half of the month produced flooding that resulted in 8 fatalities (OCHA). |


Severe thunderstorms in the central United States on the 13th resulted in numerous reports of wind damage and as many as four tornadoes in Michigan, Wisconsin, Iowa, Missouri, Kansas and Oklahoma. |
 U.S. Severe Weather On September 13 |


For information on Hurricane Katrina which made landfall in August 2005 in southeastern Louisiana and southern Mississippi, see the August Hazards and Significant Events page. |
 Satellite Image Of Talim |
Typhoon Talim developed in August and affected Taiwan before making landfall in southeast China's Fujian province on the 1st as a tropical storm. Maximum sustained winds at the time of landfall were near 100 km/hr (55 knots or 65 mph). The storm caused significant flooding across the provinces of Fujian, Zhejiang, Anhui, Jiangxi, Henan and Hubei during September 1-3. There were at least 129 deaths from the storm and over 100,000 housing units destroyed. The storm and its associated flooding was responsible for the evacuation of 1.84 million people and the loss of over 260,000 hectares (640,000 acres) of crops (OCHA). |
Typhoon Nabi developed in the western Pacific Ocean on August 29, reaching typhoon strength by 31st. Nabi reached Kyushu in Japan on September 6 with maximum sustained winds near 165 km/hr (90 knots or 105 mph). The storm weakened below tropical storm strength on the 7th, but very heavy rain fell along its path before dissipation over the Sea of Japan. |
 Satellite Image Of Nabi |
 Satellite Image Of Khanun |
Typhoon Khanun developed as a depression in the western Pacific Ocean before reaching typhoon intensity on the 8th as it tracked to the northwest. Khanun moved into the East China Sea on the 10th, making landfall in China's Zhejiang province on the 11th with maximum sustained winds near 165 km/hr (90 knots or 105 mph). |
Hurricane Ophelia initially developed as tropical depression near Freeport, Bahamas on the 6th, reaching tropical storm strength by the 7th. While remaining offshore, the storm brought gusty winds and heavy rains to the east-central coast of Florida before moving to the northeast. Ophelia reached category-1 hurricane status by the 8th, and skirted the North Carolina coast during September 14-15, with hurricane-force wind gusts along the coastline from Cape Fear to Cape Lookout. Around 100,000 people lost power, and rainfall amounts of 250-305 mm (10-12 inches) were common along the immediate coastal areas. |
 Radar Animation Of Ophelia |
 Radar Animation Of Hurricane Rita |
Hurricane Rita developed as a depression just east of the Turks and Caicos islands on the 18th, reaching tropical storm strength later the same day. Hurricane intensity was achieved on the 20th as Rita tracked through the Florida Straits and just south of the Florida Keys. Winds were sustained at tropical storm force at Key West, where peak winds gusted to 122 km/hr (66 knots or 76 mph). |
Rita emerged into the Gulf of Mexico on the 21st, undergoing a period of rapid intensification. By 0300 UTC on the 22nd (11PM EDT on the 21st), the pressure dropped to 897 millibars (26.49 inches of mercury), or the third-lowest pressure on record in the Atlantic. The two lowest pressures were recorded in the eye of Hurricane Gilbert in 1988 (888 millibars) and in the Labor Day Hurricane of 1935 (892 millibars). This marked the first time in the historical record that two hurricanes have reached category-5 intensity in the Gulf of Mexico in a single season (Katrina and Rita). |
 Hurricane Rita |
Rita continued to the northwest and weakened, but reached the Texas/Louisiana border area near Sabine Pass early on the 24th as a category-3 hurricane with maximum sustained winds near 195 km/hr (105 knots or 120 mph). A storm surge of at least 4.6 meters (15 feet) flooded parts of Cameron, Jefferson Davis, Terrebonne and Vermilion parishes, where sugar cane crop losses were estimated near $300 million (Reuters). A 2.4 meter (8-foot) storm surge in New Orleans overtopped the provisionally-repaired levees (from Hurricane Katrina damage) and caused additional flooding. A total of 10 fatalities were reported, and preliminary damage estimates ranged between $4-5 billion (AFP). |
 Hurricane Rita Near LA/TX Border |
For additional analysis, please see the Hurricane Rita summary page. |
 Typhoon Damrey |
Typhoon Damrey developed east of the northern Philippines in the Philippine Sea on the 20th, skirting the northern part of that country on the 21st. Typhoon status was achieved by the 24th as Damrey moved across the South China Sea. The typhoon passed over Hainan island on the 25th, reaching the coast with maximum sustained winds near 160 km/hr (85 knots or 100 mph). Chinese officials described Damrey as the worst typhoon to strike Hainan in decades (BBC News). Damrey continued westward, making a second and final landfall as a tropical storm in northern Vietnam on the 27th near Thanh Hoa with maximum sustained winds near 100 km/hr (55 knots or 65 mph). Flooding was responsible for the majority of the loss of life, with a total of 145 deaths from the storm (59 in Vietnam, 16 in the Philippines, 16 in southern China, 3 in Thailand and 51 in Nepal) (OCHA/AFP). |
Typhoon Saola developed in the western Pacific Ocean on the 20th, reaching typhoon strength the next day. Saola passed about 160 km (100 miles) northeast of the island of Iwo Jima on the 22nd with maximum sustained winds near 140 km/hr (75 knots or 85 mph). Saola curved just east of Japan during the 25th-26th. |
 Typhoon Saola |
Hurricane Otis brushed portions of the Mexican coastline with heavy rains and gusty winds, although the storm never made landfall. For more information on Otis and eastern Pacific tropical storms and hurricanes, see the Eastern Pacific Hurricane page. |
For 2005 basin tropical cyclone statistics, please refer to the
following:
|


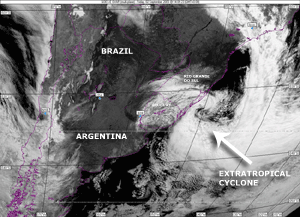
 Storm System Affects Brazil |
A strong mid-latitude storm system affected southern Brazil and adjacent areas of Uruguay during early September. In the Brazilian state of Rio Grande do Sul, strong winds on the 2nd produced thousands of power outages in the city of Porto Alegre. Coastal areas observed the strongest winds, with peak gusts of 111 km/hr (69 mph) observed at Rio Grande. |


In southern Brazil on September 12-13, snow and freezing rain fell in the city of Sao Joaquim in Santa Catarina state. The last occurrence of freezing rain in Sao Joaquim was in 1984. Farther north in Rio Grande do Sul state, a trace of snow was recorded in Barra do Quarai. This was the first recorded snowfall in the southwestern portion of Rio Grande do Sul state during the month of September. |
 Freezing Rain In Southern Brazil |
 NOAA's National Centers for Environmental Information
