Note: This Synoptic Discussion describes recent weather events and climate anomalies in relation to the phenomena that cause the weather. These phenomena include the jet stream, fronts and low pressure systems that bring precipitation, high pressure systems that bring dry weather, and the mechanisms which control these features — such as El Niño, La Niña, and other oceanic and atmospheric drivers (PNA, NAO, AO, and others). The report may contain more technical language than other components of the State of the Climate series.
Summary
The Earth's ocean-atmosphere system was technically in an ENSO-neutral state during August 2017. An upper-level ridge dominated the western half of the contiguous United States (CONUS) with attendant warmer- and drier-than-normal weather, which continued conditions for an active wildfire season. An upper-level trough set up over the eastern CONUS and its associated short-wave troughs, fronts and low pressure systems brought cooler-than-normal weather. Parts of the Plains, South, and Mid-Atlantic regions had wetter-than-normal weather due to rain associated with the fronts and troughs, and Hurricane Harvey inundated eastern Texas and the Lower Mississippi Valley at the end of the month. Drought and abnormal dryness expanded and intensified in the Pacific Northwest and High Plains of Montana under the relentless heat and dryness, but storms in the Plains contracted drought areas, especially in the hard-hit Dakotas. The fronts and lows, and especially Hurricane Harvey, generated rounds of severe weather, with more than the average number of tornadoes occurring. Without ENSO-related inhibitors shearing tropical systems, the Atlantic and East Pacific basins saw more active tropical cyclone activity than average. The upper-level circulation, temperature, and precipitation anomaly patterns suggested that the atmospheric drivers originating in the subtropical North Pacific may have had an influence on the month's weather. See below for details.
Synoptic Discussion
 Animation of daily upper-level circulation for the month.
|
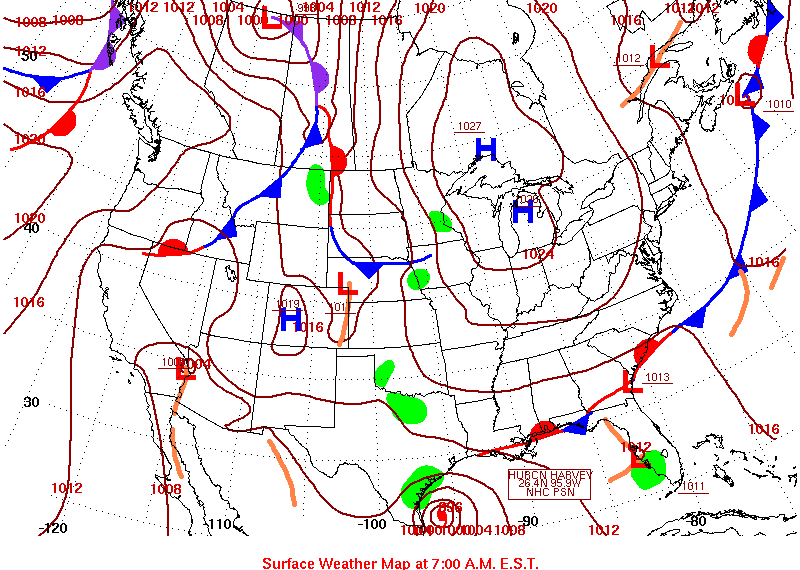
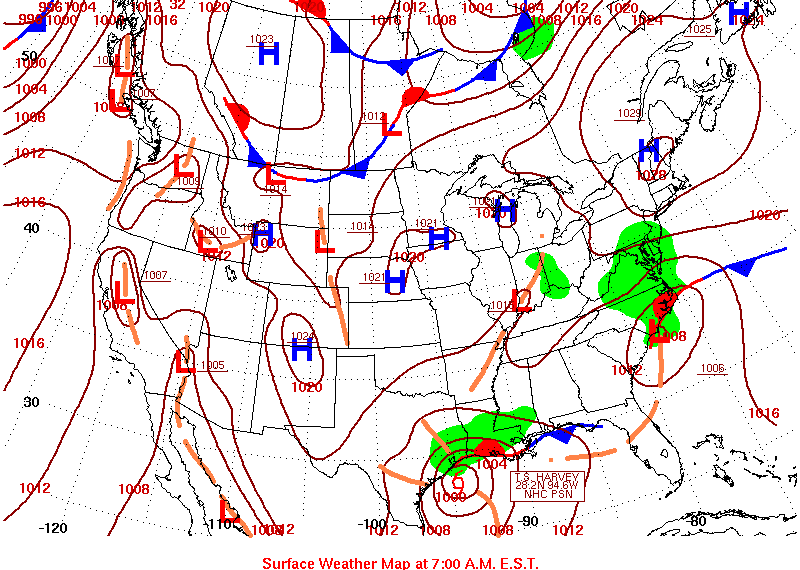
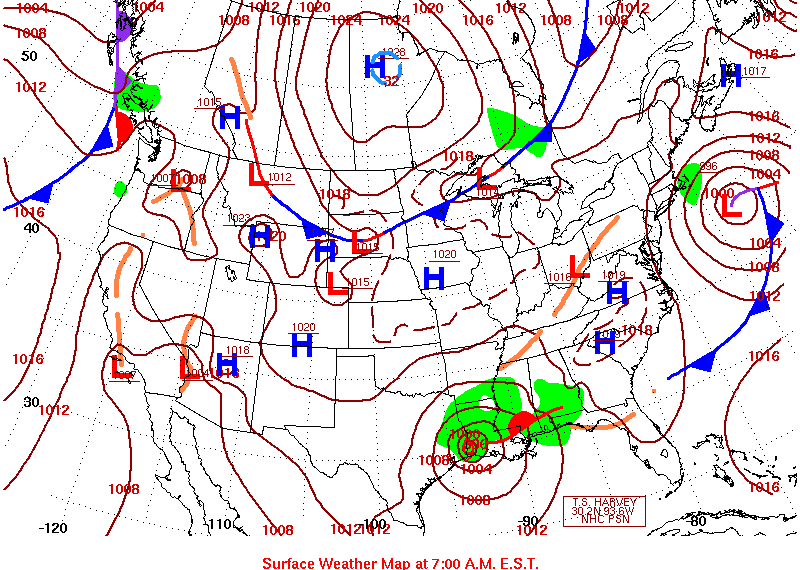
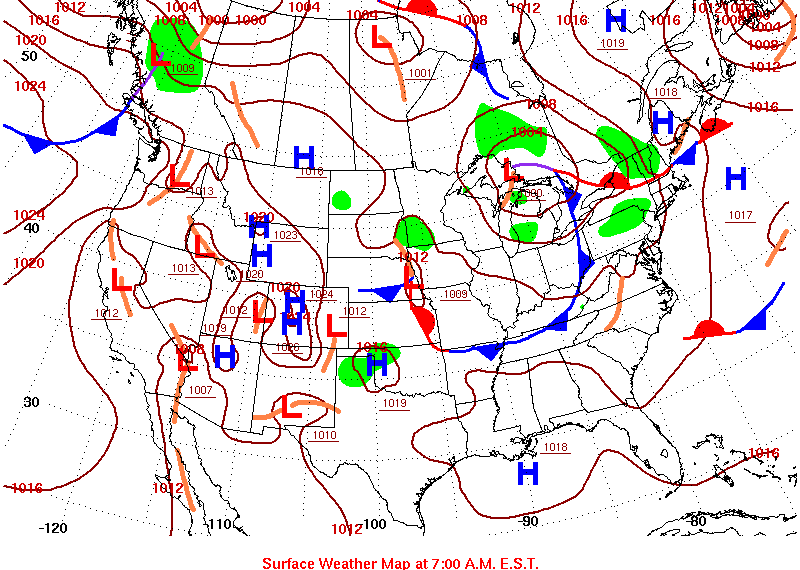
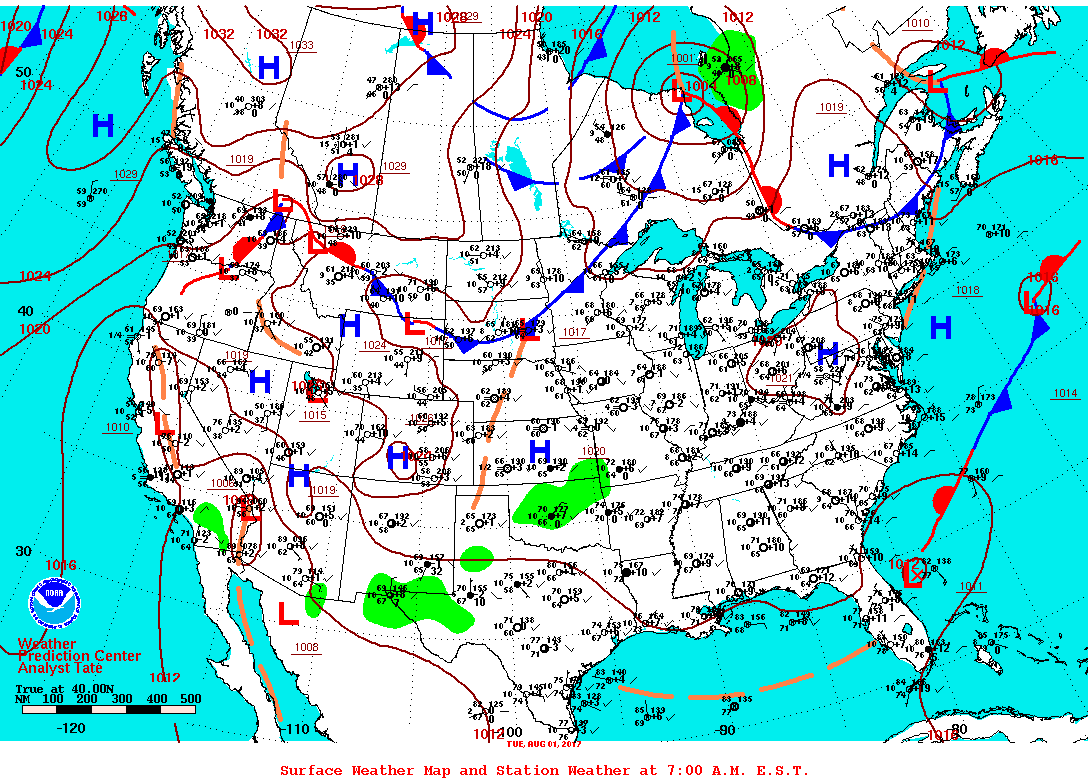 Animation of daily surface fronts and pressure systems for the month.
|
In the Northern Hemisphere, August marks the end of climatological summer which is the time of year when solar heating is at maximum with the high sun angle, arctic air masses are weakest, and the circumpolar vortex and jet stream have retreated far northward. Polar air masses influence the weather over the contiguous U.S. (CONUS) less, and the warm, dry subtropical high pressure belts dominate the weather.
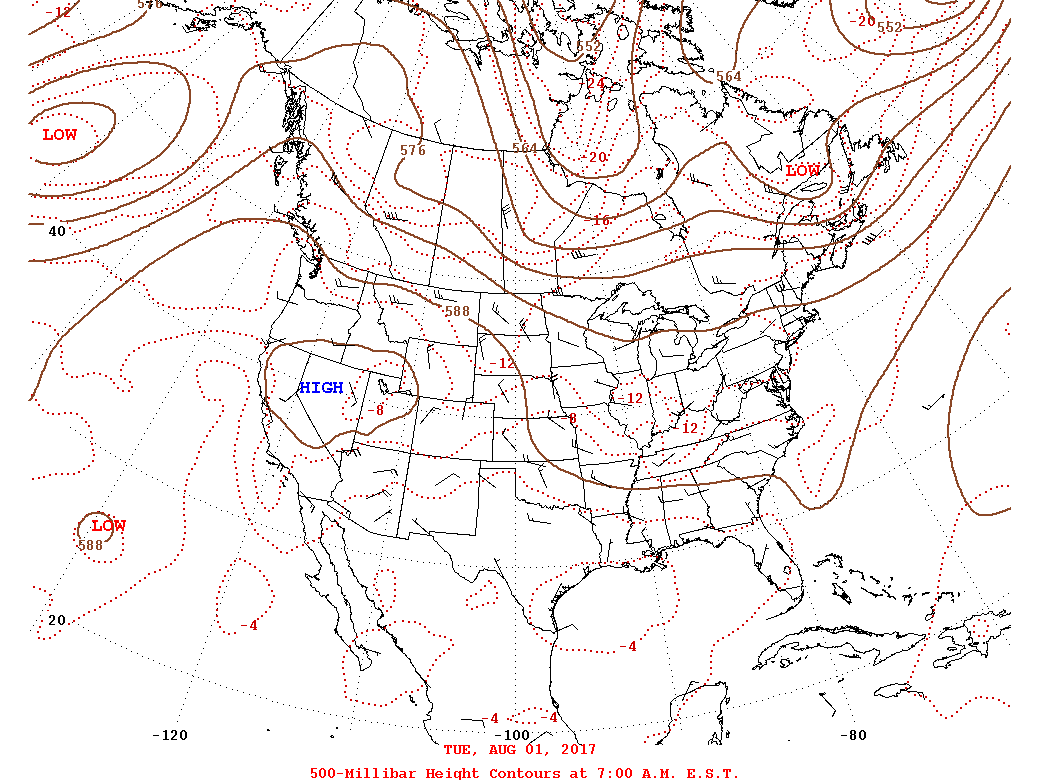
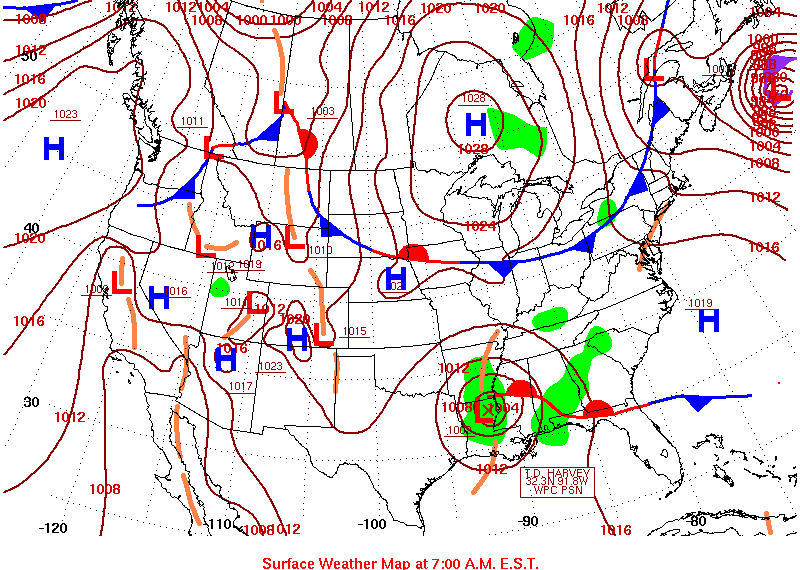
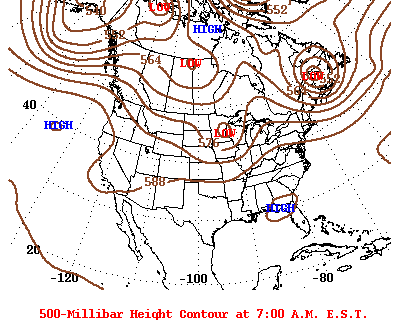
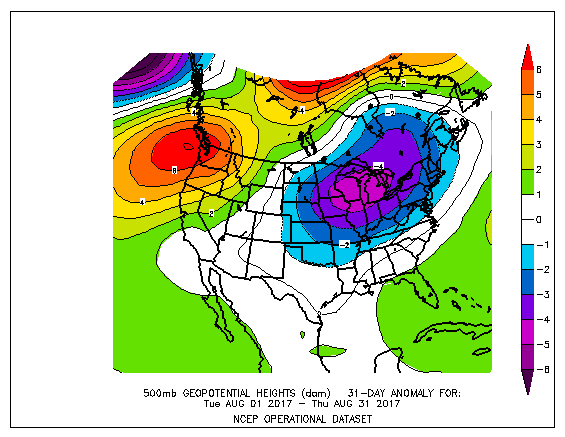
During August 2017, however, the atmospheric circulation was highly meridional. Strong short-wave troughs dragged Canadian air masses southward across the eastern and central CONUS, resulting in well-below-normal temperatures, while ridging dominated in the West. The resulting long-wave circulation pattern, averaged over the month, consisted of a trough over the eastern CONUS and a ridge over the western CONUS. And at the surface, the North Atlantic High (Bermuda High) and North Pacific High were near normal strength.
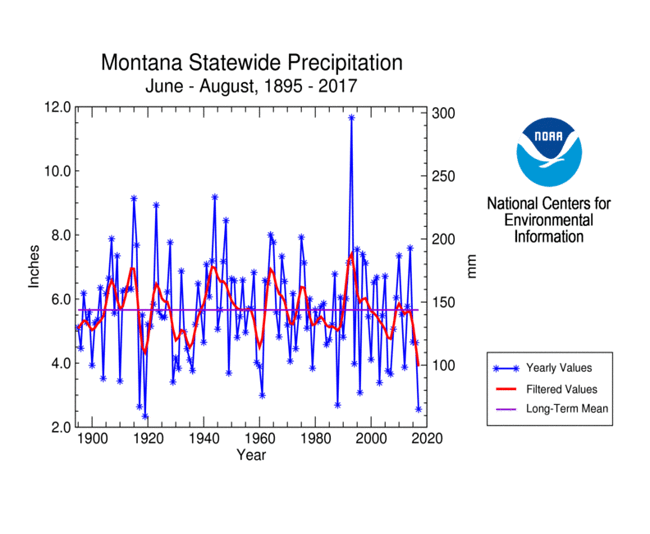
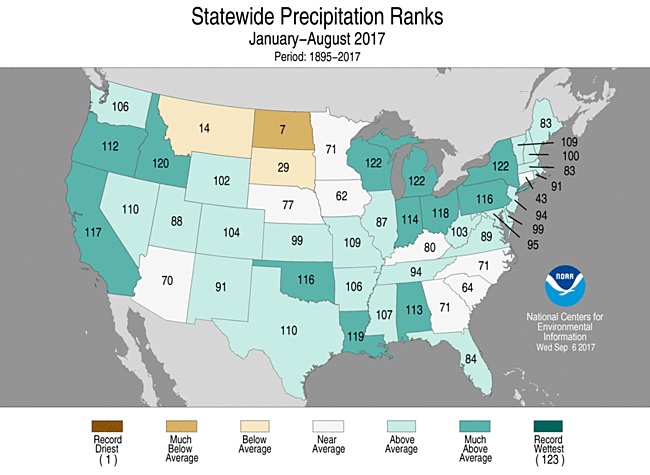
- The dynamics associated with the long-wave ridge kept most of the West warmer and drier than normal. The fronts and surface low pressure systems, that were dragged along with the short-wave troughs moving in the jet stream flow, stayed mostly to the north and dried out as they traversed the western CONUS long-wave ridge. When they moved into the favorable dynamics of the long-wave trough, the fronts and surface lows generated showers and thunderstorms across parts of the Plains. When they penetrated deeper into the South, they tapped Gulf of Mexico moisture to bring rain to parts of the Southern Plains to Southeast. Hurricane Harvey meandered over the Texas coast and Lower Mississippi Valley near the end of the month, dumping record-breaking torrential rains. Much of the Midwest, from the Ohio River to Lower Great Lakes, was affected by an upper-level northwesterly flow which funneled the drier Canadian air masses across the region before they could tap Gulf of Mexico or Atlantic moisture. In addition, the short-waves frequently tracked the surface lows and their rain shield across the northern Great Lakes and southern Canada. The result was a drier-than-normal month for this region. On a statewide basis, the circulation and precipitation pattern this month left Montana with the eleventh driest August in the 1895-2017 record and Rhode Island with the twelfth driest August. On the other end of the scale, the rain in the southern Plains and Lower Mississippi Valley ranked five states in the top ten wettest category — Texas (wettest August on record), Louisiana (second wettest), Oklahoma (third wettest), Mississippi (eighth wettest), and Arkansas (tenth wettest). The overall circulation and precipitation anomaly pattern gave the CONUS the seventh wettest August on record.
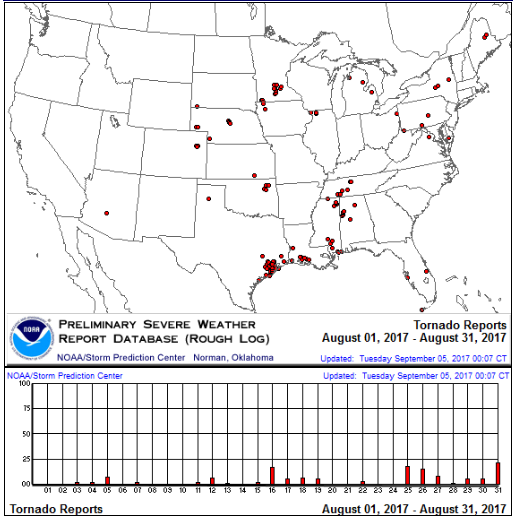
- The cold fronts and low pressure systems combined with the upper-level troughs to create unstable air and dynamics favorable for severe weather. Significant tornado outbreaks occurred on August 18th, in association with an Upper Midwest trough and surface low/frontal system, and on the 25th-27th and 31st, in association with Tropical Cyclone Harvey. Based on preliminary data, there were 133 tornadoes this month, which is well above the August average of 83.
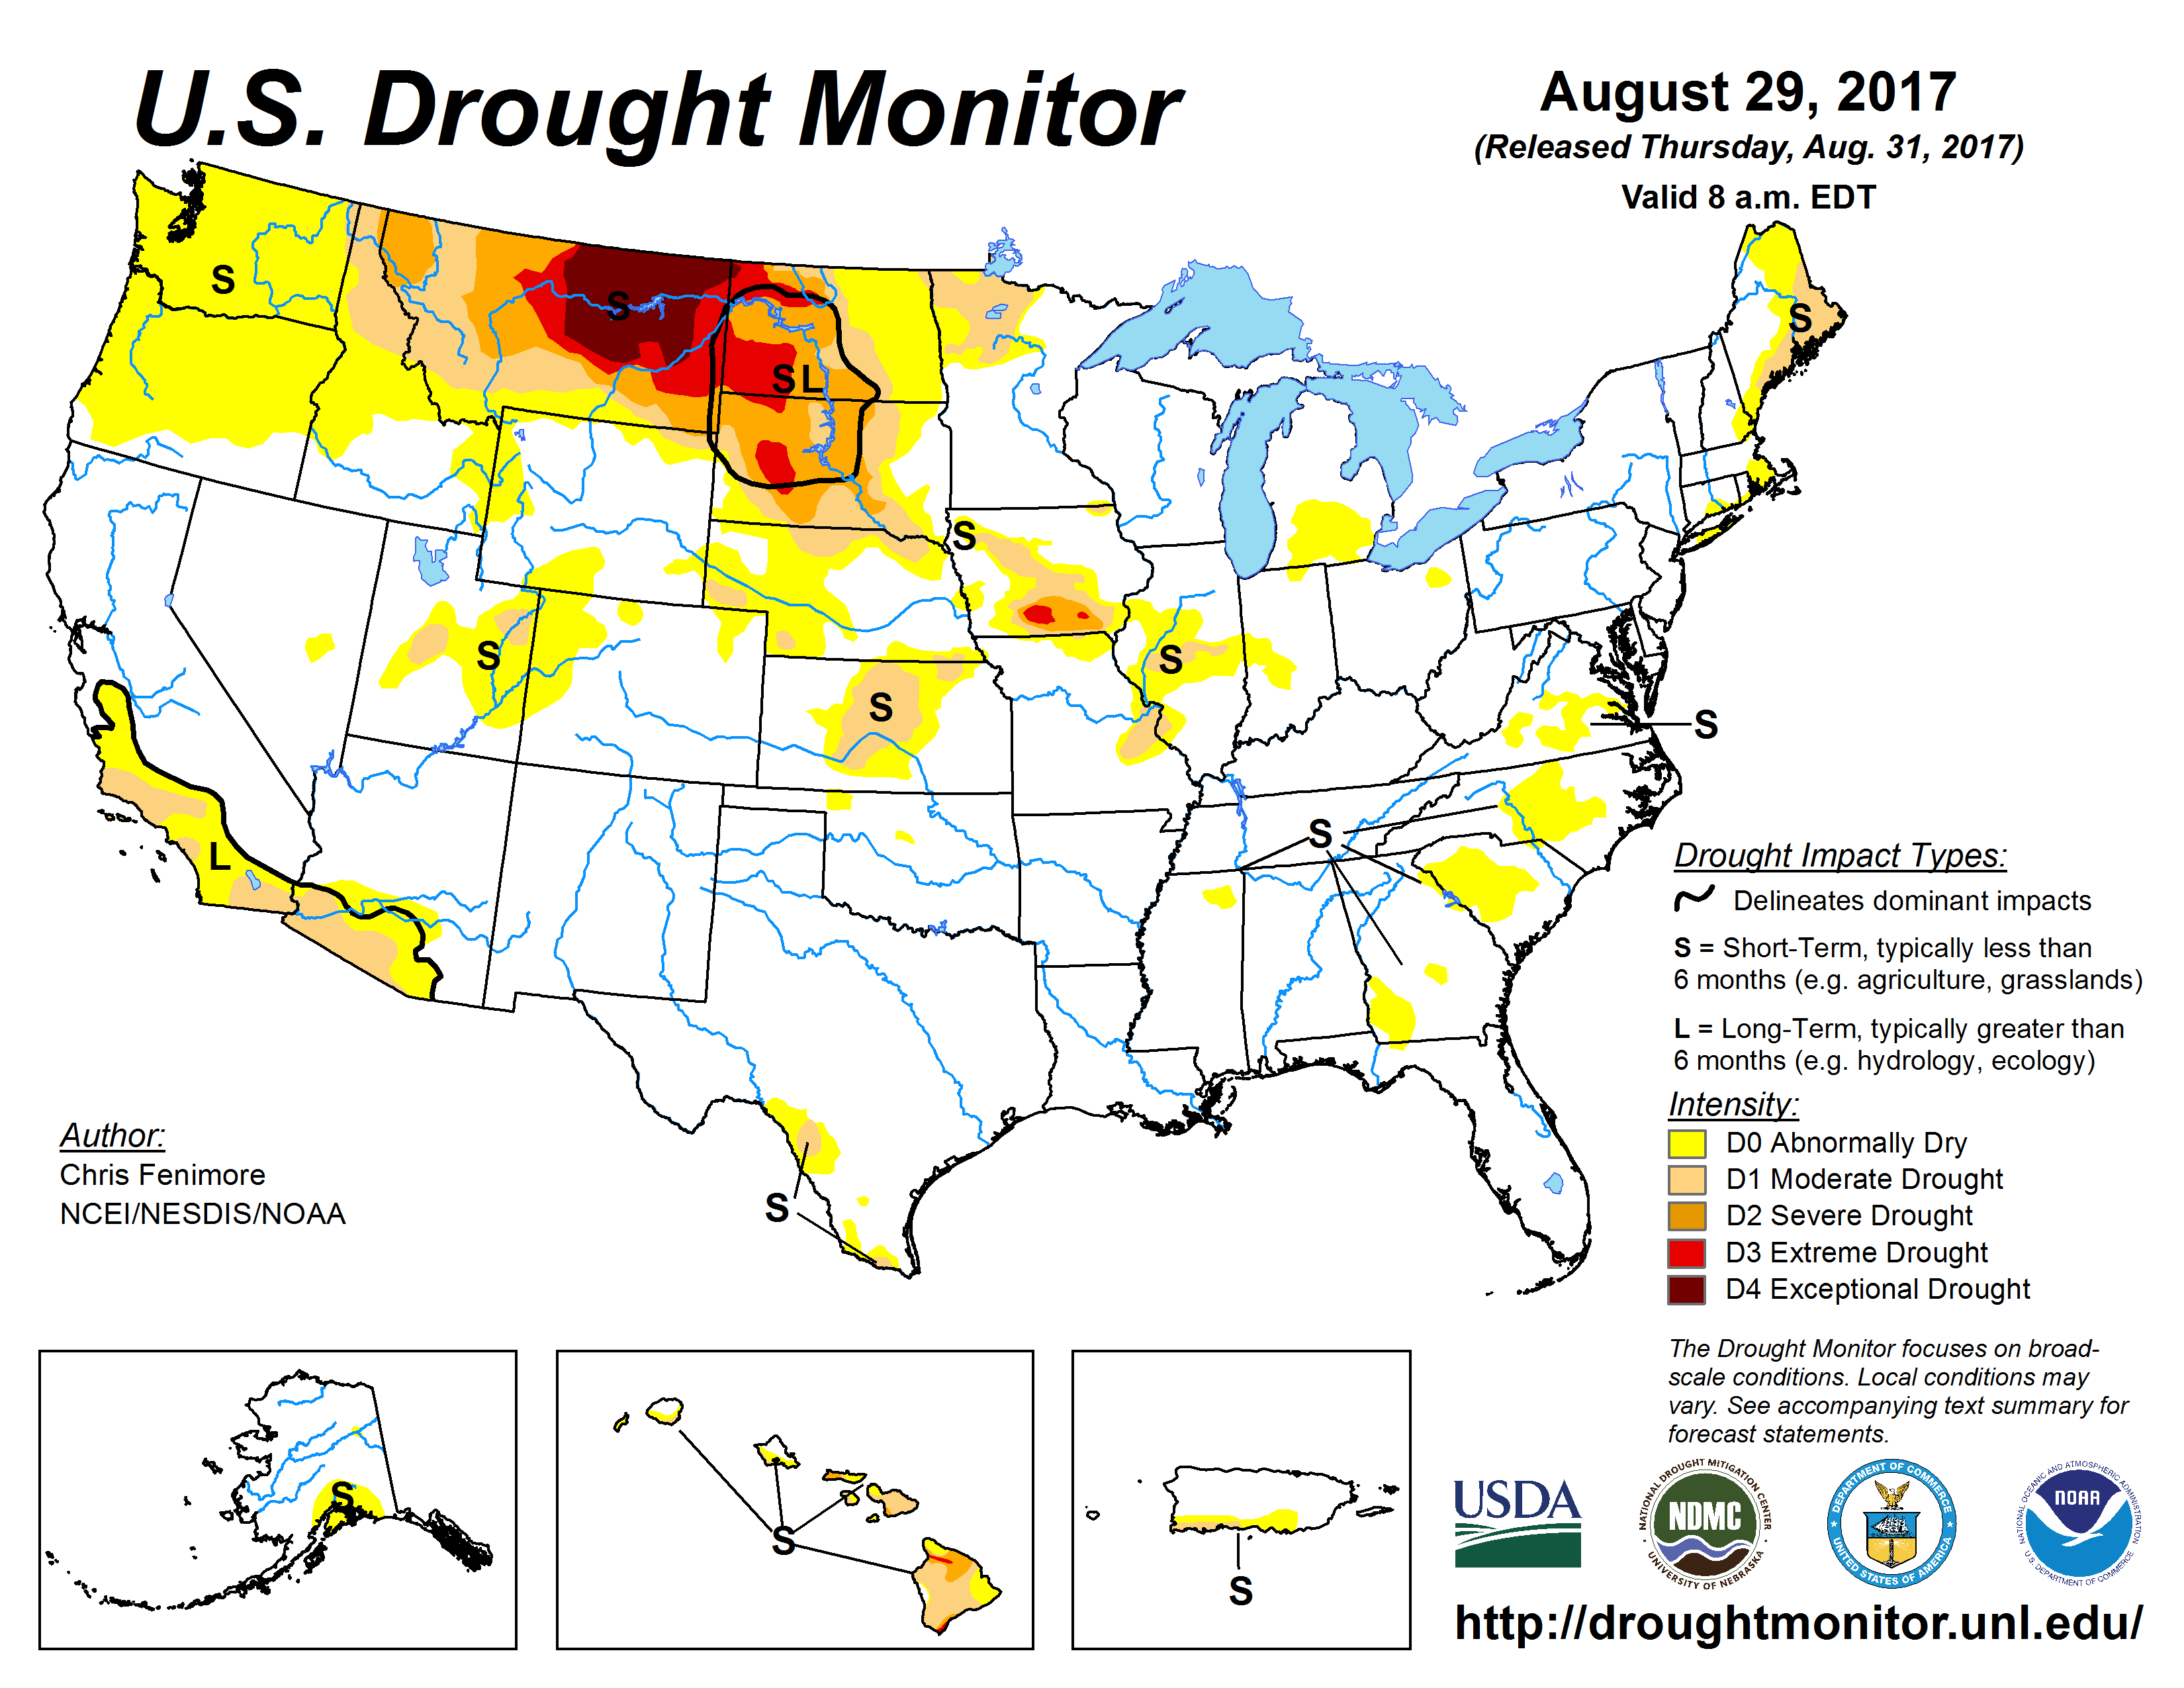
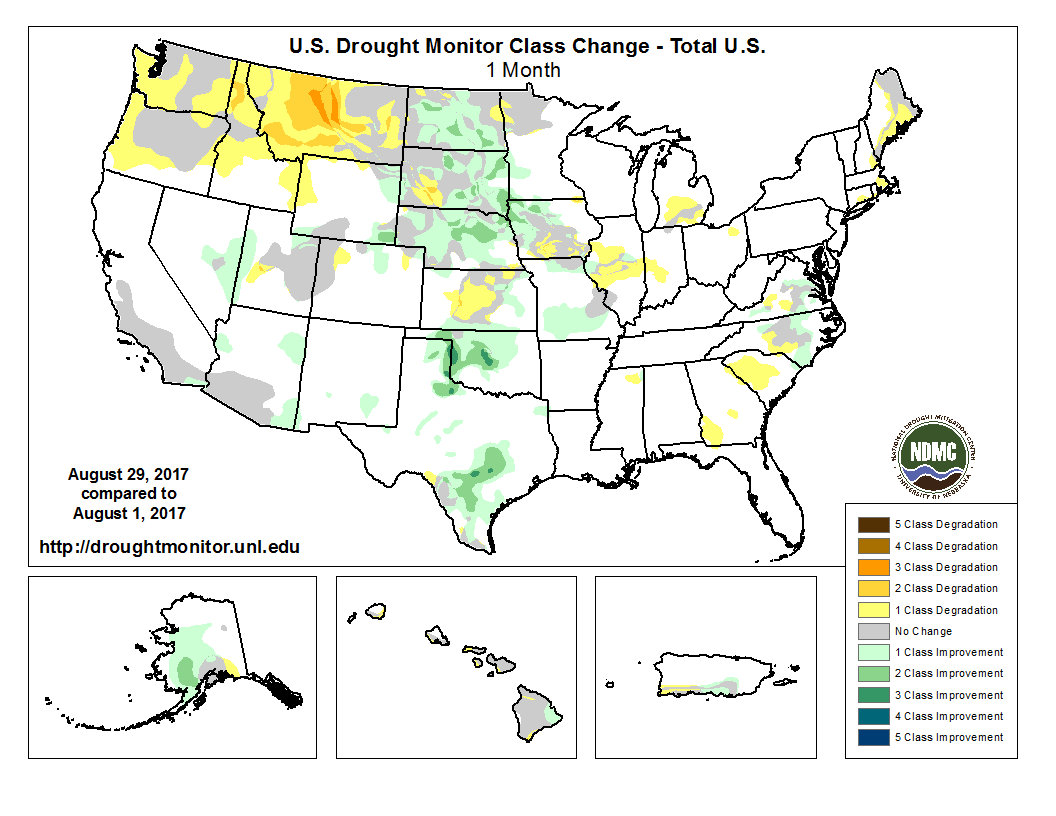
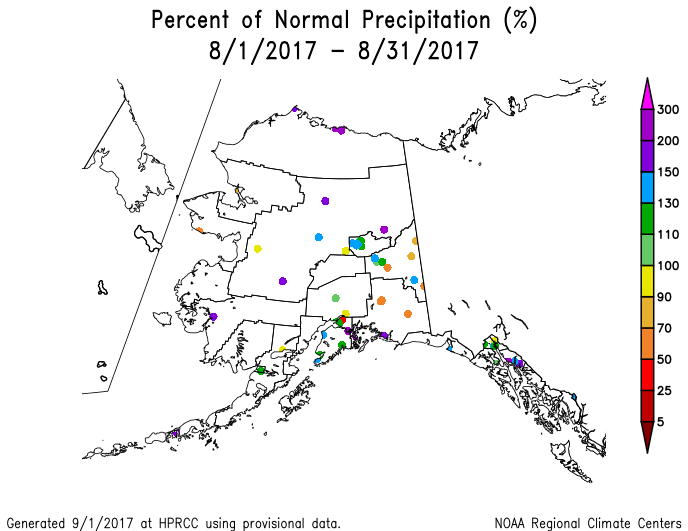
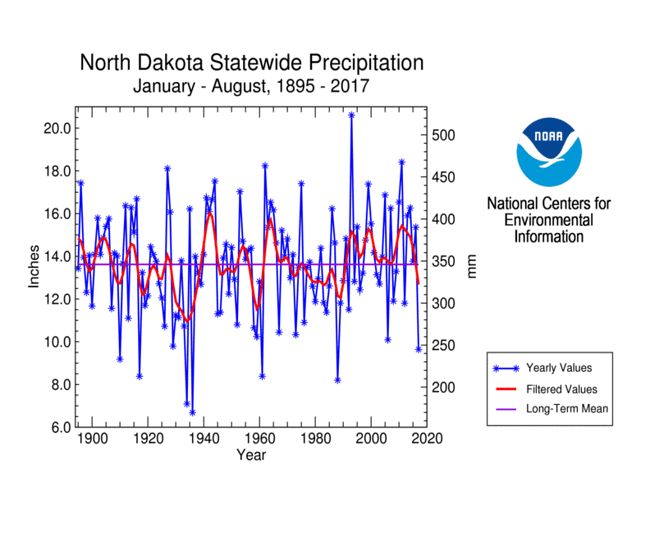
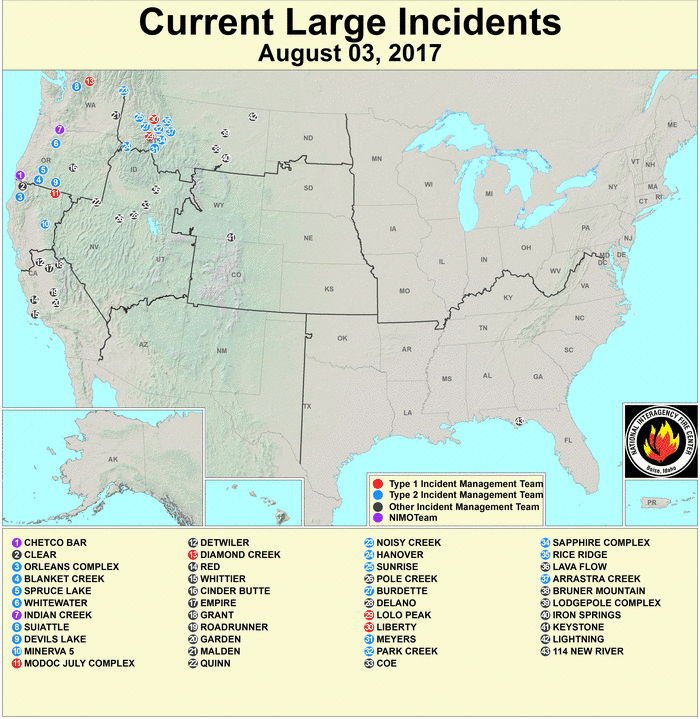
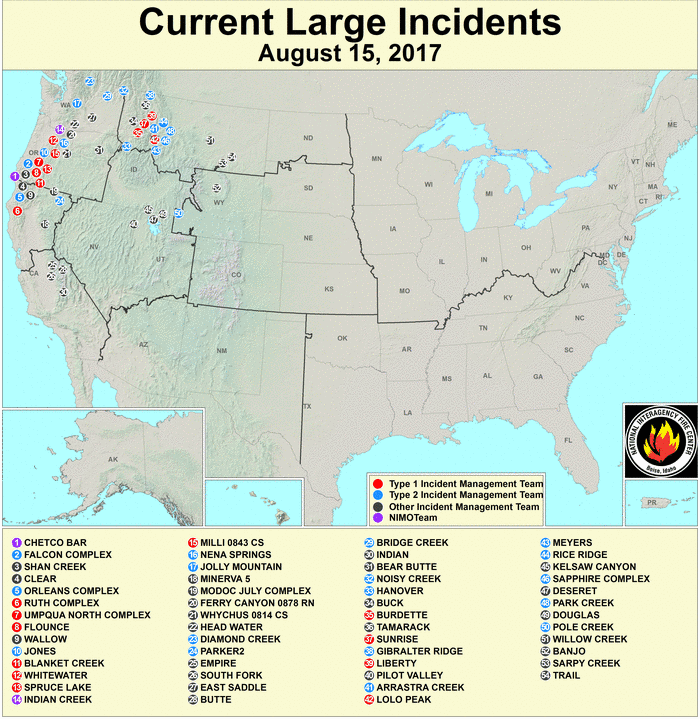
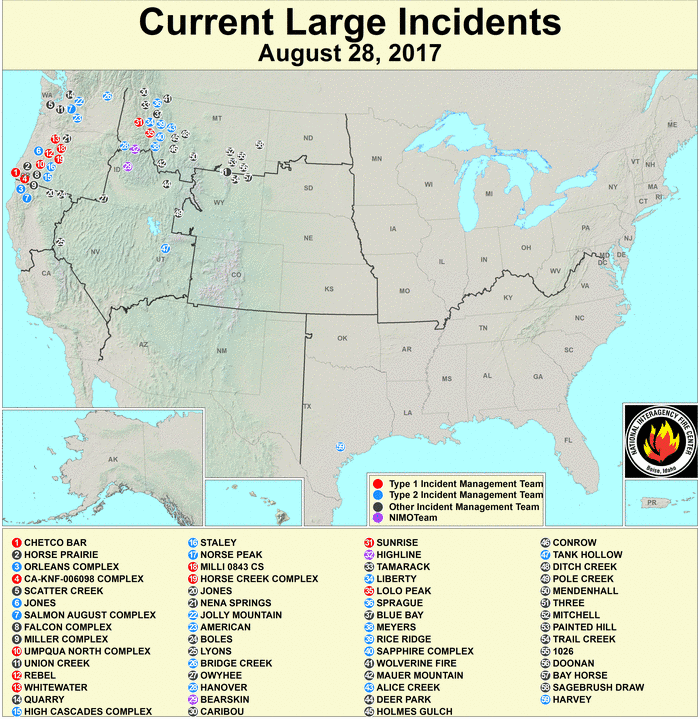
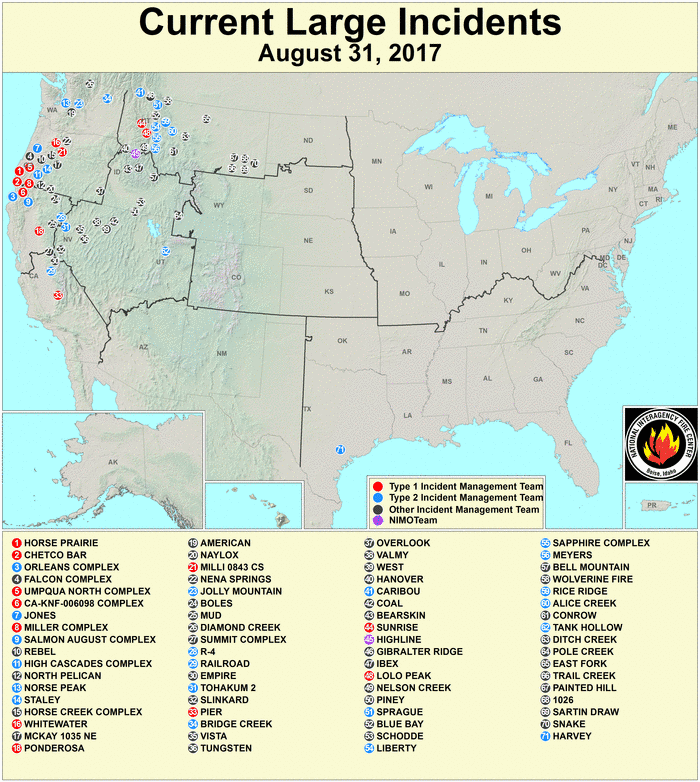
- The above-normal precipitation helped shrink drought and abnormally dry areas across parts of the Plains, especially in the Dakotas which had been suffering from significant drought. Above-normal precipitation also helped shrink drought and abnormally dry areas in parts of Alaska, Hawaii, and Puerto Rico. But the dry weather in the Pacific Northwest and northern High Plains of Montana during August was just a continuation of dryness that has lasted for much of the last three months (in the Pacific Northwest) and last six to nine months (in the northern Plains). Washington, for example, had the seventh driest June-August in the 1895-2017 record, Montana the second driest June-August and eighth driest March-August, and North Dakota the eighth driest March-August and seventh driest January-August. Drought and abnormal dryness expanded or intensified in the Pacific Northwest, northern Rockies, northern High Plains of Montana, and parts of the Midwest, Southeast, Kansas, Maine, Hawaii, and Puerto Rico. As a result, the end of August national moderate-to-exceptional drought footprint stayed about the same as the beginning of August at about 11.8 percent of the CONUS (it decreased from 11.0 percent to 10.0 percent for all of the U.S.). The heat and dry weather continued the conditions for an active wildfire season across the West and northern High Plains of eastern Montana (wildfire maps for August 3, 15, 28, 31).
- Without ENSO-related inhibitors shearing tropical systems, the Atlantic and East Pacific basins saw slightly more active tropical cyclone activity than average. The Atlantic hurricane season runs from June 1st through November 30th and six tropical systems (Hurricanes Franklin, Gert, Harvey, and Irma; Tropical Storm Emily; and Potential Tropical Cyclone Ten) were active in the North Atlantic during August. For the most part, the upper-level trough over the eastern CONUS, in combination with the Bermuda High, helped steer the North Atlantic tropical cyclones away from the CONUS. This was the case for the remnants of Tropical Storm Emily at the beginning of the month, Hurricane Gert at mid-month, and Potential Tropical Cyclone Ten at the end of the month, all of which were steered away from the East Coast into the North Atlantic. Tropical Storm Emily formed in late July, moved across Florida as a tropical depression on August 1st, and dissipated in the North Atlantic. Hurricane Franklin was steered westward across the Caribbean and Gulf of Mexico to mostly affect Mexico. Potential Tropical Cyclone Ten brushed the Southeast Coast, leaving above-normal rainfall but little damage before dissipating as it roamed out into the North Atlantic. An exception was Hurricane Harvey. Harvey's path took it across the Caribbean into a part of the Gulf of Mexico where the upper-level steering currents were weak and indeterminate. As a result, it meandered into the Texas coast and stalled out, dropping devastating rains which persisted day after day during the last week of the month, until a cold front pulled it into the Midwest in early September. Hurricane Irma developed in the eastern tropical Atlantic near the end of the month and did not affect the U.S. during August. The Eastern North Pacific hurricane season runs from May 15th through November 30th and five tropical systems were active during August. All but one were steered away from the CONUS by the western upper-level ridge in combination with the westerly flow on the southern edge of the North Pacific High, or dissipated well out to sea. Hurricane Irwin developed in July but was still a marginal tropical storm as the calendar flipped to August, then dissipated a few hours later. Tropical Depression 11-E, in early August, and Tropical Storm Jova, in mid-August, lasted only a couple days each and stayed off the coast of Mexico. Hurricane Kenneth developed well out to sea and dissipated after about a week. The exception was Tropical Storm Lidia, which developed near the end of August and tracked north along Baja California as the month ended, on a track toward the American Southwest. No tropical cyclones formed in, or moved into, the central North Pacific. Eight tropical systems developed in the western Tropical Pacific near the U.S.-Affiliated Pacific Islands (USAPI) in Micronesia, but only one developed further while in USAPI waters. Sanvu developed near the end of the month near the Marianas, giving the islands abundant rainfall, then moved north where it intensified to typhoon strength to threaten Japan; and Tropical Disturbance 97W meandered within USAPI waters during the last half of the month but never developed further. Tropical Storm Nalgae and Super Typhoon Noru were active at the beginning of August, and Typhoon Banyan developed at mid-month, with all staying to the north of the USAPI. Typhoon Hato developed at mid-month, Severe Tropical Storm Pakhar developed during the last half of the month, and Tropical Storm Mawar developed at the end of the month; all three developed west of the USAPI and affected China and/or the Philippines.
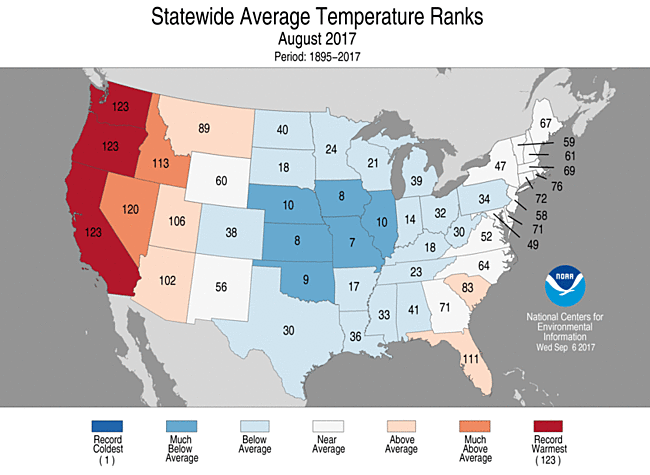
With the upper-level ridge dominating the weather in the West, August temperatures averaged warmer than normal across the West. Four states ranked in the top ten warmest category for August — California (warmest August on record), Oregon (warmest), Washington (warmest), and Nevada (fourth warmest). The persistent passage of cold fronts east of the Rockies beneath the upper-level trough in the East resulted in six states in the central Plains to Midwest having a top ten coldest August. These included Missouri (seventh coldest), Iowa (eighth coldest), Kansas (eighth coldest), Oklahoma (ninth coldest), Illinois (tenth coldest), and Nebraska (tenth coldest). These opposite extremes nearly balanced each other out. When averaged across the CONUS, August ranked near the middle of the historical distribution at 53rd coolest.
- The extreme warmth in the West was a little more extreme than the extreme cold in the central part of the country. Warm temperature records beneath the ridge dominated cold temperature records associated with the fronts. When integrated across the month, there were 3,596 record warm daily high (1,363) and low (2,233) temperature records. This was about one and a half times the 2,277 record cold daily high (1,667) and low (610) temperature records.
- The REDTI (Residential Energy Demand Temperature Index) for August 2017 ranked near the middle of the 123-year historical record for August at 61st highest. This was due to the temperature anomaly pattern of below-normal temperatures in the high population centers of the central and eastern CONUS and the smaller area of above-normal temperatures in the less heavily populated West which reduced the national cooling demand.
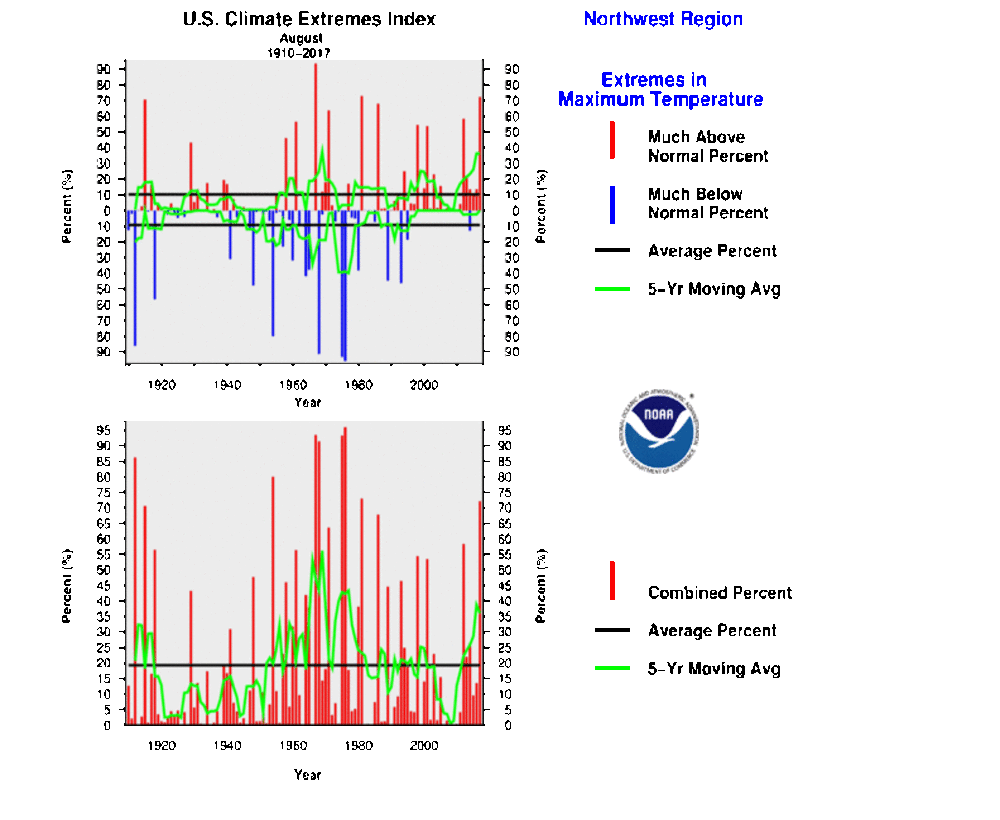
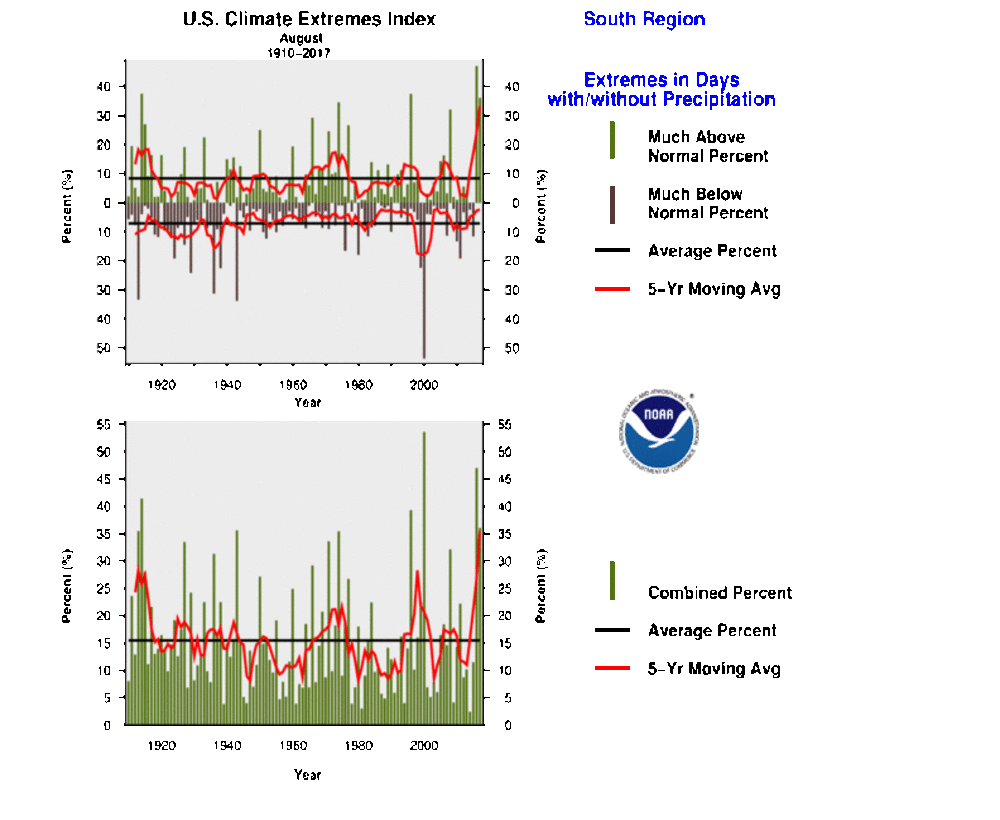
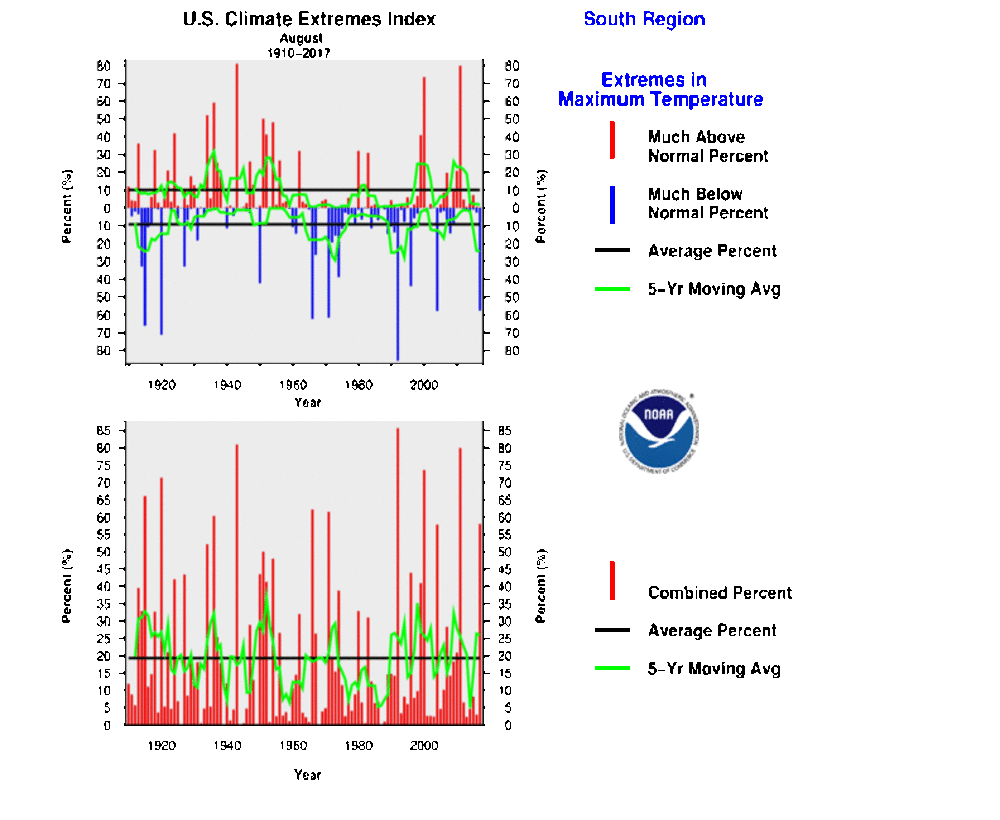
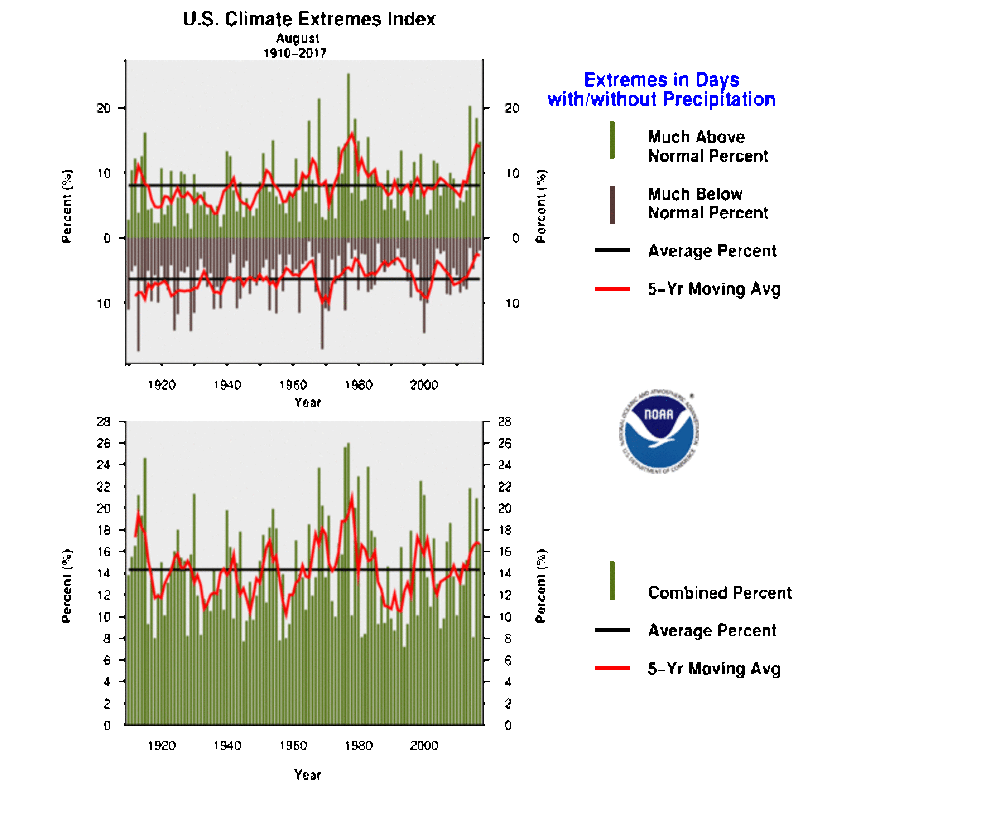
The Climate Extremes Index (CEI) aggregates temperature and precipitation extremes across space and time. During August, the dominance of ridging resulted in warm temperature extremes, frequent cold frontal passages resulted in cold temperature extremes, and frontal lifting, upper-level troughs and lows, and Hurricane Harvey brought wet weather extremes. These occurred in various parts of the country. However, while some components of the CEI ranked high, when the components are aggregated together the only regional CEI that ranked in the top ten category was for the Northwest region, and that only barely. The South and West regions ranked in the top 20 most extreme category. Even the national CEI for August 2017 didn't make the top ten cut — with the tropical cyclone component, it ranked twelfth most extreme, but without it the rank was 33rd most extreme.
Specifically, the Northwest region had its tenth most extreme August CEI in the 1910-2017 record due to the most extreme warm minimum temperature component and third most extreme warm maximum temperature component. The East North Central region had the second most extreme wet spell component, the South region had the fourth most extreme days with precipitation component and seventh most extreme cold maximum temperature component, and the West region had the most extreme warm minimum temperature component, but none of these regions had a regional CEI in the top ten category. When aggregated across the nation, August 2017 had the tenth most extreme cold maximum temperature component and eleventh most extreme days with precipitation component. For the other national components, the regional extremes balanced each other out, nationally. As noted earlier, with these extreme components and the tropical cyclone component, the CONUS had only the twelfth most extreme national August CEI in the 108-year record.
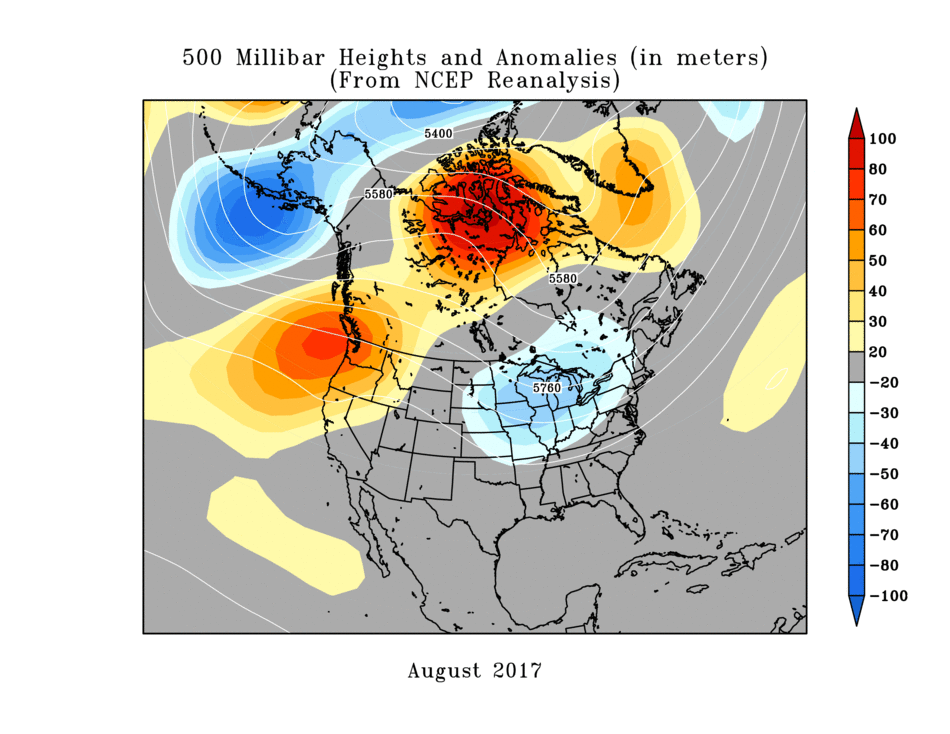 North America monthly upper-level circulation pattern and anomalies. The upper-level circulation pattern, averaged for the month, consisted of below-normal upper-level (500-mb) height anomalies centered over the Great Lakes and extending west to the central Plains and northeast into southeastern Canada. These resulted from troughs and closed lows frequently moving across the area. Above-normal height anomalies were over the West, centered over the Northwest and extending into northern Canada. Of the circulation indices usually discussed on this page, the teleconnections for a positive PT come closest to the August 2017 500-mb circulation anomalies over North America and the North Pacific. |
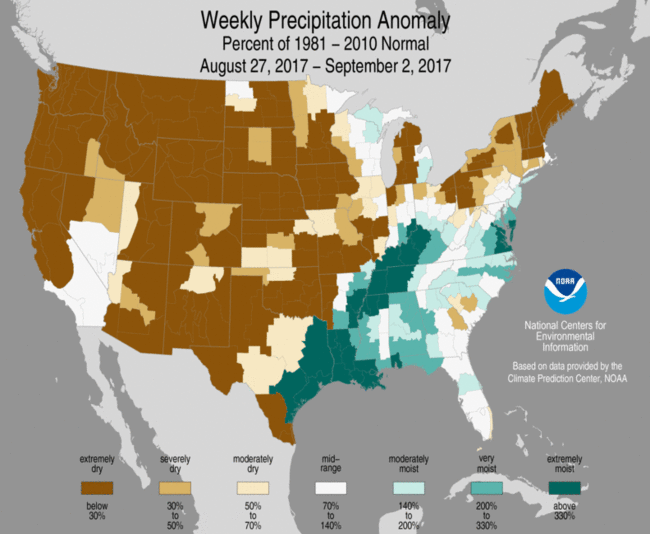
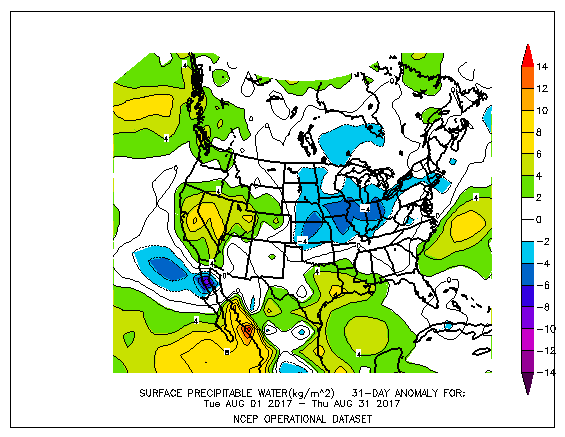
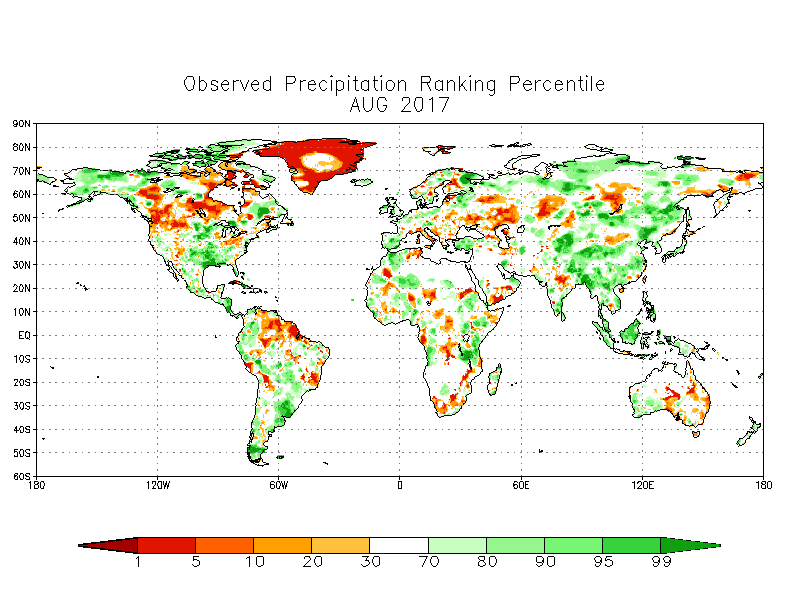
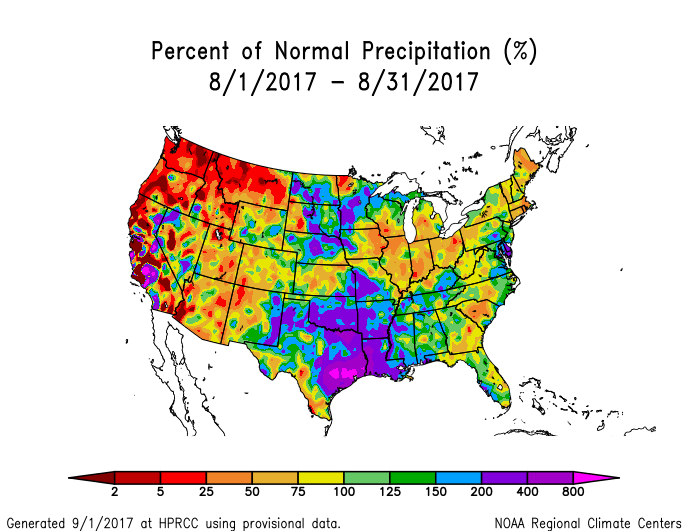 Map of monthly precipitation anomalies. Below-normal precipitation dominated much of the West as the upper-level ridge deflected most weather systems into Canada. It was also drier than normal across the Ohio Valley to lower Great Lakes and parts of the Southeast and Northeast. Showers and thunderstorms that developed along cold fronts gave parts of the Plains above-normal precipitation, and rain from fronts and Hurricane Harvey resulted in above-normal precipitation in the southern Plains to Lower Mississippi Valley. Scattered showers gave parts of California and Nevada above-normal precipitation, but this is their dry season and normals are very low. Alaska and Hawaii had a mixed precipitation anomaly pattern, although it was mostly dry across the Big Island in Hawaii. Puerto Rico was mostly near to wetter than normal. |
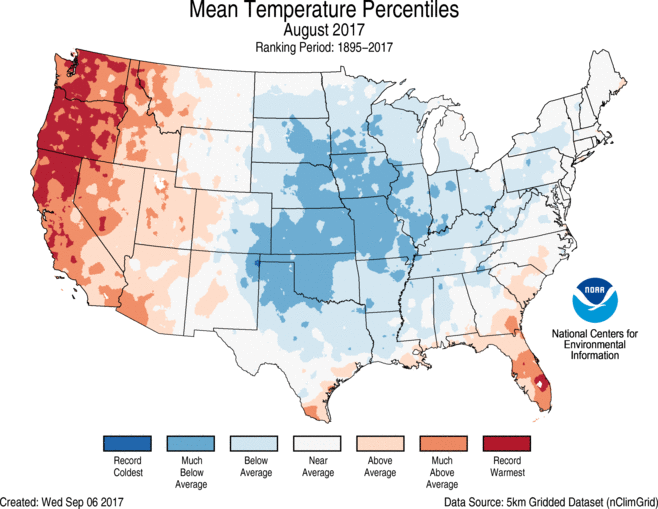
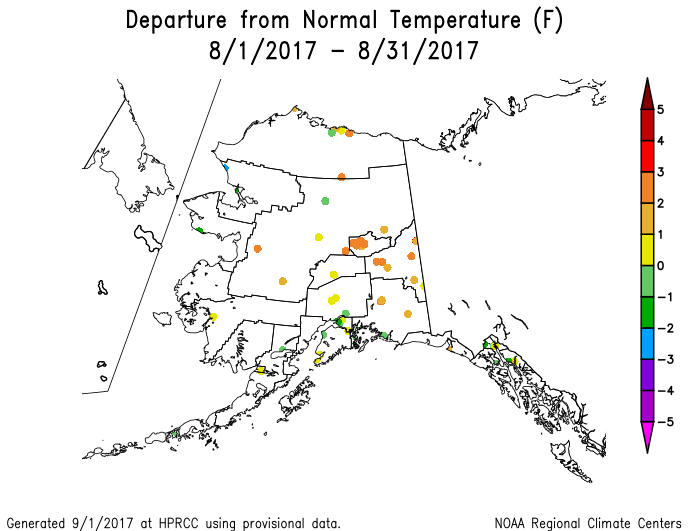
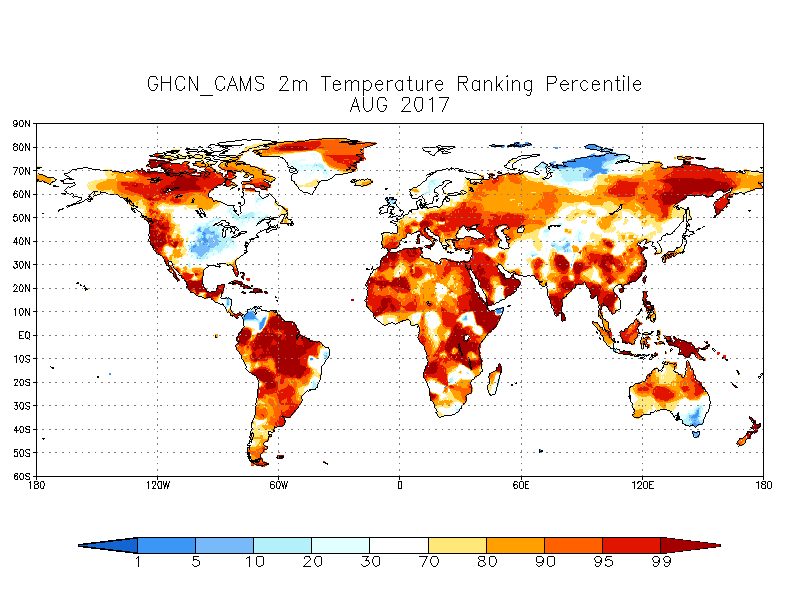
 Map of monthly temperature anomalies. The upper-level ridge over the western CONUS brought above-normal temperatures to the West, while cold fronts associated with upper-level troughing in the eastern CONUS brought below-normal temperatures to most of the country east of the Rockies, but especially in the central Plains to Midwest. Alaska had a mixed temperature anomaly pattern with generally below-normal temperatures in the northwest and above-normal temperatures dominating in the south and interior. |
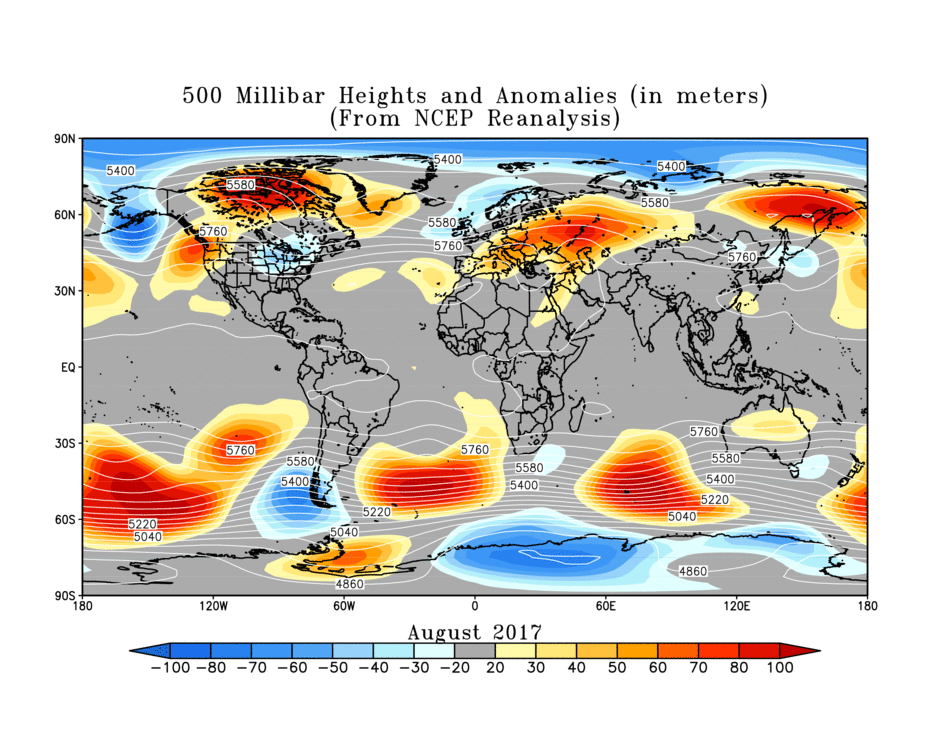 Northern Hemisphere monthly upper-level circulation pattern and anomalies. Global Linkages: The upper-level (500-mb) circulation anomaly pattern over North America was part of a complex long-wave pattern that stretched across the Northern Hemisphere. The usual east-west trough/ridge pairs (or couplets) and anomaly couplets were evident across Asia and North America (some examples of anomaly couplets include eastern and western North America, western North America and Alaska/Gulf of Alaska, Alaska/Gulf of Alaska and eastern Siberia). But north-south coupling was also apparent in latitudinal bands across Eurasia, North America, and the Arctic (examples include eastern CONUS and northern Canada, northern Canada and Arctic Ocean, Arctic Ocean to eastern Siberia or eastern Eurasia). The above-normal 500-mb heights were associated with upper-level ridging at the mid-latitudes; below-normal precipitation (over western North America, western Asia, and parts of Siberia); above-normal surface temperatures over western Eurasia, eastern Siberia, and western to northern North America; and warming SSTs in parts of the North Atlantic (near Greenland). The areas of below-normal 500-mb heights were associated with upper-level troughing; near- to below-normal surface temperatures over central North America, Alaska, and north central Siberia; cooling SSTs in parts of the North Pacific (Gulf of Alaska); and above-normal precipitation over Alaska, north central Siberia, and the north central CONUS. Small parts of southeast Australia, central North America, northwest South America, and north central Asia were near to cooler than normal. But with large parts of the continents still having warmer-than-normal temperatures, and large portions of the Atlantic and Pacific Oceans having warmer-than-normal sea surface temperatures, the August 2017 global temperature was well above normal. |
Atmospheric Drivers
Subtropical highs, and fronts and low pressure systems moving in the mid-latitude storm track flow, are influenced by the broadscale atmospheric circulation. The circulation of the atmosphere can be analyzed and categorized into specific patterns. The Tropics, especially the equatorial Pacific Ocean, provides abundant heat energy which largely drives the world's atmospheric and oceanic circulation. The following describes several of these modes or patterns of the atmospheric circulation, their drivers, the temperature and precipitation patterns (or teleconnections) associated with them, and their index values this month:
-
El Niño Southern Oscillation (ENSO)
- Description: Oceanic and atmospheric conditions in the tropical Pacific Ocean can influence weather across the globe. ENSO is characterized by two extreme modes: El Niño (warmer-than-normal sea surface temperature [SST] anomalies in the tropical Pacific) and La Niña (cooler-than-normal SST anomalies), with the absence of either of these modes termed "ENSO-neutral" conditions.
- Status: ENSO-neutral conditions were present during August 2017 with below-average SSTs across the central and eastern equatorial Pacific Ocean.
- Teleconnections (influence on weather): The NWS CPC has no teleconnections for ENSO-neutral conditions.
- Comparison to Observed: The August 2017 temperature and precipitation anomaly patterns do not match the teleconnection patterns for either El Niño or La Niña.
-
Madden-Julian Oscillation (MJO)
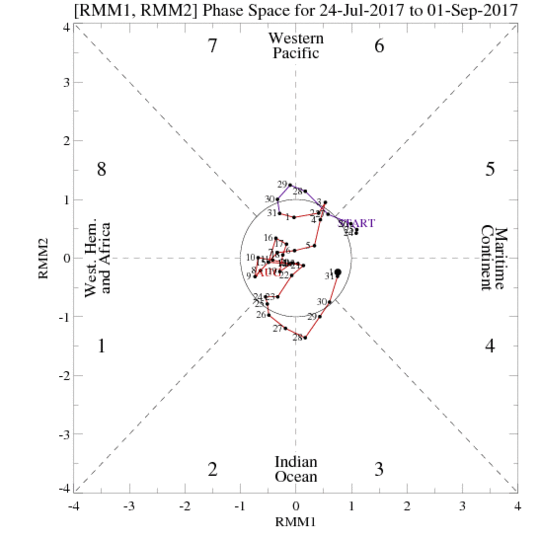
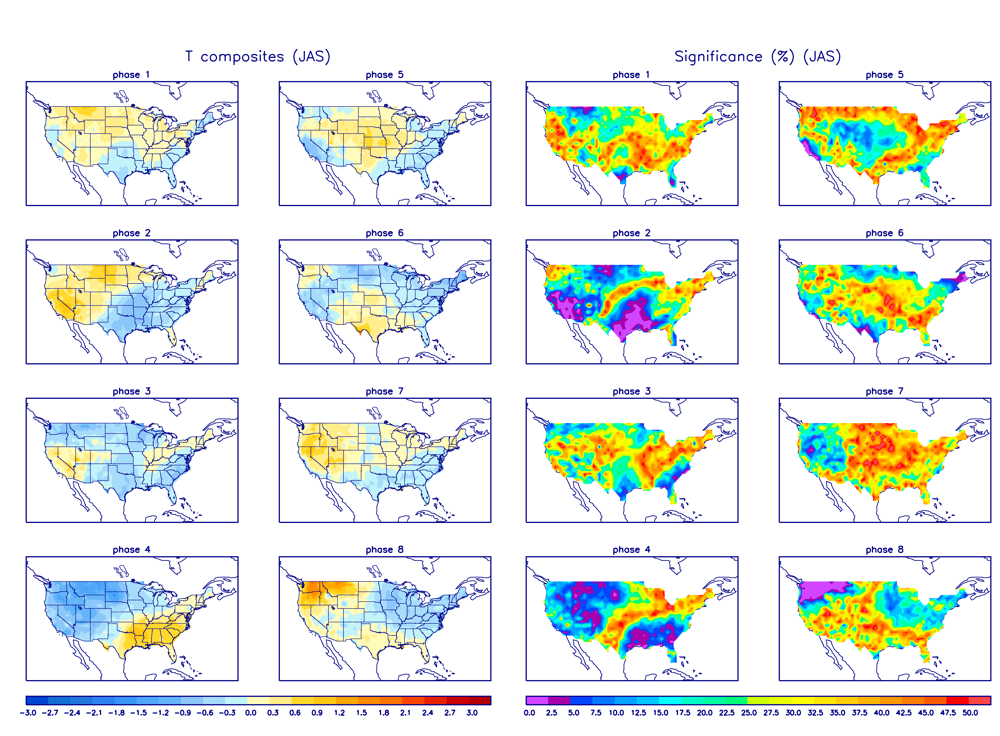
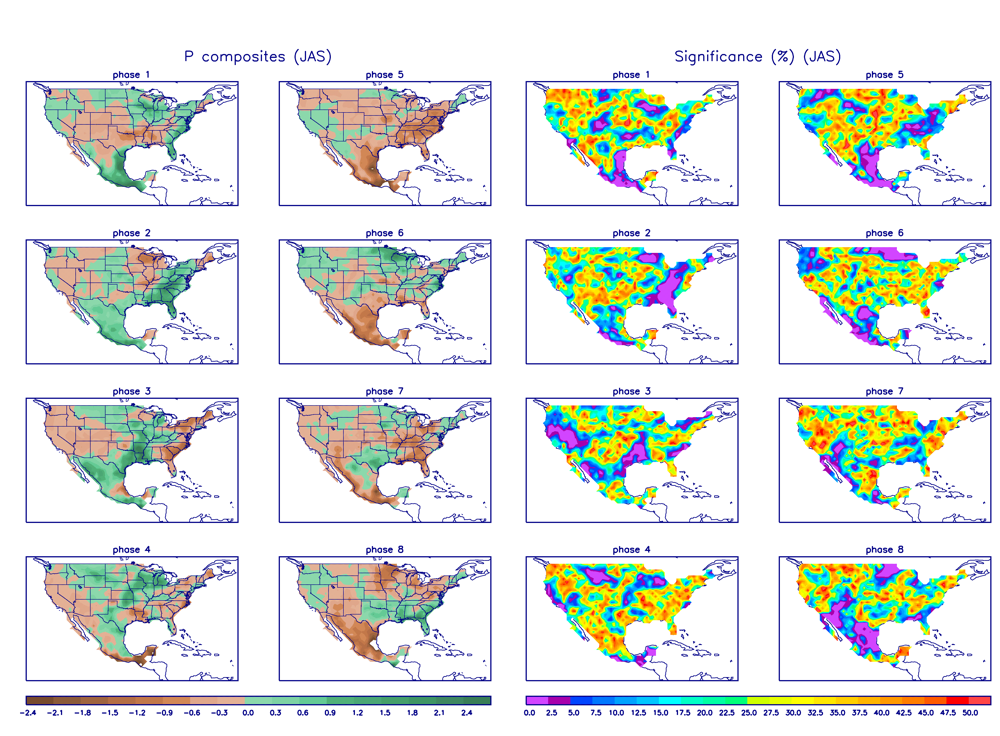
- Description: The MJO is a tropical disturbance or "wave" that propagates eastward around the global tropics with a cycle on the order of 30-60 days. It is characterized by regions of enhanced and suppressed tropical rainfall. One of its indices is a phase diagram which illustrates the phase (1-8) and amplitude of the MJO on a daily basis. The MJO is categorized into eight "phases" depending on the pattern of the location and intensity of the regions of enhanced and suppressed tropical rainfall. The MJO can enter periods of little or no activity, when it becomes neutral or incoherent and has little influence on the weather. Overall, the MJO tends to be most active during ENSO-neutral years, and is often absent during moderate-to-strong El Niño and La Niña episodes.
- Status: The MJO Wheeler-Hendon index spent most of the month inside the unit circle (i.e., was an incoherent signal), treading weakly into phases 2 and 3 near the end of the month. Other aspects of the tropical ocean-atmosphere system (referred to in the CPC reports as the background or low frequency state, Kelvin and Rossby waves, and tropical cyclone activity), as well as interference from mid-latitude circulation patterns, appeared to play a role in influencing the month's climate (especially Kelvin and Rossby waves) (MJO updates for August 7, 14, 21, 28, and September 4).
- Teleconnections (influence on weather): The MJO's temperature and precipitation teleconnections to U.S. weather depend on time of year and MJO phase. There are no teleconnections for an incoherent MJO, but a phase 2 MJO in August is associated with above-normal temperatures in the western CONUS, below-normal temperatures from the southern Plains to Northeast, and above-normal precipitation in the Southeast to Northeast, and a phase 3 MJO is associated with mostly below-normal temperatures, above-normal precipitation in eastern Texas to the Lower Mississippi Valley, and below-normal precipitation from California into the Great Basin.
- Comparison to Observed: The MJO is transitory and can change phases (modes) within a month, so it is usually more closely related to weekly weather patterns than monthly. In the case of August 2017, the monthly temperature anomaly pattern has a few similarities to the temperature teleconnection pattern for phase 2; the fifth week of the month, when the MJO was in phases 2-3, also has some similarities. Likewise, the monthly precipitation anomaly pattern and precipitation anomaly pattern for the fifth week of the month show some similarity to the precipitation teleconnection pattern for phase 3, especially from eastern Texas to the Lower Mississippi Valley, although the wetness here this month was heavily influenced by tropical cyclone rains from Hurricane Harvey. In light of the weak to incoherent nature of the MJO this month, these agreements in pattern may have been a coincidence.
- The Pacific/North American (PNA) pattern
- Description: The PNA teleconnection pattern is associated with strong fluctuations in the strength and location of the East Asian jet stream. PNA-related blocking of the jet stream flow in the Pacific can affect weather downstream over North America, especially the West and especially in the winter half of the year.
- Status: The daily PNA index started the month weakly negative but transitioned to weakly positive for most of the month, averaging weakly positive for the month as a whole. The 3-month-averaged index was also positive.
- Teleconnections (influence on weather): To the extent teleconnections are known, a positive PNA for this time of year (July on the quarterly teleconnection maps) is associated with above-normal precipitation from Montana to Texas; below-normal precipitation across the Great Lakes; below-normal upper-level circulation anomalies over southeastern Canada and the northern North Pacific; and above-normal upper-level circulation anomalies across the central North Pacific, but all of the teleconnections are weak. The temperature teleconnections are weak to non-existent across North America.
- Comparison to Observed: The August 2017 precipitation anomaly pattern does not agree with the teleconnections. The August upper-level circulation anomaly pattern has some similarity to the teleconnections for a positive PNA over southeastern Canada and the Aleutians, but not over the rest of North America.
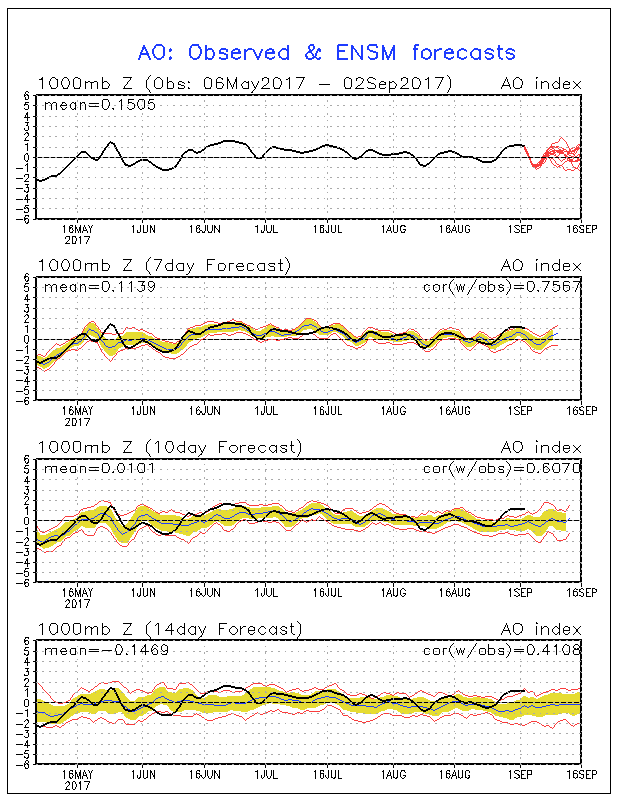
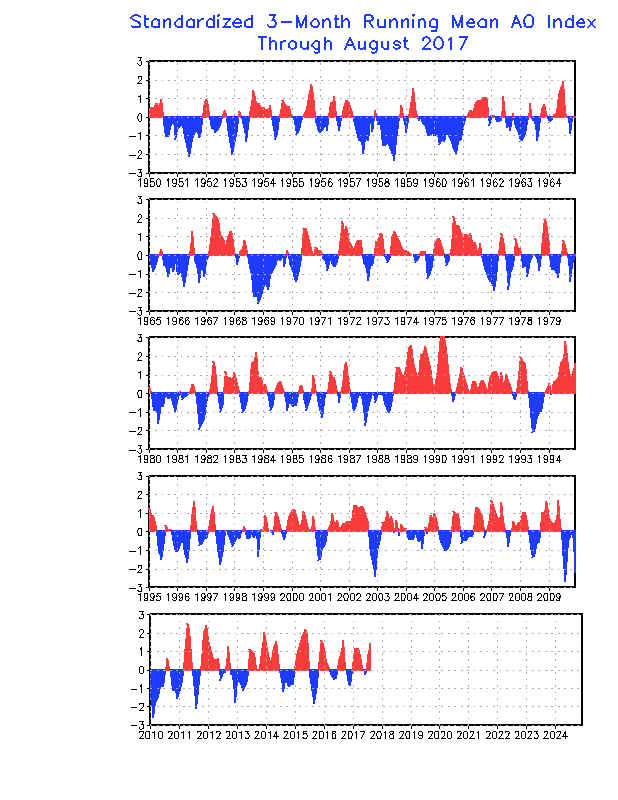
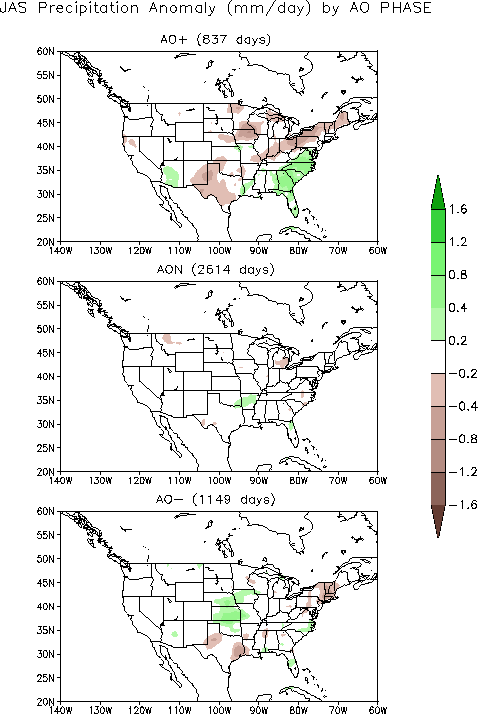
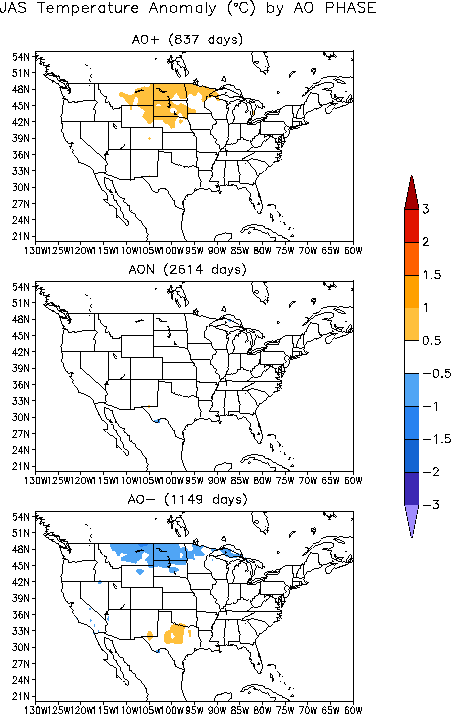
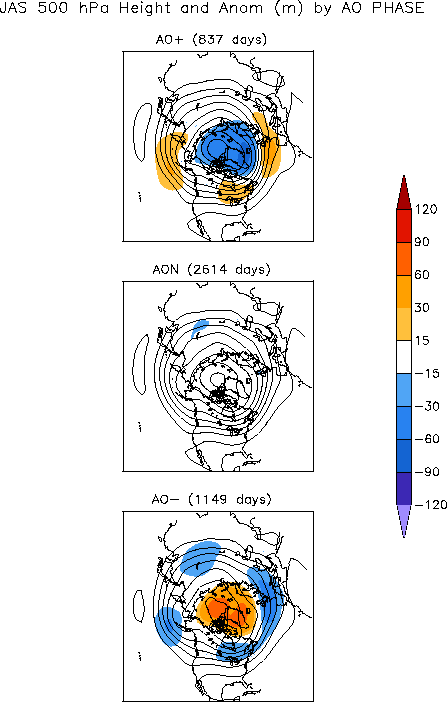
- The Arctic Oscillation (AO) pattern
- Description: The AO teleconnection pattern relates upper-level circulation over the Arctic to circulation features over the Northern Hemisphere mid-latitudes and is most active during the cold season.
- Status: The daily AO index oscillated around zero throughout the month, averaging slightly positive for the month. The 3-month-averaged index was positive.
- Teleconnections (influence on weather): To the extent teleconnections are known, a positive AO in August (July-September in the AO Composites table) is typically associated with dry conditions in the southern Plains, Midwest, and Northeast; wet conditions in the Southeast to Mid-Atlantic; above-normal temperatures in the northern Plains; near-normal temperatures elsewhere across the CONUS; below-normal upper-level circulation anomalies over the Arctic Ocean extending into the North Atlantic; and above-normal upper-level circulation anomalies spanning both the North Pacific and North Atlantic Oceans and over eastern Canada.
- Comparison to Observed: The August 2017 monthly temperature and upper-level circulation anomaly patterns do not agree with the teleconnections for a positive AO, and the precipitation anomaly pattern has little agreement.
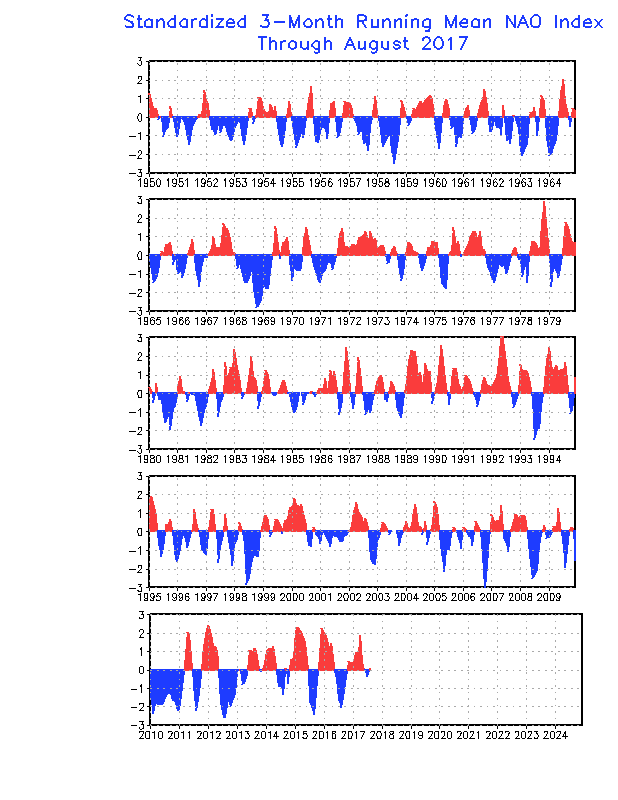
- The North Atlantic Oscillation (NAO) pattern
- Description: The NAO teleconnection pattern relates upper-level circulation over the North Atlantic Ocean to circulation features over the Northern Hemisphere mid-latitudes.
- Status: The daily NAO index was negative for most of the month, transitioned to positive near the end of the month, and averaged negative for the month. The 3-month-averaged index was near zero.
- Teleconnections (influence on weather): To the extent teleconnections are known, a negative NAO during this time of year (July on the quarterly teleconnection maps) is associated with below-normal upper-level circulation anomalies over the western CONUS and southwestern Canada, extending eastward along the U.S./Canadian border to the northwestern North Atlantic; above-normal circulation anomalies over northern Canada to Greenland and the northeastern North Pacific; below-normal temperature anomalies in the Northwest to northern Plains; above-normal temperature anomalies from the southern Plains to Southeast; wetter-than-normal precipitation anomalies in the northern Plains and Mid-Mississippi Valley; and drier-than-normal conditions from east Texas to the Lower Mississippi Valley.
- Comparison to Observed: The August 2017 temperature anomaly pattern basically doesn't match; the upper-level circulation anomaly pattern has a hint of agreement but everything is shifted; and the precipitation anomaly pattern has some agreement in the north but is opposite to the teleconnections in the south.
- The West Pacific (WP) pattern
- Description: The WP teleconnection pattern is a primary mode of low-frequency variability over the North Pacific and reflects zonal and meridional variations in the location and intensity of the (East Asian) jet stream in the western Pacific.
- Status: The monthly WP index was negative, and the three-month average WP index was also negative.
- Teleconnections (influence on weather): To the extent teleconnections are known, a negative WP during this time of year (July on the quarterly teleconnection maps) is typically associated with above-normal temperatures in the southwest CONUS and eastern North America; below-normal temperatures over northwestern Canada; above-normal circulation anomalies over the southwestern CONUS, eastern North America, and northeast Asia; and below-normal circulation anomalies over western Canada and the west-central Pacific. There are no discernible precipitation teleconnections over the CONUS.
- Comparison to Observed: The August 2017 monthly upper-level circulation anomaly pattern agrees with the teleconnections over eastern Asia and some parts of the North Pacific and western North America, but are strikingly opposite over eastern North America. The temperature anomaly pattern agrees in the southwestern CONUS, but is opposite in eastern North America. There are no teleconnections to compare against the precipitation anomaly pattern.
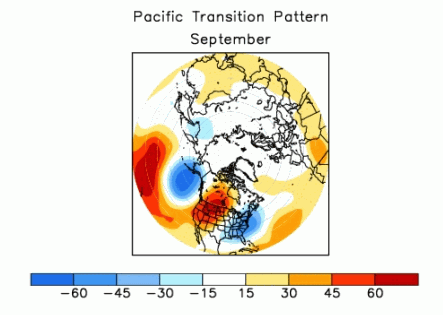
- The Pacific Transition (PT) pattern
- Description: The PT teleconnection pattern relates upper-level circulation over the central subtropical North Pacific to circulation features over North America. It is a significant factor in the earth's circulation during August and September.
- Status: The PT index was positive during August.
- Teleconnections (influence on weather): To the extent teleconnections are known, a positive PT is typically associated with warmer-than-normal temperatures for the western CONUS and western Canada, colder-than-normal temperatures for the eastern CONUS, and drier-than-normal conditions in the Midwest, Alaska, and parts of the Pacific Northwest to Northern Plains. The upper-level circulation anomalies for a positive PT are below-normal 500-mb geopotential heights over the eastern third of the CONUS into the North Atlantic, below-normal heights over the northeastern Pacific (including the Gulf of Alaska), and above-normal heights over the western half of the CONUS into south central Canada and across the central North Pacific.
- Observed: The August 2017 monthly precipitation anomaly pattern agrees very well where there are teleconnections. The temperature and upper-level circulation anomaly patterns are also very good matches, but they are shifted slightly to the west of where the teleconnections are located.
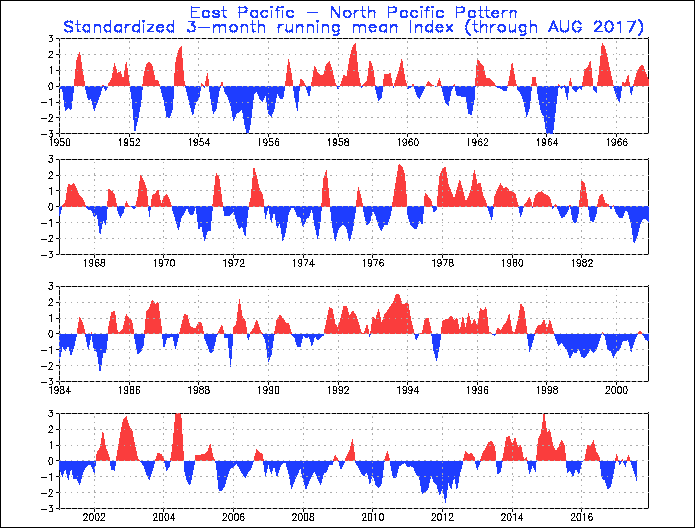
- The East Pacific-North Pacific (EP-NP) pattern
- Description: The EP-NP teleconnection pattern relates SST and upper-level circulation patterns (geopotential height anomalies) over the eastern and northern Pacific to temperature, precipitation, and circulation anomalies downstream over North America. Its influence during the winter is not as strong as during the other three seasons.
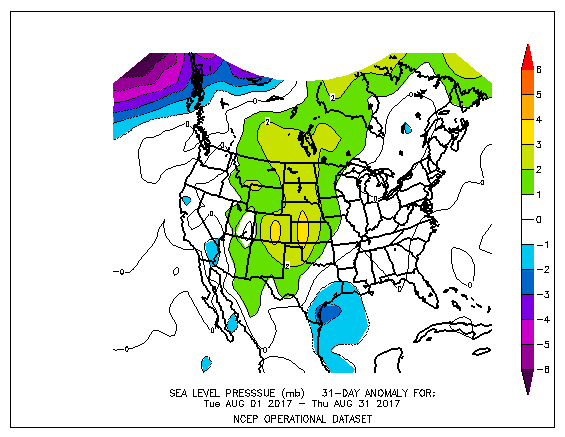
- Status: August North Pacific SSTs were warmer than normal across most of the basin. Parts of the basin warmed and parts cooled (especially from the Gulf of Alaska to the Date Line) compared to last month. The situation was similar in the North Atlantic, except there was considerable warming between Iceland and Greenland compared to last month. The North Atlantic High (Bermuda High) and North Pacific High were evident on the average sea level pressure (SLP) field map. The SLP anomaly field indicated that the North Atlantic and North Pacific Highs were near normal strength, the North Pacific's Aleutian Low was stronger than normal and shifted over the Gulf of Alaska, and the North Atlantic's Icelandic Low was weaker than normal. The stronger-than-usual Aleutian Low was associated with enhanced 500-mb troughing in the area. The SLP anomaly field also shows positive pressure anomalies over the central CONUS, reflecting the frequent passage of Canadian air masses, with their associated higher pressures, behind cold fronts. The August 2017 monthly EP-NP index was negative, as was the 3-month running mean.
- Teleconnections (influence on weather): To the extent teleconnections are known, a negative EP-NP index this time of year (July on the quarterly teleconnection maps) is typically associated with warmer-than-normal temperatures across the CONUS from the central Rockies to Great Lakes and across central to eastern Canada; below-normal upper-level circulation anomalies (weaker upper-level ridge) over Alaska and western Canada; and above-normal upper-level circulation anomalies across central to eastern North America (weaker upper-level trough) and over the central North Pacific. The precipitation teleconnections are weak but suggest drier-than-normal conditions over Montana, Iowa, and the Great Lakes.
- Comparison to Observed: The August 2017 temperature and upper-level circulation anomaly patterns are essentially opposite to the teleconnections associated with a positive EP-NP over North America. The precipitation anomaly pattern has some agreement where the few teleconnections exist.
Examination of the available circulation indices and their teleconnection patterns, and comparison to observed August 2017 temperature, precipitation, and circulation anomaly patterns, suggest that the weather over the CONUS in August was traced mostly to atmospheric drivers originating over the subtropical North Pacific. The PNA and AO indices were close to zero (weakly positive), indicating little influence; the MJO was weak to incoherent; and the equatorial Pacific was in an ENSO-neutral state. For the NAO and WP, there was some agreement in some anomaly patterns, but nothing conclusive. The observed anomaly patterns were opposite those expected with a negative EP-NP. There was some agreement in patterns for the MJO, but the MJO was weak to incoherent so the apparent similarities may have been a coincidence. Only one teleconnection pattern showed strong similarities. The observed anomaly patterns were shifted a little to the west, but otherwise they had good agreement with the teleconnections of the PT index. As noted by the NOAA Climate Prediction Center, "The positive phase of the PT pattern features above-average heights west of Hawaii and across western North America, and below-average heights in the Gulf of Alaska and over the southeastern United States. The PT pattern is associated with above-average surface temperatures in the western subtropical North Pacific, the subtropical North Atlantic, and throughout western North America, and with below-average temperatures over the eastern half of the United States." These upper-level circulation and oceanic and CONUS temperature conditions were strongly satisfied.
This month illustrates how the weather and climate anomaly patterns are influenced by atmospheric drivers (or modes of atmospheric variability) originating in the North Pacific.