Fourty-one percent of the contiguous U.S. (CONUS) was covered by snow at the beginning of January according to NOAA's National Snow Analysis. Much of the Sierra Nevada, Cascade and Rocky Mountain ranges as well as the northern and central Plains, Great Lakes and much of the Northeast were blanketed by snow. By January 7, nearly 13 percent of the snowcover melted, yielding the minimum CONUS coverage of 28.1 percent for the month. A strong, spring-like cold front, traversing the CONUS during mid-month, brought snowfall from the Texas Panhandle to New England, bringing the CONUS-wide snowcover to a maximum extent of 44.1 percent for the month. Snow cover waned slightly as the month came to an end with 39.5 percent of the CONUS under a blanket of snow across the intermountain West and from the northern and central Plains into the Great Lakes and New England.

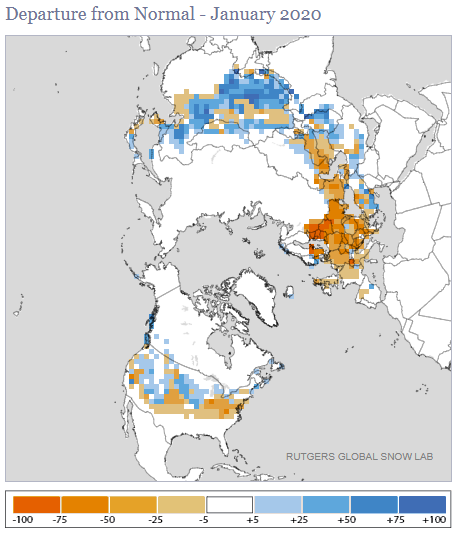
According to NOAA data analyzed by the Rutgers Global Snow Lab, the January snow cover extent was 1.3 million square miles, 58,687 square miles below the 1981-2010 average. This was the 34th largest value in the 54-year satellite record. Above-average snow cover was observed across much of the intermountain West, the northern Plains and parts of the Great Lakes. Below-average snow cover was observed over much of the southern and central Plains, the Ohio Valley and the Mid-Atlantic region.

Melting of winter and spring mountain snowpack provides a crucial summer water source across much of the western United States. The total annual water budget for agriculture and human use in the mountainous West is highly dependent on the amount of snow melt that will occur in spring and is proportional to the amount of snow on the ground, which can be approximated by a measure of the snow water equivalent (SWE). On December 31, SWE values were similar to what was present the month prior with below median values across the Pacific Northwest and parts of the Bitterroots, above average SWE values across the Sierras, central and southern Rockies and parts of the High Plains and a smaller extent for SWE values in excess of 200 percent across the Southwest. By the end of January, SWE values were near- to above-normal across much of the Southwest, northern and central Rockies as well as parts of the Great Basin and eastern Oregon. Below-average SWE values existed across the northern Sierra Nevada Range, much of the Pacific Northwest as well as parts of the southern Great Basin.

Temperatures across the Great Lakes states were 7°F to 9°F above the long-term mean during January, ranking in the warmest ten percent of Januaries in the last 126 years. This contributed to warmer surface water temperatures across the five Great Lakes and inhibited ice formation along the surface of the lakes. At the end of January, total ice coverage across the basin was approximately 35 percent of average for this time of year. Low ice coverage can allow for lake-effect snow events to affect coastal communities along these lakes much later in the winter season than on average. This can cause seasonal snowfall totals along the coasts to be above normal and can affect winter-time coastal erosion due to wind-driven waves crashing along the shoreline. In fact, the record- to near-record lake levels in January will further contribute to coastal erosion concerns moving into late winter and early spring. The sattelite image shown above illustrates the snowcover across Canada and portions of the states surrounding Lake Erie and Lake Ontario. On January 20, ice cover across Erie was merely 0.4 percent and 4.75 percent across Lake Ontario. The swirls of color visible across Lake Erie are the result of wind-driven waves stirring sediment from the bottom of the lake, which is the shallowest of the five Great Lakes.