LA NIÑA CONDITIONS PERSIST:
SSTs CONTINUE TO COOL ACROSS WESTERN EQUATORIAL PACIFIC
Sea Surface Temperatures (SSTs) and Mixed Layer Conditions:

The area of sea surface temperature (SST) anomalies colder than -1.5°C (-2.7°F) continued to shift westward and intensify during the month, with the coldest anomalies from approximately 165°E to 120°W in February. Water temperatures in the mixed layer also decreased in February, with an area of -3.0°C (-5.4°F) and colder temperature anomalies between 50 and 150 meters depth of the mixed layer in the eastern equatorial Pacific. Warmer-than-average temperatures remained in the mixed layer in the western equatorial Pacific this month, primarily west of the Dateline.

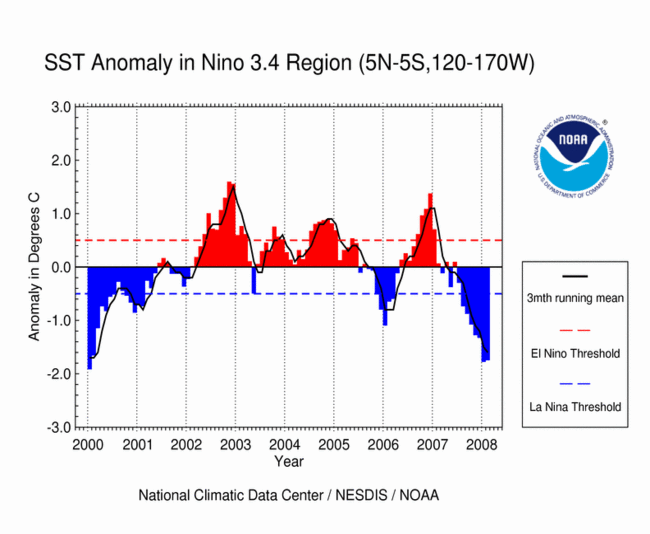
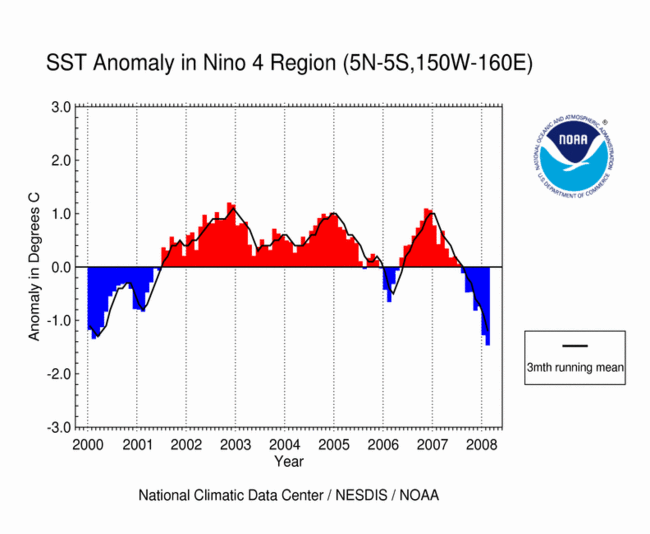
For the month, the SST anomaly in the Niño 3.4 Index region was -1.74°C (-3.13°F) in February, which was a slight increase of 0.03°C (0.05°F) compared to the January anomaly. The SSTs in the Niño 4 Index region of the western equatorial Pacific also cooled during February to a monthly anomaly of 1.46°C (2.29°F) below the mean (map of Niño regions). For the most recent global ocean surface temperatures, please see the loop of satellite-derived weekly SST anomalies for February 2008.

 averaged SST Anomalies")
Significant cooling of the SST anomalies in the Niño 3.4 index region since the beginning of 2008 has kept the 3-month running mean well below -0.5°C (-0.9°F) in February, which is the Oceanic Niño Index (ONI) threshold for a cold event (NOTE: For NOAA's official ENSO classification scheme, please see NOAA's El Niño/La Niña Index Definition).
The Climate Prediction Center's most recent ENSO Diagnostic Discussion indicated that the cold event (La Niña) had reached maturity by the end of 2007, and the SST anomalies over the past two months have cooled further in the western and central equatorial Pacific. The ENSO Wrap-Up from the Australian Bureau of Meteorology (BoM) also reflects mature cold event conditions in the tropical Pacific basin, which they forecast to persist for several months (see the Australian BoM ENSO Wrap-Up).
Equatorial Zonal Winds (U-Component Winds) and Sea-Level Topography:

Anomalous easterlies (i.e., trade winds) were observed across the western equatorial Pacific during February, while in the central equatorial Pacific the trade winds were near-normal, and in the eastern equatorial Pacific they were below normal for the month. Significant week-to-week variability in the near-surface winds has been observed along the equatorial region of the Pacific over the past month, which can be seen in the loop of February zonal winds.


Pacific sea levels measured by the NASA/JPL Jason-1 satellite were below average across the central equatorial Pacific in February, reflecting the cooler-than-average ocean temperatures and the mature phase of the La Niña event. The positive sea level anomalies have moved slowly westward over the past couple of months (see the most recent loop of Pacific basin sea level anomalies).
Outgoing Longwave Radiation (OLR):
The map on the left below shows the spatial pattern of global OLR (in W m-2) measured by satellite during February. A large region of positive OLR anomalies was observed in the western equatorial Pacific centered on the Dateline, illustrating the suppressed tropical convection in this region. The lack of convection along the equator and near the Dateline has persisted for several months, which is clearly seen in the 3-month average OLR anomalies (below right).


The monthly OLR index for February was +2.5 W m-2 averaged across an area in the western Pacific between 160° E and 160° W. This was the thirteenth consecutive month that the OLR index had a positive monthly value. Persistently high positive OLR indices are typical of the mature phase of a La Niña episode.
As of early February, NOAA's Climate Prediction Center (CPC) has forecasted the current La Niña episode to continue through the Boreal spring (March-May) 2008 (click here for CPC's ENSO Diagnostic Advisory Archive). It is expected that the monthly OLR indices will eventually decrease toward neutral (i.e., zero) as the cold event in the equatorial Pacific begins to weaken over the next several months.
Note that high frequency variability in OLR is typically associated with the Madden-Julian Oscillation (MJO, which is convective activity that propagates west to east in the near-equatorial region from the Indian Ocean into the Pacific Ocean approximately every 30-60 days). The latest MJO activity can be seen in CPC's graphs of Daily MJO Indices.
Southern Oscillation Index (SOI):

The standardized SOI was +2.7 in February, which was the highest monthly SOI of the 2007/2008 La Niña so far. In fact, the February SOI was the highest index value since January 1974 when it last reached 2.7. Overall, February was the seventh consecutive month with a positive index value [consistently positive (negative) values of the SOI are typical of La Niña (El Niño) conditions].
Therefore, the anomalously high monthly SOI values during the December to February period indicates the persistence of the mature phase of La Niña across the equatorial Pacific basin.
Additional Links
- ENSO Monitoring
- NOAA El Niño / La Niña Index Definition
- NOAA's Pacific Marine Environmental Laboratory (PMEL):
- NOAA's Climate Prediction Center (CPC):
- NOAA's Physical Science Laboratory
- NASA/JPL Ocean Surface Topography from Space
- Australian Bureau of Meteorology (BoM) Climate Driver Update
- IRI - International Research Institute