|
Contents Of This Report: |


|
Please note that the values presented in this report are based on preliminary data. They will change when the final data are processed, but will not be replaced on these pages.
National Drought Overview
|
|
[top]
Detailed Drought Discussion
Overview
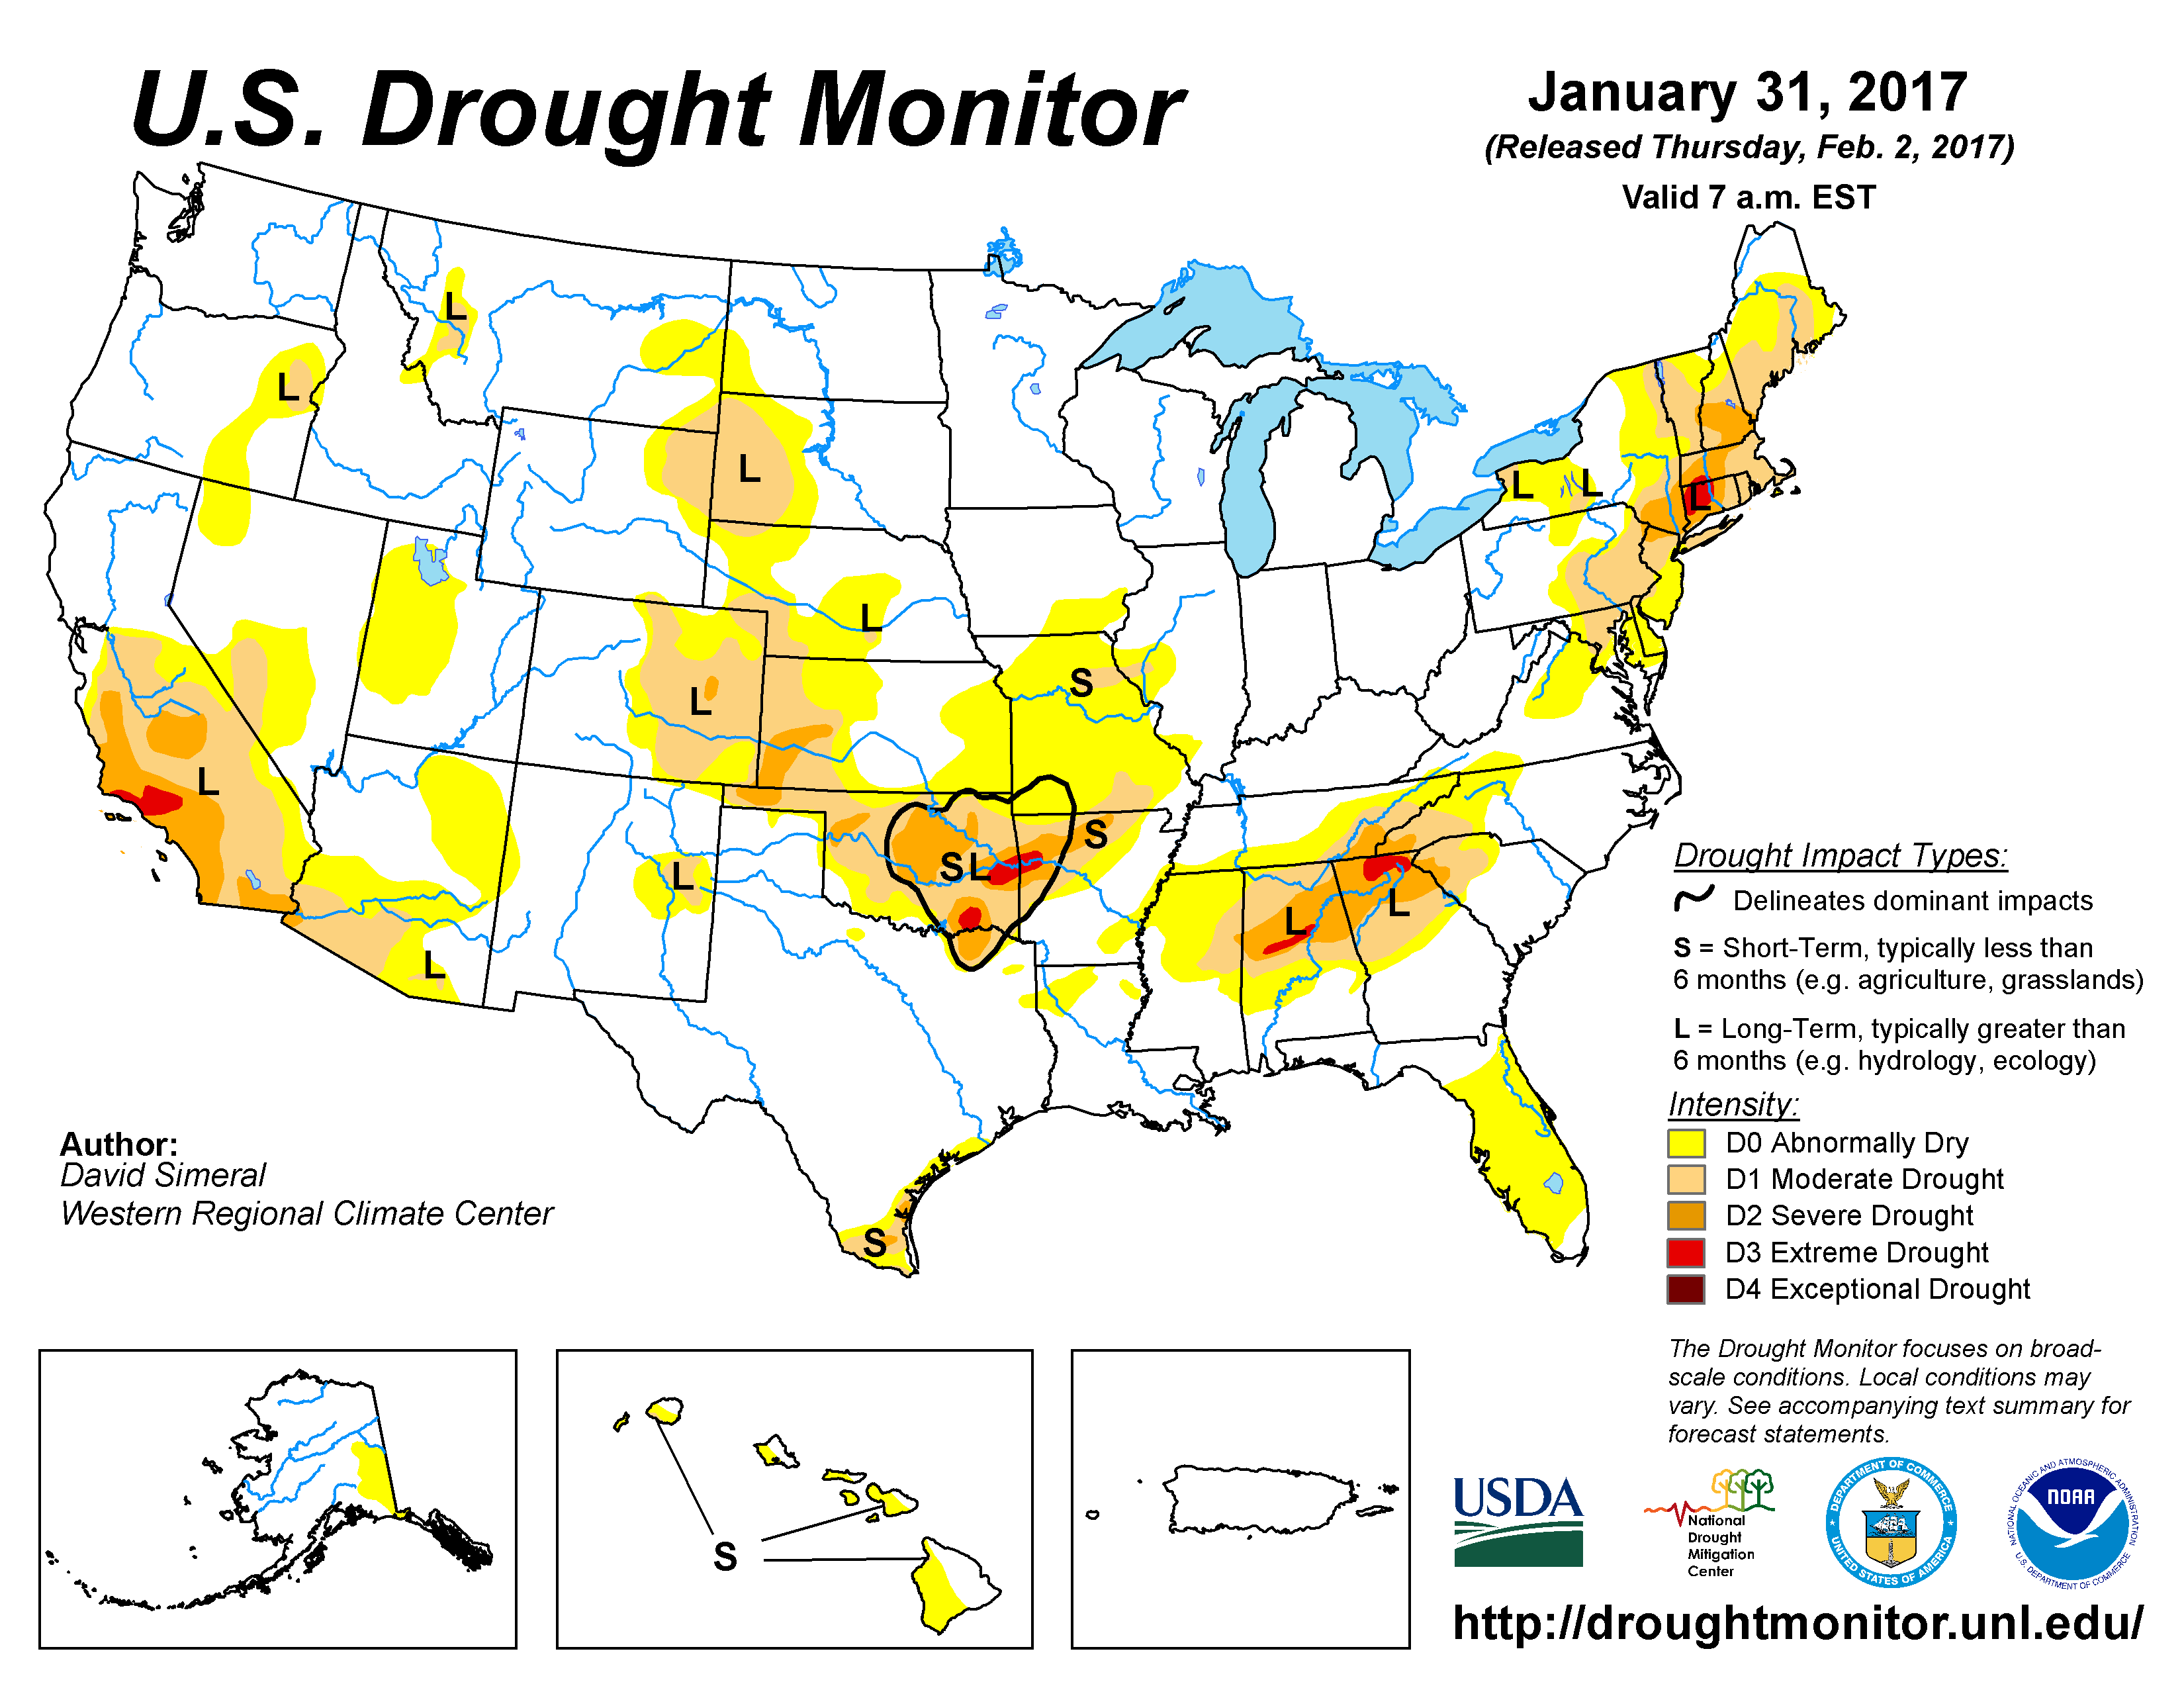
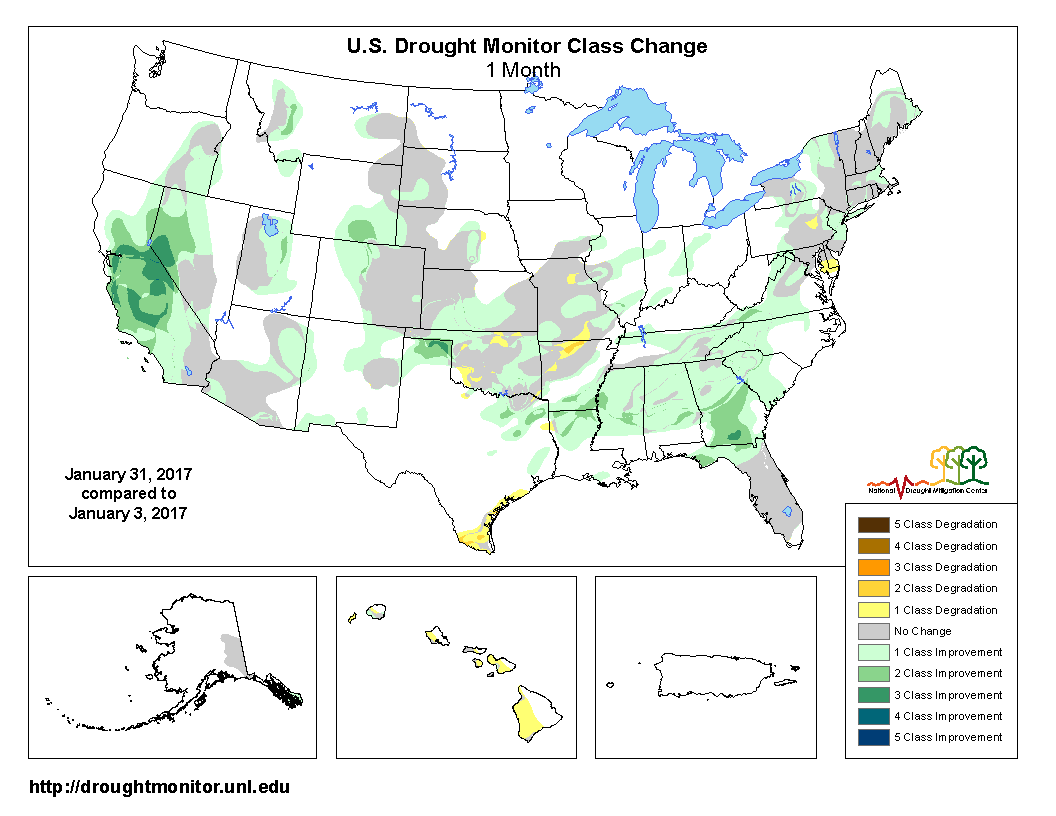
The U.S. Drought Monitor drought map valid January 31, 2017.
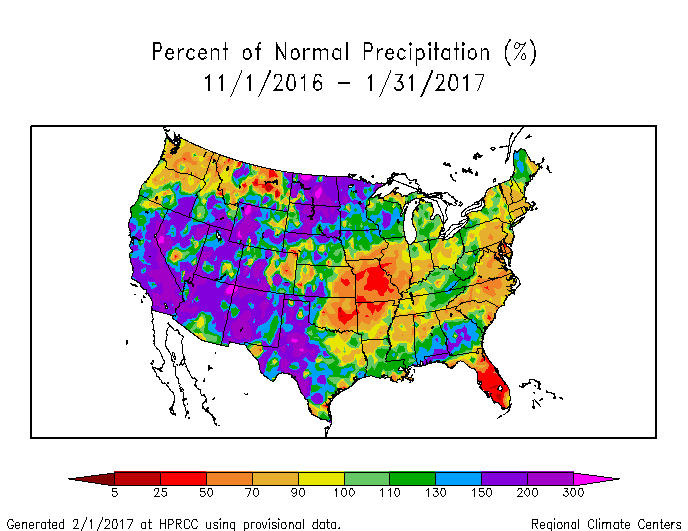
During January 2017, numerous troughs and lows moving in the jet stream flow dragged cold fronts and low pressure systems across the CONUS. These weather systems tapped Pacific and Gulf of Mexico moisture to bring above-normal precipitation to most of the drought areas in the CONUS, contracting drought. January was drier than normal in only a few areas, including parts of the Pacific Northwest, Rio Grande Valley, East Coast, and the drought and abnormally dry area from eastern Oklahoma to the Mid-Mississippi Valley. When precipitation is integrated across the CONUS, the wet and dry areas gave January 2017 a rank of ninth wettest January in the 1895-2017 record. The January precipitation anomaly pattern across Alaska was mixed, but generally wetter than normal in the north and drier than normal in a band from the northwest to southwest. The anomaly pattern across Puerto Rico was mixed, but generally wetter than normal in the west and drier than normal in the southeast. Hawaii was drier than normal across virtually the entire state. Drought was minimal in Alaska, Hawaii, and Puerto Rico. Drought contracted across much of the country, so the USDM-based national moderate-to-exceptional drought footprint decreased across the CONUS from 22.5 percent at the end of December to 14.6 percent at the end of January (from 18.8 percent to 12.2 percent for all of the U.S.). According to the Palmer Drought Index, which goes back to the beginning of the 20th century, about 6.6 percent of the CONUS was in moderate to extreme drought at the end of January, a decrease from last month's 11.2 percent.

Drought conditions at the end of the month, as depicted on the January 31st, 2017 USDM map, included the following CONUS core drought and abnormally dry areas:
- Abnormally dry (D0) to moderate (D1) drought conditions covered a several parts of the western U.S., with pockets of severe (D2) to extreme (D3) drought lingering in California;
- Abnormally dry to moderate drought conditions lingered in the Northern Plains and moderate to extreme drought continued in the Southern Plains;
- Abnormally dry to extreme drought conditions continued in parts of the Northeast; and
- Abnormal dryness and moderate to extreme drought lingered in the Southeast.
Palmer Drought Index
The Palmer drought indices measure the balance between moisture demand (evapotranspiration driven by temperature) and moisture supply (precipitation). The Palmer Z Index depicts moisture conditions for the current month, while the Palmer Hydrological Drought Index (PHDI) and Palmer Drought Severity Index (PDSI) depict the current month's cumulative moisture conditions integrated over the last several months. While both the PDSI and PHDI indices show long-term moisture conditions, the PDSI depicts meteorological drought while the PHDI depicts hydrological drought. The PDSI map shows less severe and extensive drought in parts of the Central and Southeast U.S. than the PHDI map because the meteorological conditions that produce drought and wet spell conditions are not as long-lasting as the hydrological impacts.
|
 |
Used together, the Palmer Z Index and PHDI maps show that short-term dry conditions occurred across parts of the Pacific Northwest and Northern Rockies and a few areas in the Southern Plains and Southeast. This short-term dryness did not have much effect on long-term conditions (PHDI map for December vs. January). Short-term wet conditions reduced long-term drought conditions in parts of the Midwest, Northeast, and Southeast, and virtually eliminated drought from the PHDI map in the West.
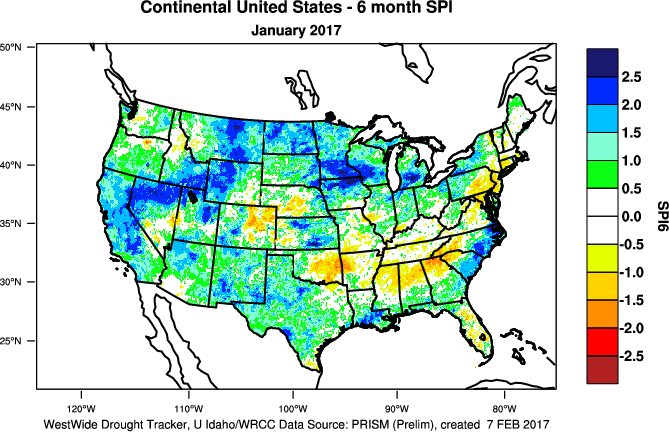
Standardized Precipitation Index
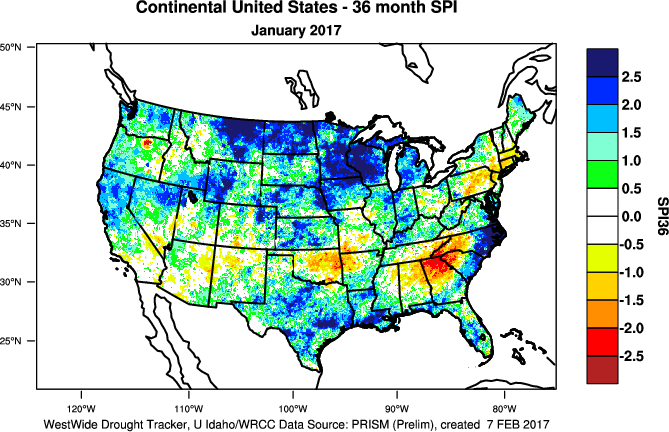
The Standardized Precipitation Index (SPI) measures moisture supply. The SPI maps here show the spatial extent of anomalously wet and dry areas at time scales ranging from 1 month to 24 months.
 |
 |
 |

The SPI maps illustrate how moisture conditions have varied considerably through time and space over the last two years. Parts of the Pacific Northwest and Northern Rockies have been dry for the last 1 to 3 months. Oklahoma to the Mid-Mississippi Valley shows some hint of dryness at the 1- and 12-month time scales, but dryness there is more pronounced at the 2- to 9-month time scales. The Southeast is mostly near to wetter than normal for the last 1 to 2 months, but dryness shows up at the 3- to 12-month time scales. Similarly for parts of the Northeast, dryness is evident for the last 3 to 24 months. The Mid-Atlantic states have some dryness at the 3-month time scale, and western Montana is dry at the 24-month time scale. Otherwise, wet conditions dominate. Of particular note are the wet conditions in the West at all time scales.
 |
 |
 |
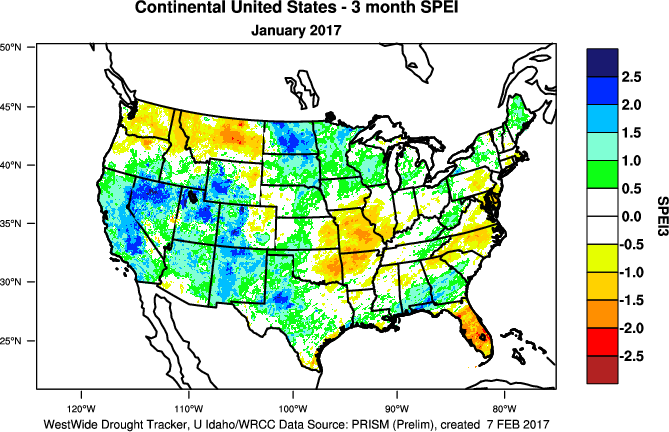
Standardized Precipitation Evapotranspiration Index
The SPI measures water supply (precipitation), while the SPEI (Standardized Precipitation Evapotranspiration Index) measures the combination of water supply (precipitation) and water demand (evapotranspiration as computed from temperature). Warmer temperatures tend to increase evapotranspiration, which generally makes droughts more intense.
 24-month SPEI for current month.
|
 24-month SPI for current month.
|
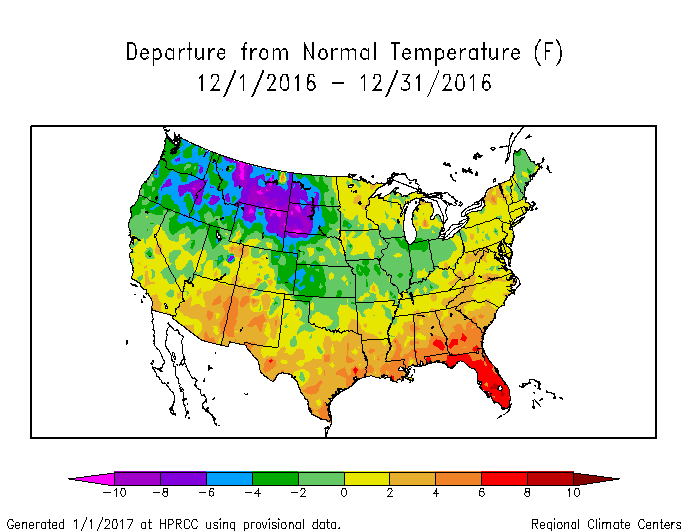
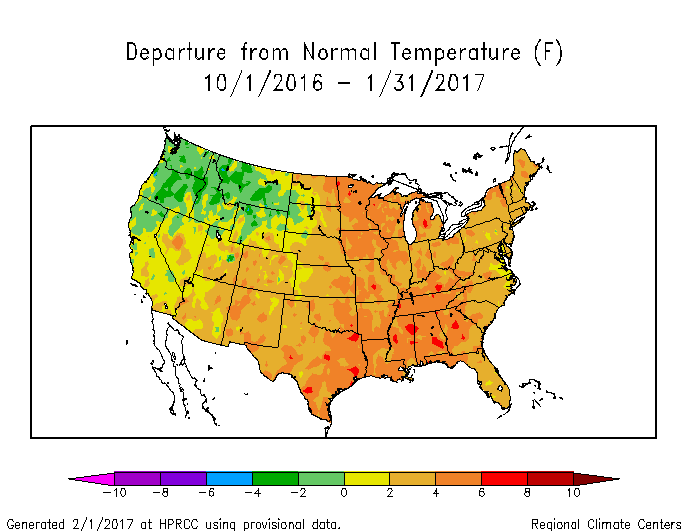
January 2017 temperatures were colder than normal across the Pacific Northwest but significantly warmer than normal from the Plains to the East Coast. The above-normal temperatures did not have much effect this month because evapotranspiration is at a minimum in the winter and because of the widespread wet conditions. This is reflected in the similar wetness and dryness patterns on the SPEI and corresponding SPI maps for January (SPEI map vs. SPI map). Recent precipitation (October and December 2016 and January 2017) has made up for the precipitation deficits of the last 12 months in the West. Significant deficits were still apparent in the Southeast and Northeast during the last 3 to 12 months on both maps, with the unusually warm and persistent temperatures over the last 12 months enhancing drought conditions (SPEI maps for last 3, 6, and 12 months) (SPI maps for last 3, 6, and 12 months).
Southern New England has been the epicenter of drought in the Northeast. The last five years (last five February-January 12-month periods) in Connecticut have been drier to much drier than average, with the most recent 24-month February-January period rivalling the 1960s drought of record in terms of dryness. The Connecticut 24-month SPI for February 2015-January 2017 ranked as the eleventh most severe 24-month SPI in the state's 1895-2017 record. When the unusually warm temperatures of recent years are factored in, the corresponding 24-month SPEI ranked as the fifth most severe on record. Of particular note is the strong warming trend over the last 30 years in Connecticut. Similar conditions are evident in neighboring Massachusetts, which had the fourth most severe 24-month SPEI during February 2015-January 2017.
|
Connecticut Statewide Precipitation, 12-month period February-January, 1895-2017.
|
 Connecticut Statewide Precipitation, 24-month period February-January, 1895-2017.
|
 Connecticut Statewide Temperature, 12-month period February-January, 1895-2017.
|
 Connecticut Statewide 24-month SPEI, February, 1895-2017.
|
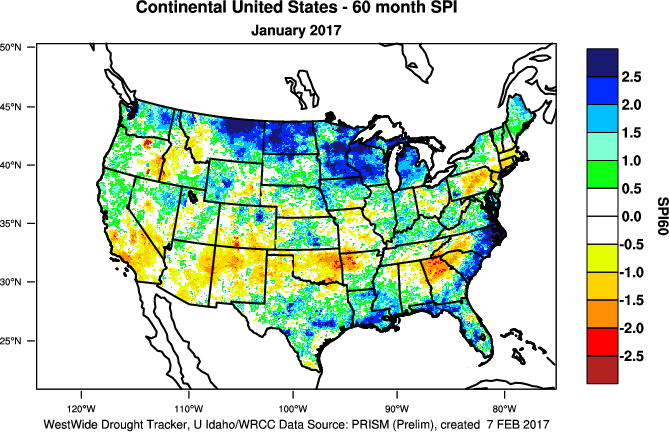
Significant differences between the SPEI and SPI maps begin to appear in the West at the 24-month time frame (SPEI vs. SPI) and become increasingly significant at the 36-month (SPEI vs. SPI), 48-month (SPEI vs. SPI), 60-month (SPEI vs. SPI), and even 72-month (SPEI vs. SPI) time scales. At the 60- and 72-month time scales, deficits are evident in the Southern Plains, suggesting a basis for concern that deep soil moisture/groundwater reserves have not been replenished from earlier (e.g., 2011-2012) droughts, and that this sets the stage for rapid onset of drought impacts when dry conditions return there.
 |
 |
 |
The difference in SPEI and SPI depictions in the West is due to persistent above-normal temperatures for the last several years which have increased evapotranspiration and exacerbated drought conditions. Even with widespread near- to cooler-than-normal temperatures across the West in August, September, October, and December 2016, and January 2017, the 12-month February 2016-January 2017 temperatures still ranked in the top ten warmest category for all western states except Oregon (which ranked eleventh warmest).
This is especially the case in California, where the last four years (February-January 12-month periods) were the four warmest such periods for the state in the 1895-2017 record and exceeded all other years by a wide margin. These four years cap a period of persistent unusual warmth which has lasted over three decades. The recent wet conditions were enough to make the statewide SPI wet for the last 12 to 36 months and only slightly dry (near zero) for the 48- to 72-month time periods. When temperature (evapotranspiration) is factored in, the recent wetness brought the SPEI to near zero at the 12- to 36-month time scales, but it was still quite dry at longer time scales, ranking as the eleventh most severe SPEI at the 48-month time scale, sixth most severe at the 60-month time scale, and tenth most severe at the 72-month time scale.
 California statewide precipitation, February-January, 1895-2017.
|
 California statewide precipitation and departure from normal, January 2009-January 2017.
|
 California statewide temperature, February-January, 1895-2017.
|
 California statewide 60-month SPEI for January, 1895-2017.
|
Regional Discussion
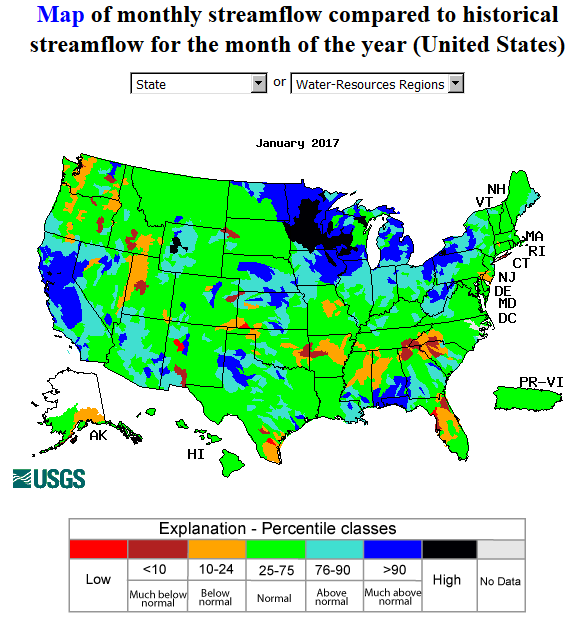
 USGS streamflow percentiles
|
 USDA NRCS mountain snowpack
|
 USDA NRCS reservoir percentiles
|
 NLDAS soil moisture percentiles
|
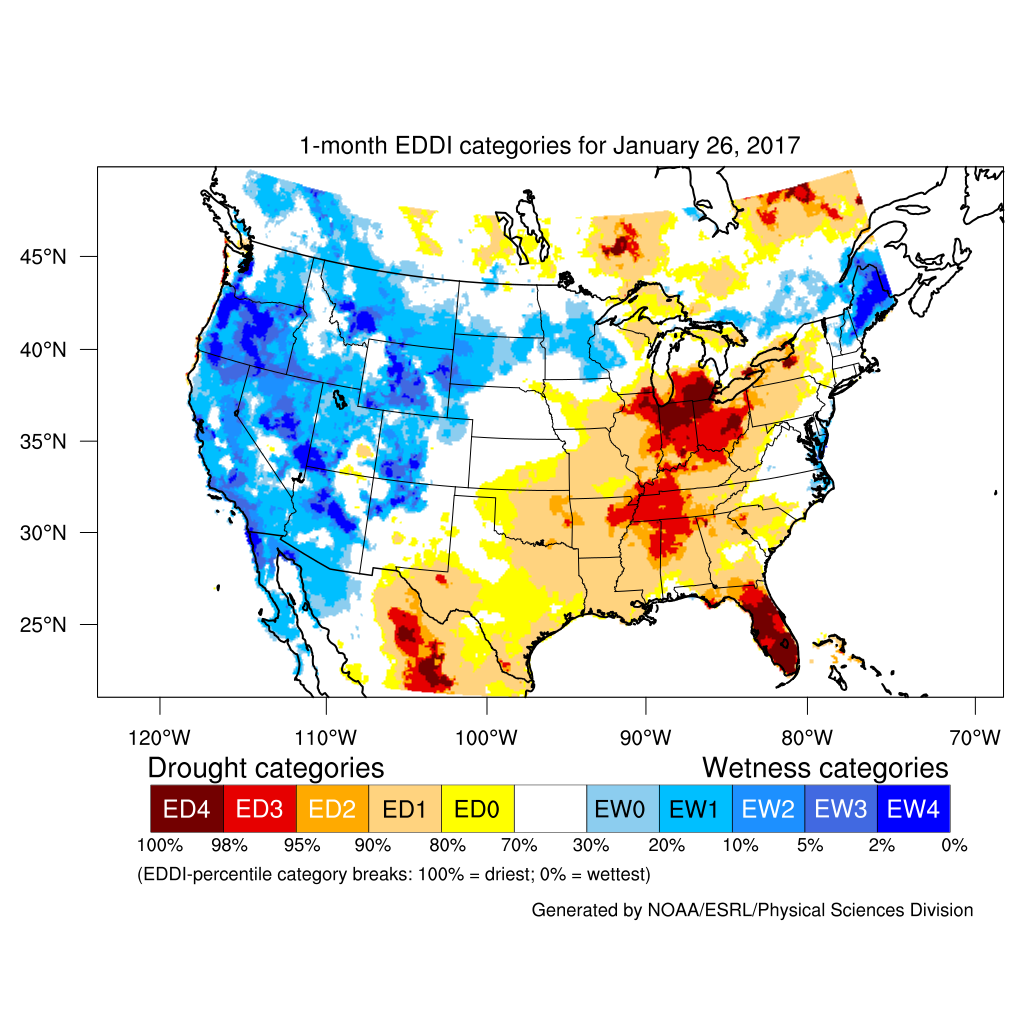 Evaporative Drought Demand Index (EDDI)
|
 USGS maximum consecutive dry days
|
CONUS Agricultural & Hydrological Impacts:
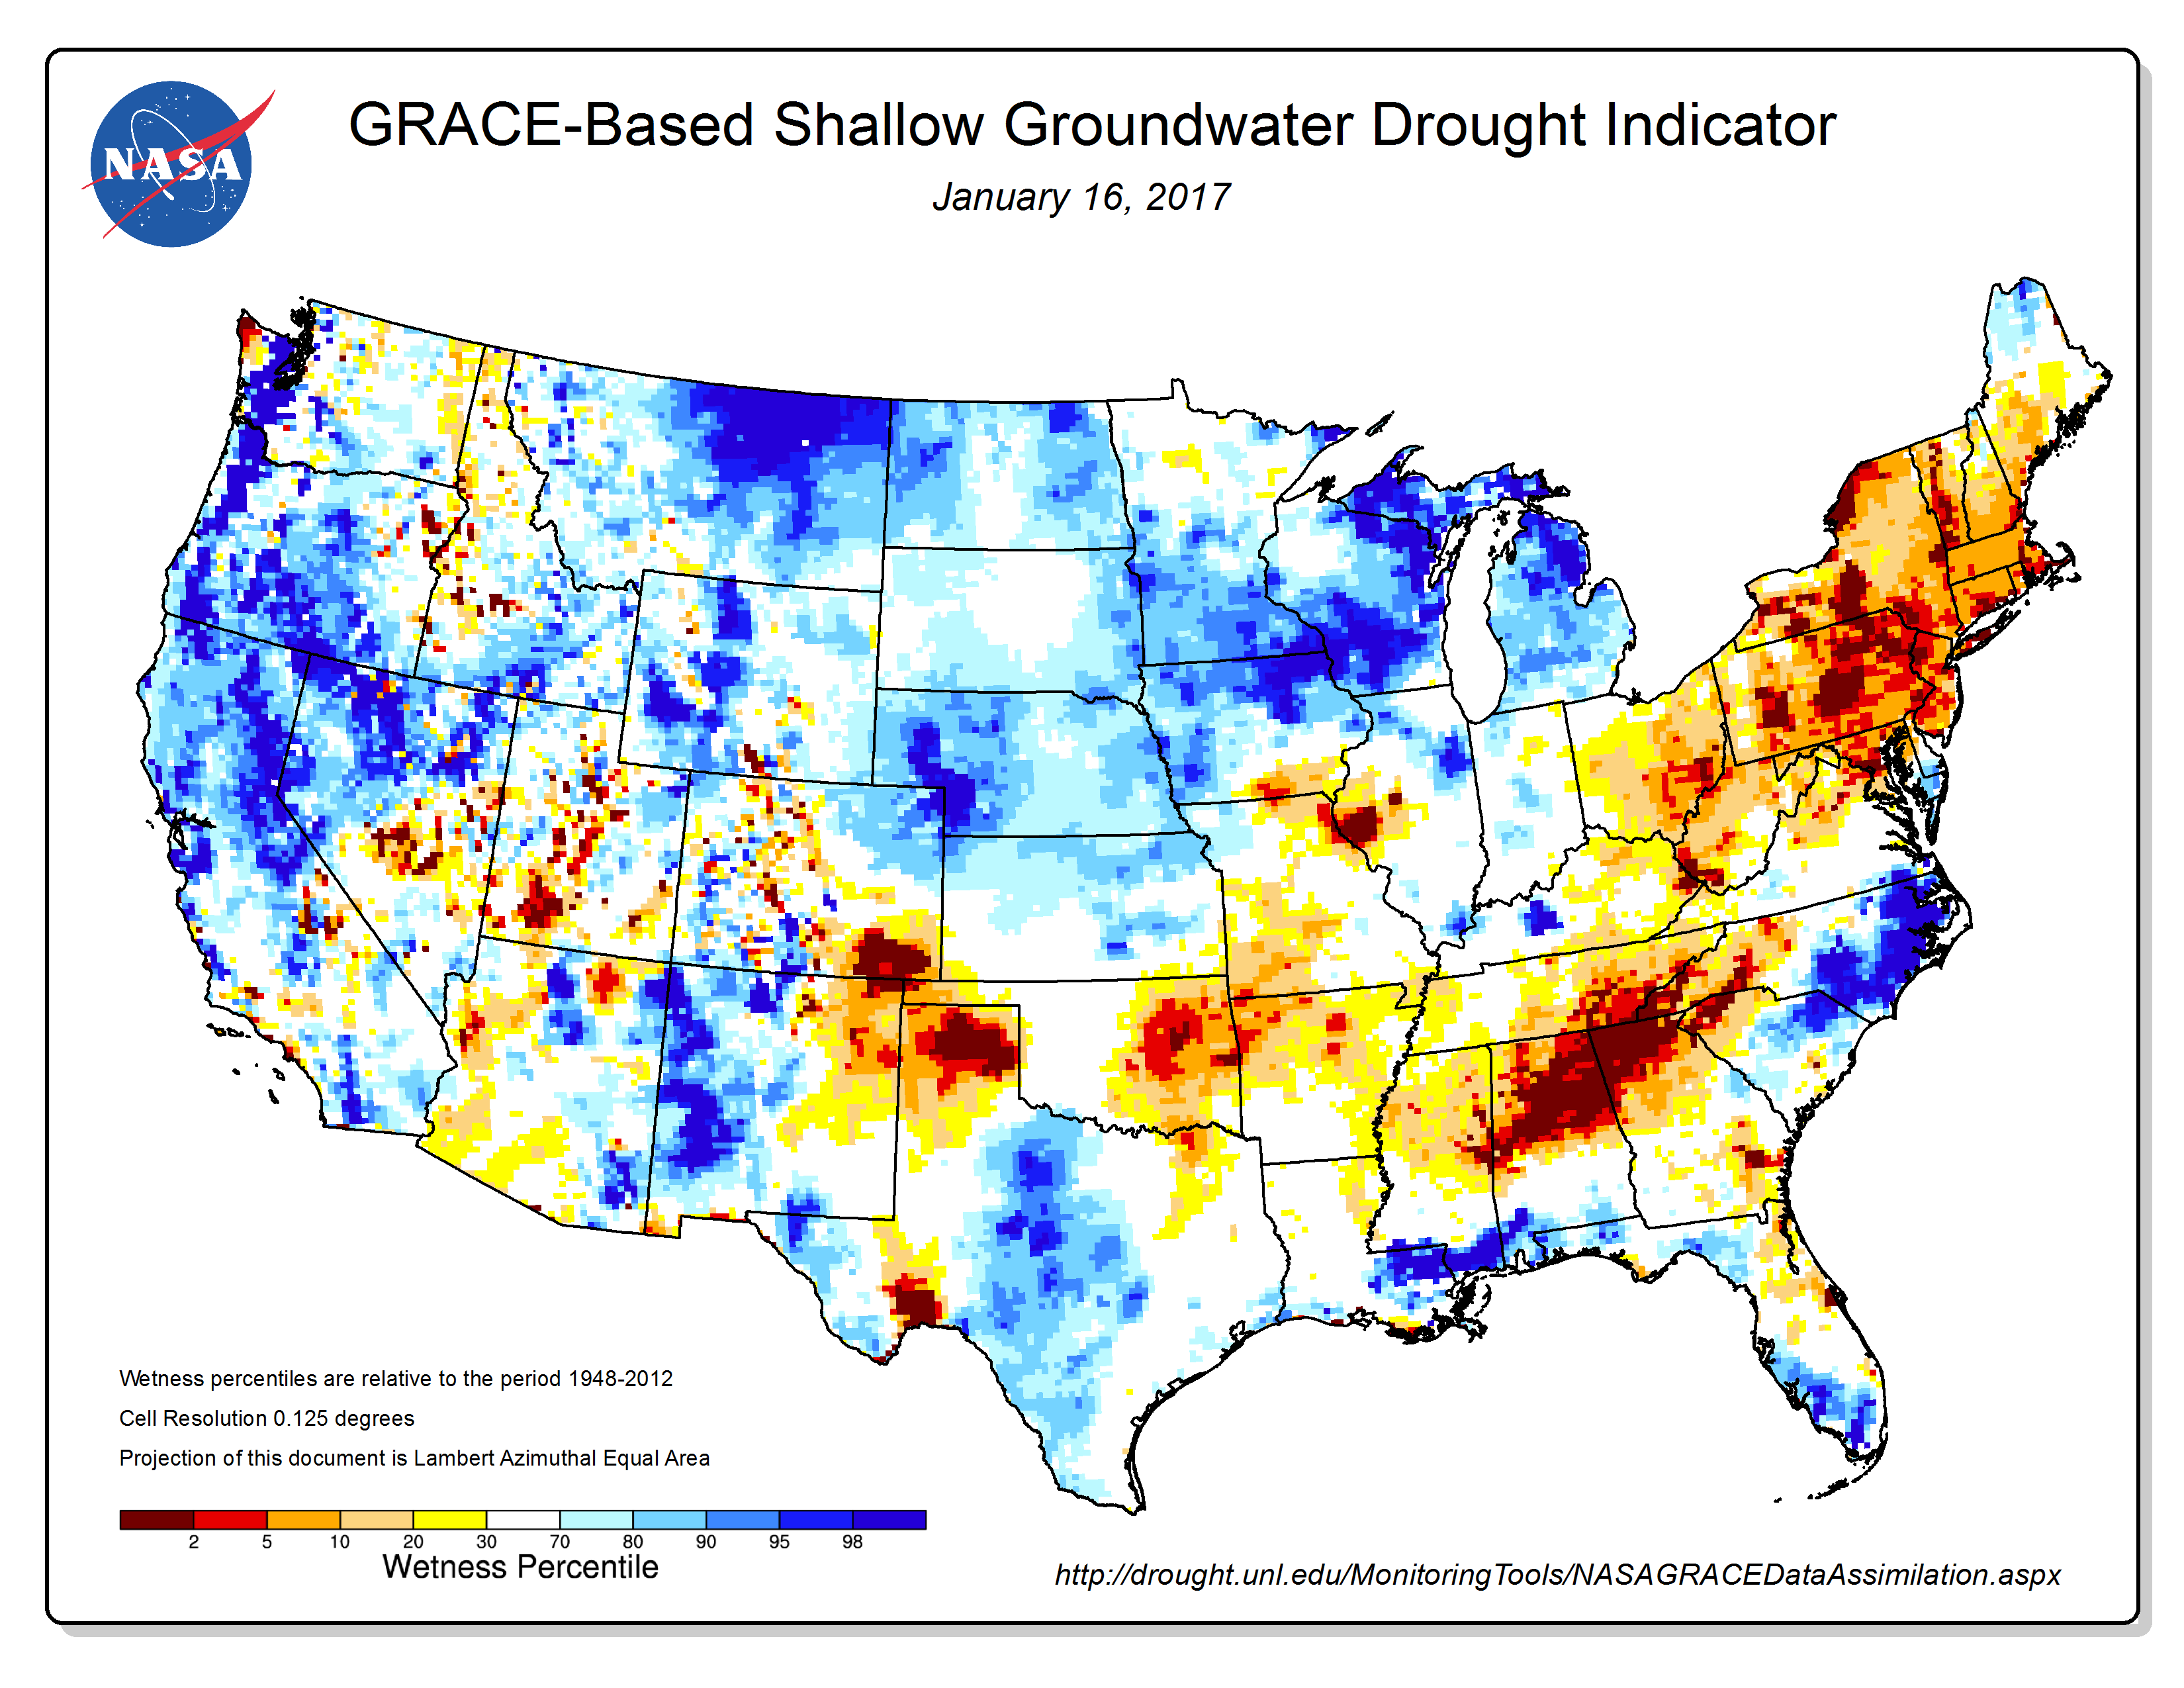
Drought conditions at the end of January 2017 were reflected in a number of meteorological, hydrological, and agricultural indicators, both observed and modeled. These include: evapotranspiration (EDDI, ESI) and soil moisture (SMOS satellite-based model, Leaky Bucket model, CPC model, NLDAS model topsoil and total column, VIC model, NASA GRACE surface and root zone soil moisture). The widespread above-normal precipitation during January has improved conditions in most areas, especially soil moisture and, across much of the West, mountain snowpack. But where the dry conditions have lasted for several months, hydrological conditions such as streamflow and groundwater supplies (USGS observations, NASA GRACE estimates) were reduced, as well as reservoir levels in the West. On a national scale, as of January 31st, 2017, 19 percent of the nation's cattle inventory, 16 percent of the nation's hay, 20 percent of winter wheat production, five percent of corn production, and two percent of soybean production were in drought. These percentages are decreases compared to the values for the end of December.
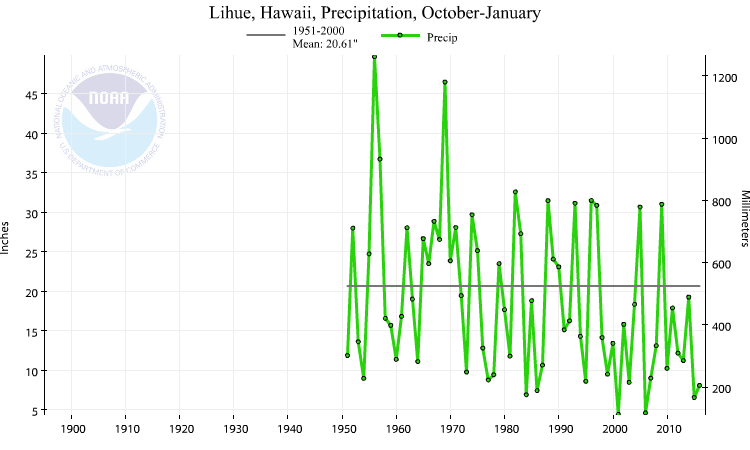
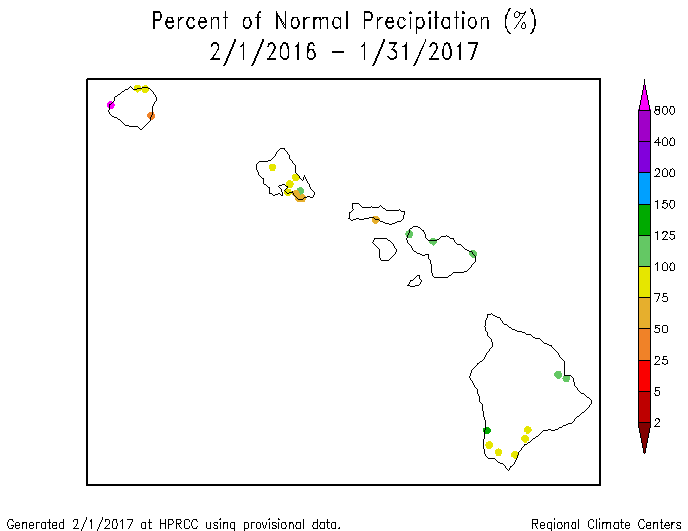
Lihue, Hawaii, precipitation, October-January, 1951-2017.
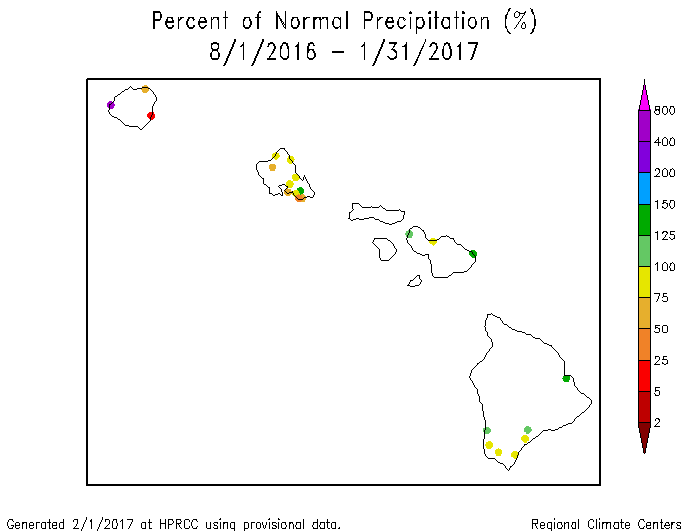
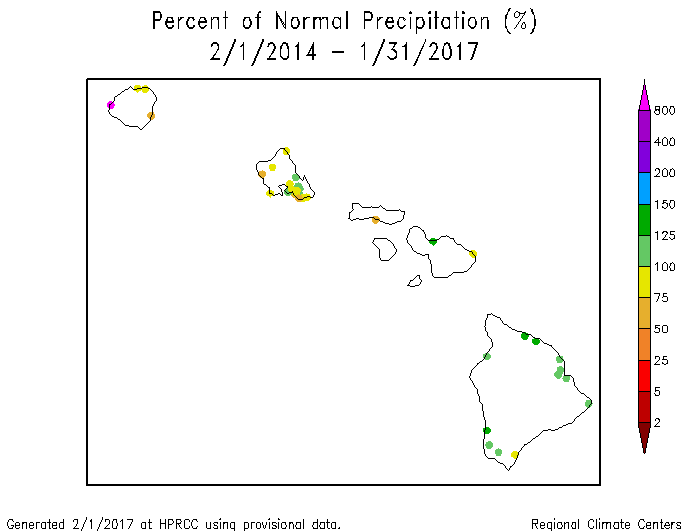
Hawaii: January 2017 was drier than normal across most of Hawaii. The precipitation anomaly pattern for the last 2, 3, 4, and 6 months consisted of drier-than-normal conditions across the northern islands (Kauai to Oahu) and near-normal to wetter-than-normal conditions across the southern islands (Maui to The Big Island). A mixed precipitation anomaly pattern is evident at the longer time scales (last 7, 10, 12, 24, and 36 months). Abnormally dry conditions expanded during January, covering more than half of the state on the January 31st, 2017 USDM map, but drought contracted to under two percent.

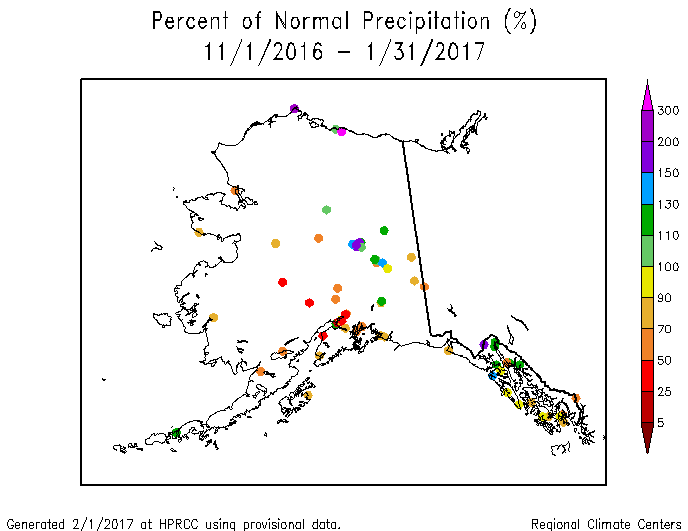
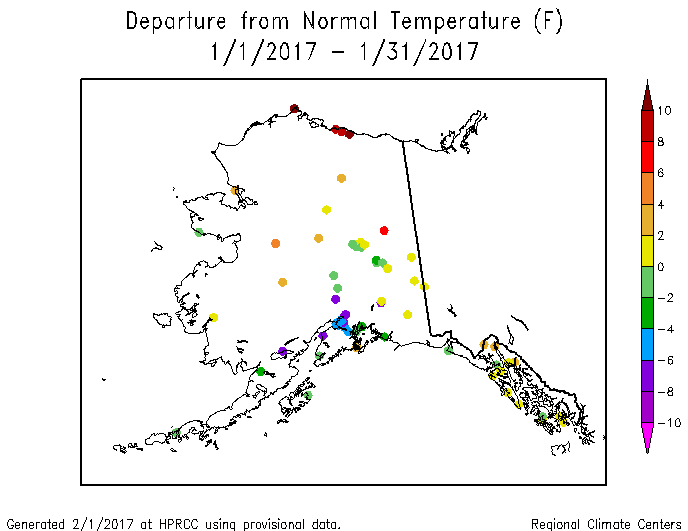
Alaska gridded percent of normal precipitation map for the current month.
Alaska: January was wetter than normal at the stations in the northern and eastern sections of Alaska, and drier than normal in a band from the northwest to southwest (as seen on the climate division, gridded, low elevation station, and high elevation station SNOTEL maps). A similar pattern is evident for the last two months. A drier-than-normal pattern dominates for the last three (climate division, gridded, low elevation station maps) and four (low elevation station, SNOTEL station, and SNOTEL basin maps) months, then the anomaly pattern becomes mixed at longer time periods (climate division maps for the last 6 to 12 months) (6-month gridded map) (low elevation station maps for last 6, 7, 10, 12, 24, and 36 months). January was warmer than normal in the north and east and cooler than normal at the south central stations. For December 2016-January 2017, the northwest half of the state was warmer than normal and the southeast half cooler than normal. A warmer-than-normal/north and cooler-than-normal/south pattern was evident at the 3-month time scale (divisional, gridded, low elevation station maps). Above-normal anomalies progressively spread over larger parts of the state at the longer time scales (low elevation station maps for last 4 to 12 months) (divisional maps for the last 6 to 12 months) (6-month gridded map). Mountain snowpack and snow water content were below normal. About nine percent of the state was abnormally dry on the January 31st USDM map.

San Juan, Puerto Rico, precipitation, February-January, 1956-2017.
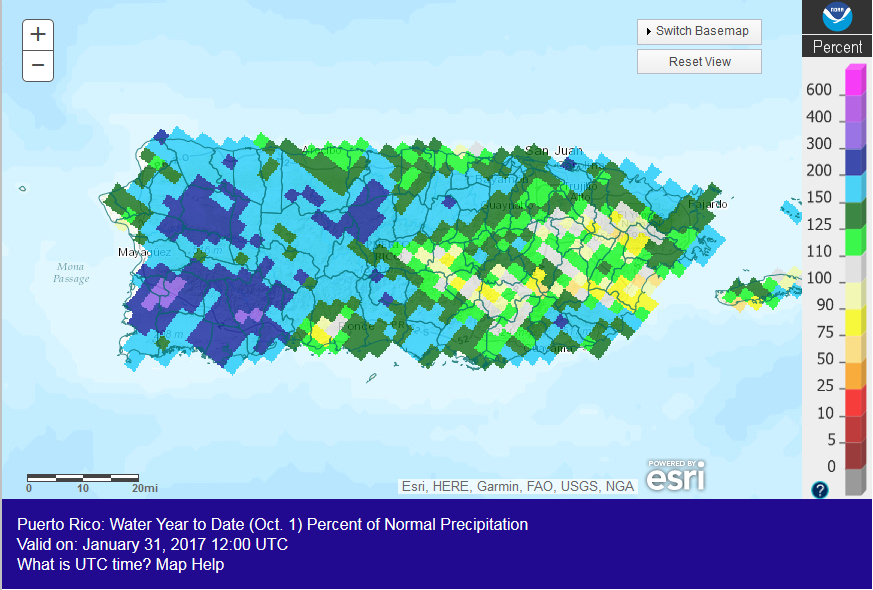
Puerto Rico: January was drier than normal in southeast Puerto Rico and wetter than normal in the west. The last 4 months were mostly wetter than normal, but dryness in the southeast re-appears at the 6-month time scale. For the last 12 months, San Juan had the fifth driest February-January in their 1956-2017 record, in marked contrast to the previous 12 years. Soils were moist across most of the island, with some dryness evident along the southern coast. Puerto Rico was free of drought and abnormal dryness on the January 31st, 2017 USDM map.
CONUS State Precipitation Ranks:
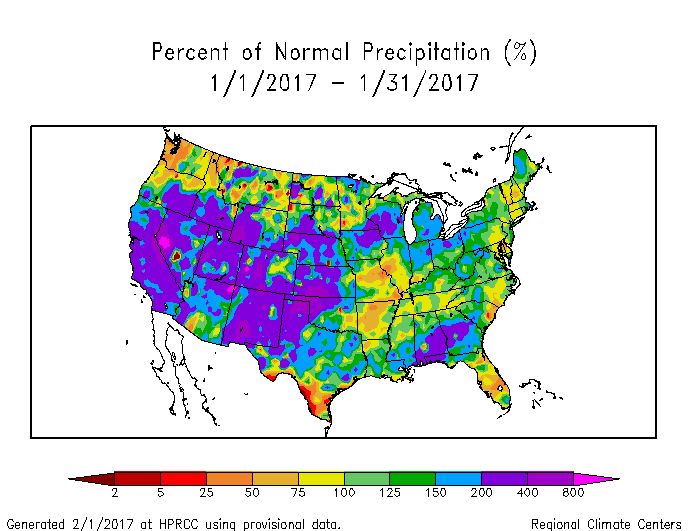
| January 2017 was drier than normal across parts of the Pacific Northwest, Mid-Mississippi Valley, Rio Grande Valley, and East Coast, but wetter than normal across most of the rest of the CONUS. Only two states in the CONUS ranked in their driest third of the 1895-2016 record (Montana and Washington). |

|
 |
The last three months had a similar precipitation anomaly pattern, except the dry anomalies in the Mid-Mississippi Valley and East Coast were more severe and widespread. Nine states ranked in their driest third of the historical record for November-January, but none were in the top ten driest category. |
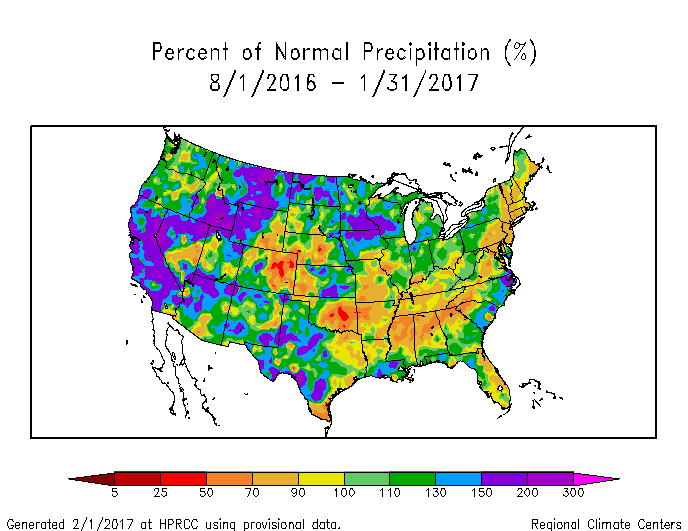
| Wet conditions dominated the western CONUS for the last six months, with only five states in the Tennessee Valley and Northeast ranking in their driest third of the historical record for August-January. |

|
 |
|
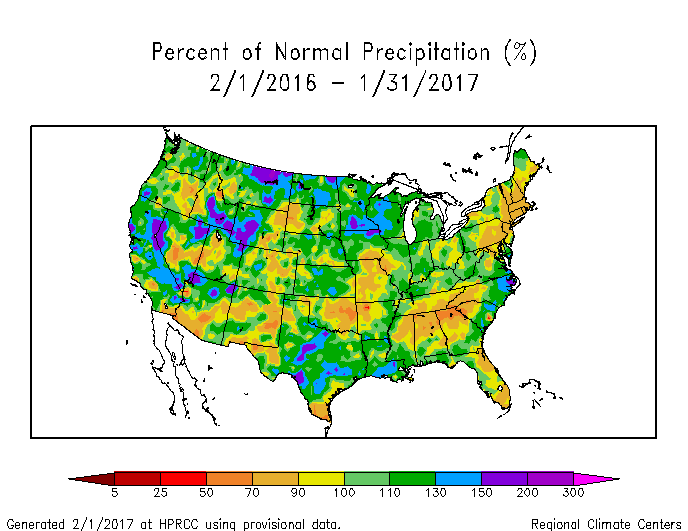
February 2016-January 2017 was drier than normal in scattered parts of the West, parts of the Southern Plains to Mid-Mississippi Valley, and larger parts of the Southeat and Northeast. Seven states in the Southeast and Northeast ranked in their driest third of the historical record, including Connecticut which had the tenth driest February-January.

|

|

Percent area of the Western U.S. in moderate to extreme drought, January 1900 to present, based on the Palmer Drought Index.
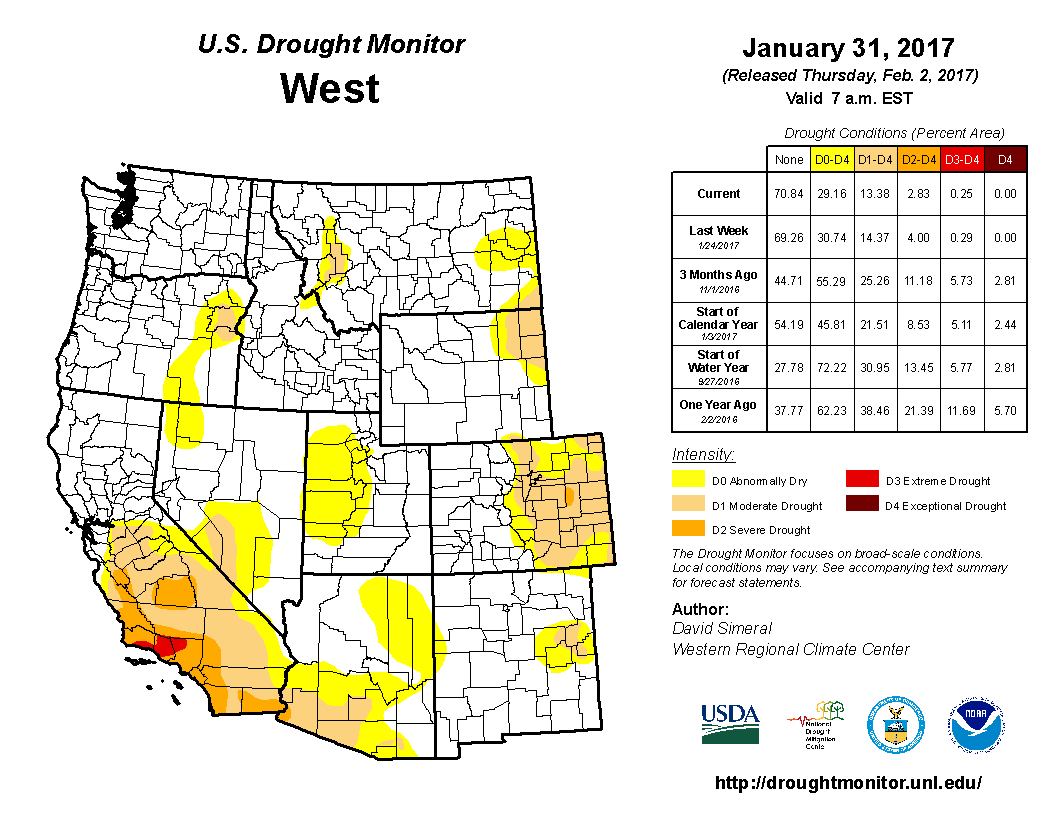
January 2017 was another wetter than normal month across much of the West, especially the Southwest to Southern and Central Rockies. Parts of the Northwest to Northern Rockies were drier than normal. The water year to date (October 1-January 31) has been wetter than normal for most of the West. The precipitation has increased streamflow, refilled reservoirs (especially in California), and increased mountain snowpack (especially from California to the Southern Rockies). The storm track has favored the southern regions, so parts of the Pacific Northwest and Northern Rockies have a below-normal snowpack. The slow melting during spring of a thick winter snowpack provides an important water source for the West during the summer dry season.
The above-normal precipitation which has fallen in recent months has made up for the deficits over the last 12 to 24 months, but significant precipitation deficits still exist at the 48- to 72-month time scales. Drought in the West has been eliminated on the Palmer drought analysis, which reflects the 12 to 24-month time scales. But according to the USDM, 13.4 percent of the West was still experiencing moderate to extreme drought at the end of January, which is less than the 21.5 percent of the previous month.
 Primary Hard Red Winter Wheat Belt precipitation, January, 1895-2017.
|
 Primary Hard Red Winter Wheat Belt precipitation, October-January, 1895-2017.
|
January 2017 was wetter than normal across the Primary Hard Red Winter Wheat agricultural belt, while parts were warmer than normal and other parts near to cooler than normal. The month ranked as the second wettest and 32nd warmest January, regionwide, in the 1895-2017 record. October serves as the beginning of the growing season. October 2016-January 2017 was wetter than normal in places and drier than normal in others, and warmer than normal across the region, ranking as the fifth warmest and 55th driest October-January, regionwide, on record.
NOAA Regional Climate Centers:
A more detailed drought discussion, provided by the NOAA Regional Climate Centers and others, can be found below.
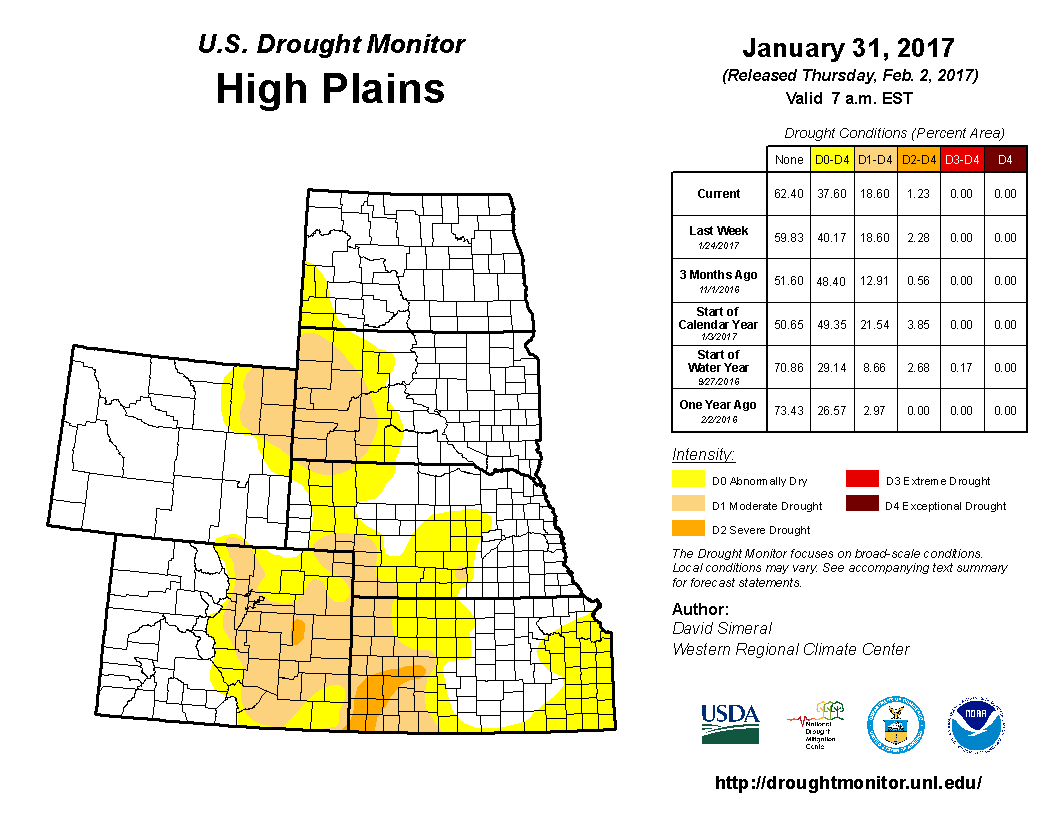
As described by the High Plains Regional Climate Center, much of the High Plains experienced wet conditions during January, as precipitation was greater than 200 percent of normal across parts of Wyoming, Colorado, Nebraska, and Kansas. Heavy snow blanketed the Rockies, further boosting snowpack that had already begun to build rapidly due to a wet December. This abundant precipitation helped ease drought conditions in the region. Heavy precipitation and large changes in drought conditions in the High Plains are rare for this time of year. Temperatures were cooler than normal in the western High Plains, while the eastern High Plains and western Colorado experienced slightly above-normal temperatures. During the winter, producers in the High Plains region monitor the weather conditions closely for winter wheat. According to the U.S. Department of Agriculture, farmers in western Kansas and eastern Colorado have been concerned about winter wheat stands due to dry conditions in the fall, which has caused growth to fall behind. Also, a lack of snow cover has left the crop vulnerable during outbreaks of Arctic air. As of the end of January, the majority of the winter wheat crop in Kansas and Colorado was in fair or good condition.
Overall, drought conditions improved throughout the High Plains in January. Region-wide, the area in drought (D1-D4) on the USDM decreased from about 22 percent to 19 percent, and the area experiencing drought or abnormal dryness (D0-D4) improved from approximately 49 percent to 38 percent. One area that saw significant improvement of drought conditions during January was the Black Hills region of South Dakota. According to the January 31st USDM, severe drought (D2) improved to moderate drought (D1) in the Black Hills due to wet conditions during the past 30-90 days. SNOTEL stations in the region were reporting near-normal Snow Water Equivalent (SWE) values. This particular area has been dealing with drought conditions since early summer. Another area that experienced drought relief was in Kansas. Southern areas of the state received impressive rains in January that led to the trimming of D2 conditions, while abnormally dry conditions (D0) were removed from central Kansas. Improvements made were primarily due to heavy precipitation that fell as part of the major storm system that moved through in the middle part of the month. Drought conditions also improved in southeastern Wyoming, central Nebraska, and eastern Colorado.
As explained by the Southern Regional Climate Center, January was a warmer-than-normal month for all six states in the Southern region and precipitation values varied spatially across the region. Precipitation totals in western Texas and western Oklahoma ranged between 130 to over 200 percent of normal. By contrast, conditions were quite dry across much of eastern Oklahoma and Arkansas, with most stations reporting between 25 to 70 percent of normal. Over the month, drought conditions improved in some areas, but worsened in others. In Mississippi, anomalously high precipitation totals helped eradicate drought in most of the northern counties. This was also the case in northern Louisiana. Elsewhere, drought conditions did not change significantly.
As summarized by the Midwest Regional Climate Center, January temperatures were above normal across the Midwest while precipitation totals ranged from 0.50 inch (13 mm) in western Minnesota to more than 5.00 inches (127 mm) in central Kentucky. As a percentage of normal, values ranged from less than 75 percent of normal in parts of Minnesota, Missouri, and Illinois to more than 200 percent of normal in large parts of the upper Midwest. Drought was a limited concern in January. The month began and ended with less than 2 percent of the region in drought. Although the area swelled to nearly 9 percent mid-month, few impacts were noted as vegetative demand and evaporation were low and rain that fell was soaked into unfrozen soils.
As noted by the Southeast Regional Climate Center, temperatures were well above average across the Southeast region and precipitation ranged from near normal to above normal across much of the region, with several wet extremes recorded. Monthly precipitation totals were 1 to 4 inches (25.4 to 102 mm) above normal in portions of central and western Puerto Rico but were 1 to 4 inches below normal in parts of eastern Puerto Rico and the U.S. Virgin Islands.
Drought conditions improved significantly across the interior portion of the region during January. The coverage of extreme-to-exceptional (D3-D4) drought across the Southeast decreased from 21 percent on December 27th to 1 percent on January 31st. Exceptional drought conditions were completely removed from the region, and only two small areas of extreme drought remained in portions of central Alabama and northeastern Georgia. In addition, moderate-to-severe (D1-D2) drought was significantly reduced or removed across broad portions of the region, including central and southern Alabama, central and southern Georgia, the Florida Panhandle, the western Carolinas, and northern and southwestern Virginia. Despite the beneficial rainfall across the interior portion of the region, streamflow and lake levels remained slow to recover in some areas from the long-term effects of the drought. Warmer-than-average temperatures and more consistent rainfall improved pasture conditions in Alabama, Georgia, and the western Carolinas. However, livestock producers continued to purchase hay for their herds since the pastures had not recovered enough to support cattle grazing. Fruit and vegetable crops in some areas were behind on chilling hours due to the unusual warmth during the month, with blueberry plants in Georgia and Florida already beginning to bud.
As explained by the Northeast Regional Climate Center, the Northeast received 3.67 inches (93.22 mm) of precipitation, 118 percent of normal, in January, and January 2017 was the ninth month in a row the region was warmer than normal. The USDM released on January 5 indicated 44 percent of the Northeast was in a moderate, severe, or extreme drought, with another 26 percent being abnormally dry. Drought and abnormally dry conditions lingered, but slowly eased during January. Extreme drought continued in western portions of Massachusetts and Connecticut. Severe drought eased in eastern Massachusetts, New York's Long Island, northern New Jersey, and eastern Pennsylvania. Moderate drought eased in eastern Maine, the New York City metro area and central New Jersey. Abnormal dryness eased in northern and central New York, portions of Pennsylvania, west Maryland, and West Virginia. However, abnormal dryness expanded in southern Delaware and eastern Maryland. The USDM released on January 26 indicated 41 percent of the Northeast was in a moderate, severe, or extreme drought, with another 20 percent being abnormally dry. January average streamflow ranged from much below normal to much above normal, with many areas near normal. Groundwater levels remained near to below normal for a majority of the drought-stricken areas. While water levels in many reservoirs continued to increase slowly, they also generally remained below normal capacity. For instance, on January 3, the New York City reservoir system was at 65.4 percent of capacity compared to its normal capacity of 87.4 percent. By January 31, the system had increased to 76.9 percent of capacity, but was still below its normal capacity of 87.7 percent. Effective January 1, northeastern Massachusetts improved from a Drought Warning to a Drought Watch. Aquarion asked its water users in Connecticut to reduce indoor use by 20 percent. On January 18, the Delaware River Basin Commission lifted the drought watch for the basin, returning it to normal status. Worcester, Massachusetts' drought status improved to a Drought Warning effective January 23. The city had been under a Drought Emergency since September 2016. The Emergency Declaration issued for Ipswich, MA in mid-September due to a water supply shortage was terminated on January 26 because the town's water supply had recharged. The combined storage of twelve reservoirs operated by four water suppliers that serve northeastern New Jersey, the most densely populated part of the state, was around 80 percent of capacity, or near normal, as of January 30.
As summarized by the Western Regional Climate Center, a progressive storm track featuring several moderate to strong atmospheric rivers produced impressive precipitation totals across the southern two-thirds of the West. In contrast, the northern tier of the region generally saw below normal precipitation. Temperatures were below normal across the Northwest, slightly above normal in New Mexico and the Four Corners region, and near normal elsewhere.
Storms impacting the West this month brought beneficial precipitation to drought stricken areas of California and Nevada, as well as damaging floods, travel disruptions, and avalanche hazards. Sierra Nevada snowfall was well above normal. Orientation and characteristics of these storms favored moisture to penetrate inland and impact the Great Basin and Southwest.
At the end of January, most major mountain areas of the West were reporting above normal snow water equivalent (SWE); some basins in the Sierra Nevada and central Rocky Mountains reported SWE in excess of 150% of normal. The exception was the northern Rockies and northern Cascades. Snowpack in these areas was generally less than 80% of normal. The above-normal precipitation and healthy snowpack contributed to improvement of drought conditions across much of California and Nevada as depicted in the USDM. Areas of California's South Coast that have been entrenched in extreme to exceptional drought since 2013 observed significant rainfall this month, improving conditions such that only a small area of extreme drought conditions remain. However, moderate to severe drought still covers nearly all of southern California due to long-term impacts. Areas of improvement were also noted in at least a small portion of all other contiguous western states.
Drier-than-normal conditions were observed across much of the state of Hawaii this month, with the exception of some Big Island windward locations. Lihue, Kauai, had its driest January on record, reporting only 0.2 in (5 mm) of rainfall, 19% of normal. Records for Lihue began in 1950. The dry conditions prompted expansion of "abnormally dry" in the USDM from roughly 10% of the state at the beginning of the month to 54% of the state by the end of the month. In Alaska, temperatures were above normal in the northern third of the state and near to well below normal in the southern two-thirds. Many locations across Alaska observed near to above normal precipitation. In the Southeast, precipitation was near normal, though much fell as rain rather than snow, continuing a trend of below normal snowfall seen in recent years.
Pacific Islands: The NOAA National Weather Service (NWS) offices, the Pacific ENSO Applications Climate Center (PEAC), and partners provided reports on conditions across the Pacific Islands.
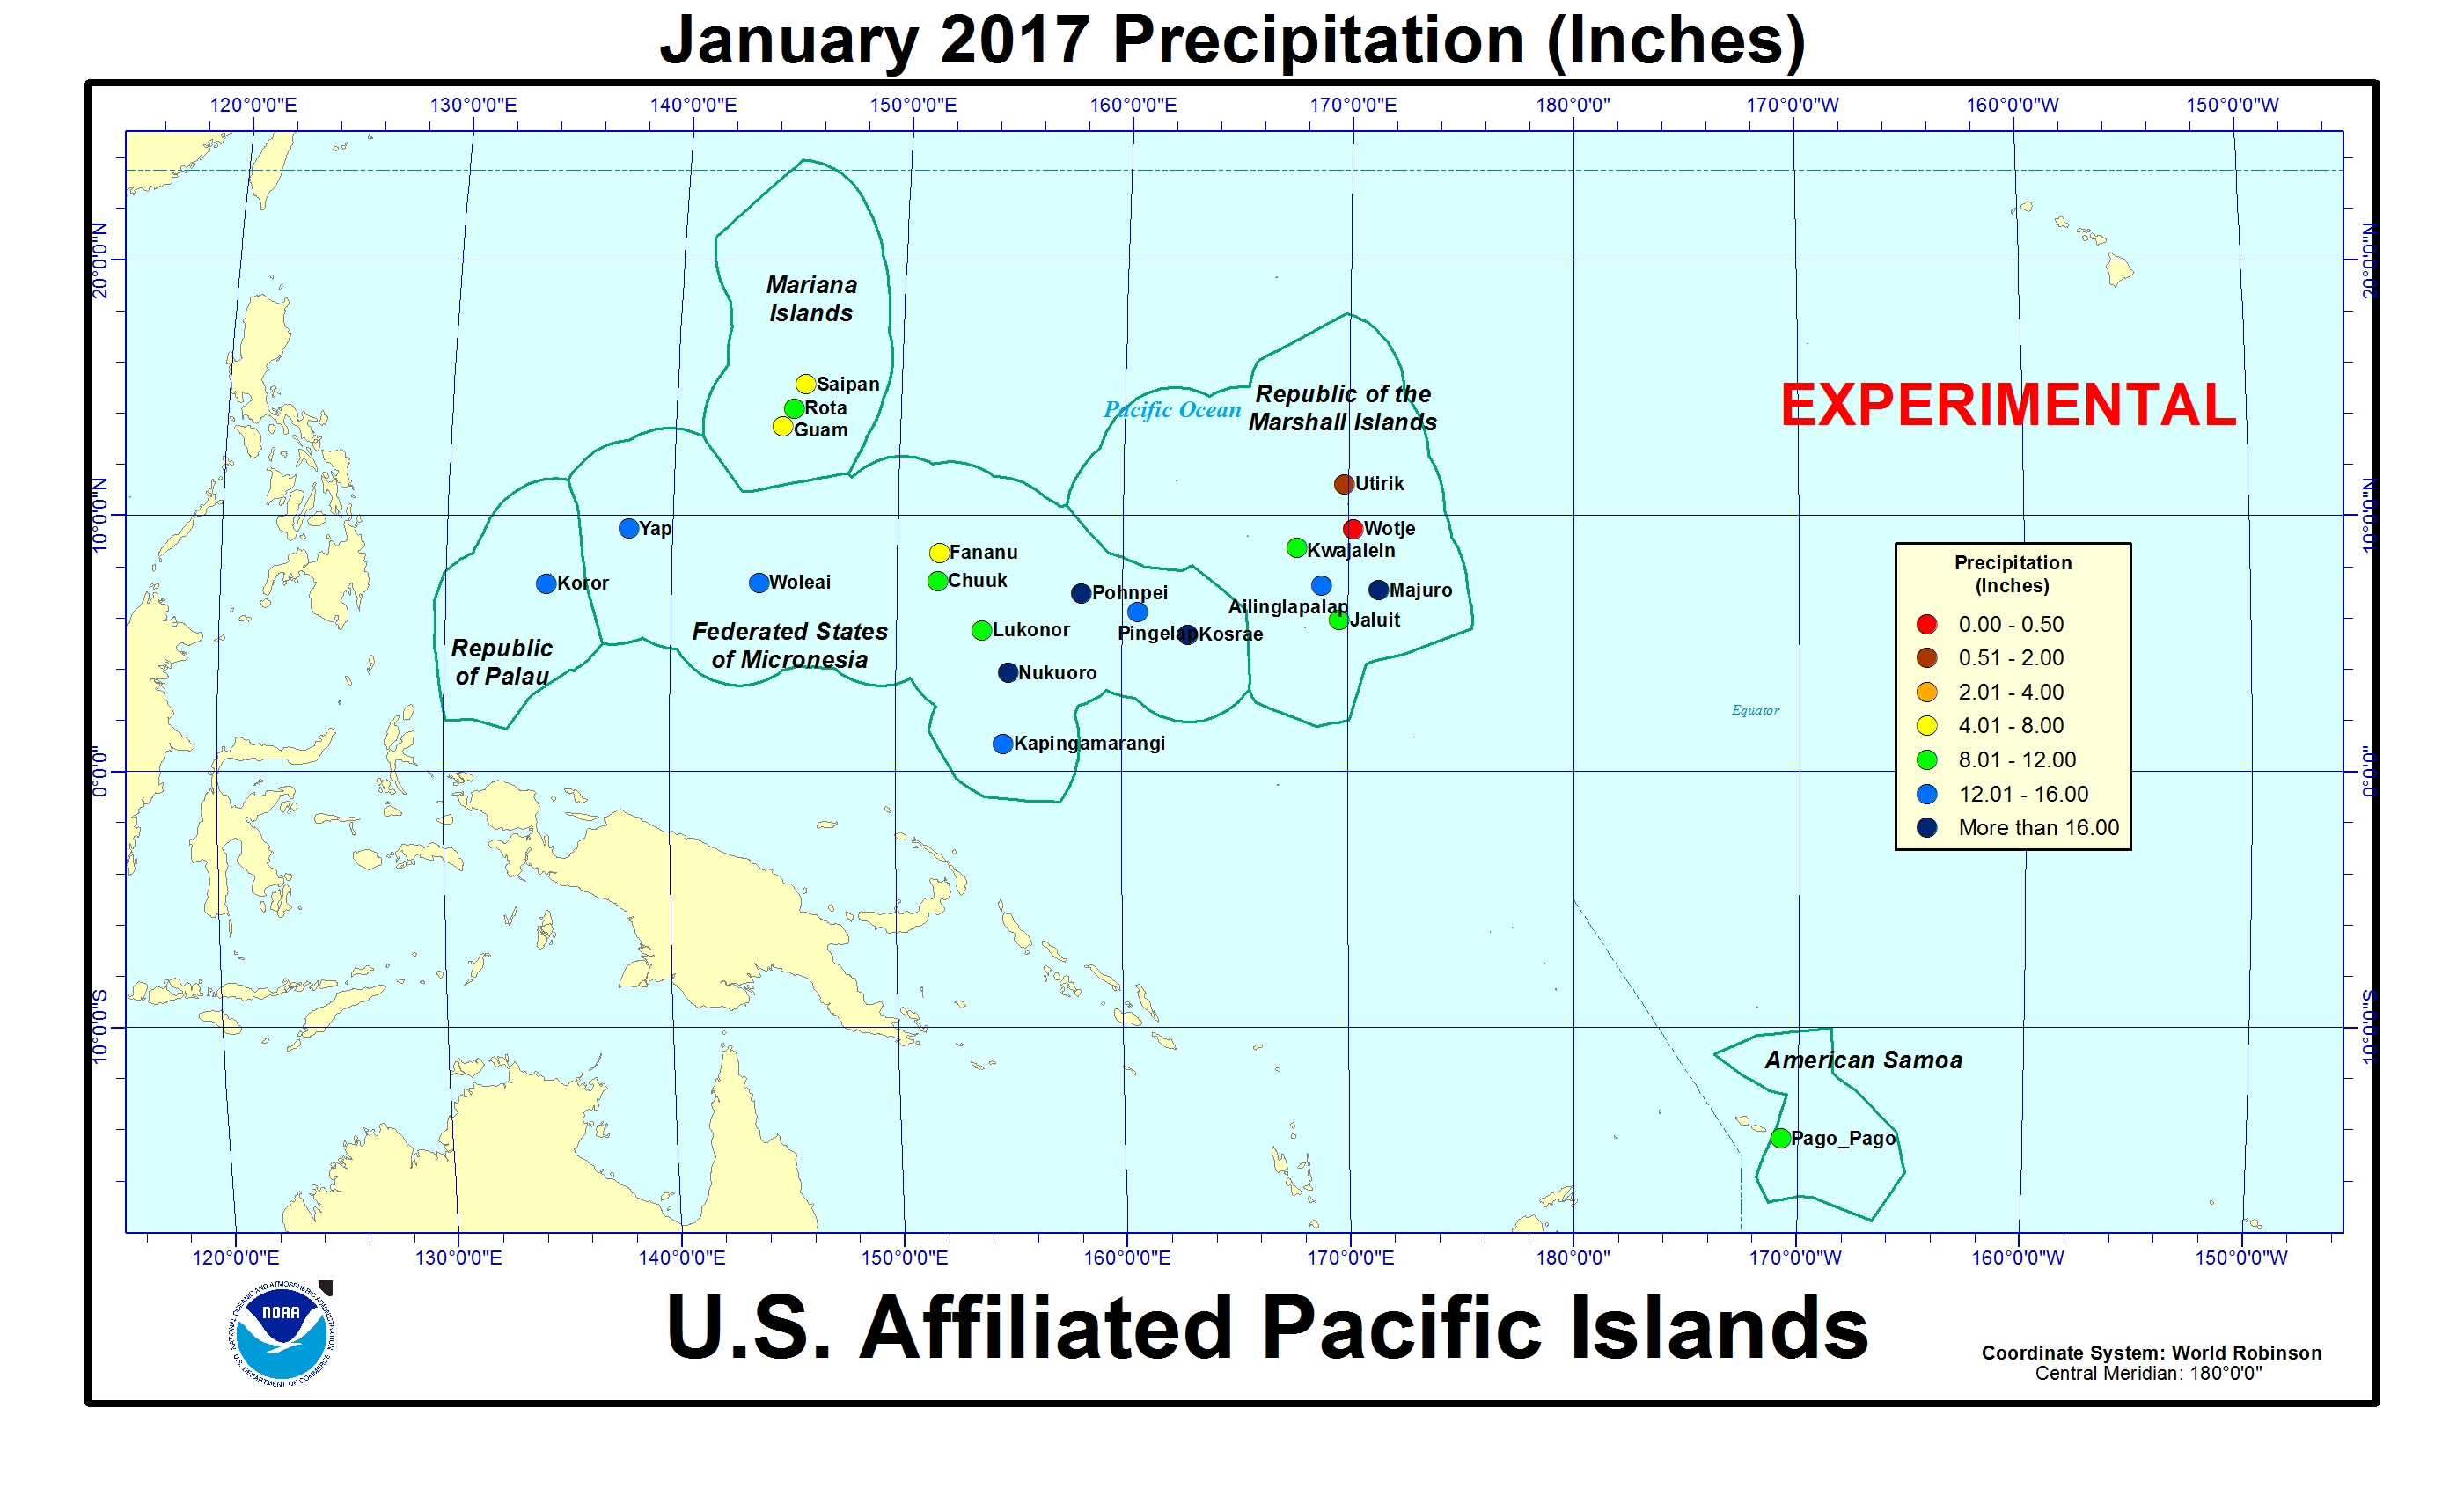
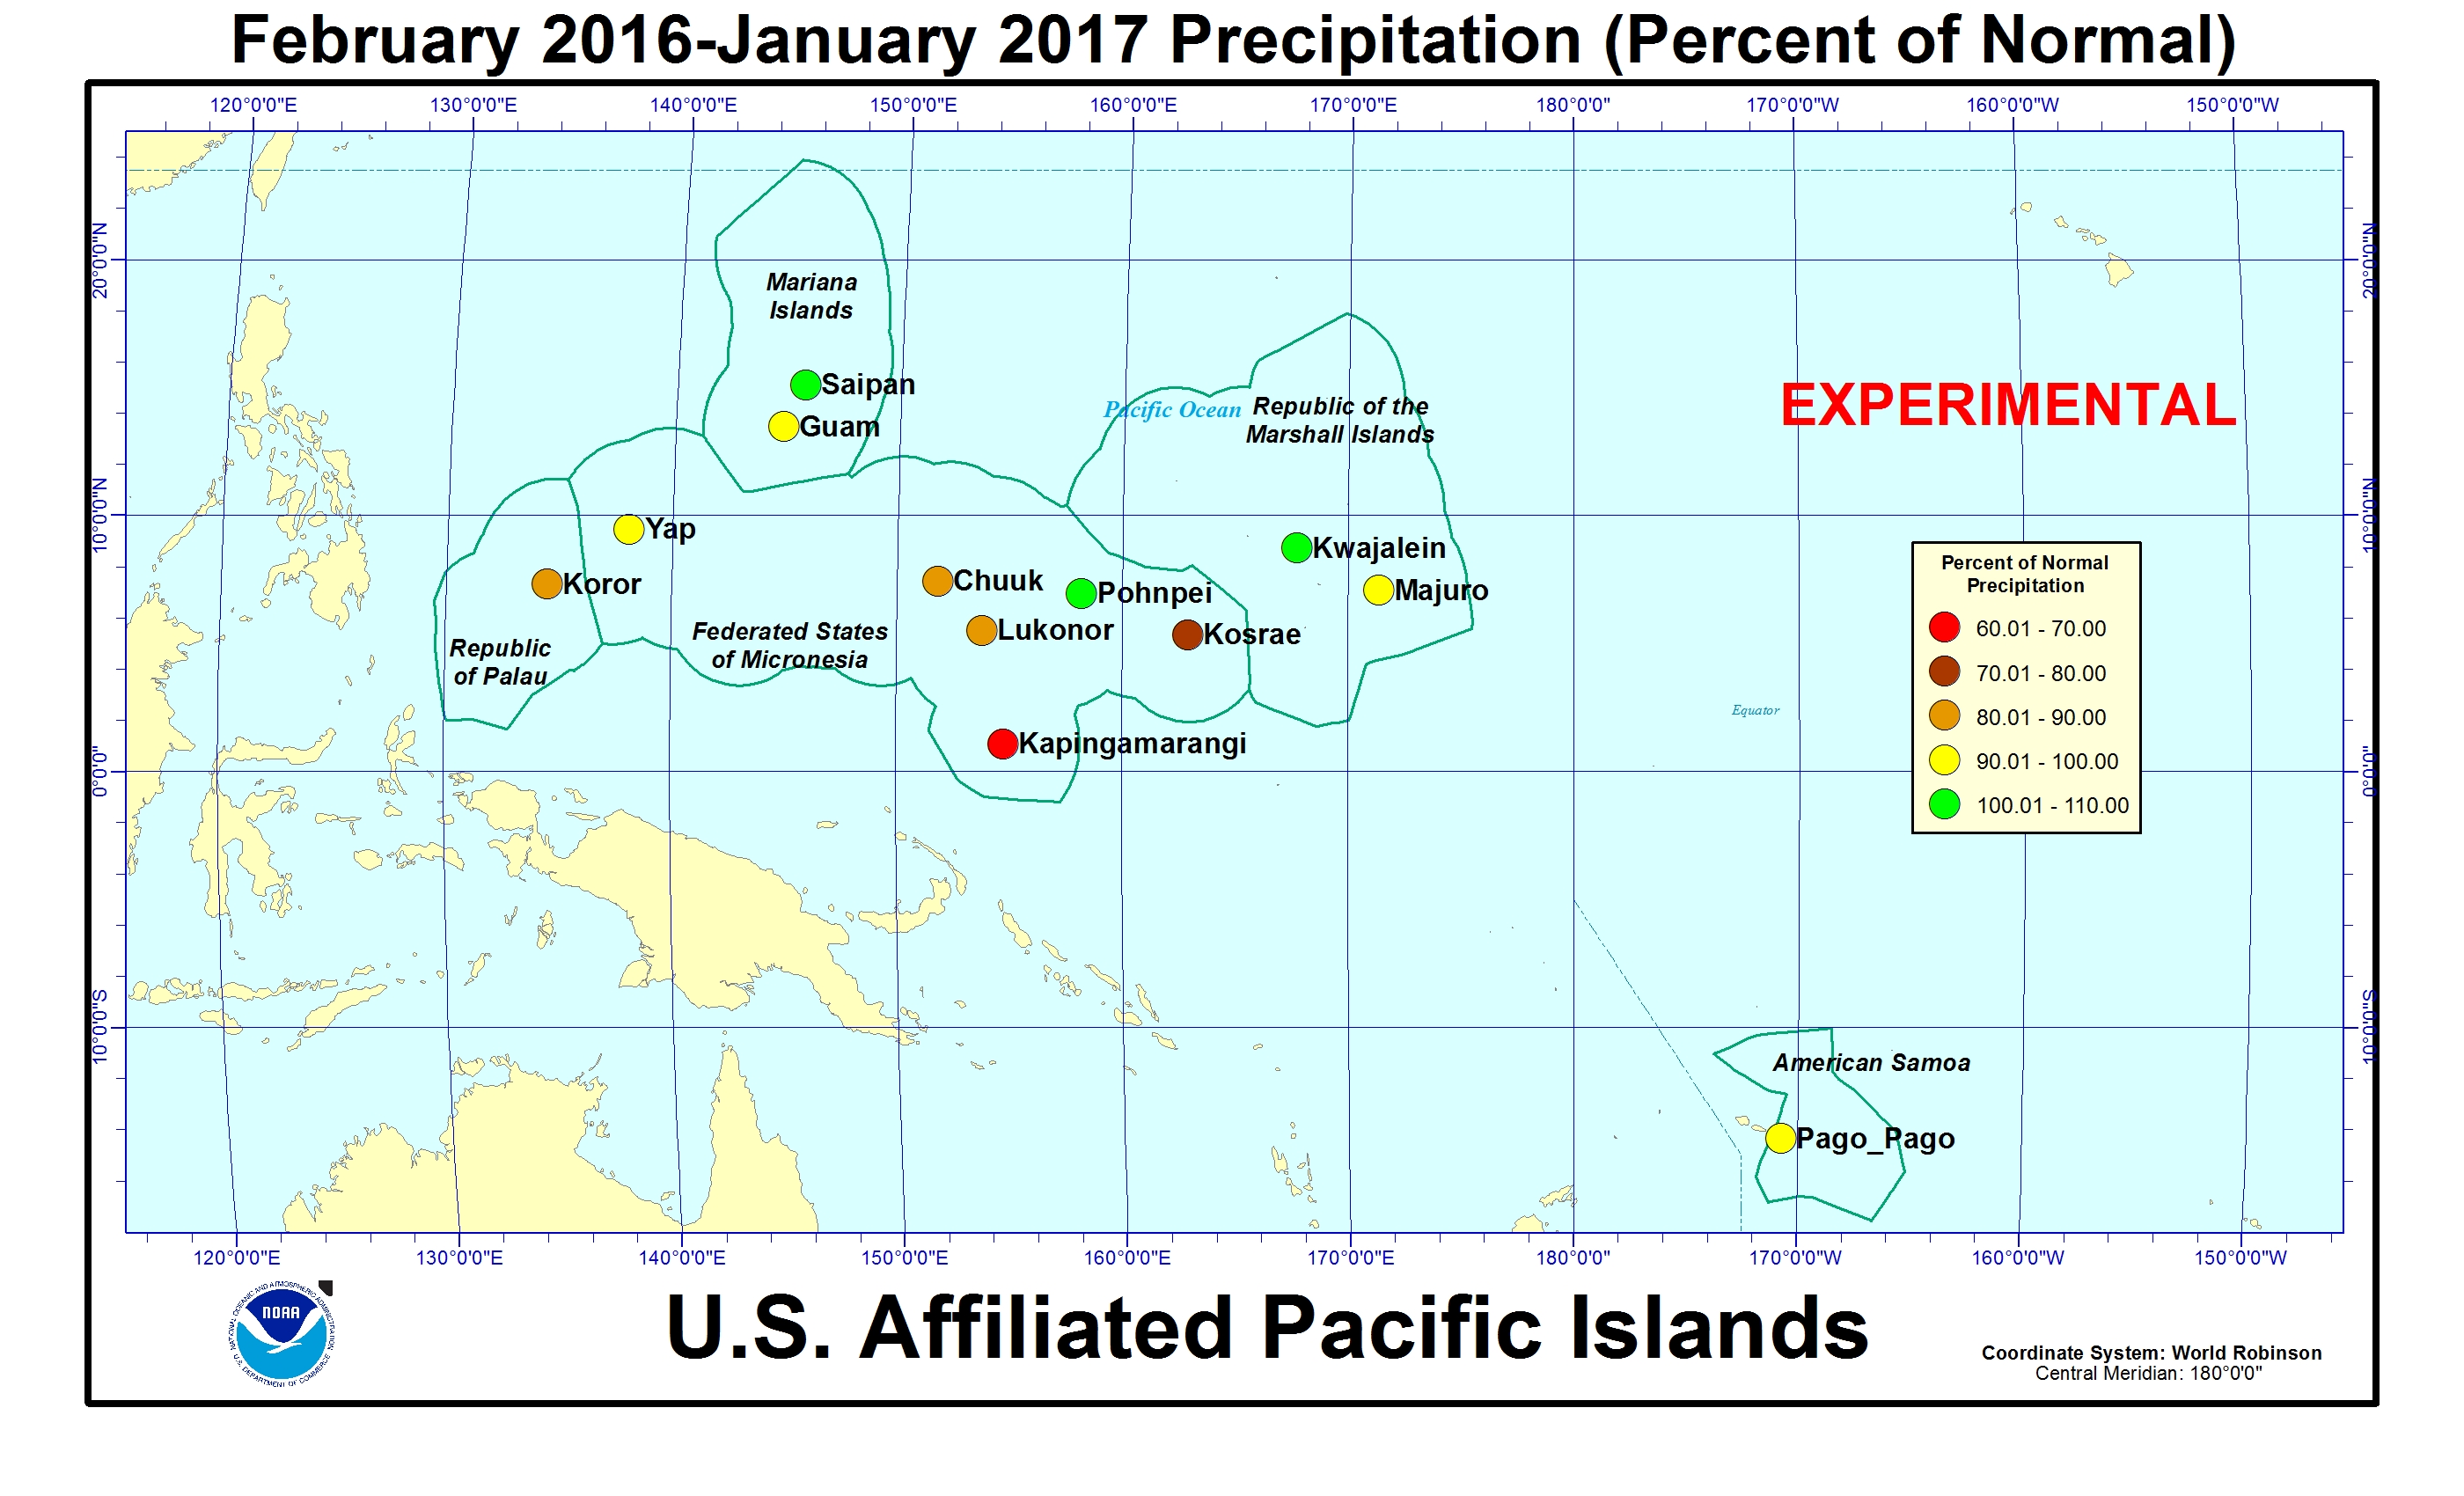
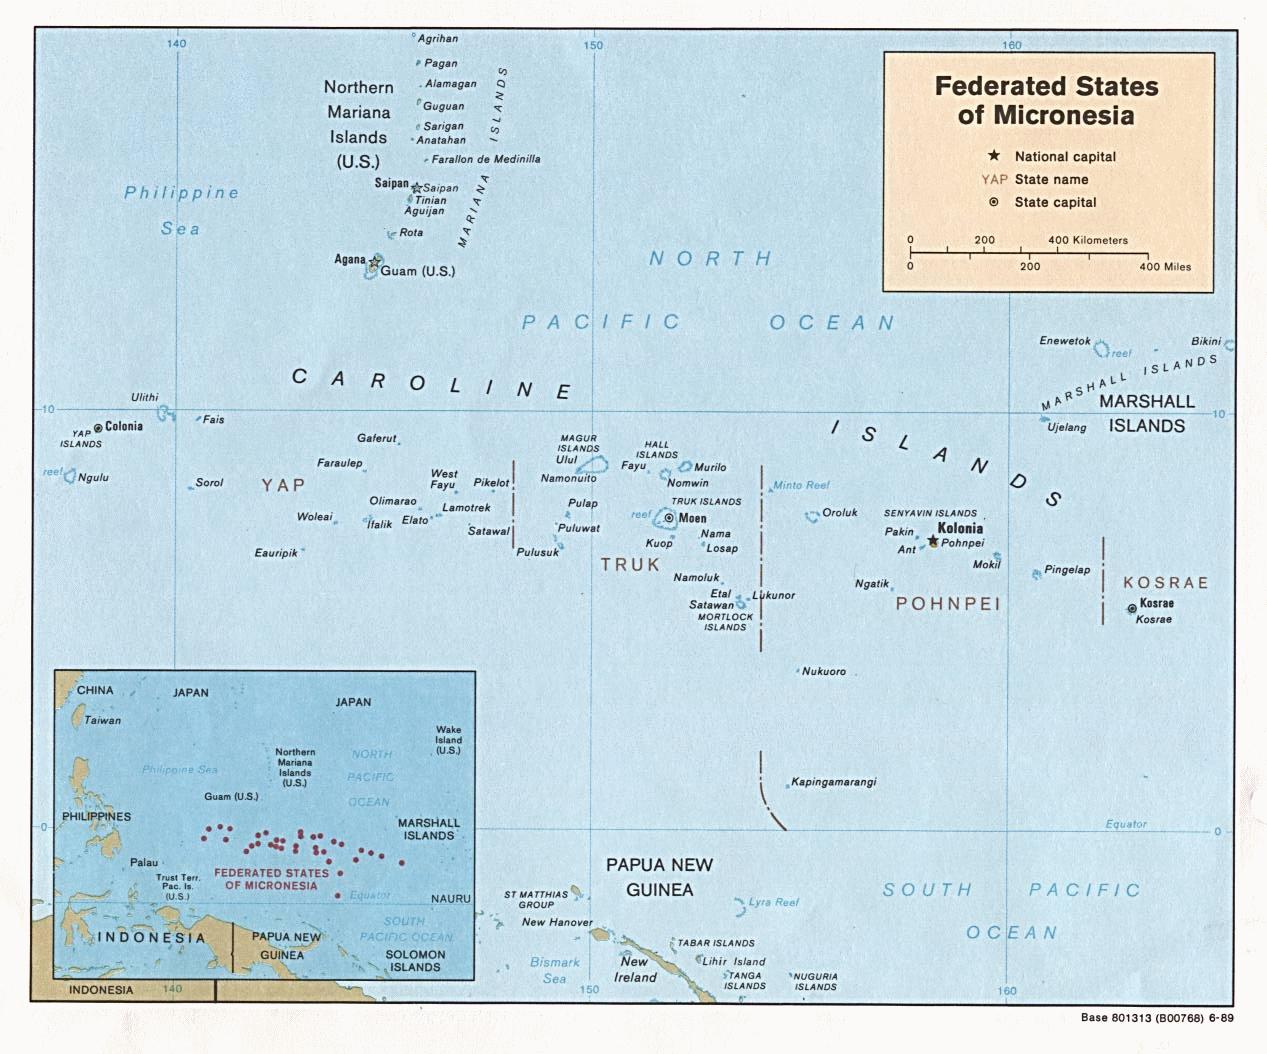
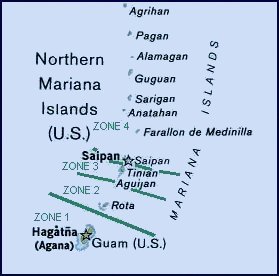
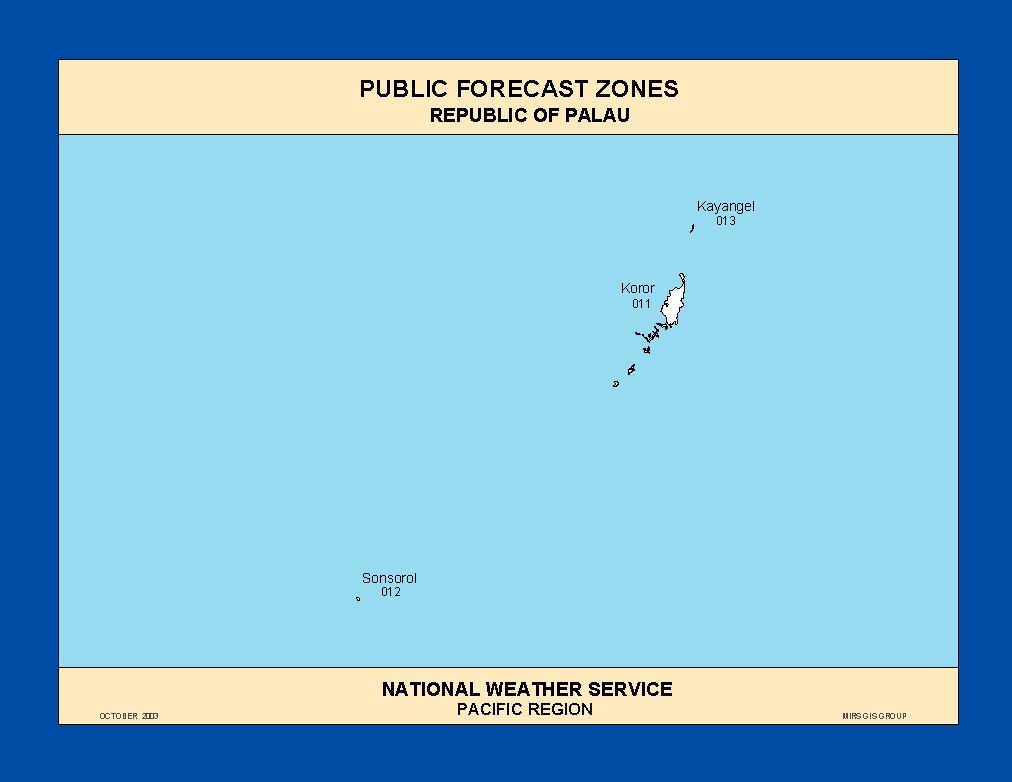
In the U.S. Affiliated Pacific Islands (USAPI) (maps — Federated States of Micronesia, Northern Mariana Islands, Marshall Islands, Republic of Palau, American Samoa, basinwide), January 2017 was drier than normal at Pago Pago, and wetter than normal at the other stations.
Rainfall amounts were below the minimum thresholds (4 or 8 inches) required to meet most monthly water needs at Fananu (in the Federated States of Micronesia [FSM]) and Utirik and Wotje (in the Marshall Islands). January rainfall was above the monthly minimum thresholds at the rest of the regular reporting stations in Micronesia. The 4- and 8-inch thresholds are important because, if monthly precipitation falls below the threshold, then water shortages or drought become a concern.
Virtually no rain has fallen in the northern Marshall Islands. The monthly precipitation at Utirik was 0.63 inch and at Wotje 0.08 inch, which are both significantly dry and well below normal. The National Weather Service office on Guam issued a revised Drought Information Statement on February 9 which noted that drought is a serious concern for the northern Marshall Islands. Reports have been received of depleted household rainfall catchment tanks on the islands of Mejit, Ailuk, and Wotje.
As measured by percent of normal precipitation, Pago Pago has been drier than normal in the short term (January and the last 3 months [November 2016-January 2017]) as well as the long term (last 12 months [February 2016-January 2017]). Kwajalein and Pohnpei were near to wetter than normal in the short term and long term. Kosrae was near normal for January but drier than normal at the other two time scales. Chuuk, Guam, Kapingamarangi, Koror, Lukonor, Majuro, Saipan, and Yap were near to wetter than normal in the short term and drier than normal in the long term.
| Station Name | Feb 2016 | Mar 2016 | Apr 2016 | May 2016 | Jun 2016 | Jul 2016 | Aug 2016 | Sep 2016 | Oct 2016 | Nov 2016 | Dec 2016 | Jan 2017 | Feb- Jan |
|---|---|---|---|---|---|---|---|---|---|---|---|---|---|
| Chuuk | 29% | 85% | 86% | 107% | 91% | 94% | 74% | 86% | 58% | 98% | 176% | 113% | 89% |
| Guam NAS | 120% | 79% | 52% | 53% | 125% | 67% | 141% | 124% | 115% | 137% | 170% | 155% | 98% |
| Kapingamarangi | 65% | 88% | 94% | 34% | 24% | 66% | 91% | 77% | 26% | 71% | 114% | 159% | 65% |
| Koror | 30% | 36% | 135% | 115% | 93% | 45% | 61% | 115% | 153% | 144% | 64% | 131% | 85% |
| Kosrae | 113% | 32% | 23% | 72% | 130% | 88% | 88% | 89% | 90% | 56% | 168% | 103% | 73% |
| Kwajalein | 17% | 45% | 21% | 57% | 142% | 101% | 83% | 64% | 168% | 126% | 156% | 285% | 103% |
| Lukonor | 61% | 51% | 113% | 102% | 73% | 43% | 73% | 120% | 74% | 198% | 128% | 138% | 83% |
| Majuro | 46% | 20% | 22% | 110% | 66% | 90% | 75% | 123% | 120% | 129% | 103% | 228% | 95% |
| Pago Pago | 54% | 101% | 329% | 102% | 73% | 81% | 83% | 83% | 55% | 127% | 111% | 72% | 94% |
| Pohnpei | 49% | 44% | 60% | 80% | 143% | 79% | 112% | 144% | 120% | 115% | 142% | 182% | 103% |
| Saipan | 105% | 106% | 68% | 87% | 57% | 42% | 186% | 191% | 48% | 79% | 95% | 182% | 108% |
| Yap | 34% | 15% | 62% | 113% | 54% | 67% | 88% | 66% | 164% | 156% | 101% | 198% | 90% |
| Station Name | Feb 2016 | Mar 2016 | Apr 2016 | May 2016 | Jun 2016 | Jul 2016 | Aug 2016 | Sep 2016 | Oct 2016 | Nov 2016 | Dec 2016 | Jan 2017 | Feb- Jan |
|---|---|---|---|---|---|---|---|---|---|---|---|---|---|
| Chuuk | 2.09" | 7.08" | 10.73" | 12.11" | 10.61" | 11.27" | 9.50" | 10.04" | 6.73" | 10.39" | 19.83" | 11.37" | 121.75" |
| Guam NAS | 3.63" | 1.63" | 1.31" | 1.80" | 7.73" | 6.77" | 20.85" | 15.65" | 13.14" | 10.13" | 8.68" | 6.22" | 97.54" |
| Kapingamarangi | 6.04" | 10.02" | 12.78" | 4.07" | 3.30" | 9.33" | 7.38" | 7.61" | 2.14" | 6.58" | 11.22" | 14.54" | 95.01" |
| Koror | 2.53" | 2.68" | 9.90" | 13.55" | 16.25" | 8.28" | 8.20" | 13.51" | 18.06" | 16.38" | 7.13" | 13.30" | 129.77" |
| Kosrae | 14.56" | 5.15" | 3.99" | 12.70" | 18.99" | 13.07" | 12.48" | 12.71" | 9.87" | 7.76" | 26.99" | 17.21" | 155.48" |
| Kwajalein | 0.46" | 1.05" | 1.13" | 3.80" | 9.81" | 9.96" | 8.12" | 6.90" | 18.73" | 14.16" | 10.36" | 9.00" | 93.48" |
| Lukonor | 5.44" | 4.75" | 12.83" | 11.92" | 8.49" | 6.84" | 10.31" | 12.23" | 8.41" | 18.02" | 14.42" | 11.58" | 125.24" |
| Majuro | 3.17" | 1.33" | 2.05" | 11.12" | 7.27" | 10.09" | 8.78" | 13.73" | 15.28" | 17.36" | 11.77" | 17.65" | 119.6" |
| Pago Pago | 6.49" | 10.76" | 30.87" | 9.89" | 3.88" | 4.48" | 4.49" | 5.45" | 5.12" | 12.86" | 14.24" | 9.57" | 118.1" |
| Pohnpei | 4.64" | 5.76" | 11.01" | 16.06" | 21.18" | 12.12" | 15.91" | 18.13" | 18.39" | 17.00" | 22.83" | 24.00" | 187.03" |
| Saipan | 2.72" | 2.00" | 1.78" | 2.07" | 2.05" | 3.76" | 24.40" | 19.31" | 5.07" | 4.42" | 3.67" | 4.61" | 75.86" |
| Yap | 1.77" | 0.70" | 3.47" | 8.90" | 6.46" | 10.03" | 13.10" | 8.89" | 20.00" | 13.78" | 8.59" | 12.67" | 108.36" |
| Station Name | Feb 2016 | Mar 2016 | Apr 2016 | May 2016 | Jun 2016 | Jul 2016 | Aug 2016 | Sep 2016 | Oct 2016 | Nov 2016 | Dec 2016 | Jan 2017 | Feb- Jan |
|---|---|---|---|---|---|---|---|---|---|---|---|---|---|
| Chuuk | 7.25" | 8.32" | 12.47" | 11.30" | 11.66" | 11.98" | 12.86" | 11.71" | 11.51" | 10.61" | 11.25" | 10.10" | 136.77" |
| Guam NAS | 3.03" | 2.07" | 2.53" | 3.40" | 6.18" | 10.14" | 14.74" | 12.66" | 11.44" | 7.38" | 5.11" | 4.01" | 99.09" |
| Kapingamarangi | 9.27" | 11.43" | 13.64" | 12.08" | 13.78" | 14.15" | 8.13" | 9.93" | 8.19" | 9.27" | 9.84" | 9.15" | 145.85" |
| Koror | 8.56" | 7.44" | 7.32" | 11.83" | 17.48" | 18.53" | 13.50" | 11.77" | 11.84" | 11.39" | 11.16" | 10.18" | 152.90" |
| Kosrae | 12.93" | 16.06" | 17.51" | 17.75" | 14.64" | 14.91" | 14.22" | 14.22" | 10.94" | 13.83" | 16.11" | 16.67" | 213.87" |
| Kwajalein | 2.64" | 2.35" | 5.26" | 6.72" | 6.93" | 9.87" | 9.74" | 10.74" | 11.18" | 11.28" | 6.66" | 3.16" | 90.41" |
| Lukonor | 8.93" | 9.26" | 11.31" | 11.69" | 11.65" | 15.93" | 14.04" | 10.15" | 11.32" | 9.08" | 11.27" | 8.41" | 151.36" |
| Majuro | 6.88" | 6.58" | 9.42" | 10.11" | 11.01" | 11.17" | 11.69" | 11.17" | 12.73" | 13.44" | 11.39" | 7.74" | 125.25" |
| Pago Pago | 12.00" | 10.68" | 9.39" | 9.66" | 5.33" | 5.55" | 5.38" | 6.53" | 9.26" | 10.14" | 12.84" | 13.34" | 125.57" |
| Pohnpei | 9.55" | 13.17" | 18.41" | 19.96" | 14.81" | 15.43" | 14.26" | 12.55" | 15.27" | 14.83" | 16.08" | 13.18" | 182.36" |
| Saipan | 2.59" | 1.89" | 2.63" | 2.38" | 3.62" | 8.91" | 13.13" | 10.09" | 10.62" | 5.61" | 3.85" | 2.53" | 70.25" |
| Yap | 5.19" | 4.56" | 5.63" | 7.85" | 12.04" | 15.08" | 14.82" | 13.50" | 12.18" | 8.83" | 8.51" | 6.39" | 120.31" |
An analysis of historical data for the USAPI stations in the Global Historical Climatology Network-Daily (GHCN-D) dataset, augmented with fill-in data from the 1981-2010 Normals, indicated that long-term dryness persisted at some stations. The following table lists the precipitation ranks for January 2017, August 2016-January 2017 (last 6 months), and February 2016-January 2017 (the last 12 months). Some stations have a long period of record and their dataset is fairly complete, while other stations have a shorter period of record and the dataset has some missing data. Stations with low ranks for the last 12 months (February 2016-January 2017) include: Kapingamarangi with the 2nd driest February-January out of 12 years of data, Kosrae 5th driest out of 27 years, Lukonor 7th driest (out of 20 years), Nukuoro 9th driest (32 years), Woleai 7th driest (21), Chuuk 10th driest (65), and Jaluit 5th driest (32).
Rank of 1 = driest.
| Station | Jan 2017 Rank |
Jan No. of Years |
Aug 2016- Jan 2017 Rank |
Aug- Jan No. of Years |
Feb 2016- Jan 2017 Rank |
Feb- Jan No. of Years |
Period of Record |
| Jaluit | 22 | 34 | 22 | 32 | 5 | 32 | 1981-2017 |
| Koror | 49 | 66 | 37 | 66 | 18 | 65 | 1951-2017 |
| Woleai | 33 | 35 | 20 | 27 | 7 | 21 | 1968-2017 |
| Yap | 57 | 66 | 53 | 66 | 16 | 65 | 1951-2017 |
| Majuro | 61 | 63 | 55 | 63 | 19 | 62 | 1954-2017 |
| Ailinglapalap | 32 | 34 | 30 | 31 | 16 | 31 | 1981-2017 |
| Kosrae | 26 | 47 | 11 | 32 | 5 | 27 | 1954-2017 |
| Lukonor | 22 | 33 | 16 | 20 | 7 | 20 | 1981-2017 |
| Saipan | 25 | 37 | 27 | 29 | 21 | 28 | 1981-2017 |
| Pohnpei | 65 | 66 | 62 | 66 | 33 | 65 | 1951-2017 |
| Kwajalein | 59 | 65 | 59 | 65 | 25 | 64 | 1952-2017 |
| Kapingamarangi | 20 | 27 | 5 | 15 | 2 | 12 | 1962-2017 |
| Chuuk | 46 | 66 | 21 | 65 | 10 | 65 | 1951-2017 |
| Guam | 41 | 60 | 49 | 60 | 28 | 59 | 1957-2017 |
| Nukuoro | 26 | 35 | 14 | 33 | 9 | 32 | 1981-2017 |
| Pago Pago | 16 | 51 | 13 | 51 | 21 | 50 | 1966-2017 |
| Wotje | 2 | 34 | 13 | 31 | 24 | 31 | 1981-2017 |
| Utirik | 4 | 19 | 7 | 7 | 2 | 3 | 1985-2017 |


[top]
State/Regional/National Moisture Status
A detailed review of drought and moisture conditions is available for all contiguous U.S. states, the nine standard regions, and the nation (contiguous U.S.):
| northeast u. s. | east north central u. s. | central u. s. |
| southeast u. s. | west north central u. s. | south u. s. |
| southwest u. s. | northwest u. s. | west u. s. |
| Contiguous United States |
[top]
Contacts & Questions