|
Contents Of This Report: |
|
Please note that the values presented in this report are based on preliminary data. They will change when the final data are processed, but will not be replaced on these pages.
National Drought Overview
|
|
[top]
Detailed Drought Discussion
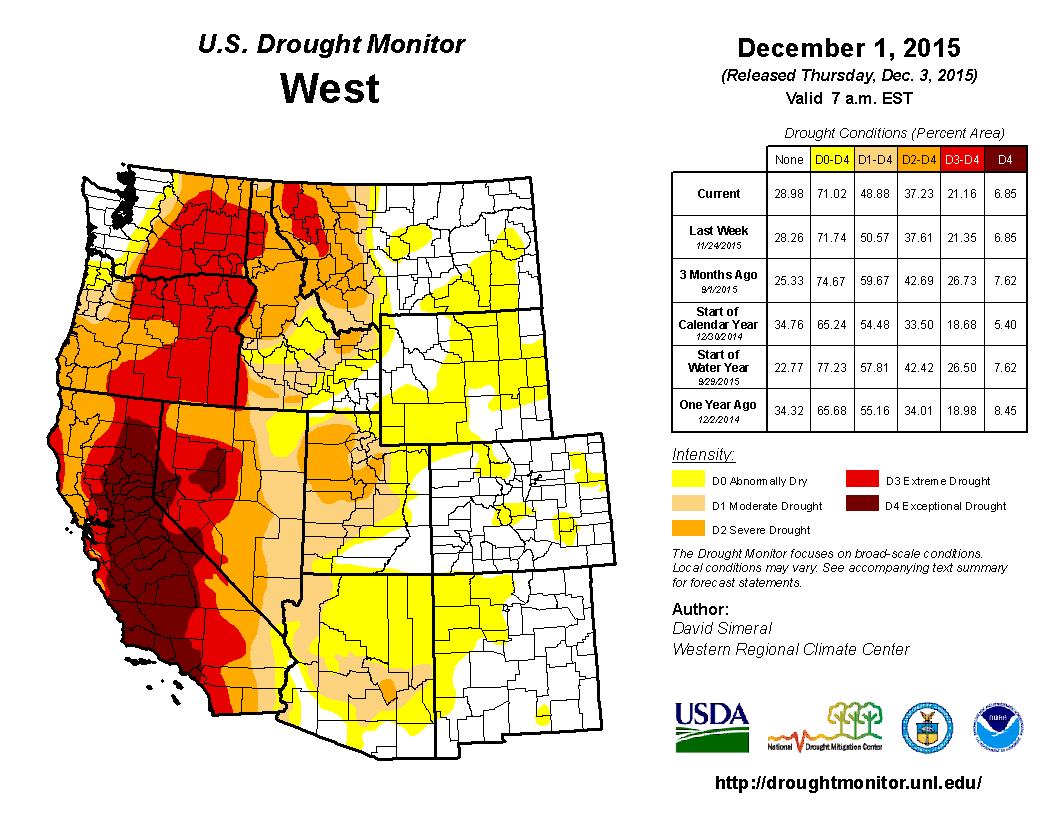
Overview

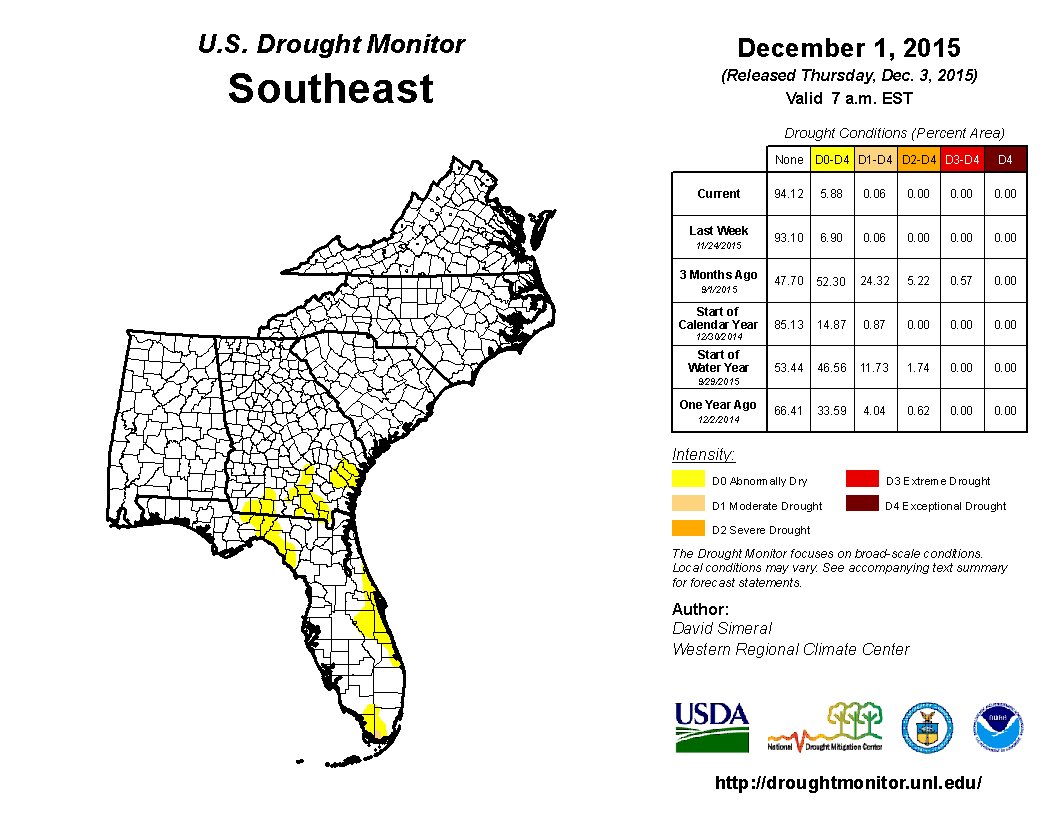
The U.S. Drought Monitor drought map valid December 1, 2015.
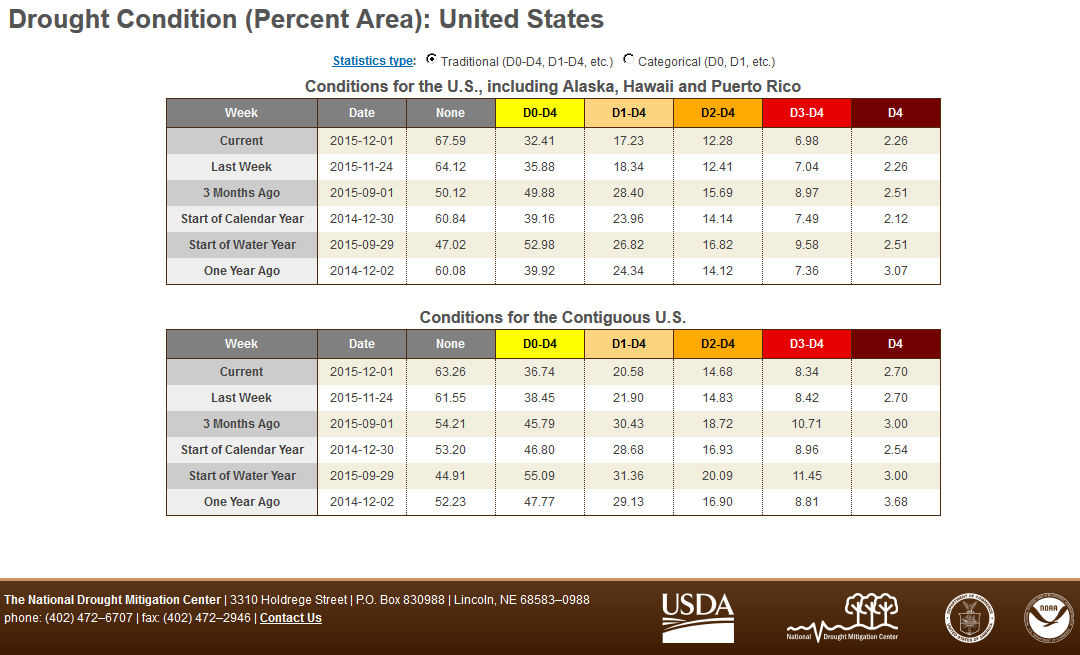
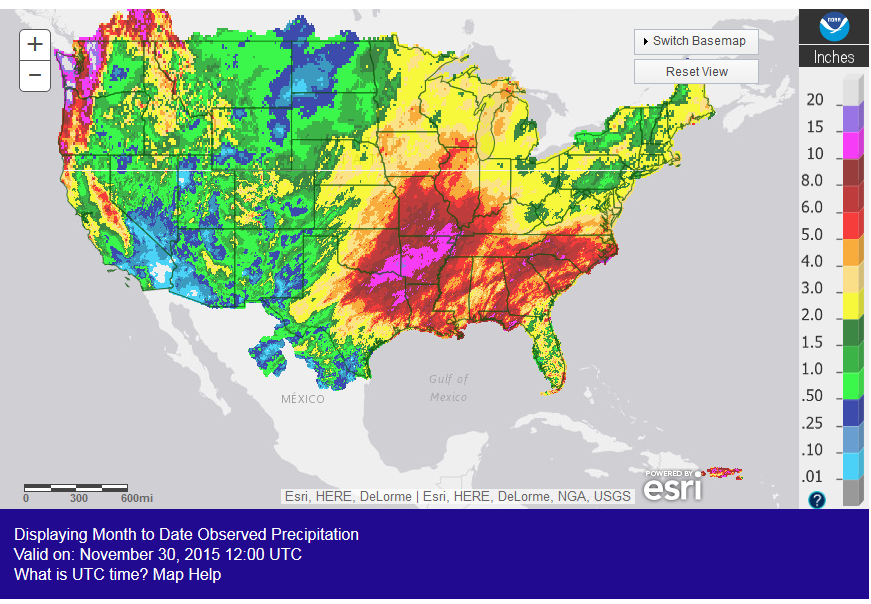
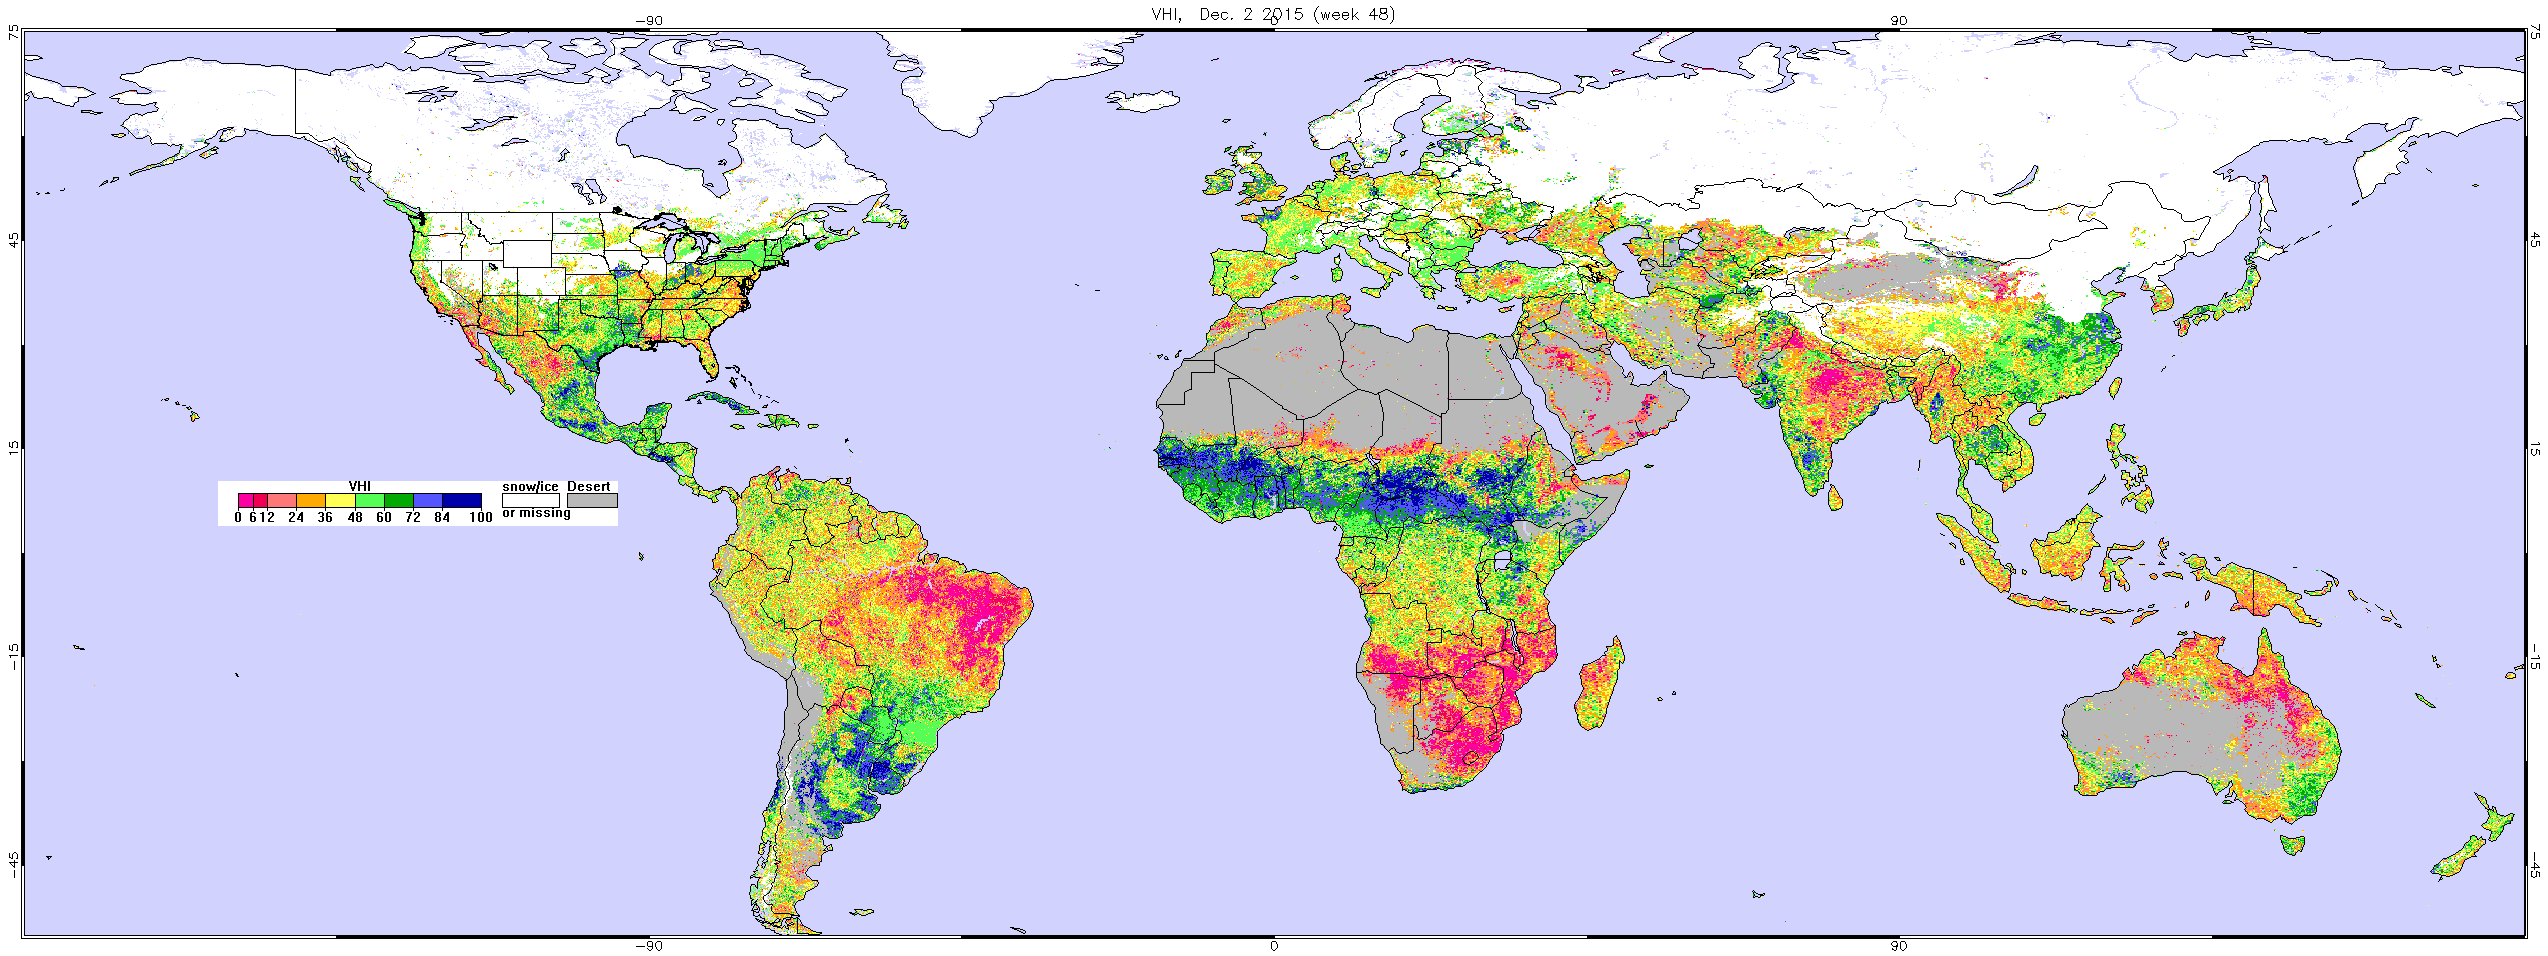
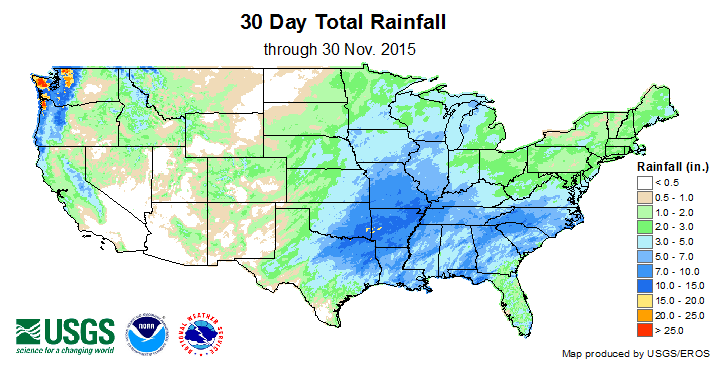
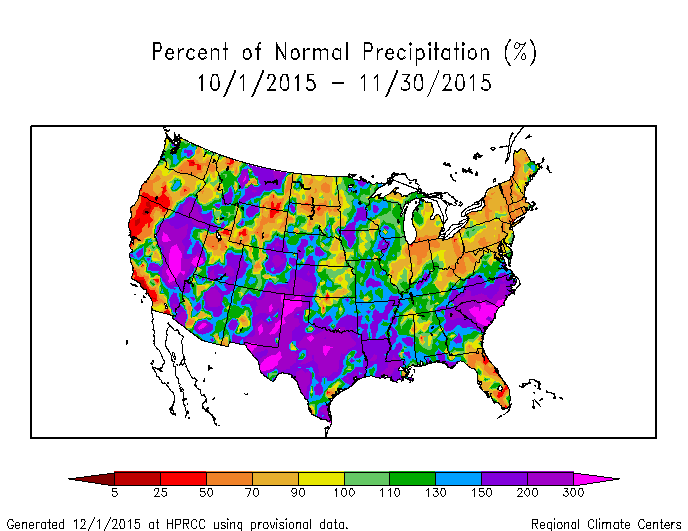
The weather and climate of November 2015 were influenced by a strong El Niño and a vigorous upper-level circulation, which directed numerous weather systems across the CONUS, some of which were enhanced by tropical moisture. A steady stream of Pacific weather systems brought drought-ending rain to coastal Washington. A series of deep troughs and cutoff lows moved in the jet stream flow across the southern half of the country. Pacific moisture with these systems brought above-normal precipitation to parts of the West. These systems then tapped Gulf of Mexico moisture and, in some cases, tropical Pacific moisture from the remnants of Hurricane Sandra to produce heavy precipitation across the Great Plains to Midwest and Southeast. Drier-than-normal weather dominated the Northeast to parts of the Ohio Valley, and parts of the Northern Plains and West. Pacific systems brought above-normal precipitation to much of Alaska and Hawaii, while Puerto Rico had a mixed precipitation anomaly pattern. When integrated across the CONUS, November 2015 ranked as the fourth wettest November in the 1895-2015 record, with the national drought footprint shrinking to 17.2 percent of the U.S. (20.6 percent of the CONUS). According to the Palmer Drought Index, which goes back to the beginning of the 20th century, about 13.3 percent of the CONUS was in moderate to extreme drought at the end of November, a decrease of about 3.7 percent compared to last month.

Percent area of the CONUS in moderate to exceptional drought, January 4, 2000 to present, based on the U.S. Drought Monitor.
Palmer Drought Index
The Palmer drought indices measure the balance between moisture demand (evapotranspiration driven by temperature) and moisture supply (precipitation). The Palmer Z Index depicts moisture conditions for the current month, while the Palmer Hydrological Drought Index (PHDI) and Palmer Drought Severity Index (PDSI) depict the current month's cumulative moisture conditions integrated over the last several months. While both the PDSI and PHDI indices show long-term moisture conditions, the PDSI depicts meteorological drought while the PHDI depicts hydrological drought. The PDSI map shows less severe and extensive drought in parts of the West than the PHDI map because the meteorological conditions that produce drought and wet spell conditions are not as long-lasting as the hydrological impacts.
|
 |
Used together, the Palmer Z Index and PHDI maps show that short-term dry conditions occurred over the Northeast, resulting in intensifying long-term dry conditions over southern New England in November compared to October. Short-term wet conditions resulted in the elimination of the remaining patchy long-term drought in parts of the Southeast. Short-term wet conditions in the Southern and Central Plains to Midwest intensified the long-term wet conditions. Near normal to wet short-term conditions across parts of the West reduced long-term drought conditions compared to last month.
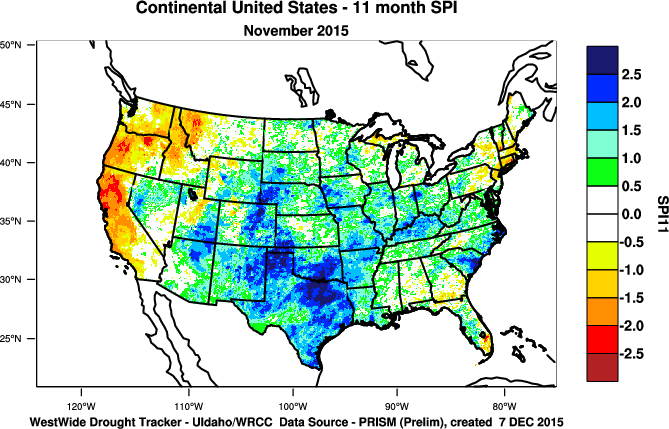
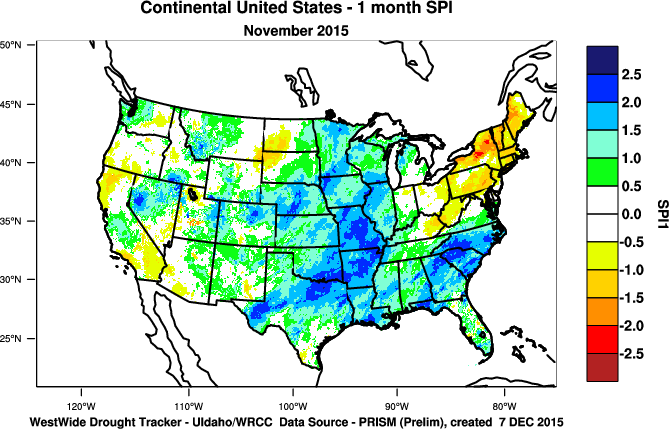
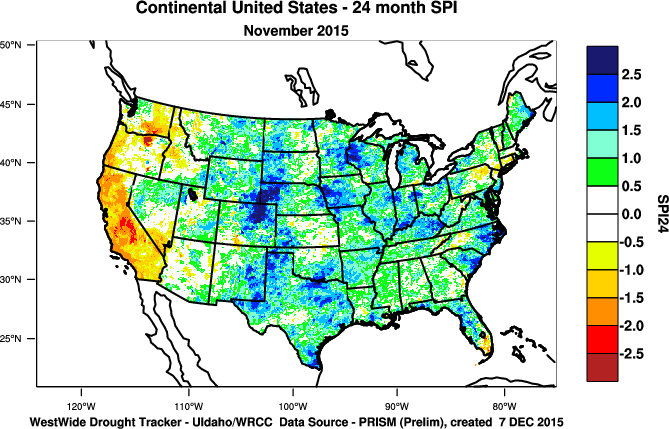
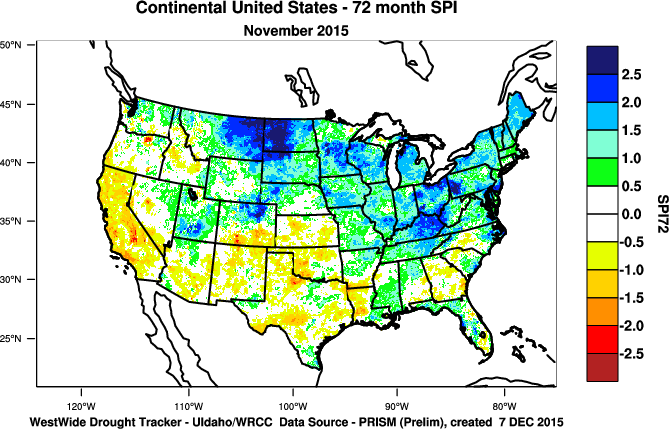
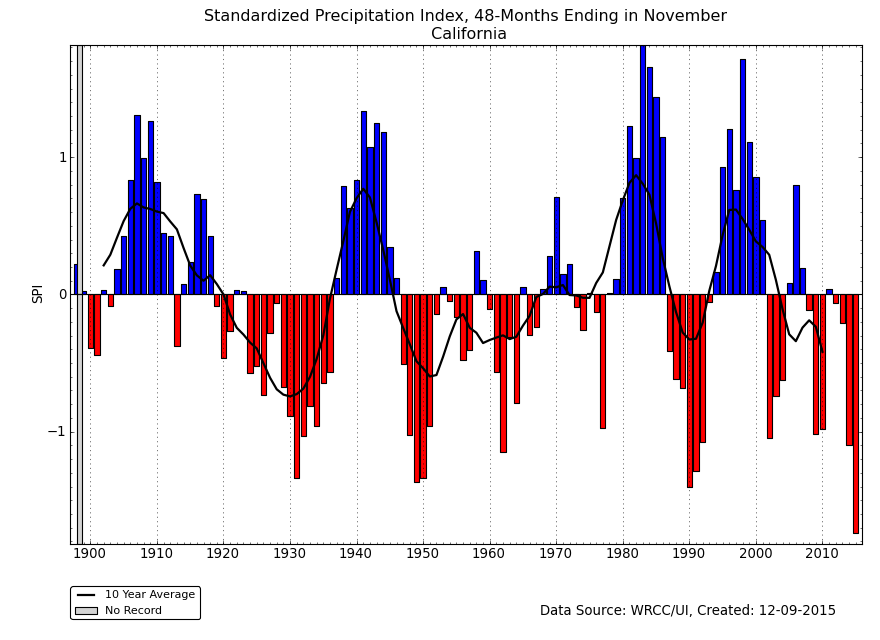
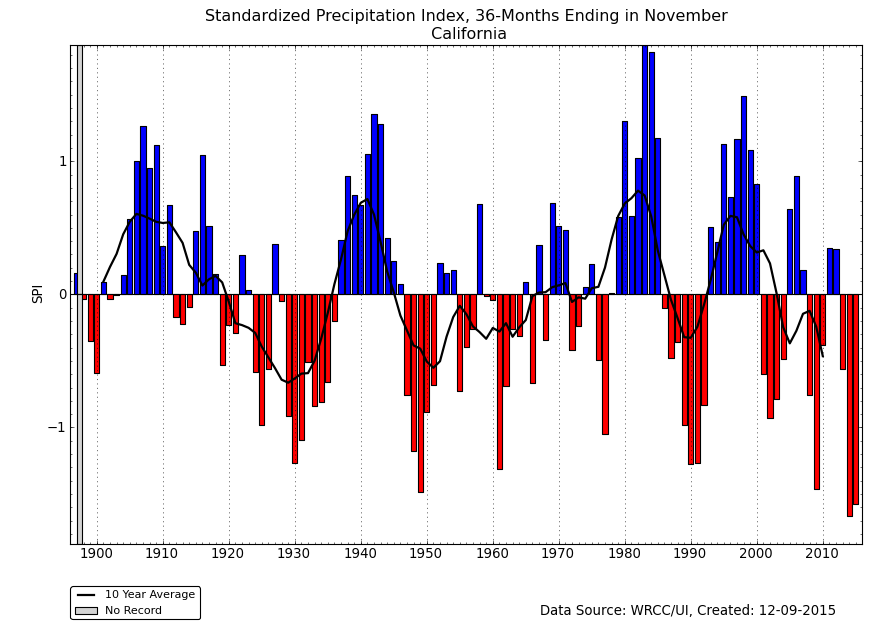
Standardized Precipitation Index
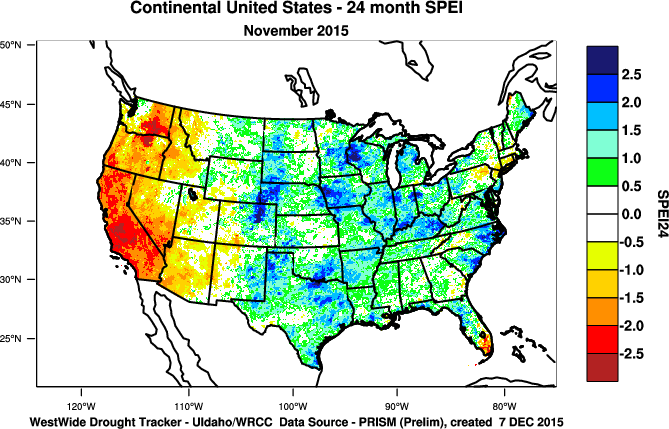
The Standardized Precipitation Index (SPI) measures moisture supply. The SPI maps here show the spatial extent of anomalously wet and dry areas at time scales ranging from 1 month to 24 months.
 |
 |
 |

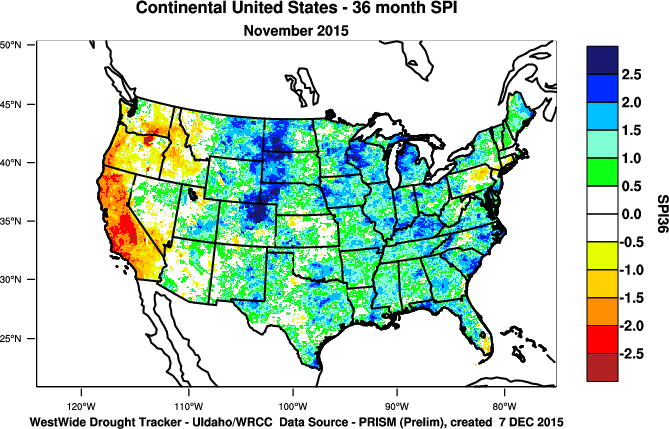
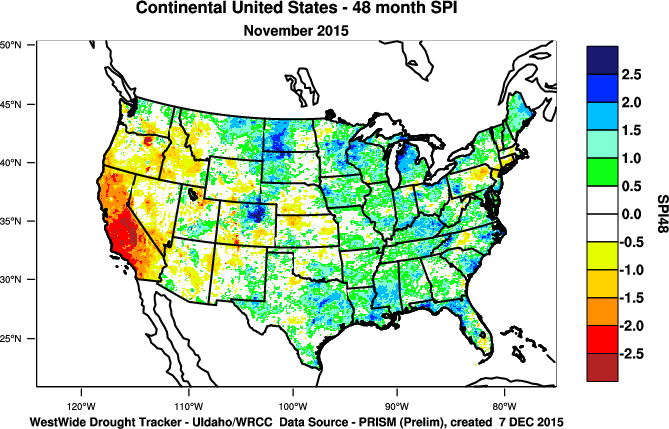
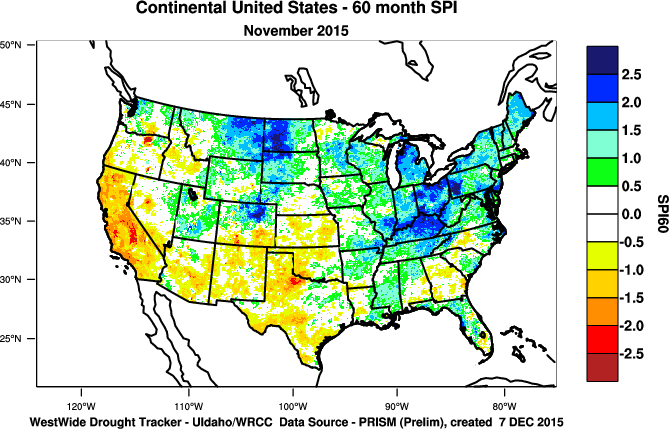
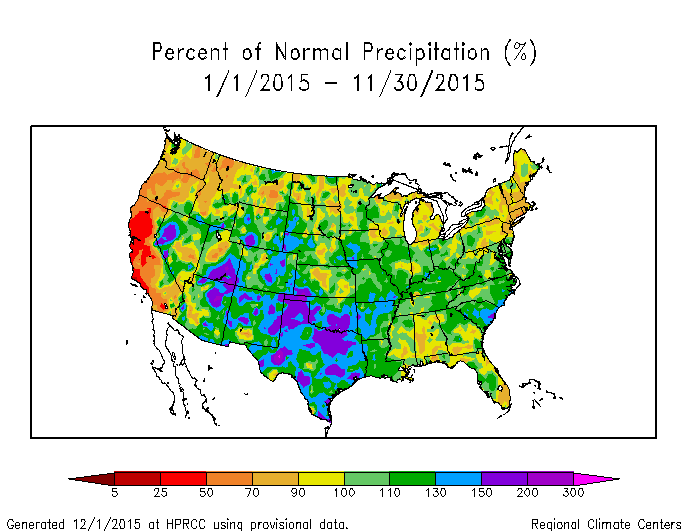
The SPI maps illustrate how moisture conditions have varied considerably through time and space over the last two years. Dryness in the Northeast and into the Ohio Valley is evident on the 1- to 2-month SPI maps, but near-normal to wet conditions dominate at the longer time scales, except in southern New England where dryness is evident at all time scales. Dryness is evident in parts of the Northern Plains at the 1- and 3- to 6-month time scales, but otherwise wet conditions dominate across most of the Plains, Midwest, and Southeast at most time scales. The heavy precipitation of the last couple months in the Southern Plains and Southeast has more than compensated for the earlier dry conditions. In the West, there were a few areas of dryness and wet conditions, but near-normal conditions dominate at the 1-month time scale. There is a marked contrast between dry conditions along the West Coast, Pacific Northwest, and Northern Rockies, and wet conditions in the Southwest and Central to Southern Rockies, at longer time scales. This contrast is most pronounced at 6 to 12 months. California dryness is most severe at 24 months.
 |
 |
 |
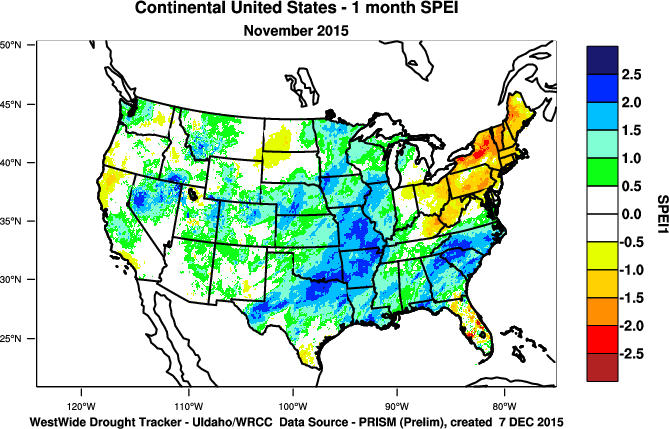
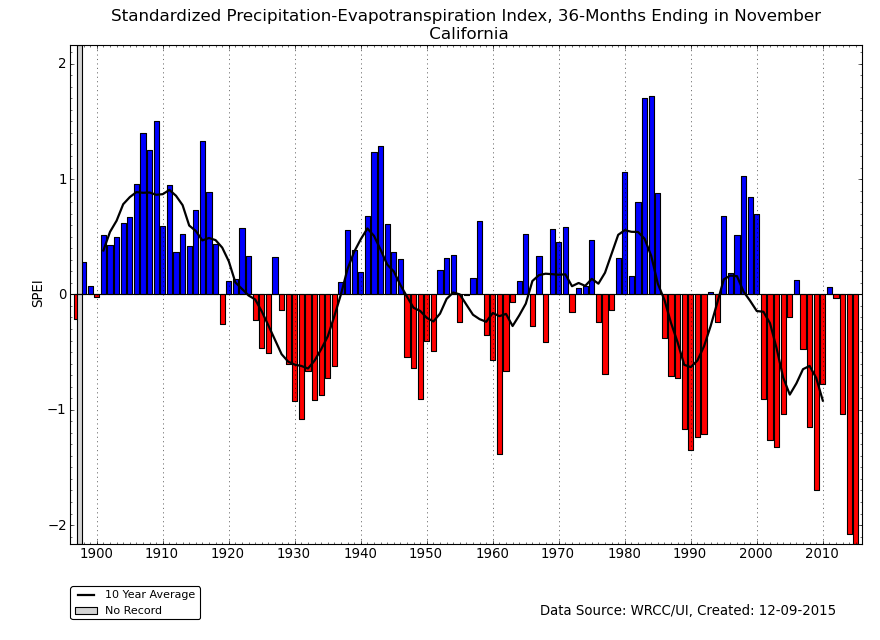
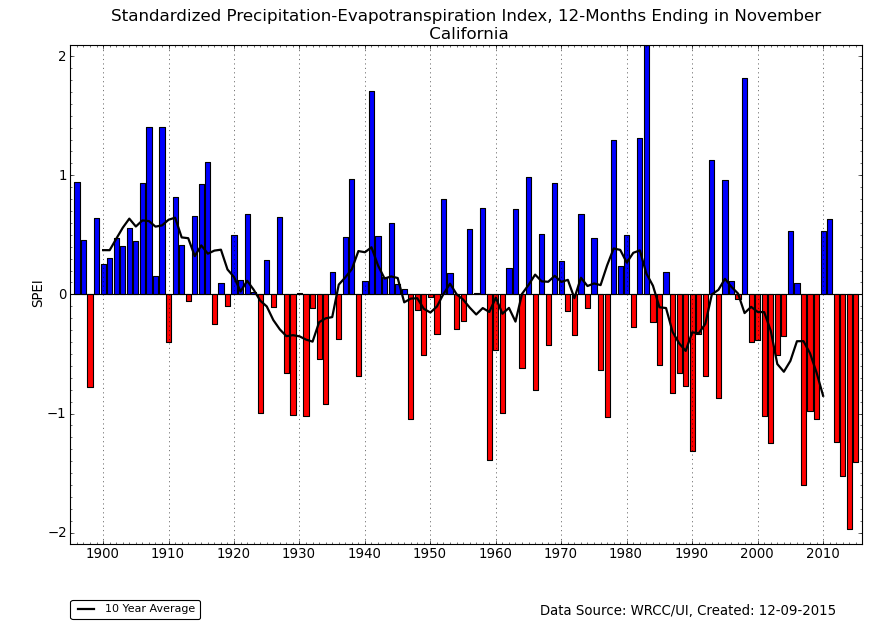
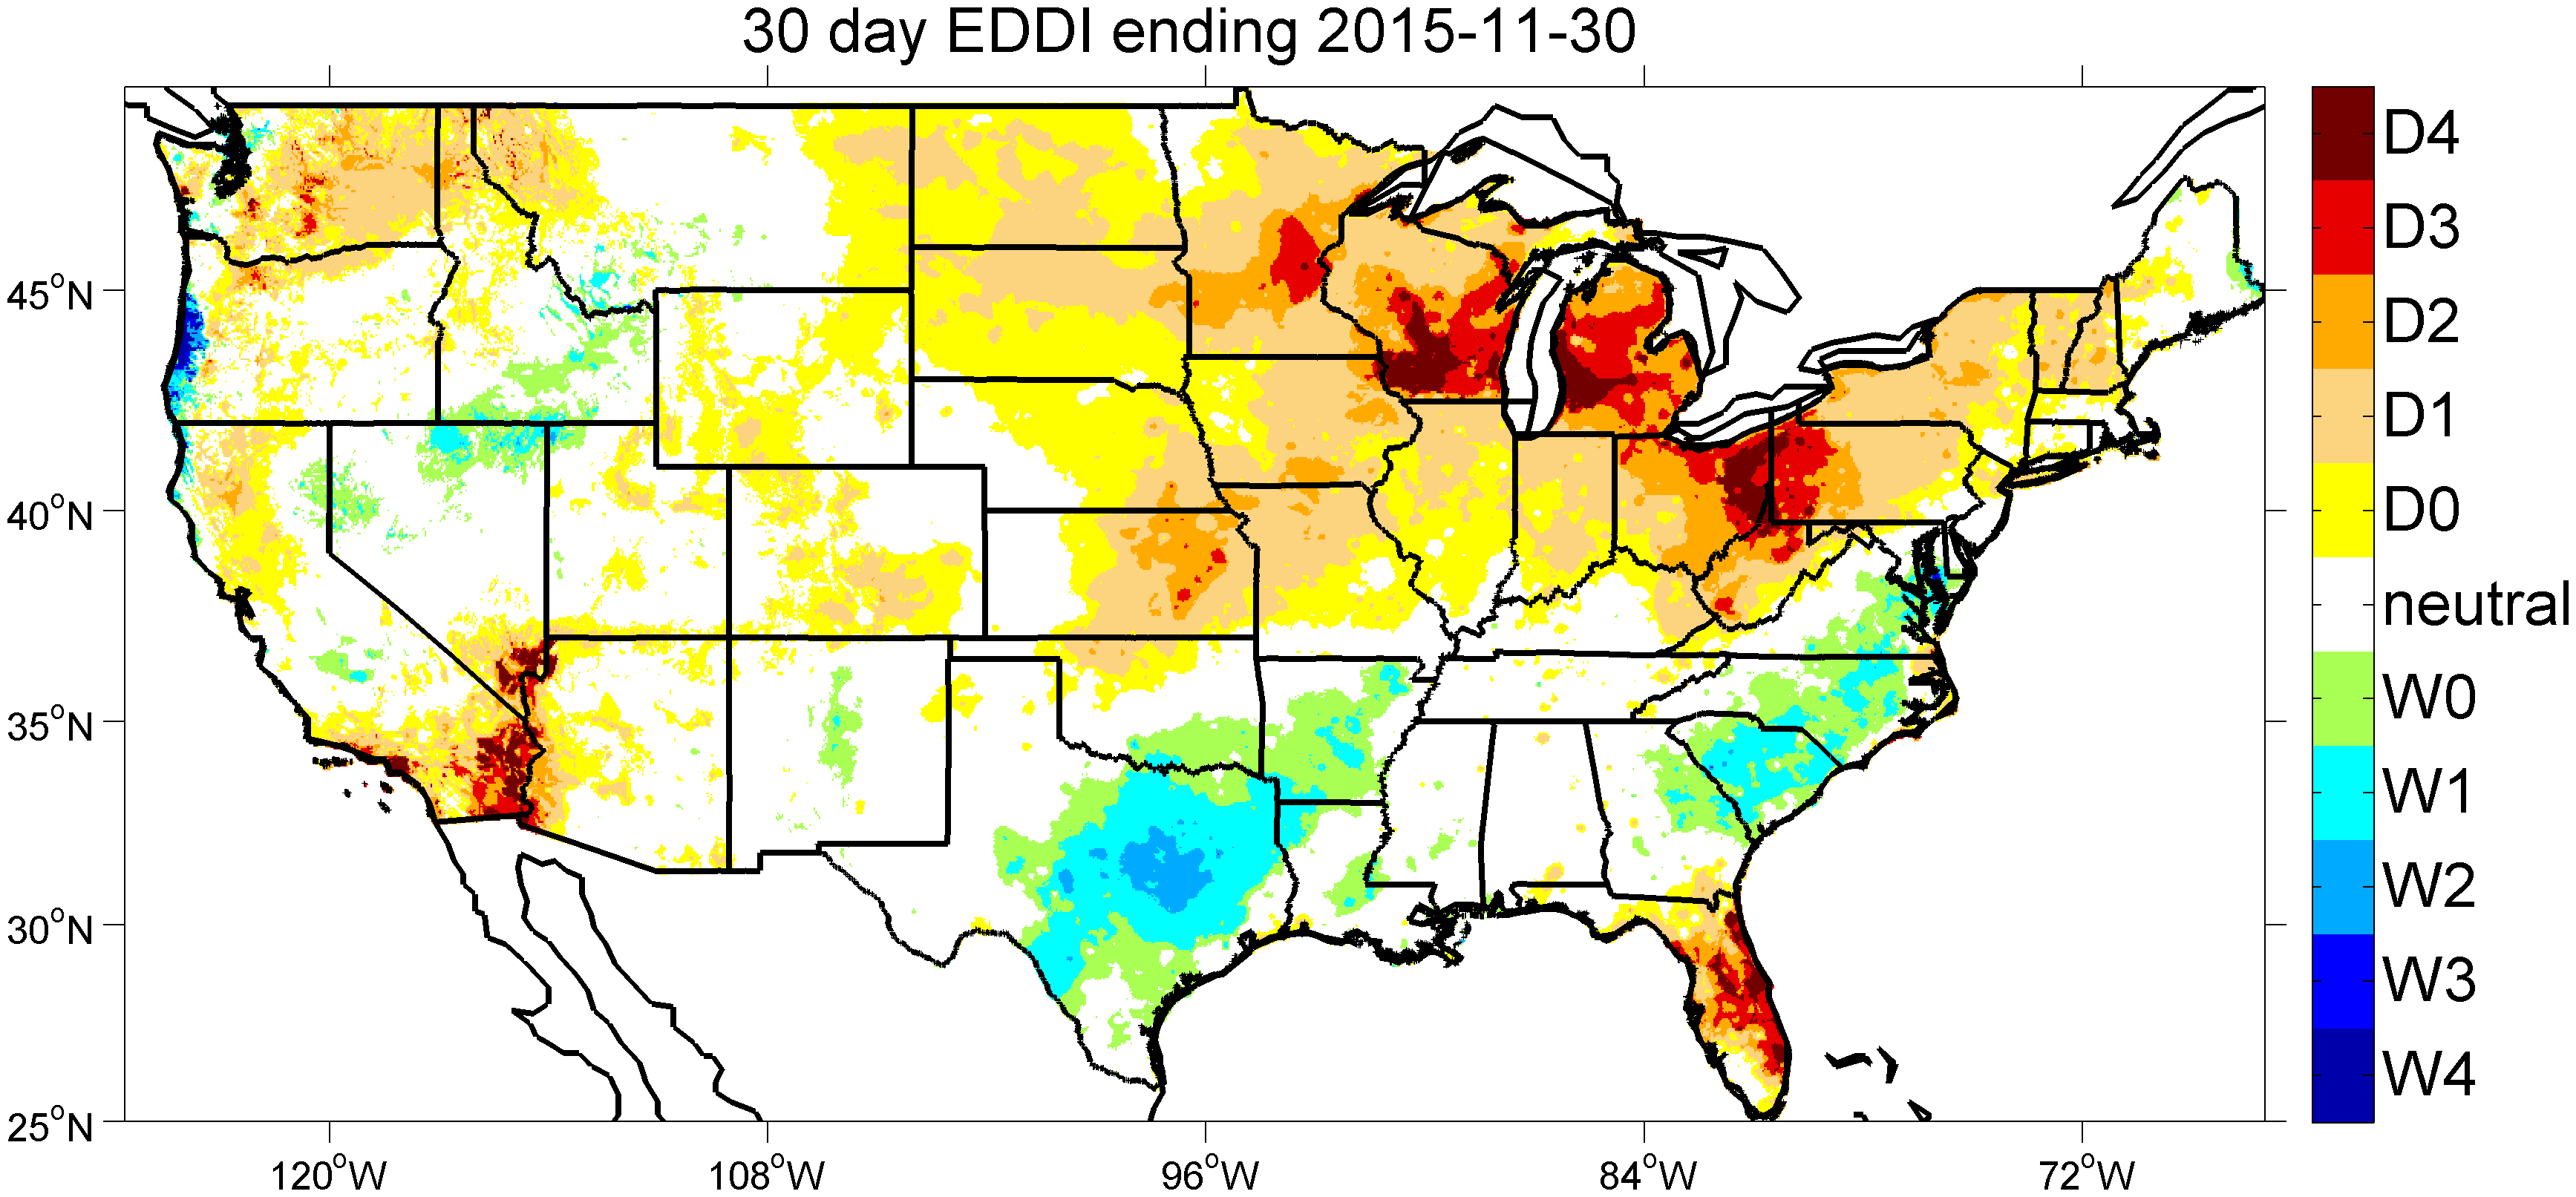
Standardized Precipitation Evapotranspiration Index
The SPI measures water supply (precipitation), while the SPEI (Standardized Precipitation Evapotranspiration Index) measures the combination of water supply (precipitation) and water demand (evapotranspiration as computed from temperature). Warmer temperatures tend to increase evapotranspiration, which generally makes droughts more intense.
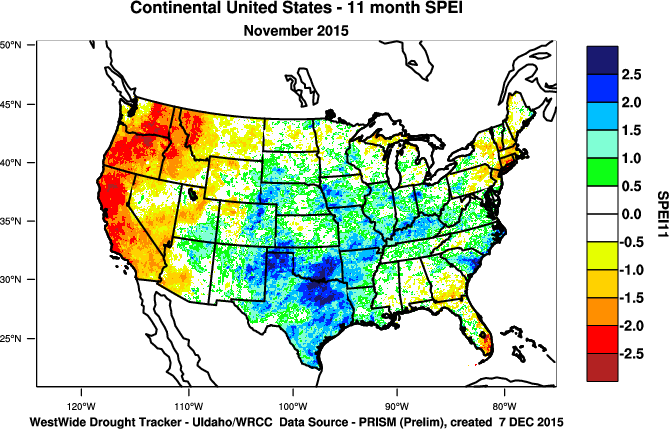 |
 |
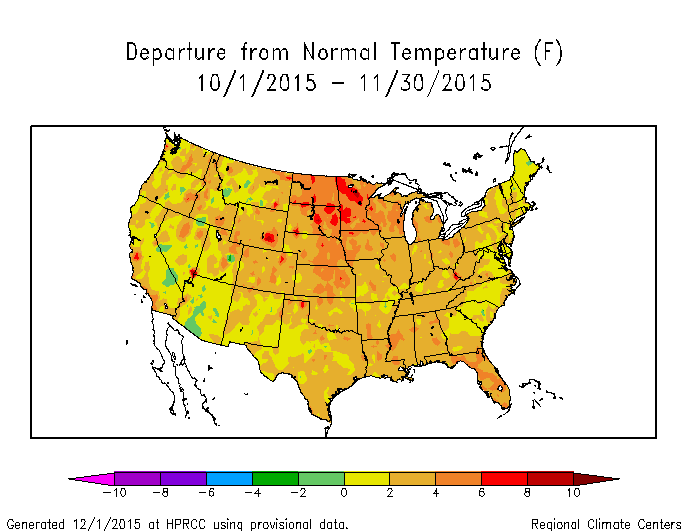
During November 2015, temperatures were above normal across the CONUS east of the Rockies, and cooler than normal across the West. The warmer-than-normal temperatures amplified the dry conditions in the Northeast when the 1-month SPEI is compared to the SPI. The difference this time of year is not as great as it would be during the summer due to the normally lower seasonal temperatures. The year to date has been unusually warm, especially in the West where several states have had record or near-record January-November temperatures. The year so far has been drier than normal for California and the Pacific Northwest. The heat has exacerbated the dryness as seen in the more severe year-to-date SPEI values compared to the SPI.
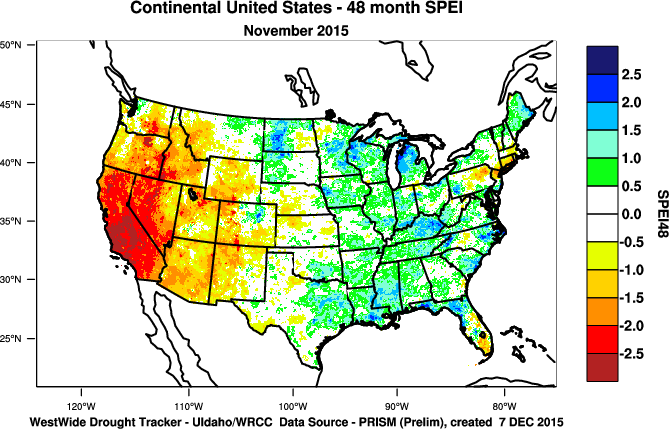
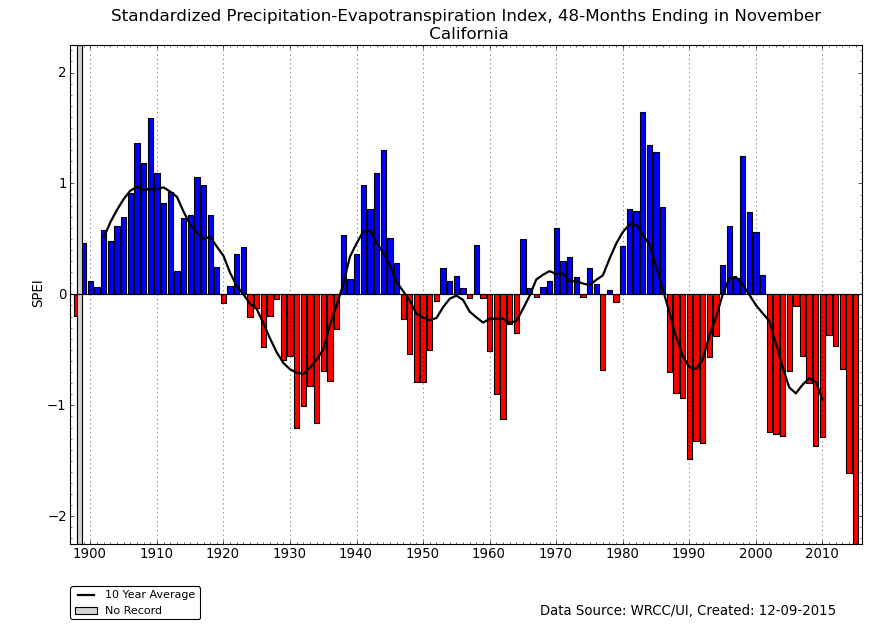
48-month SPEI for current month.
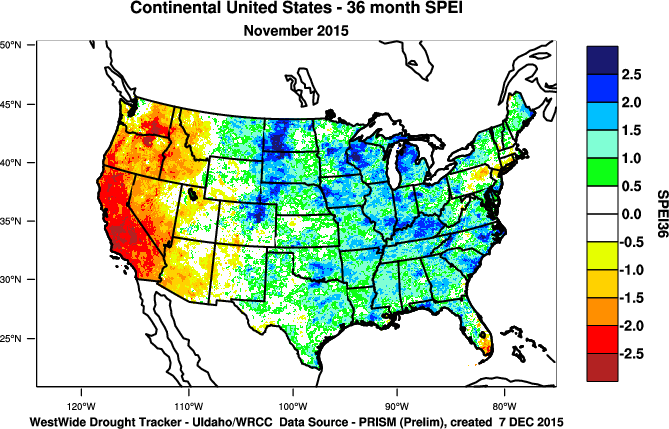
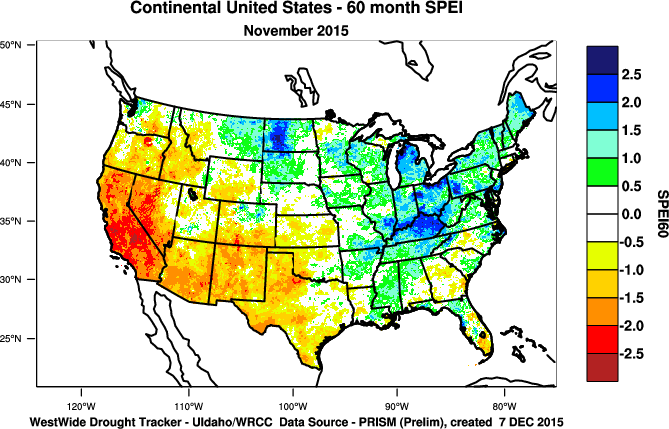
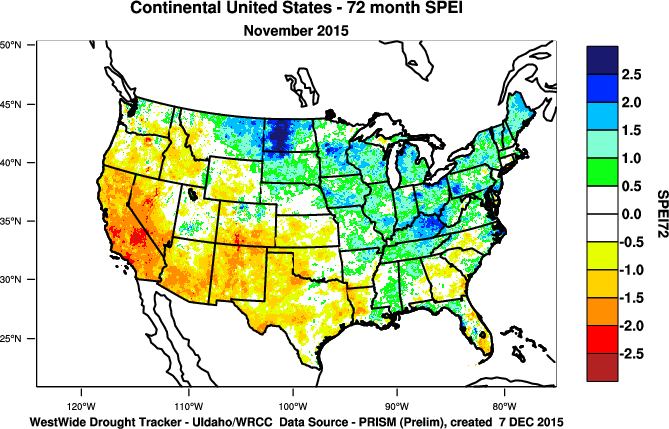
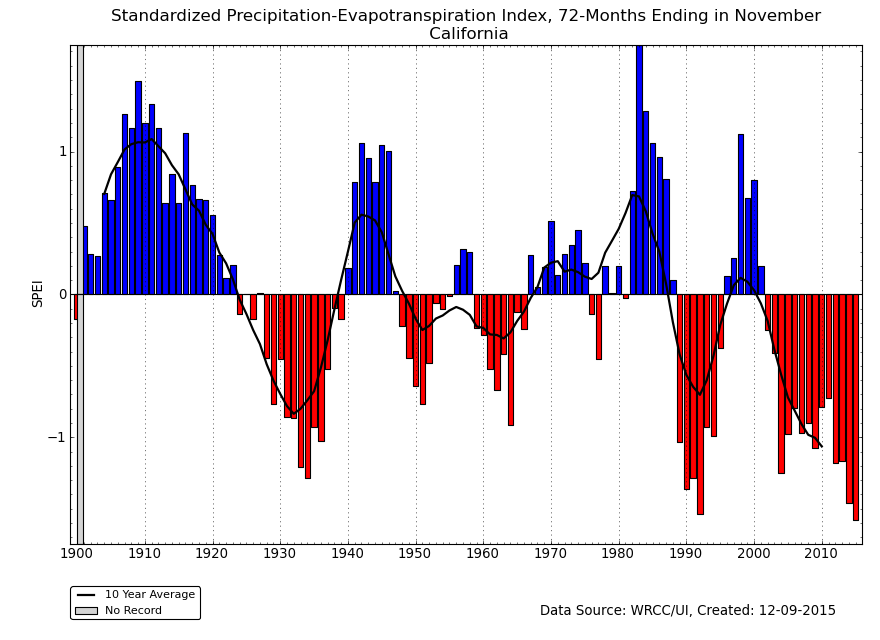
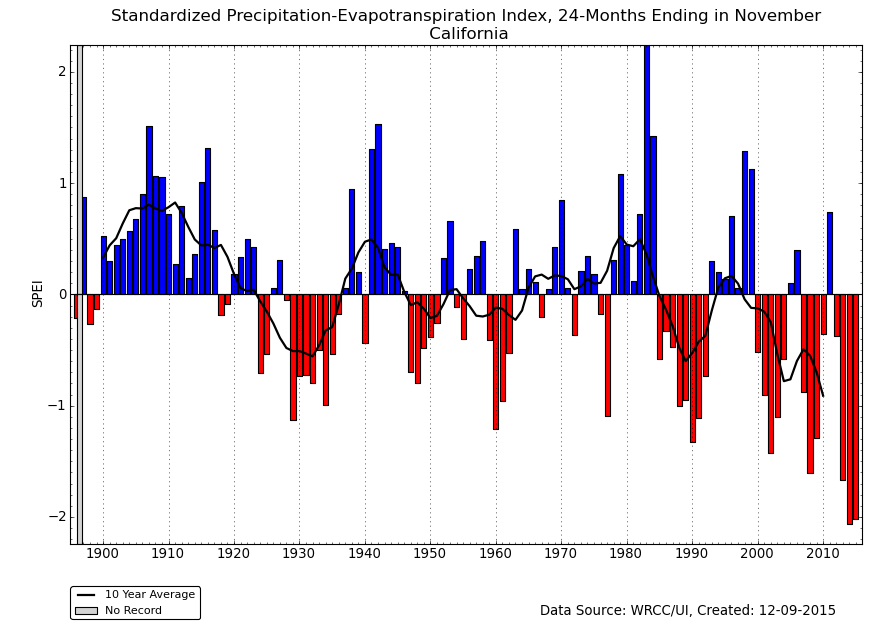
The persistent above-normal temperatures in the West have resulted in more severe SPEI values, compared to the SPI, for much of the last six years (SPEI maps for the last 12, 24, 36, 48, 60, 72 months) (SPI maps for the last 12, 24, 36, 48, 60, 72 months). The excessive heat has exacerbated drought conditions.
This is especially the case in California, where the last two years (December-November 12-month periods) ranked as the warmest and second warmest such periods in the 1895-2015 record, and both were much warmer than all of the years before them. The last four years have been much warmer than average, and this year caps a period of persistent unusual warmth which has lasted over three decades. The state has had the most severe 36-, 48-, 60-, and 72-month SPEI in the 1895-2015 record. Cooler-than-normal temperatures and areas of wetness during November 2015 helped nudge the 24-month SPEI for 2015 to second place (behind 2014) and the 12-month SPEI to fourth place. Even without the heat, the last four years have been the driest on record for California, according to the 48-month SPI. The 36-month SPI ranks as the second driest after last year's value.
 |
 |
Regional Discussion
 |
 |
CONUS Agricultural & Hydrological Impacts:
Improving drought conditions were reflected in numerous agricultural, hydrological, and other meteorological indicators, both observed and modeled. According to November 29th U.S. Department of Agriculture (USDA) reports, only 9 percent of the winter wheat crop was rated in poor to very poor condition, compared to 12 percent a month ago. As of December 1st, 12 percent of the nation's hay, 13 percent of the cattle inventory, 14 percent of the winter wheat production, and 3 percent of soybean production and corn production were in drought. These are all decreases compared to a month ago. Eighteen percent of the nation's topsoil and 25 percent of the subsoil were short to very short of moisture (dry to very dry), which are also decreases compared to the end of October. Conditions varied considerably from state to state.
Drought conditions at the end of the month, as depicted on the December 1st USDM map, included the following CONUS core drought and abnormally dry areas:
- Moderate (D1) to severe (D2) drought covered a large part of the western U.S., with extreme (D3) to exceptional (D4) drought extending from California and Nevada into the Pacific Northwest and Northern Rockies. —
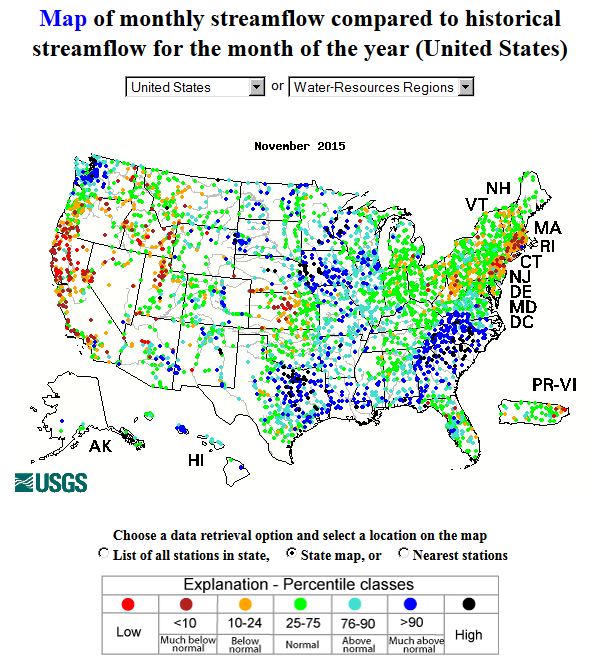
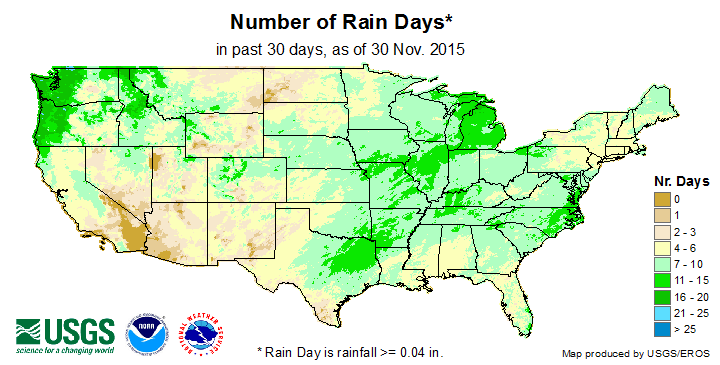
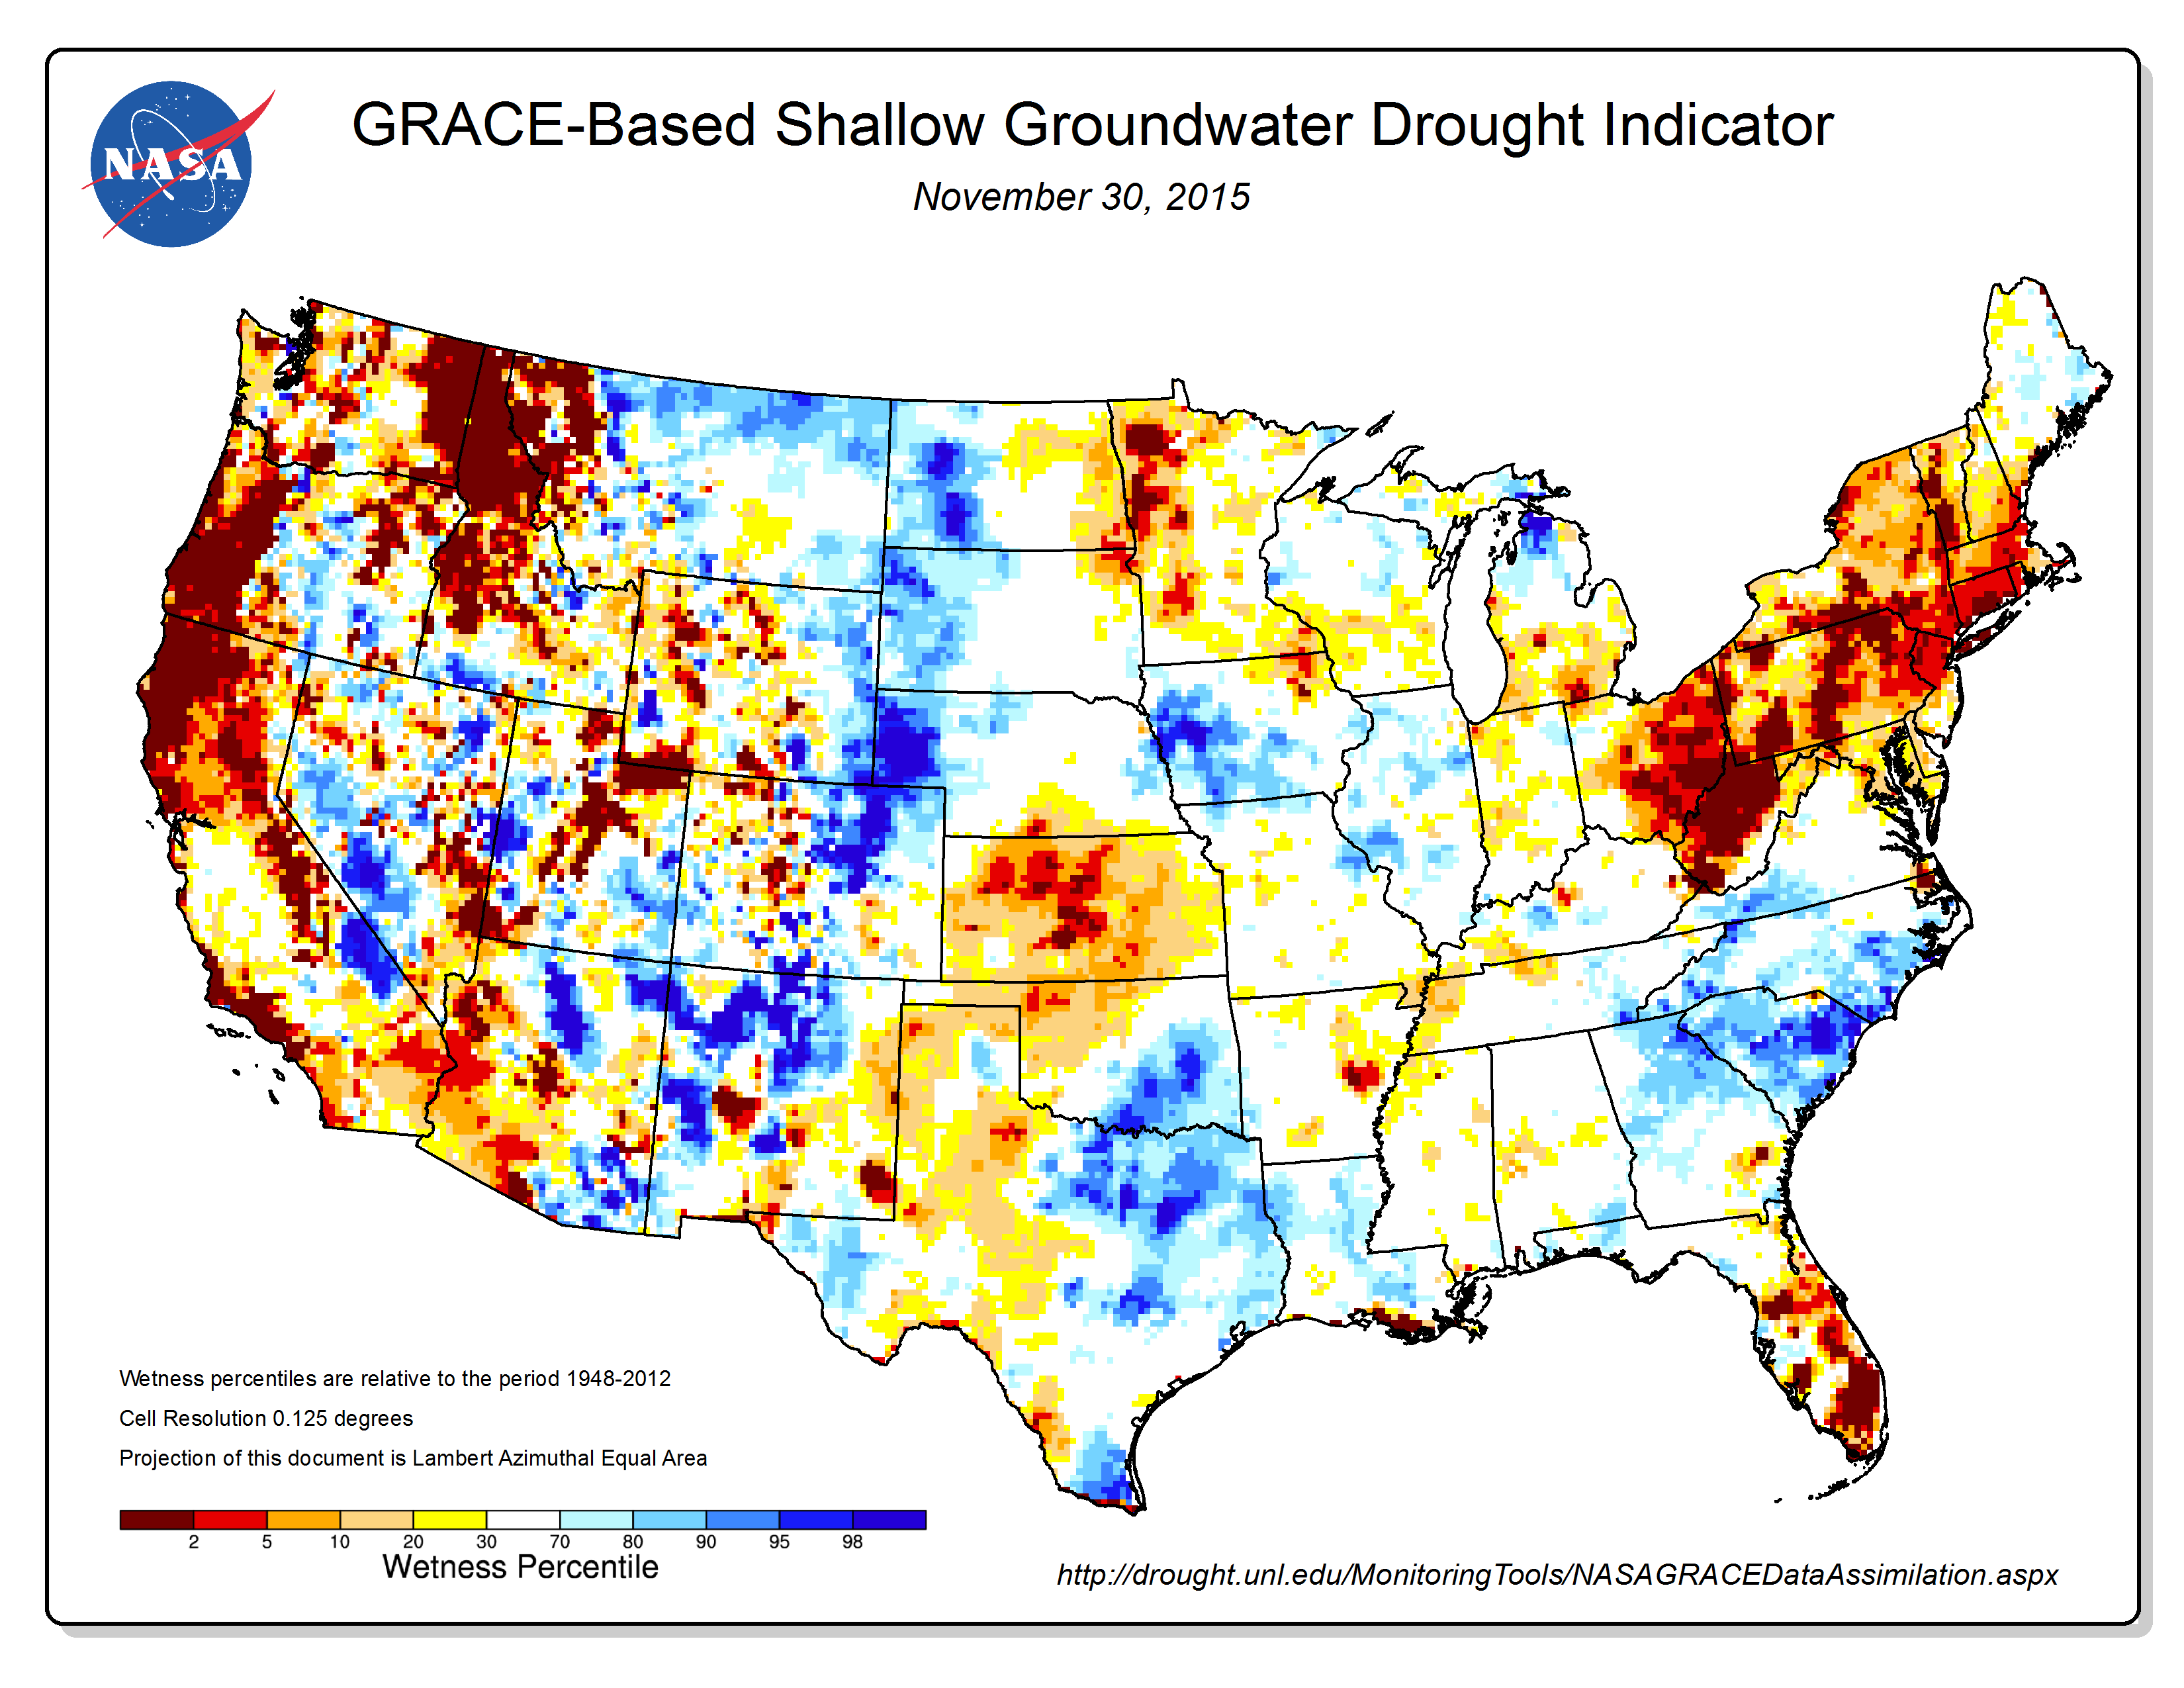
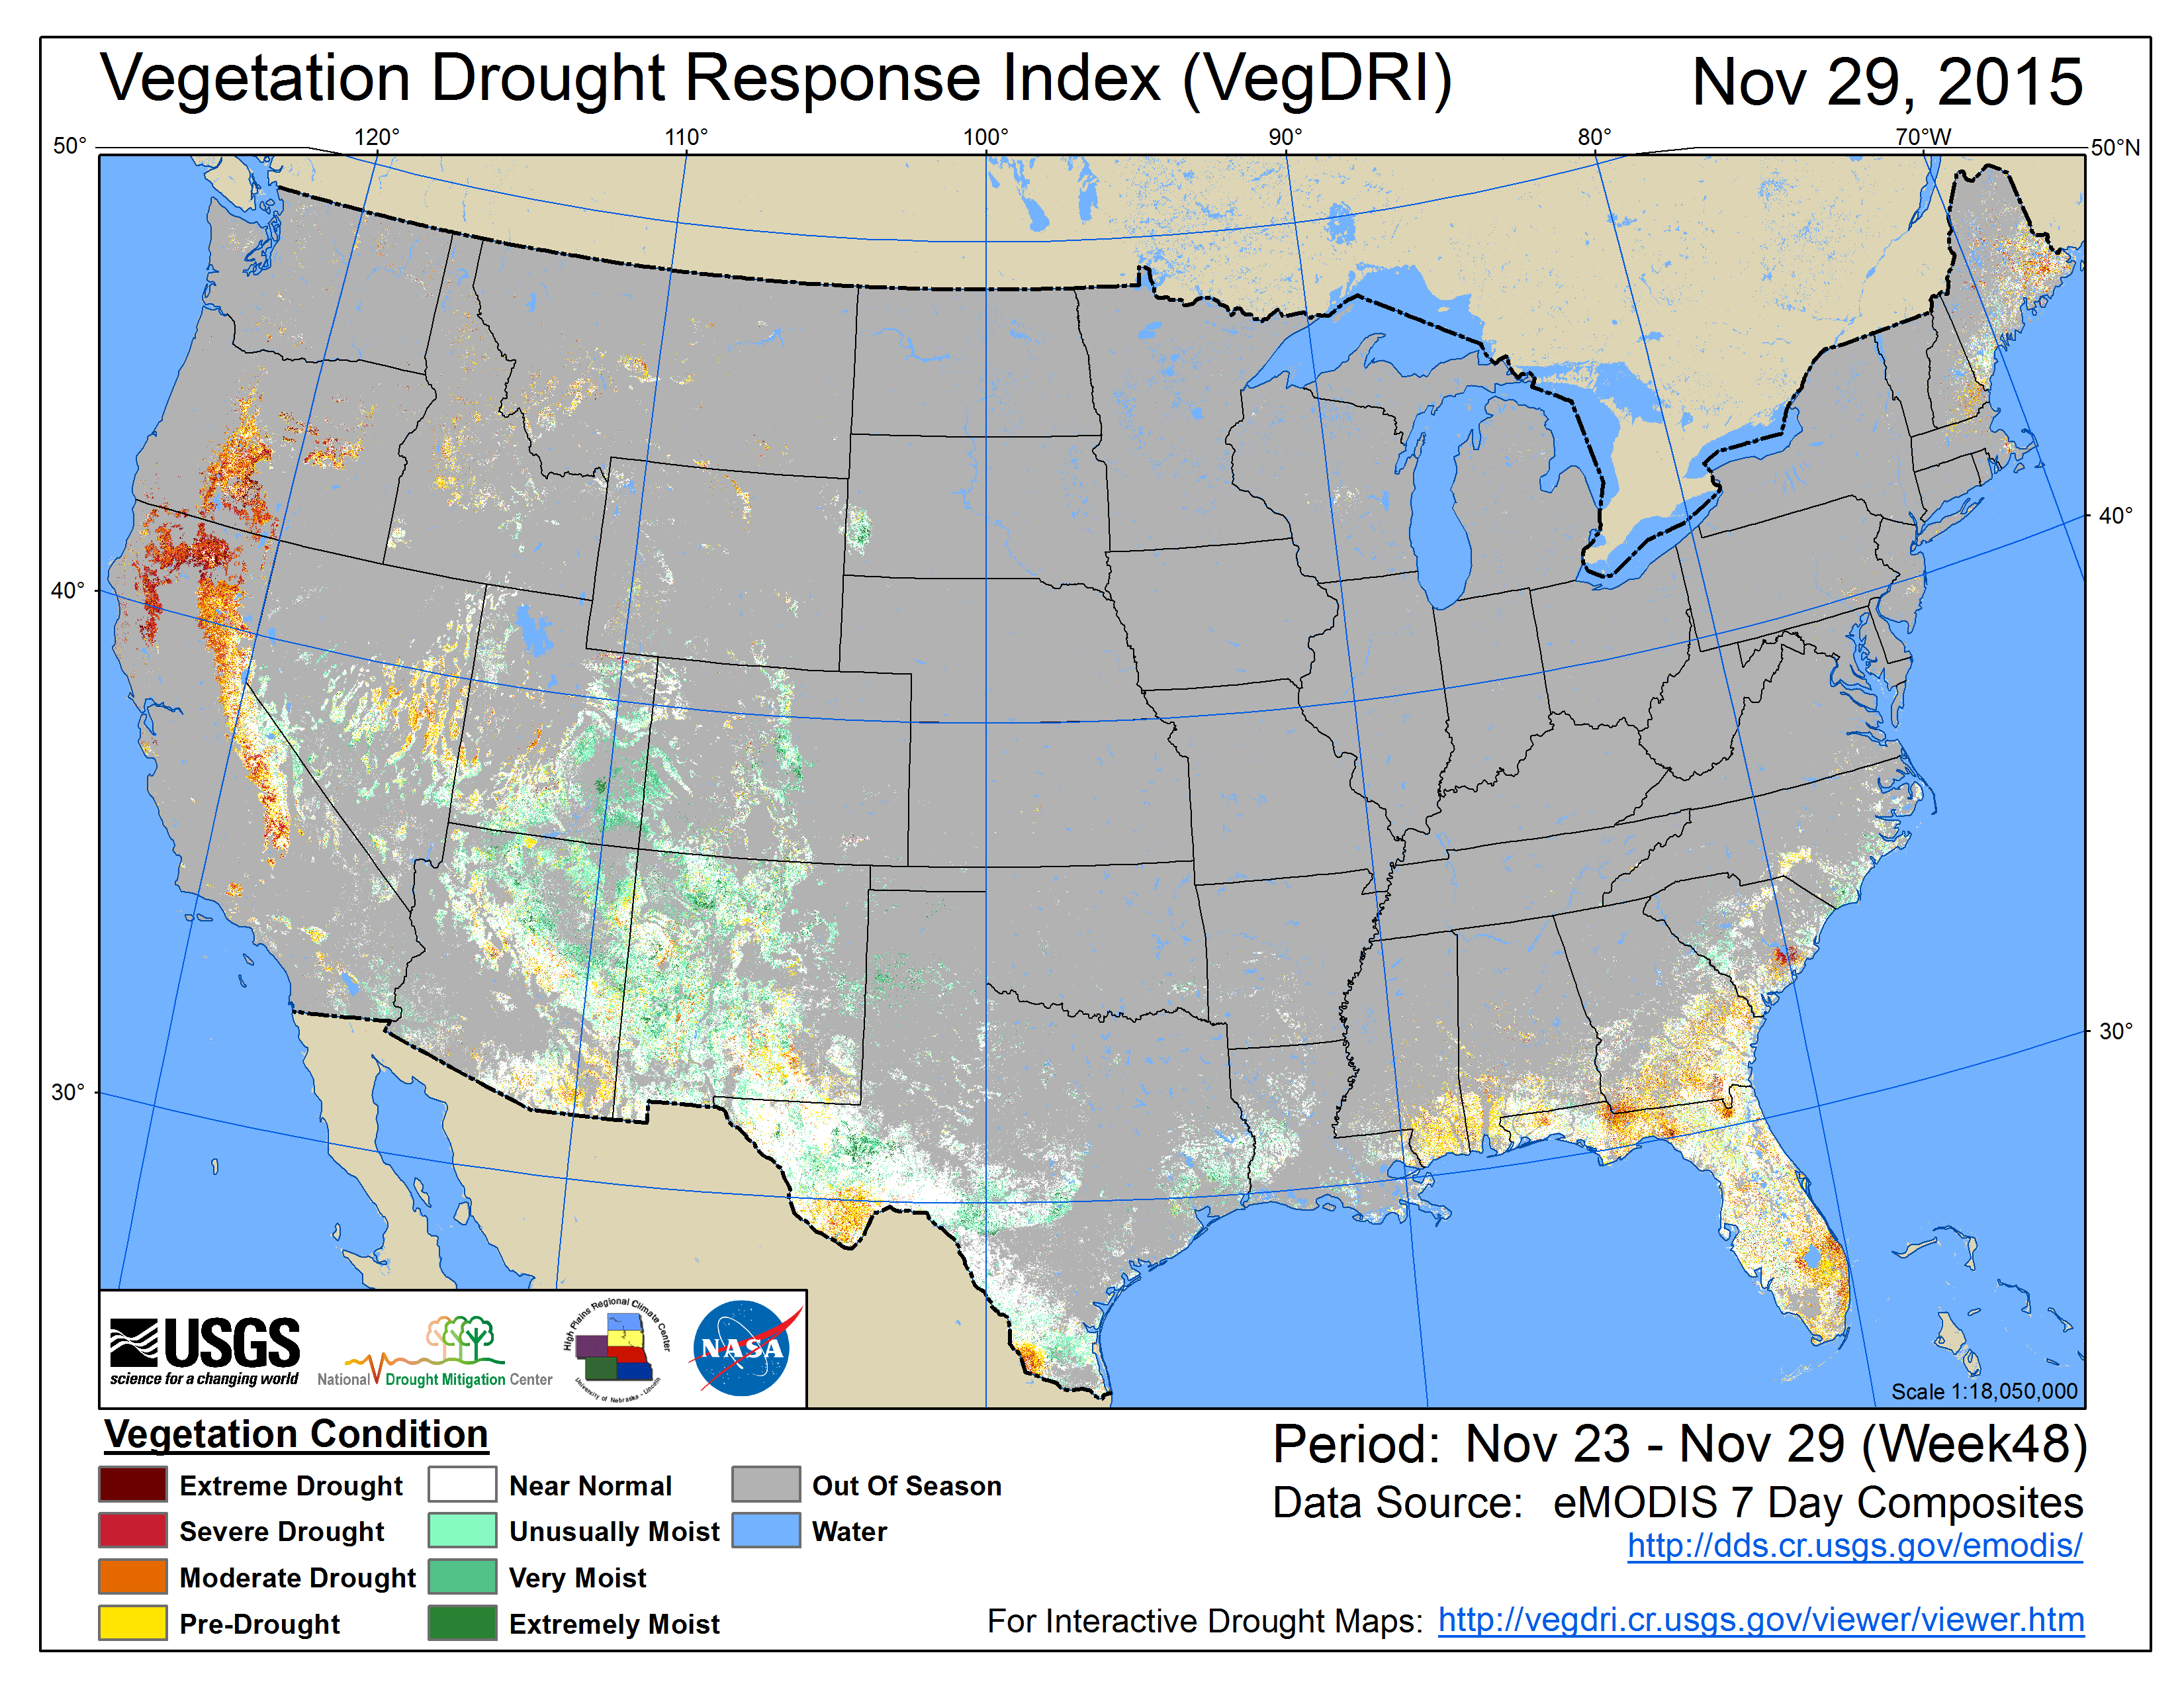
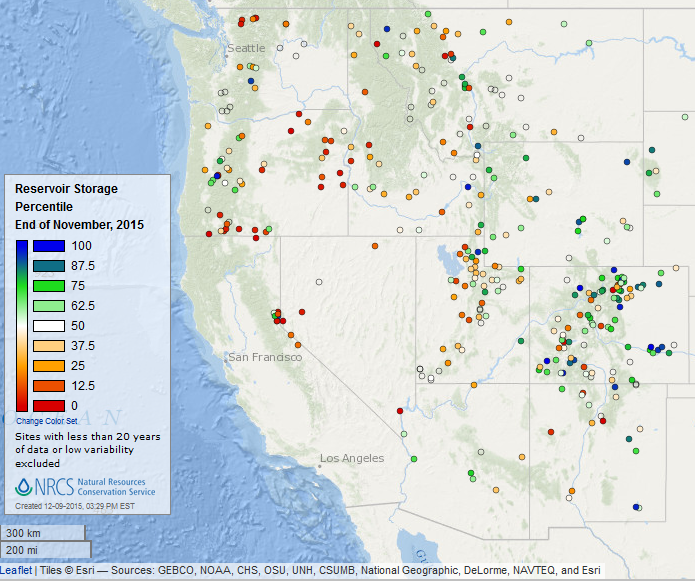
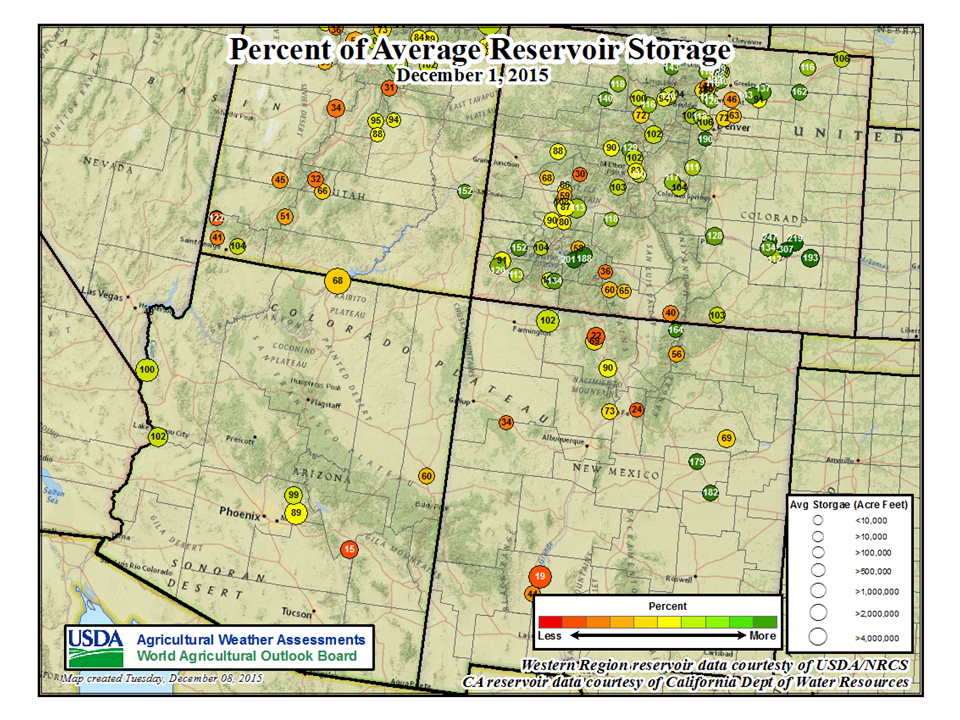
- Parts of the West were wetter than normal during November, while other parts were drier than normal. While the Cascades to coastal Washington had above-normal precipitation, most of it fell as rain instead of snow so the important mountain snowpack continued below normal. Above-normal precipitation fell across parts of the Rockies and interior West, which increased mountain snowpack, but here (as in the Cascades) the water content of the snowpack was low for this time of year. The snowpack conditions were better (higher percentiles) in the Central to Southern Rockies and Sierra Nevada mountain ranges, but this is still early in the snow season. Monthly streamflows were much above normal in coastal Washington, reflecting the recent rains, but if a deep mountain snowpack is not established this winter, the stream levels will rapidly drop. The drought continued to be reflected in low streamflows across California and the interior West, dry soils, lack of rain days and long runs of consecutive dry days in the Southwest, depleted groundwater, continued stressed vegetation, and depleted reservoirs, especially in Nevada, Oregon, New Mexico, and California. The USDA estimated that 85 percent of the topsoil in California, 56 percent in Washington, 53 percent in Oregon, 46 percent in Wyoming, and 43 percent in New Mexico was short or very short of moisture. Subsoil moisture conditions were just as dire with 80 percent short or very short in California, 75 percent in Oregon, 64 percent in Washington, 60 percent in Nevada, and 48 percent in Utah.
- Pockets of abnormally dry to moderate drought conditions expanded in parts of the Midwest and Central to Northern Plains. —
- Cold fronts and low pressure systems brought above-normal precipitation to much of the Great Plains to Midwest in November. But the systems largely missed parts of the Northern Great Plains and eastern Ohio Valley, which were drier than normal. Above-normal temperatures increased evaporative drying, especially in the Great Lakes region. Drought conditions in Kansas were reflected by low streamflows and depleted groundwater, with 23 percent of topsoil and 34 percent of subsoil short or very short of moisture according to USDA statistics. Drought conditions in North Dakota to northeastern Wyoming were reflected by lack of rain days and long runs of consecutive dry days, below-normal precipitation, and dry soils. USDA statistics report 28 percent of subsoil moisture and 24 percent of topsoil moisture short to very short in North Dakota, and 43 percent of subsoil and 33 percent of topsoil short to very short of moisture in Montana. The statistics were 46 percent for topsoil and subsoil in Wyoming.
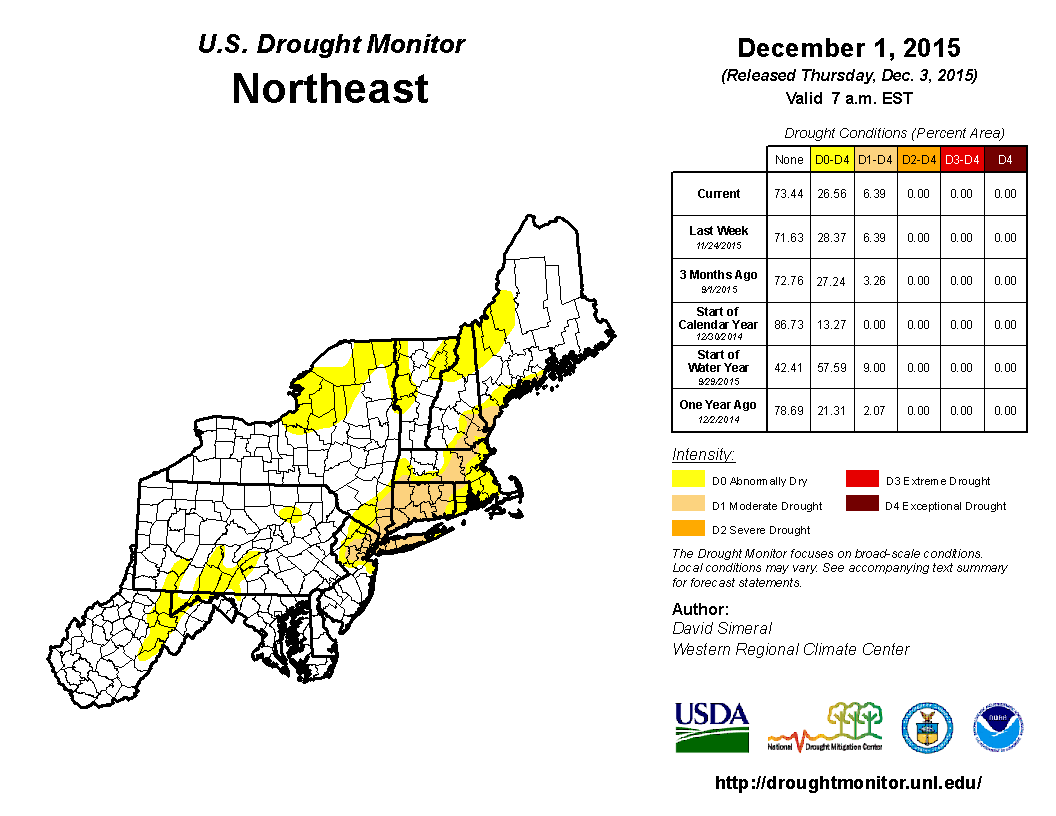
- Abnormally dry to moderate drought conditions continued in parts of the Northeast. —
- Unusually warmer-than-normal temperatures increased evaporation which, combined with drier-than-normal weather, further dried soils. According to USDA statistics, 40 percent of the topsoil and 42 percent of the subsoil in Connecticut was short or very short of moisture. In Rhode Island, the values were 30 percent for topsoil and 39 percent for subsoil. The lack of precipitation and snow cover resulted in continued below-normal stream levels, especially in New Jersey and southern New England. Drought conditions were also reflected in low groundwater supplies.
- Although drought and abnormally dry conditions were all but eliminated in the Southern Plains to Southeast, dry conditions were still reflected in a few indicators. —
- Reservoirs and groundwater levels were still low in western Texas, groundwater had not recovered in southern Florida, and vegetation was still stressed in a few areas.
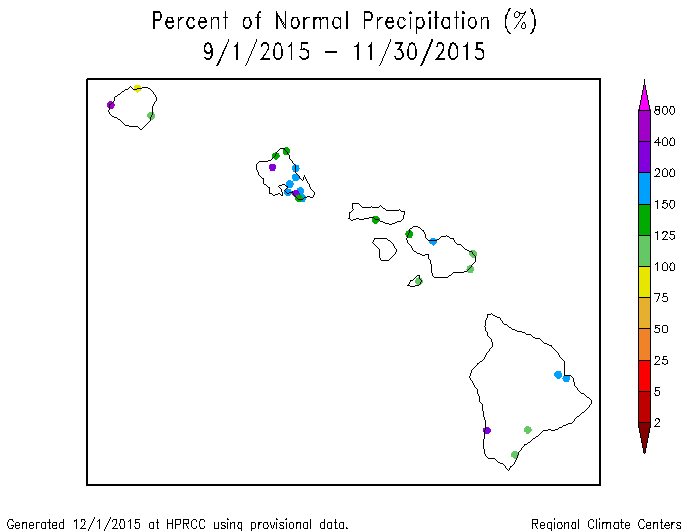
Hawaii: November 2015 was wetter than normal at most of the stations across Hawaii. The wet pattern was widespread for much of the past year (last 2, 3, 5, 6 months). Dryness was evident for some stations beginning about 8 months ago (last 8, 11, 12, 24, and 36 months). There was no drought and only a little abnormal dryness on the December 1st USDM map.
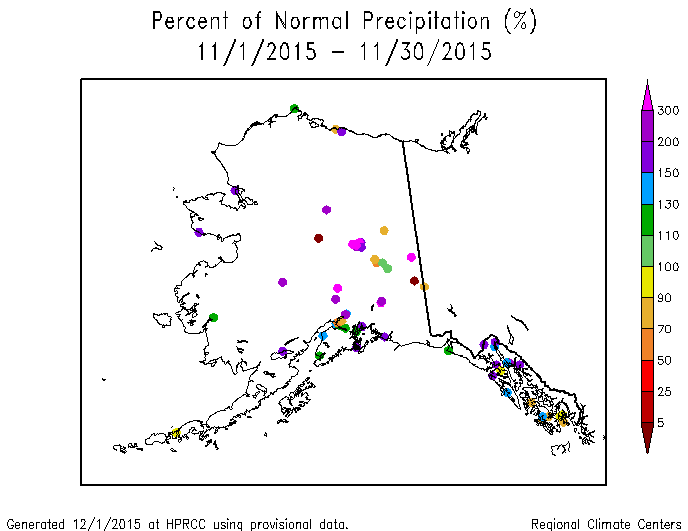
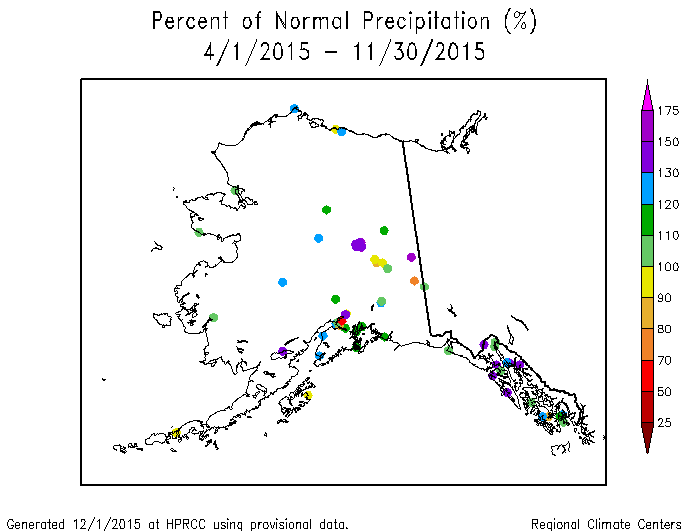
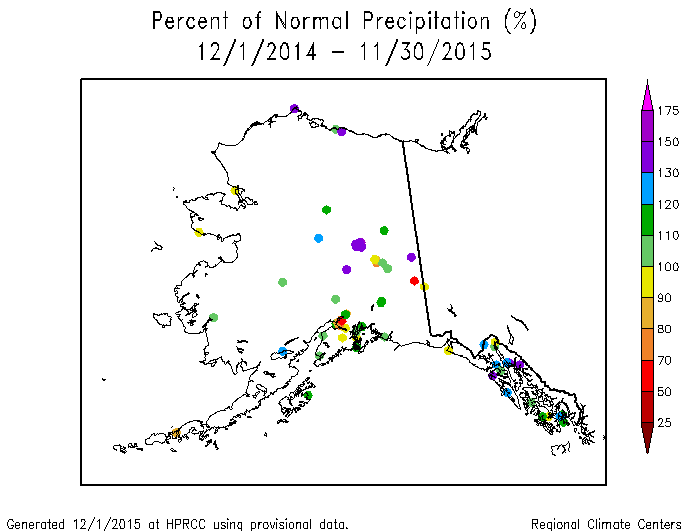
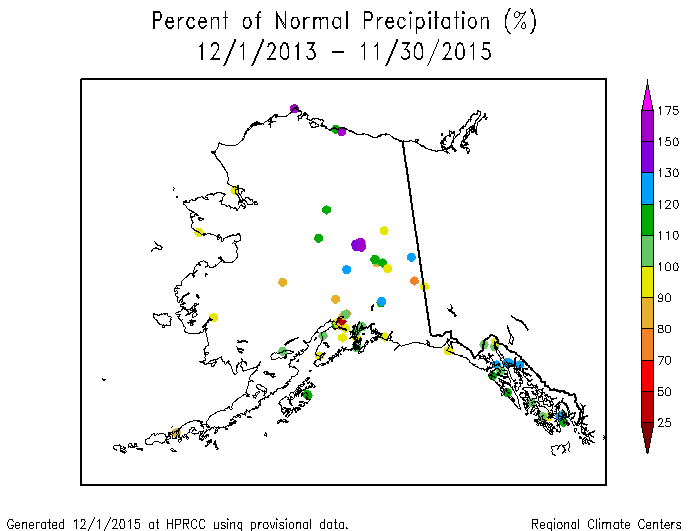
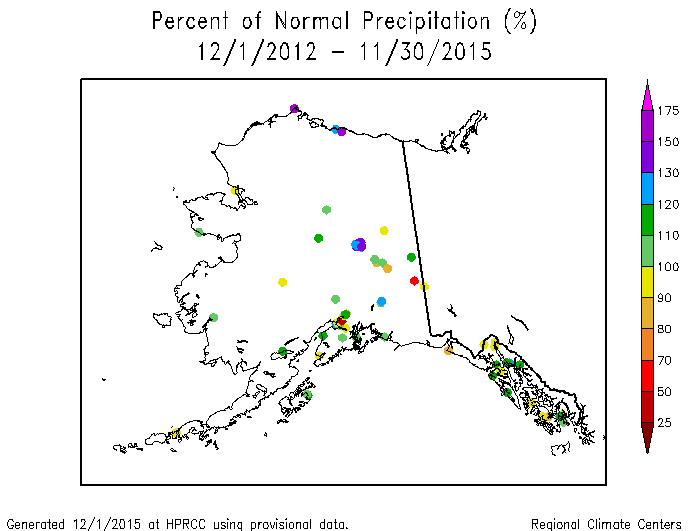
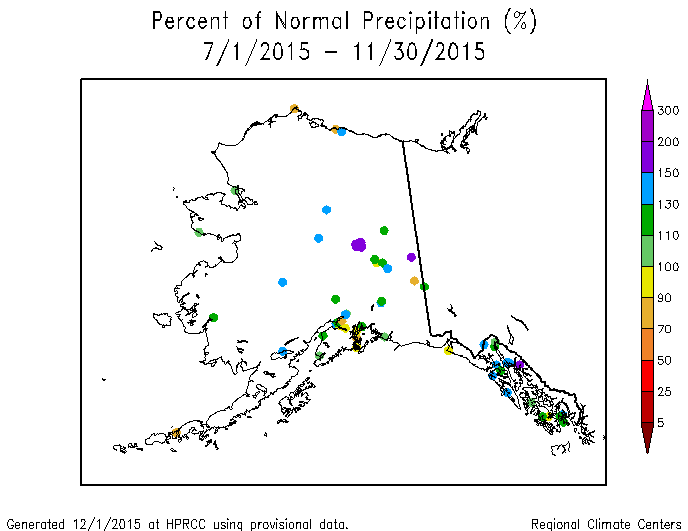
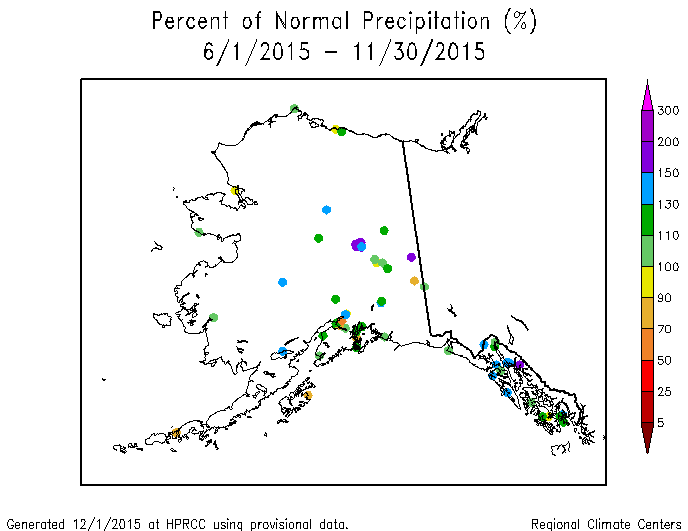
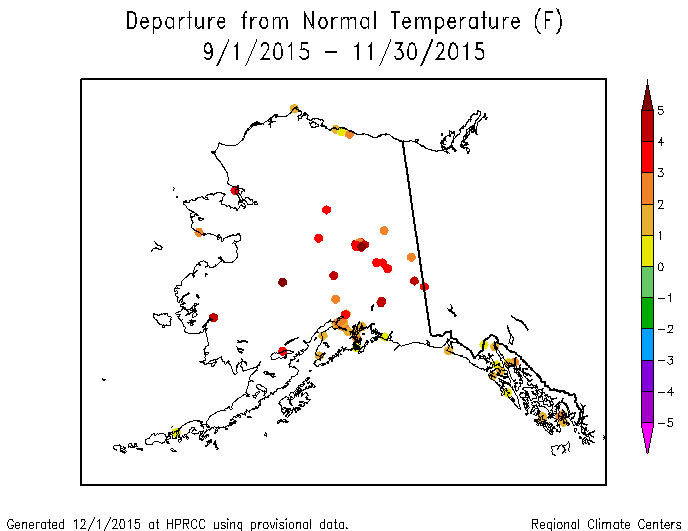
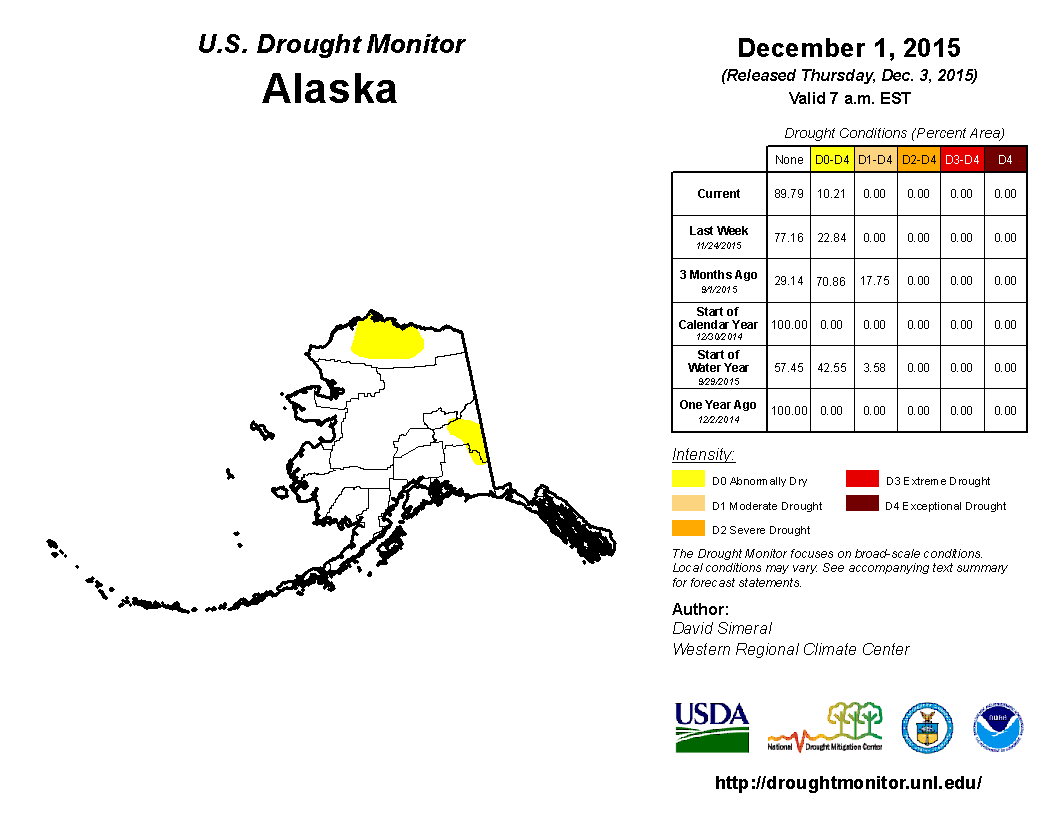
Alaska: A wetter-than-normal precipitation pattern has dominated most areas in Alaska during November and much of the last twelve months (station maps for November and the last 2, 3, 5, 6, 8, 11, 12 months) (climate division maps for November and the last 3, 6, 11, and 12 months). Drier-than-normal areas are evident in the southwest and some interior locations at longer time scales (last 24 and 36 months). The warmer-than-normal November temperature anomaly pattern held for most of the last year based on both the climate division (last 1, 3, 6, 11, 12 months) and station (last 1, 2, 3, 11, 12 months) analyses. Snowpack water content at most locations was above normal at the end of November. Abnormal dryness shrank to 10.2 percent of the state on the December 1st USDM map.
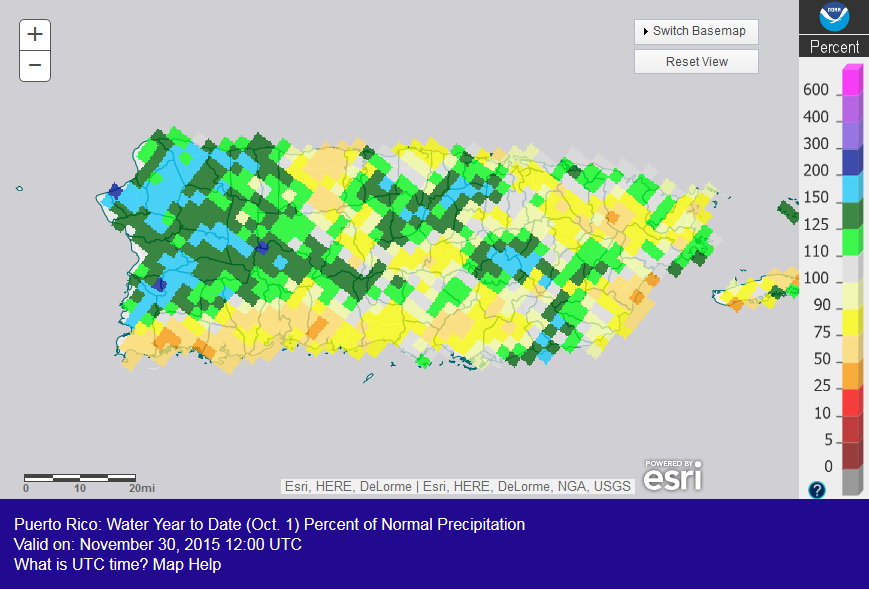
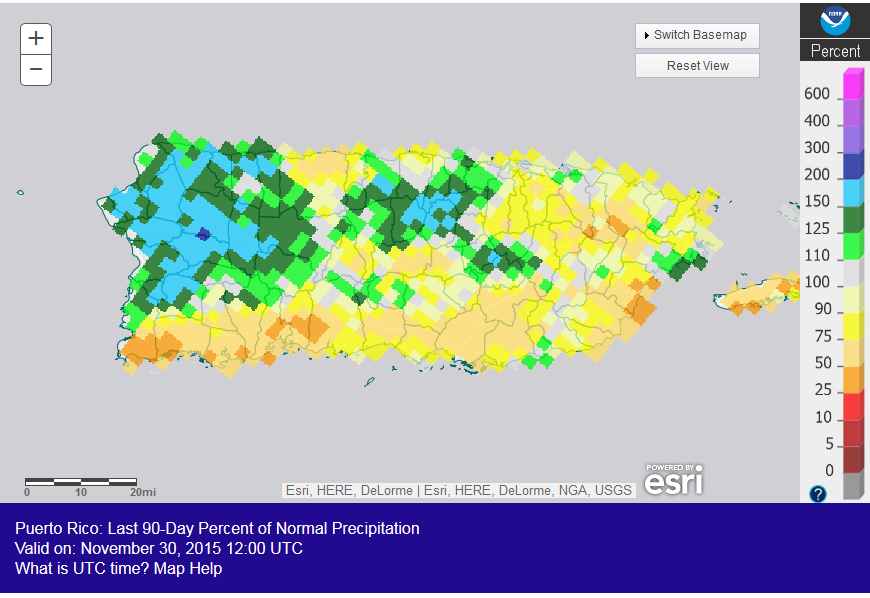
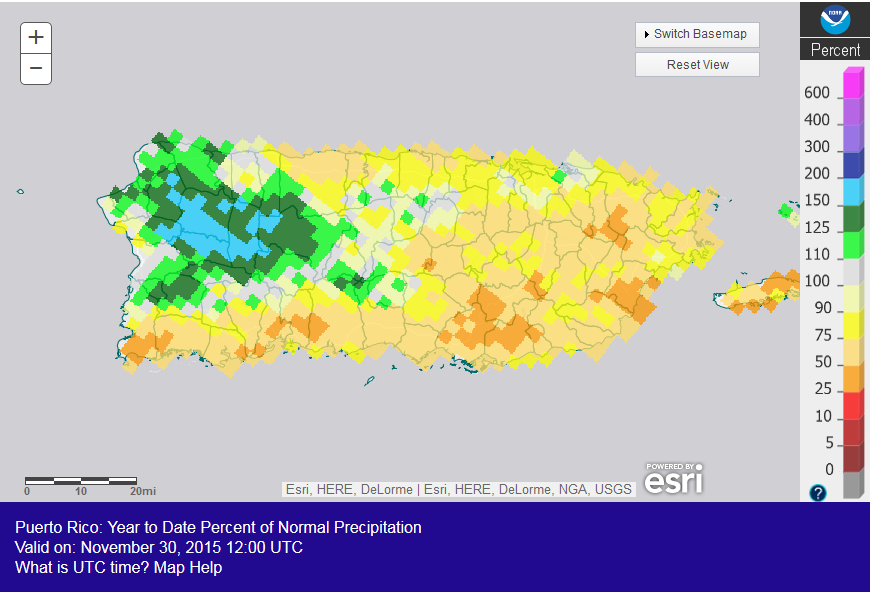
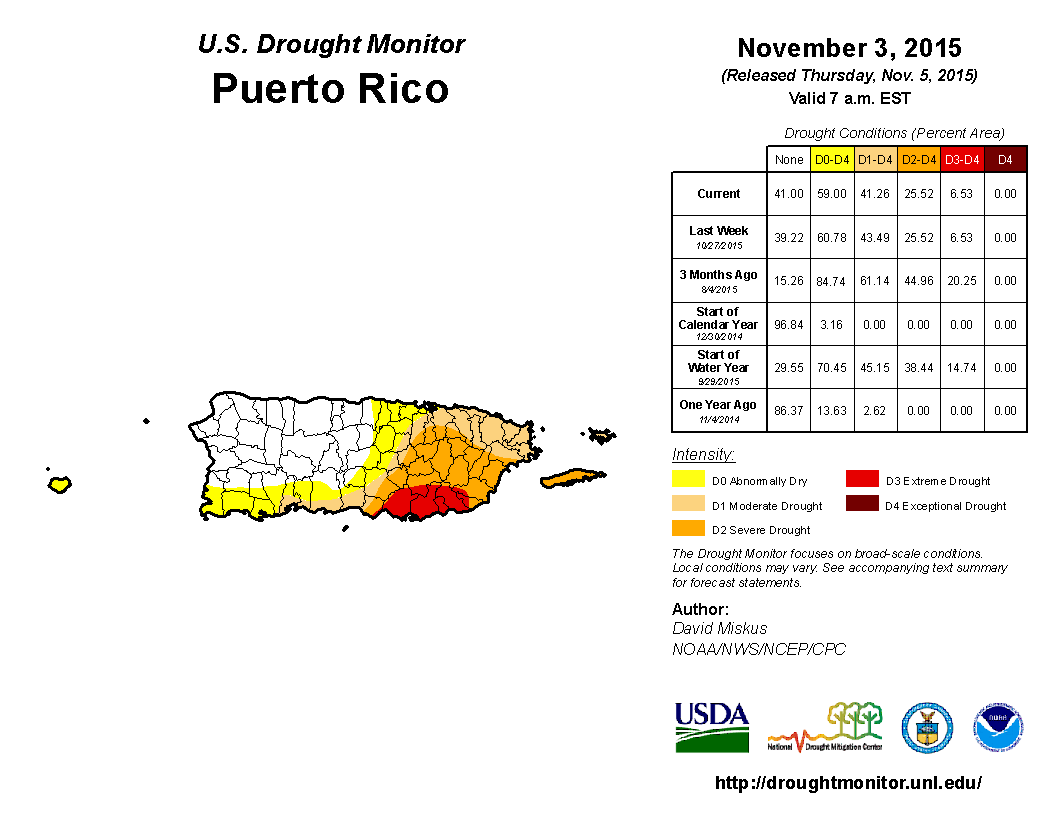
Puerto Rico: Beneficial rains fell across parts of Puerto Rico this month, but conditions were drier than normal from the southwest to northeast parts of the Commonwealth. A mixed pattern of precipitation anomalies was evident for the last 2 to 3 months, but drier-than-normal conditions dominate at longer time scales (last 6 to 11 months). On the December 1st USDM map, abnormal dryness and drought held constant at about 59.0 percent of Puerto Rico, but severe to extreme drought contracted from 25.5 to 16.2 percent of the island. This included 5.4 percent in the extreme drought category.
CONUS State Precipitation Ranks:
 |
|
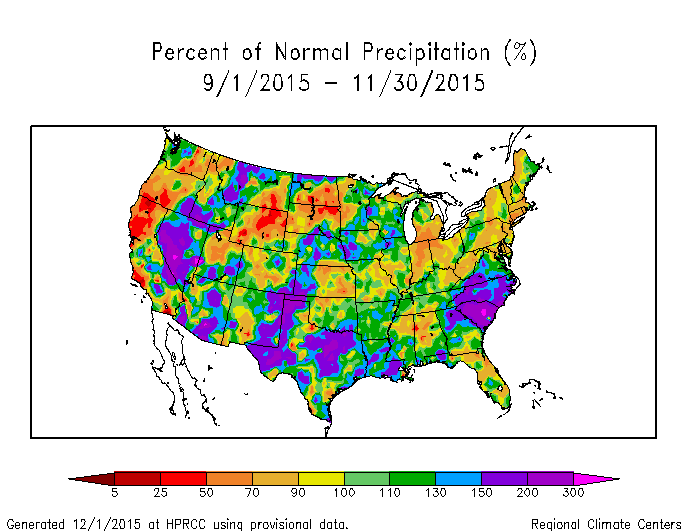
The November precipitation anomaly pattern of dryness in the Northeast was reflected in the state ranks with all Northeast states ranking in the driest third category of the historical record. Vermont had the ninth driest November, New York ranked twelfth driest, and Connecticut 14th driest. But the November dryness in the West, Northern Plains, and eastern parts of the Ohio Valley is not reflected in the state ranks because other parts of those states had areas of wetness. The situation was similar for the last three months and last six months. For September-November, areas of dryness in the West, Plains, Ohio Valley, and East were interspersed with areas of above-normal precipitation, which mostly averaged out in the state ranks. For June-November, areas of dryness in the West, Plains, and South were interspersed with areas of above-normal precipitation, which mostly averaged out in the 6-month state ranks.
 |

|
Dryness at the year-to-date time scale is again widespread enough to rank states in the top ten driest category. Three states fell in this category for January-November 2015: California (third driest year-to-date), Connecticut (fourth driest), and Oregon (fifth driest). For both California and Connecticut, each of the last four year-to-dates has been drier than the long-term average. Seven other states (in the Northwest, Great Lakes, and Northeast) ranked in the driest third of the historical record for January-November.
A similar pattern of dryness and state ranks exists for the last twelve months. Connecticut had the seventh driest December-November on record and eight other states — in the West, Great Lakes, and New England — ranked in the driest third of the historical record.
|

|
Percent area of the Western U.S. in moderate to extreme drought, January 1900 to present, based on the Palmer Drought Index.
For the water year to date (October 1-November 30, 2015), some parts of the West (the Washington Cascades, Nevada, and the Southwest) have had above-normal precipitation, but other parts have been drier than normal. However, dry weather has dominated the West for much of the last four years, resulting in significant hydrological (low lake, reservoir, and stream levels) and agricultural impacts. According to the USDM, 48.9 percent of the West was experiencing moderate to exceptional drought at the end of November, which is less than the previous month. The Palmer Drought Index percent area statistic for the West was 37.5 percent, which is a drop of about 9 percent compared to the previous month.
Except for an occasional interruption, the dryness has been accompanied by unusually and persistently hotter-than-normal weather. November 2015 was one of those "interruptions", with widespread cooler-than-normal weather across the West. Integrated across the West (Rockies to West Coast), October 2015 ranked as the 40th coolest November in the 1895-2015 record. But for the last twelve months, Arizona, California, Montana, Nevada, Oregon, and Washington had the warmest December-November on record, with the remaining western states ranking in the top ten warmest category. This persistent and widespread extreme warmth gave the West the warmest December-November on record. The West has seen a generally steady increase in the persistent and unusual warmth during the last three decades.
|
|
Unusually warm temperatures increase evapotranspiration and make drought conditions worse. The Palmer Z Index for the West shows the month-to-month persistence of the combined warmer- and drier-than-normal conditions. The PHDI for the West shows the cumulative effect of dry and hot weather integrated across area. Hot and dry weather that occurs across a large area will result in more extreme PHDI values. By this measure, the worst individual drought of the last century occurred during 1976-77; the 1930s were also a period of persistent bad drought. It also shows that the 2014-15 drought is as extreme as the worst drought years of the 1930s, and that the last 15 years have been a period of persistent extreme drought for the West.
 |
 |
November saw a continuation of the wetter- and warmer-than-normal weather of the previous month in the Primary Hard Red Winter Wheat agricultural belt. November 2015 ranked as the ninth wettest and 20th warmest November in the 1895-2015 record, regionwide. October marks the beginning of the growing season. The region was generally wetter- and warmer-than-normal for the growing season-to-date, with October-November 2015 ranking as the twelfth wettest and seventh warmest October-November in the 1895-2015 record, regionwide.
NOAA Regional Climate Centers:
A more detailed drought discussion, provided by the NOAA Regional Climate Centers and others, can be found below.
West
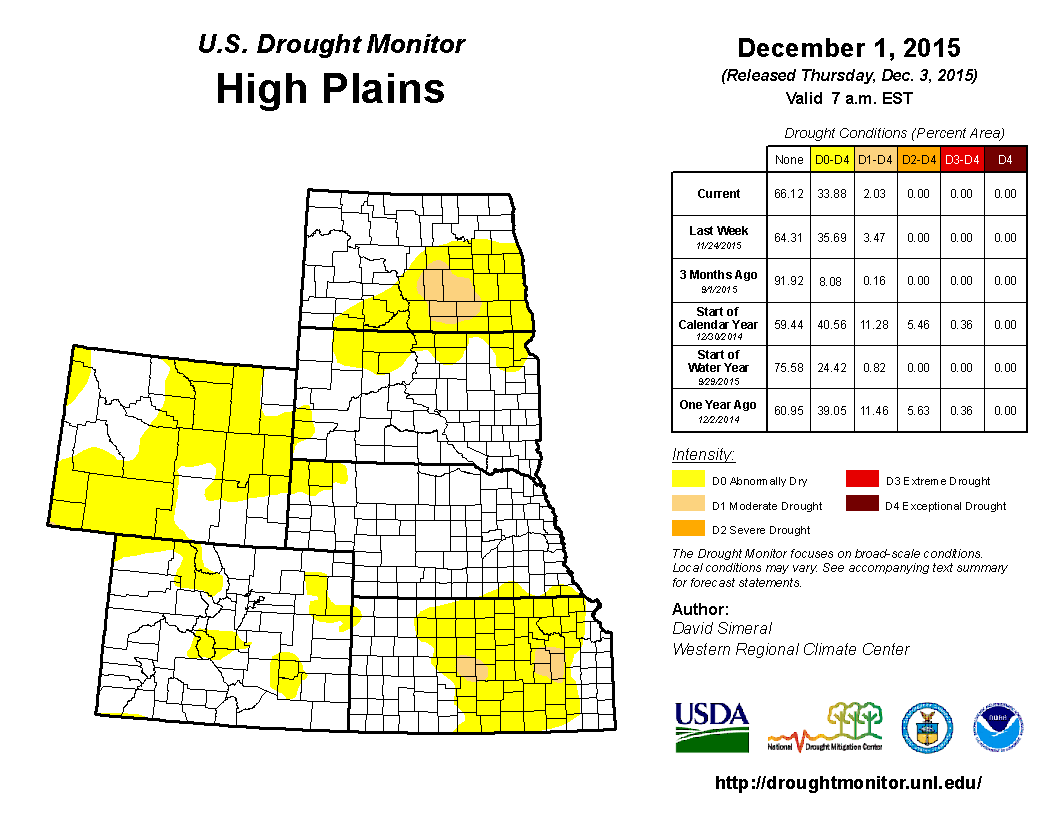
As described by the High Plains Regional Climate Center, the big story this month was, again, the extreme warmth for much of the High Plains region. The warmth this fall aided in crop dry down and harvesting activities and also led to many late hard freezes. There were both wet areas and dry areas this month across the High Plains region. Large areas picked up precipitation totals in excess of 150 percent of normal including Kansas, most of Nebraska, southeastern South Dakota, eastern North Dakota, west-central and southeastern Wyoming, and the eastern and western sides of Colorado. This did not translate into tremendous precipitation amounts because the region is entering the driest portion of the year, so these totals were not large enough to overcome some of the deficits that accumulated earlier in the fall in places like eastern Kansas. But, the precipitation that fell this month was able to help recharge soil moisture in some areas, like Nebraska, because the ground had not frozen just yet. There were some dry areas including northeastern Wyoming, northwestern South Dakota, and much of western and central North Dakota. These areas received, at best, 50 percent of normal precipitation.
There were only minor changes to the USDM over the past month. Although there were slight improvements and degradations in moderate drought conditions (D1) throughout the month, there was a net decline of about a half a percent. This is reflected in the total area in drought (D1-D4) of the region, which decreased just slightly from about 4 percent to just under 3.5 percent. Abnormally dry conditions (D0) dropped about 4 percent to 32 percent in coverage as well. Above normal rainfall helped eliminate some of the D0, which had emerged over the past couple of months including some areas of Nebraska, Kansas, and Colorado. On the drier end of the spectrum, an area stretching from northeastern Wyoming through northwestern South Dakota and into central North Dakota had precipitation totals that were less than 50 percent of normal. Luckily, as the region moves into the drier part of the year, this did not translate into large deficits. Some D0 expanded within this area because of ongoing dryness; however, no new drought conditions developed. Drought conditions could improve by the next climate summary because of heavy precipitation in the form of rain, freezing rain, and sleet during the last week of the month. November 24th was the cutoff date for the latest release of the USDM used in this regional report, so this precipitation will be reflected in the first release of December. Anywhere from 2.00-4.00 inches (51-102 mm) of liquid equivalent precipitation fell across eastern Kansas, so drought conditions could improve there.
A negative impact of the late freezes was a delay in the killing of insects; however, a positive impact was an extended growing season this fall for gardens, flowers, and trees. This allowed gardeners to continue to harvest herbs and vegetables, such as tomatoes and peppers, well into November. Flowers were also blooming until very late in the season. For instance, daylilies were spotted in the Lincoln, Nebraska area as late as November 15th. Trees also retained their leaves and stayed green until late in the season in many areas.
As explained by the Southern Regional Climate Center, November was a warm and extremely wet month for the Southern region, with the majority of stations averaging 150 to 200 percent of normal precipitation. For the entire Southern region, it was the fourth wettest November on record (1895-2015). Only a small portion of the region experienced a drier than normal month. This included a small handful of counties in southern Texas and in the western Texas panhandle. The heavy precipitation throughout the Southern region has led to the complete removal of drought conditions such that all 6 states are now drought-free. Only small pockets of abnormally dry conditions remain in parts of Texas and Oklahoma. In Texas, heavy rains were untimely for most farmers as it coincided with harvest time for farmers across the state. While crops were still able to be harvested, farmers saw a decrease in crop yield due to stagnant water on their crops, which can easily spread diseases. Some cotton farmers are expecting half of their estimated yields. However, some citrus farmers in southern Texas are enjoying a $5 increase in prices across all categories due to high off season rains. Although the rains did not necessarily help farmers, hunters will be pleased with it. Despite the record rain so far in 2015, the hunting season is expected to be one of the best in years, expected to have an economic impact greater than 2011's $3.65 billion. Population numbers for each animal are at a high point over the past few years (Information provided by the Texas Office of State Climatology).
As summarized by the Midwest Regional Climate Center, November temperatures were well above normal in the Midwest and precipitation was very heavy in the western half of the region but dropped below normal to the east. Temperatures were more than 5 degrees F (3 C) above normal for the region, ranking as the fifth warmest on record (1895-2015). The fall, combining the very warm September and November with the slightly above average October, also came in among the warmest on record. The seasonal departure for the Midwest was 4 degrees F (2 C) above normal, ranking it as the second warmest on record and the warmest in over 50 years. Fall precipitation was closer to normal in most of the Midwest with a few locations below 75 percent of normal and a few more with 125 percent of normal. Dry weather in September and October in Missouri offset the very wet conditions in November.
Drought eased in the region during November, particularly in the western half of the region. The November rains were cause for removing drought completely from Missouri, Kentucky, Iowa, Minnesota, and Wisconsin and nearly so in Illinois, where the only remaining drought was in the counties bordering Indiana in the southeast part of the state. Some remaining areas of drought persisted in Indiana and Michigan but the areal coverage of drought in the Midwest dropped from 16 percent of the region to less than 4 percent by the end of the month.
As noted by the Southeast Regional Climate Center, Precipitation was above normal across much of the Southeast region during November, with several extremes recorded during the month. Likewise, temperatures were above average across much of the Southeast region, with numerous extremes recorded. Mean temperatures were slightly above average in Puerto Rico and the U.S. Virgin Islands. The driest locations were found across portions of northern and central Florida, where monthly precipitation totals were between 25 and 50 percent of normal. Precipitation was highly variable across Puerto Rico and the U.S. Virgin Islands, with above-average (below-average) rainfall over northern and western (southern and eastern) portions of the region.
Drought conditions were completely ameliorated across the Southeast region (excluding Puerto Rico) during November. The percentage of the region under drought-free conditions (less than D1) increased from 98 percent on November 3rd to nearly 100 percent on December 1st. Beneficial rainfall during the month eliminated pockets of moderate (D1) drought across west-central Alabama, southern Georgia, and the Florida Panhandle. The extent of severe-to-extreme (D2 and D3) drought conditions across eastern Puerto Rico decreased about 9 percent during the month, reaching a coverage of 16 percent on December 1st. Unusually warm and wet conditions reduced the quality and delayed the harvest of numerous agricultural crops across the region. Premature sprouting (i.e. germination of the seed while still on the tree) was reported in many Georgia pecan orchards, and the harvest of cotton, peanuts, and soybeans across the Carolinas was poor due to saturated fields. Late in the month, windy conditions in Palm Beach County, FL twisted off the young seedlings of many vegetable plants, including tomatoes, peppers, and eggplant.
As explained by the Northeast Regional Climate Center, November 2015 was the warmest and 16th driest November on record for the region. The Northeast region received 2.15 inches (54.61 mm) of precipitation, which was 56 percent of normal. All states saw below-normal precipitation, ranging from 43 percent of normal in Connecticut to 95 percent of normal in Delaware. The month's warm conditions contributed to below-normal snowfall for most of the region. Autumn was also drier than normal. The November 5 USDM showed that 17 percent of the Northeast was abnormally dry, while another 6 percent of the region was experiencing moderate drought. With below-normal precipitation during the month, abnormally dry conditions increased in coverage slightly. By month's end, 22 percent of the region was abnormally dry while the area experiencing moderate drought remained at 6 percent.
As summarized by the Western Regional Climate Center, several low-pressure systems crossed the West this month bringing scattered areas of above normal precipitation and cooler than normal temperatures to the region. The first significant snowfalls of the season were observed in the Sierra Nevada, Cascades, and Rocky Mountains, allowing winter snowpack to begin accumulating. November was cooler than normal for most of the West. Precipitation was variable, with scattered areas receiving well above normal precipitation. Some areas were quite dry this month. Much of southwestern Oregon and northern California observed less than 75% of normal November precipitation. In far northern California, Montague received only 0.38 in (10 mm), 13% of normal, the second driest November since records began in 1948. Southern California and western Arizona also saw below normal precipitation; Los Angeles recorded only 0.01 in (less than 1 mm) for the month, 1.03 in (26 mm) below normal. Little or no November rainfall is not uncommon for this area; 23 other years in Los Angeles' 139-year record saw 0.01 in (less than 1 mm) or less.
The above normal temperatures observed in Hawaii over the past four months continued into November. Conditions were also wetter than normal across much of the state. To the north, conditions were also wetter and warmer than normal for much of Alaska. Some of the greatest departures from normal temperature were observed in the interior part of the state. The greatest precipitation anomalies were also seen in the Interior.
Pacific Islands: According to reports from National Weather Service offices, the Pacific ENSO Applications Climate Center (PEAC), and partners, conditions varied across the Pacific Islands.
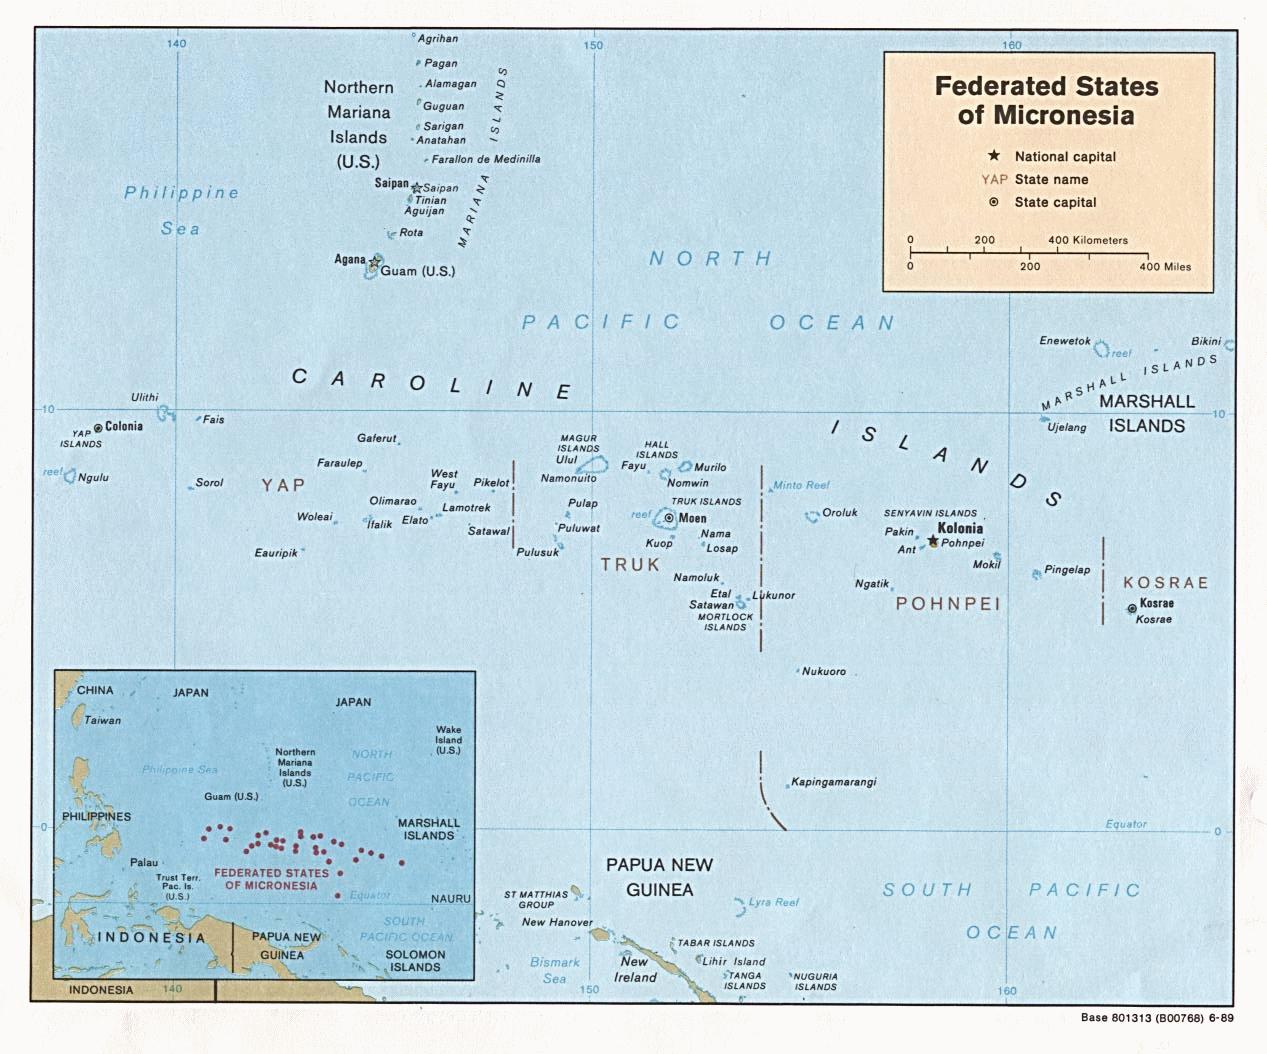
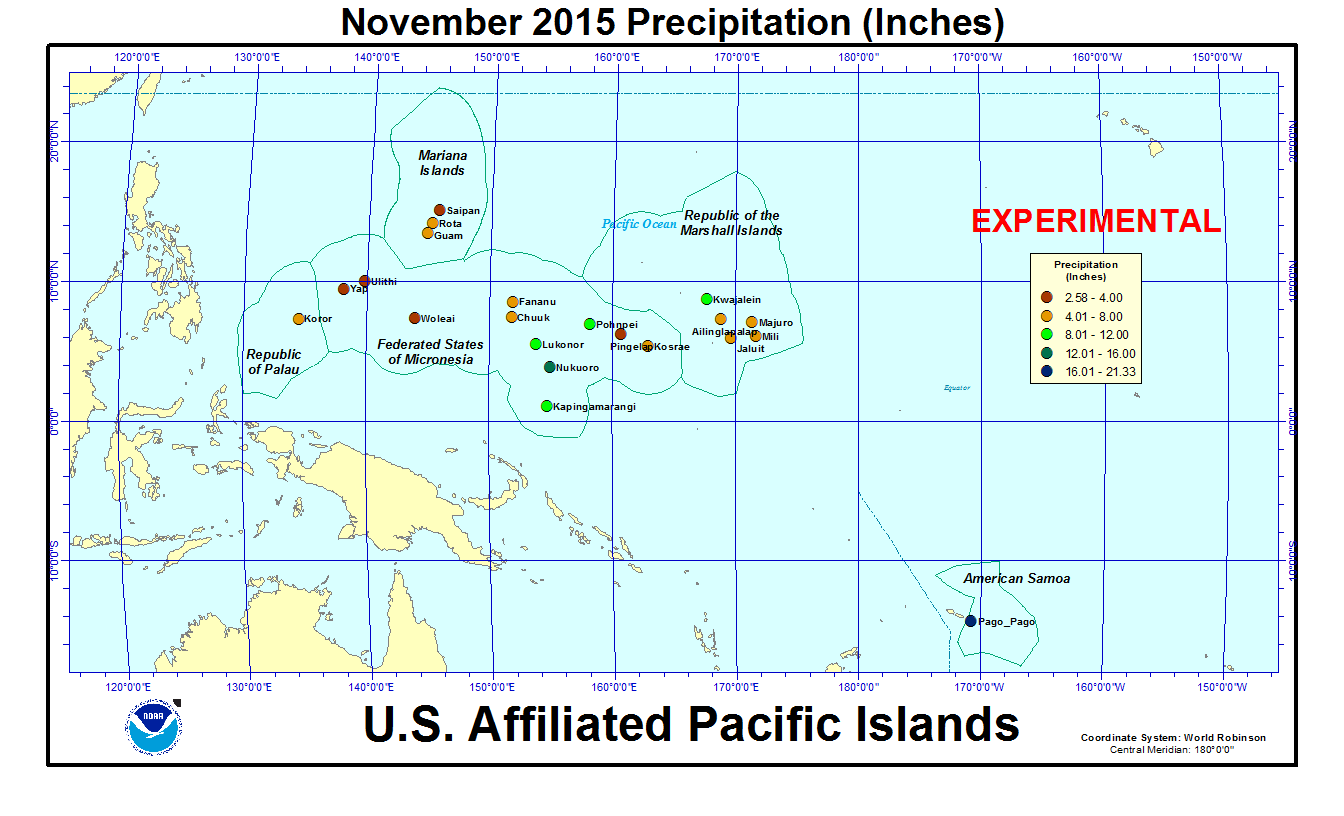
In the U.S. Affiliated Pacific Islands (maps — Micronesia, Marshall Islands, basinwide), November 2015 was wetter than normal at only Lukonor and Pago Pago, and drier than normal at the rest of the primary stations.
Rainfall amounts were below the minimum thresholds (4 or 8 inches) required to meet most monthly water needs at stations across the region. These included the primary stations of Saipan in the Mariana Islands; Koror in the Republic of Palau; Yap, Ulithi, Woleai, Fananu, Chuuk, Pingelap, and Kosrae in Micronesia; and Ailinglapalap, Jaluit, Majuro, and Mili in the Republic of the Marshall Islands. Jaluit recorded 4.35 inches, marking the tenth out of the last twelve months that have been drier than 8 inches. North Fanif reported 2.79 inches of rain, Maap 2.99 inches, Yap 3.31 inches, Dugor 3.33 inches, Tamil 3.78 inches, Kosrae 4.55 inches, Luweech 4.66 inches, Rumung 4.99 inches, and Fananu 5.27 inches (November marks the second consecutive dry month for these stations). Gilman reported 6.36 inches, the third consecutive month below 8 inches. The 4- and 8-inch thresholds are important because, if monthly precipitation falls below the threshold, then drought becomes a concern. Below-normal rainfall is expected to continue for many of these stations as the strong El Niño persists.
Kosrae began experiencing water shortages in October. Rain catchments on Chuuk were falling short, with water shortages developing and people resorting to buying water from water companies. Similar water catchment shortages are likely to spread across the smaller islands of Yap State.
Pago Pago measured 21.33 inches of rainfall during November. This is more than twice the November normal and is enough to overcome the deficits of the previous months.
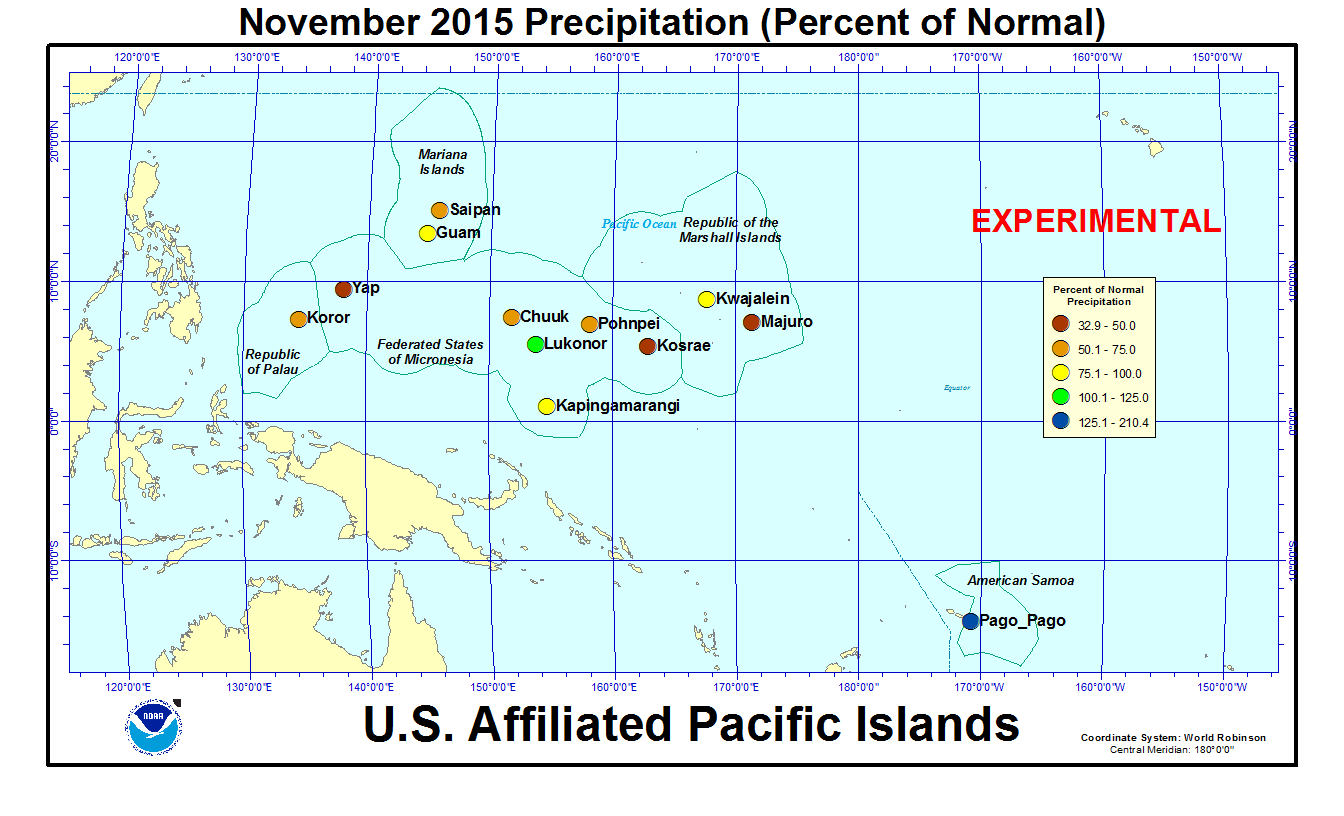
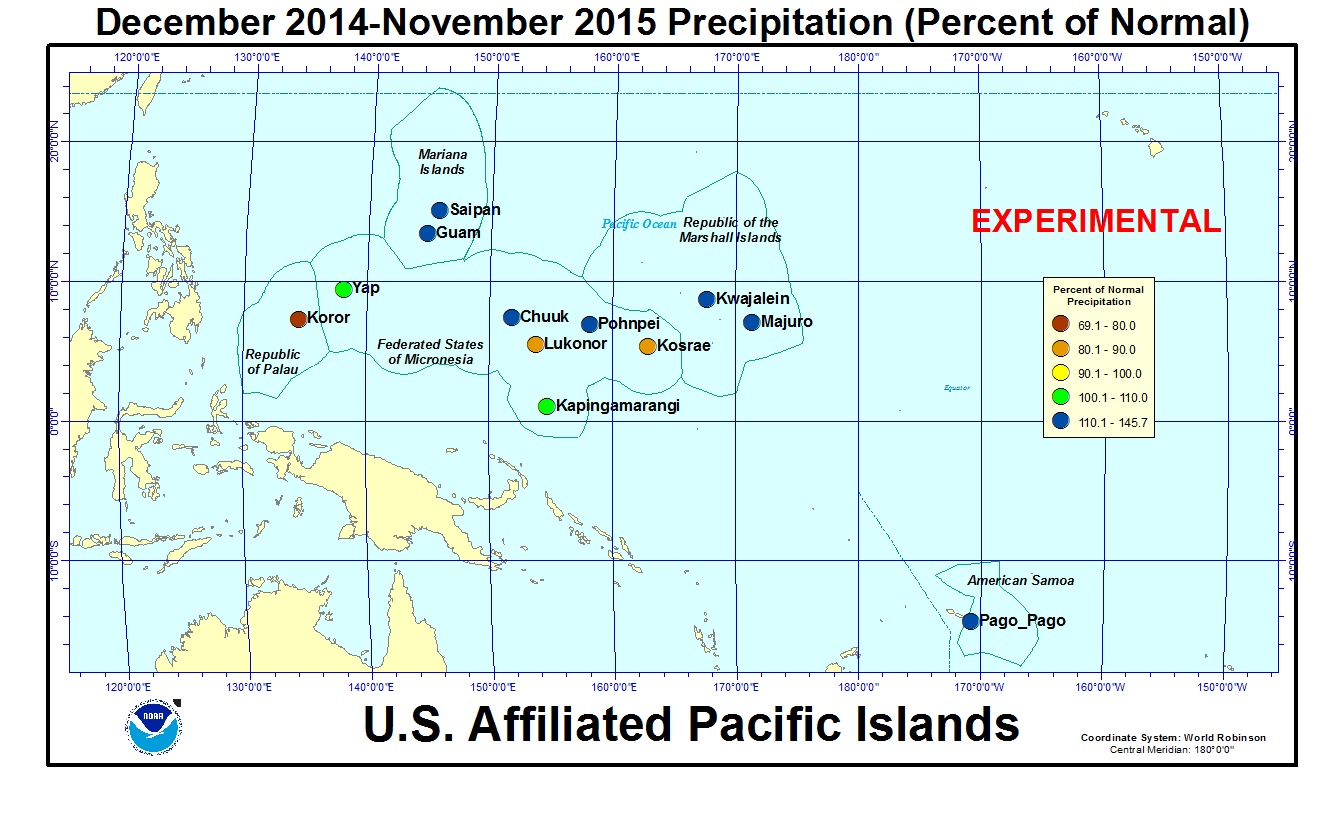
As measured by percent of normal precipitation, Koror and Kosrae have been drier than normal in the short term (November and the last 3 months [September-November 2015]) as well as the long term (year to date [January-November 2015] and last 12 months [December 2014-November 2015]). Pago Pago was wetter than normal at all time scales. Chuuk, Kapingamarangi, Majuro, and Pohnpei have been drier than normal in the short term but near to wetter than normal in the long term. Guam, Saipan, and Kwajalein were drier than normal for November but near to wetter than normal at the other three time scales. Lukonor was wetter than normal for November but drier than normal at the other three time scales. Yap was near normal for the 12-month period, but drier than normal at the other 3 time scales.
| Station Name | Dec 2014 | Jan 2015 | Feb 2015 | Mar 2015 | Apr 2015 | May 2015 | Jun 2015 | Jul 2015 | Aug 2015 | Sep 2015 | Oct 2015 | Nov 2015 | Dec- Nov |
|---|---|---|---|---|---|---|---|---|---|---|---|---|---|
| Chuuk | 57% | 142% | 134% | 209% | 104% | 89% | 172% | 54% | 155% | 188% | 53% | 70% | 112% |
| Guam NAS | 76% | 213% | 6% | 198% | 263% | 291% | 86% | 215% | 146% | 108% | 125% | 81% | 117% |
| Kapingamarangi | 116% | 229% | 131% | 62% | 87% | 173% | 161% | 54% | 162% | 112% | 63% | 89% | 104% |
| Koror | 118% | 64% | 83% | 69% | 74% | 33% | 107% | 27% | 73% | 143% | 53% | 69% | 69% |
| Kosrae | 86% | 116% | 114% | 91% | 92% | 84% | 143% | 108% | 138% | 115% | 63% | 33% | 83% |
| Kwajalein | 68% | 74% | 149% | 994% | 322% | 204% | 117% | 104% | 171% | 95% | 105% | 88% | 146% |
| Lukonor | 86% | 228% | 97% | 99% | 83% | 89% | 136% | 77% | 75% | 149% | 40% | 123% | 90% |
| Majuro | 67% | 106% | 63% | 329% | 162% | 171% | 57% | 87% | 207% | 96% | 83% | 40% | 113% |
| Pago Pago | 141% | 201% | 102% | 64% | 153% | 172% | 170% | 72% | 125% | 18% | 88% | 210% | 116% |
| Pohnpei | 104% | 78% | 100% | 138% | 119% | 219% | 108% | 138% | 199% | 124% | 78% | 67% | 122% |
| Saipan | 47% | 184% | 14% | 315% | 203% | 341% | 115% | 112% | 141% | 92% | 198% | 64% | 132% |
| Yap | 197% | 92% | 89% | 93% | 139% | 235% | 92% | 82% | 148% | 68% | 43% | 37% | 101% |
| Station Name | Dec 2014 | Jan 2015 | Feb 2015 | Mar 2015 | Apr 2015 | May 2015 | Jun 2015 | Jul 2015 | Aug 2015 | Sep 2015 | Oct 2015 | Nov 2015 | Dec- Nov |
|---|---|---|---|---|---|---|---|---|---|---|---|---|---|
| Chuuk | 6.46" | 14.32" | 9.68" | 17.37" | 13.03" | 10.08" | 20.03" | 6.45" | 19.91" | 22.07" | 6.09" | 7.46" | 152.95" |
| Guam NAS | 3.87" | 8.56" | 0.18" | 4.09" | 6.65" | 9.91" | 5.32" | 21.80" | 21.54" | 13.71" | 14.26" | 5.96" | 115.85" |
| Kapingamarangi | 11.37" | 20.91" | 12.19" | 7.05" | 11.82" | 20.84" | 22.14" | 7.71" | 13.14" | 11.08" | 5.13" | 8.28" | 151.66" |
| Koror | 13.14" | 6.48" | 7.07" | 5.11" | 5.42" | 3.96" | 18.66" | 4.98" | 9.90" | 16.88" | 6.24" | 7.86" | 105.7" |
| Kosrae | 13.80" | 19.28" | 14.73" | 14.57" | 16.12" | 14.89" | 20.90" | 16.17" | 19.69" | 16.36" | 6.90" | 4.55" | 177.96" |
| Kwajalein | 4.54" | 2.33" | 3.94" | 23.37" | 16.94" | 13.69" | 8.12" | 10.28" | 16.63" | 10.24" | 11.71" | 9.98" | 131.77" |
| Lukonor | 9.65" | 19.16" | 8.70" | 9.16" | 9.36" | 10.36" | 15.83" | 12.22" | 10.55" | 15.15" | 4.53" | 11.18" | 135.85" |
| Majuro | 7.68" | 8.24" | 4.32" | 21.65" | 15.23" | 17.27" | 6.31" | 9.72" | 24.24" | 10.72" | 10.52" | 5.33" | 141.23" |
| Pago Pago | 18.13" | 26.87" | 12.22" | 6.88" | 14.35" | 16.59" | 9.07" | 3.99" | 6.75" | 1.20" | 8.15" | 21.33" | 145.53" |
| Pohnpei | 16.67" | 10.24" | 9.58" | 18.14" | 21.94" | 43.68" | 16.03" | 21.31" | 28.33" | 15.59" | 11.86" | 9.95" | 223.32" |
| Saipan | 1.80" | 4.66" | 0.35" | 5.95" | 5.34" | 8.11" | 4.15" | 10.00" | 18.51" | 9.26" | 21.00" | 3.61" | 92.74" |
| Yap | 16.77" | 5.86" | 4.60" | 4.22" | 7.80" | 18.41" | 11.07" | 12.39" | 21.99" | 9.21" | 5.29" | 3.31" | 120.92" |
| Station Name | Dec 2014 | Jan 2015 | Feb 2015 | Mar 2015 | Apr 2015 | May 2015 | Jun 2015 | Jul 2015 | Aug 2015 | Sep 2015 | Oct 2015 | Nov 2015 | Dec- Nov |
|---|---|---|---|---|---|---|---|---|---|---|---|---|---|
| Chuuk | 11.25" | 10.10" | 7.25" | 8.32" | 12.47" | 11.30" | 11.66" | 11.98" | 12.86" | 11.71" | 11.51" | 10.61" | 136.77" |
| Guam NAS | 5.11" | 4.01" | 3.03" | 2.07" | 2.53" | 3.40" | 6.18" | 10.14" | 14.74" | 12.66" | 11.44" | 7.38" | 99.09" |
| Kapingamarangi | 9.84" | 9.15" | 9.27" | 11.43" | 13.64" | 12.08" | 13.78" | 14.15" | 8.13" | 9.93" | 8.19" | 9.27" | 145.85" |
| Koror | 11.16" | 10.18" | 8.56" | 7.44" | 7.32" | 11.83" | 17.48" | 18.53" | 13.50" | 11.77" | 11.84" | 11.39" | 152.90" |
| Kosrae | 16.11" | 16.67" | 12.93" | 16.06" | 17.51" | 17.75" | 14.64" | 14.91" | 14.22" | 14.22" | 10.94" | 13.83" | 213.87" |
| Kwajalein | 6.66" | 3.16" | 2.64" | 2.35" | 5.26" | 6.72" | 6.93" | 9.87" | 9.74" | 10.74" | 11.18" | 11.28" | 90.41" |
| Lukonor | 11.27" | 8.41" | 8.93" | 9.26" | 11.31" | 11.69" | 11.65" | 15.93" | 14.04" | 10.15" | 11.32" | 9.08" | 151.36" |
| Majuro | 11.39" | 7.74" | 6.88" | 6.58" | 9.42" | 10.11" | 11.01" | 11.17" | 11.69" | 11.17" | 12.73" | 13.44" | 125.25" |
| Pago Pago | 12.84" | 13.34" | 12.00" | 10.68" | 9.39" | 9.66" | 5.33" | 5.55" | 5.38" | 6.53" | 9.26" | 10.14" | 125.57" |
| Pohnpei | 16.08" | 13.18" | 9.55" | 13.17" | 18.41" | 19.96" | 14.81" | 15.43" | 14.26" | 12.55" | 15.27" | 14.83" | 182.36" |
| Saipan | 3.85" | 2.53" | 2.59" | 1.89" | 2.63" | 2.38" | 3.62" | 8.91" | 13.13" | 10.09" | 10.62" | 5.61" | 70.25" |
| Yap | 8.51" | 6.39" | 5.19" | 4.56" | 5.63" | 7.85" | 12.04" | 15.08" | 14.82" | 13.50" | 12.18" | 8.83" | 120.31" |


[top]
State/Regional/National Moisture Status
A detailed review of drought and moisture conditions is available for all contiguous U.S. states, the nine standard regions, and the nation (contiguous U.S.):
| northeast u. s. | east north central u. s. | central u. s. |
| southeast u. s. | west north central u. s. | south u. s. |
| southwest u. s. | northwest u. s. | west u. s. |
| Contiguous United States |
[top]
Contacts & Questions