
Our cloudiness map is here to improve your experience

Spring is on its way and “springing into action” means more than just the seasonal cleaning spree. You can also use your time to see one of the best outdoor events of the year—the total solar eclipse! We know, we know, the lyrics from ‘total eclipse of the heart’ also spring to mind, but in order to see this spectacular event, climate conditions need to be just right so that everything aligns within your view. Luckily, we have a U.S. Climate Normals-based interactive map to help you out.
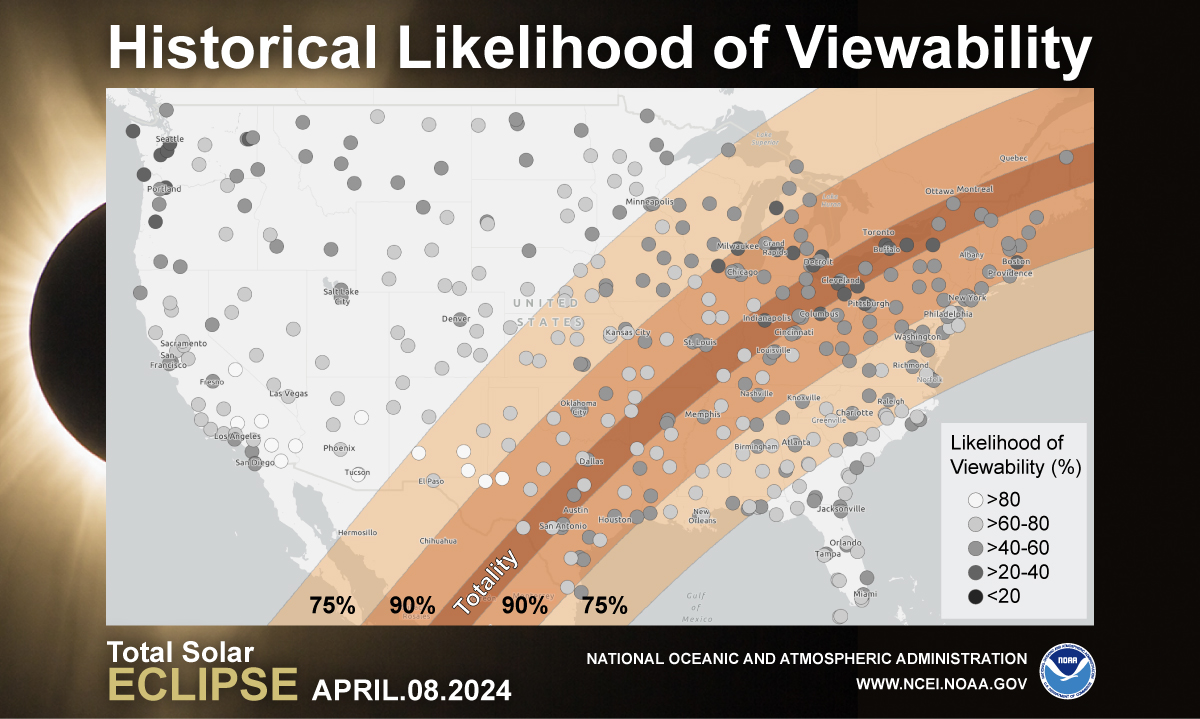
NOAA’s National Centers for Environmental Information (NCEI) can’t take all of the credit though. We’re proud to have reviewed past cloud conditions with scientists from the North Carolina Institute for Climate Studies (NCICS) to create an interactive map for the April 8, 2024 total eclipse!
The interactive map shows the average heat index, temperature, dewpoint, wind chill, and obscuration levels across the contiguous U.S.—these values may be useful for finding the best spot in your region for viewing the total eclipse.
You deserve to see the solar eclipse event and everything that entails—don’t forget to watch the shadows of leaf patterns change as the eclipse occurs. Click through the “April 2024 Total Solar Eclipse'' map and as the event approaches, see the local weather forecast from NOAA’s National Weather Service (NWS) to help you find the best spot.
Decadal Updates For NCEI’s U.S. Climate Normals
Once a decade, NCEI generates the official U.S. Climate Normals to meet our user community needs. These requirements are also fulfilled at the request of the World Meteorological Organization (WMO) and NWS. The U.S. Climate Normals are intended to be ideal for anyone’s climate needs—from checking the average temperature for planning an outdoor wedding to deciding when to sow seeds for crops.
Singing Praises
The most recent U.S. Climate Normals cover a three-decade period (1991–2020) and supplemental 15-year (2006–2020) time periods in the Data Access Tool. The U.S. Climate Normals continue to provide a diverse range of data products and uses, which enable us to create informative maps, among other products.
The U.S. Climate Normals include important hourly information on the average cloud cover, temperature, dewpoint, heat index, and hourly wind chill conditions. These factors were all included in the interactive map to demonstrate a diverse range of conditions and to allow eclipse seekers to make an informed decision.
Sourcing Eclipse Data
NASA’s not only known for their nifty spacesuits—their 2024 Total Solar Eclipse page also provided us with critical information: the timing and duration of the solar eclipse, along with the path of totality and obscuration levels (i.e., the percent of the sun obscured by the moon).
From there, data were extracted from each of NCEI’s hourly climate stations and combined with NCEI's climate information—all of which was used to determine the average weather conditions and typical cloudiness during the total eclipse at each climate station.
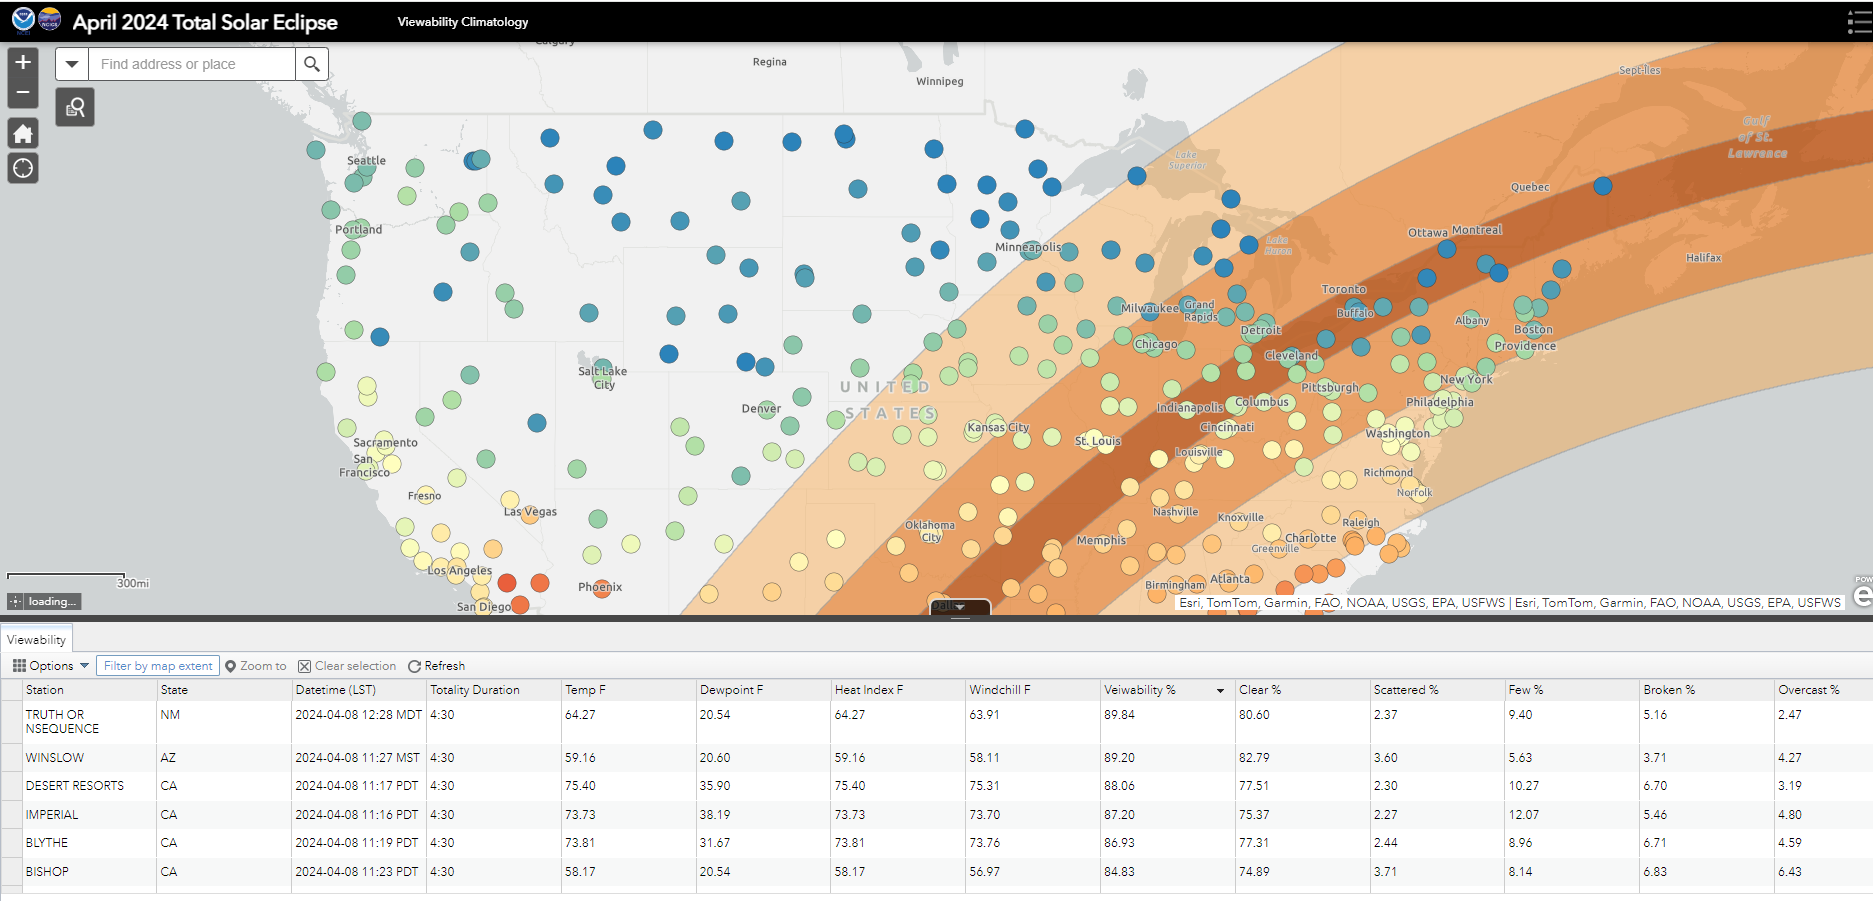
Navigating the Interactive Map
For more information on viewability factors, be sure to click the black arrow at the bottom of our interactive map. There you’ll find the attribute table which will provide more detailed information about the climate at your chosen location—such as the time of the eclipse in Mountain Daylight Time, viewability, and the type of cloud coverage in the area on that day—based on historical averages.
Thinking of Skipping the Total Eclipse in April?
Here are reasons not to miss this decade’s biggest solar event in the contiguous U.S.:
- The next total solar eclipse won’t occur until March 2033 and will only be viewable in Alaska.
- The following total solar eclipse won’t occur until August 2044 and will only be viewable in Montana and North Dakota.
- Following the April 2024 event, the next real opportunity for many in the U.S. to see a solar eclipse won’t be until August 2045—when the eclipse will traverse the contiguous U.S. from Florida to California.
Unless you want to age 20+ years before you see the next big event, pack your spring attire and protective eyewear and gauge the best spot on our interactive map to view the total eclipse in April 2024.
Next on the Horizon
See our next NCEI total solar eclipse story in spring 2024—we’ll provide more info about the eclipse as well as expanded information about average climate conditions before the moon crosses between the Earth and the Sun.


